

Role of MRI in the Diagnosis of Ductal Carcinoma In Situ: A Retrospective Study

 , , ,
, , , 
Abstract
1. Introduction
- To evaluate the main imaging features of DCIS;
- To compare mammography, US, and MRI findings, as well as the size of DCIS, with histopathological findings and size;
- To investigate the enhancement of DCIS with MRI regardless of histological grade and its relationship with kinetic parameters;
- To assess the usefulness of preoperative MRI in diagnosing DCIS.
2. Materials and Methods
2.1. Study Design
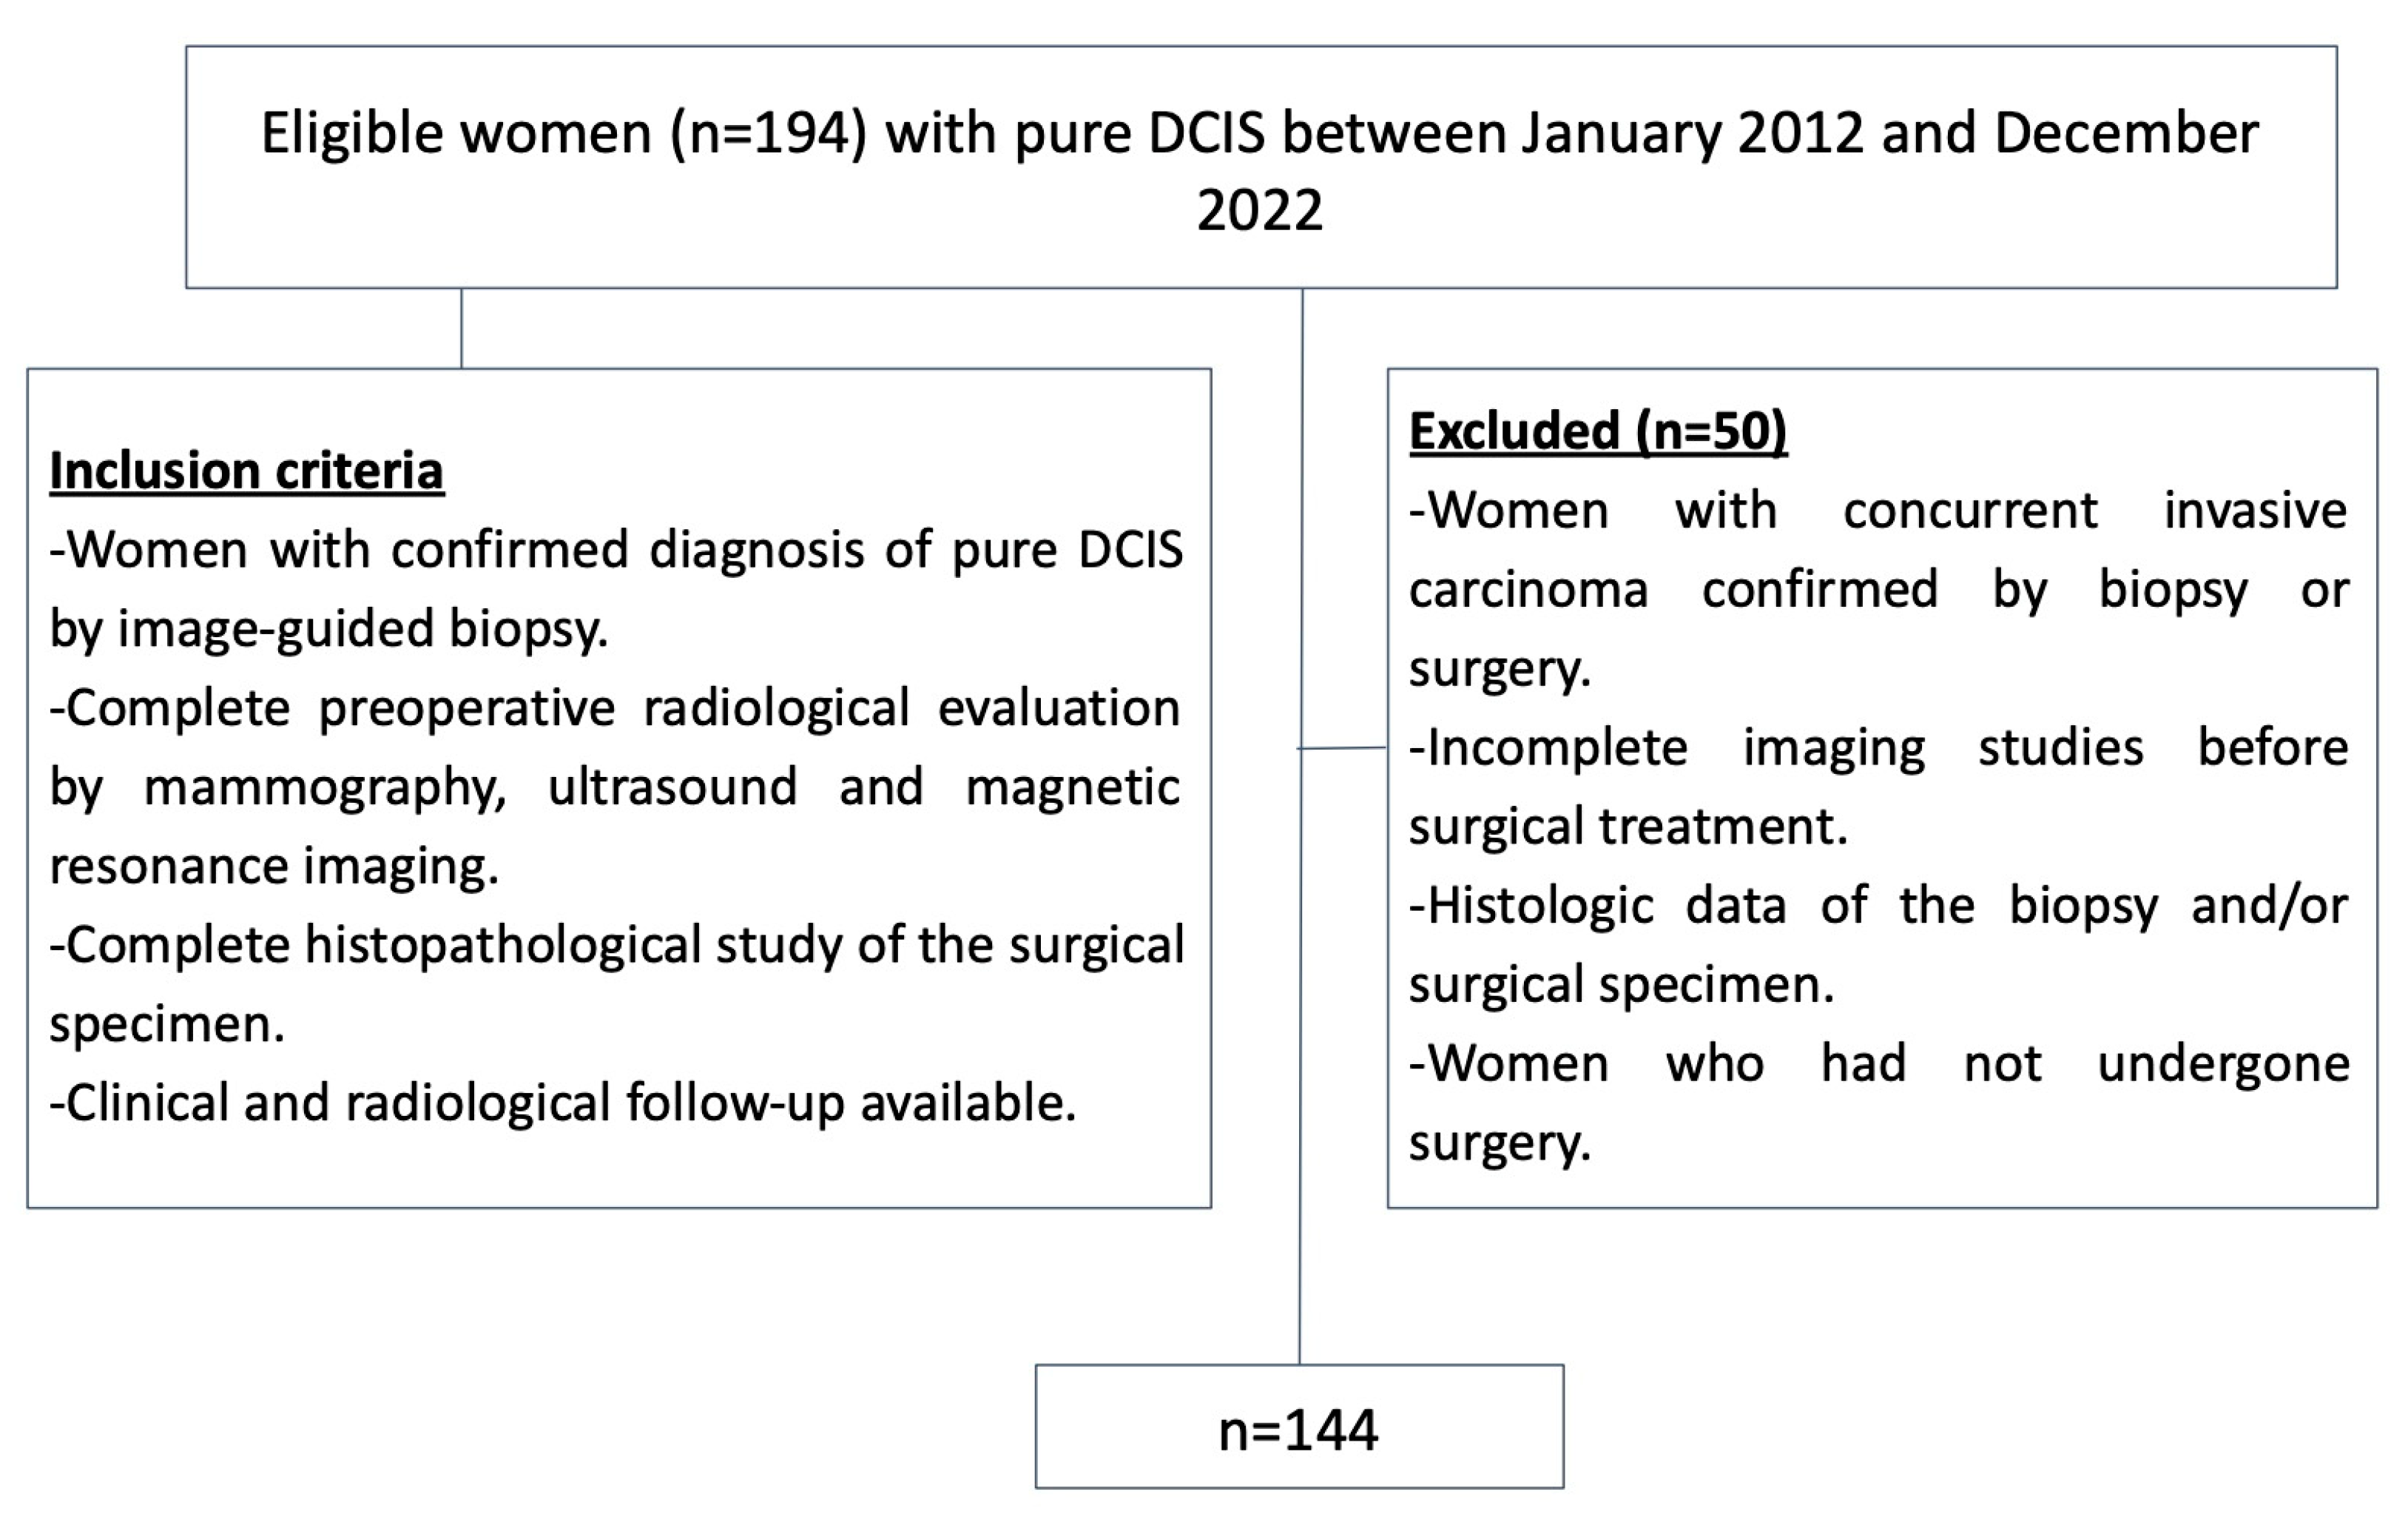
2.2. Study Sample
- Women with a confirmed diagnosis of pure DCIS via image-guided biopsy;
- A complete preoperative radiological evaluation including mammography, US, and MRI;
- A complete histopathological study for the surgical specimen;
- The availability of clinical and radiological follow-up.
- Women with concurrent invasive carcinoma confirmed by a biopsy. Patients with concurrent invasive carcinoma were excluded, as pure DCIS is defined as a pre-invasive form of breast cancer. Any evidence of infiltration or invasion disqualifies the diagnosis of pure DCIS. These restrictions were implemented to reduce bias and ensure that the study findings accurately reflect the characteristics of pure DCIS, without the influence of invasive disease;
- Incomplete preoperative imaging studies;
- Incomplete histologic data from the biopsy and/or surgical specimen;
- Women who did not undergo surgery.
2.3. Imaging Techniques and Procedures
- Full-field digital mammography
- Breast US
- Breast MRI
- ○
- Precontrast Imaging. Before the dynamic contrast-enhanced series, the following sequences were used:
- -
- Axial fast spin-echo T2-weighted (TR/TE, 3800/81; matrix, 384 × 384; flip angle, 10°; slice thickness, 3 mm);
- -
- Fat-saturated T1-weighted;
- -
- Echo planar diffusion with fat saturation;
- -
- SPAIR with 3 values of B: 50, 400, and 800. Automatically generates the ADC (TR/TE, 5700/82; matrix, 86 × 172; flip angle, 10°; slice thickness, 4.5 mm).
- ○
- Contrast-enhanced Imaging
- ○
- Nonionic paramagnetic contrast material with extracellular distribution, known as Gadoteridol (ProHance of 279.3 mg/mL, 500 mM) was used intravenously. The holder of authorization is Bracco International B.V., and its registration number is 60.377;
- ○
- At our institution, contrast enhancement was achieved by injecting a standardized dose of ProHance at a rate of 2 mL/s 0.2 mmol/kg followed by a 20–30-mL saline flush injected at the same rate; the contrast material was administered in 5 mL increments based on patient weight, ensuring that each patient received at least a single dose but not more than a double dose (median, 20 mL).
- ○
- Axial three-dimensional (3D) fat-suppressed, T1-weighted sequence VIBE spoiled gradient-echo T1- T1-weighted sequence was used for both precontrast and dynamic postcontrast imaging. The pre-and postcontrast sequence was configured as a single multiphase acquisition with a temporal resolution of 1 min 15 s per phase. The first (precontrast) phase served as a subtraction mask, followed by a pause to check the images and initiate the contrast material injection. The examination included one precontrast and five postcontrast images (TR/TE, 6.2/2.9; matrix, 225 × 320; flip angle, 10°; slice thickness, 1.1 mm);
- ○
- Following the dynamic series, a sagittal Flash-3D fat-suppressed gradient-echo T1-weighted sequence with the body coil was performed through both breasts (TR/TE, 5.5/2.4; matrix, 256 × 288; flip angle, 10°; slice thickness, 1.4 mm).
- Percutaneous biopsy
- ○
- US guided CNB: Method of choice when the lesion is best visualized with US;
- ○
- Stereotactic VAB: Method of choice when the lesion is best visualized with mammography, such as microcalcifications (most common), architectural distortion, asymmetry, or mass without a sonographic correlate.
- Histopathological study
2.4. Imaging Evaluation
- Multiple readings: Each image was initially reviewed individually by the three radiologists, who were blinded to each other’s assessments. A subsequent group discussion was held to analyze the observed differences and reach a consensus. This approach ensures that the measurements reflect a collective interpretation based on the combined experience of the specialists;
- Consensus process moderator: During the discussions, one radiologist acted as the moderator, structuring the consensus process, and ensuring that all opinions were considered. The moderator facilitated the resolution of discrepancies and ensured that the final decisions were made fairly and objectively;
- Standardized protocol: Assessments followed a predefined protocol based on the American College of Radiology BI-RADS guidelines [12]. This protocol included the following:
- ○
- Specific criteria for measuring the largest diameter of lesions;
- ○
- Standardized assessment of the morphological and kinetic characteristics of images;
- ○
- A systematic review of images across all modalities (mammography, US, and MRI).
- Resolution of discrepancies: In case of discrepancies between radiologists, the findings were discussed until a consensus was reached. If a unanimous decision could not be made, the final determination was based on a simple majority among the three radiologists;
- Recording of consensus: The final consensual measurements were recorded in a single database and used for statistical analysis. This ensures that the data reflect a unified standard agreed upon by the specialists.
2.5. Data Collection and Statistical Analysis
- Sample size calculation
3. Results
3.1. Patient Characteristics
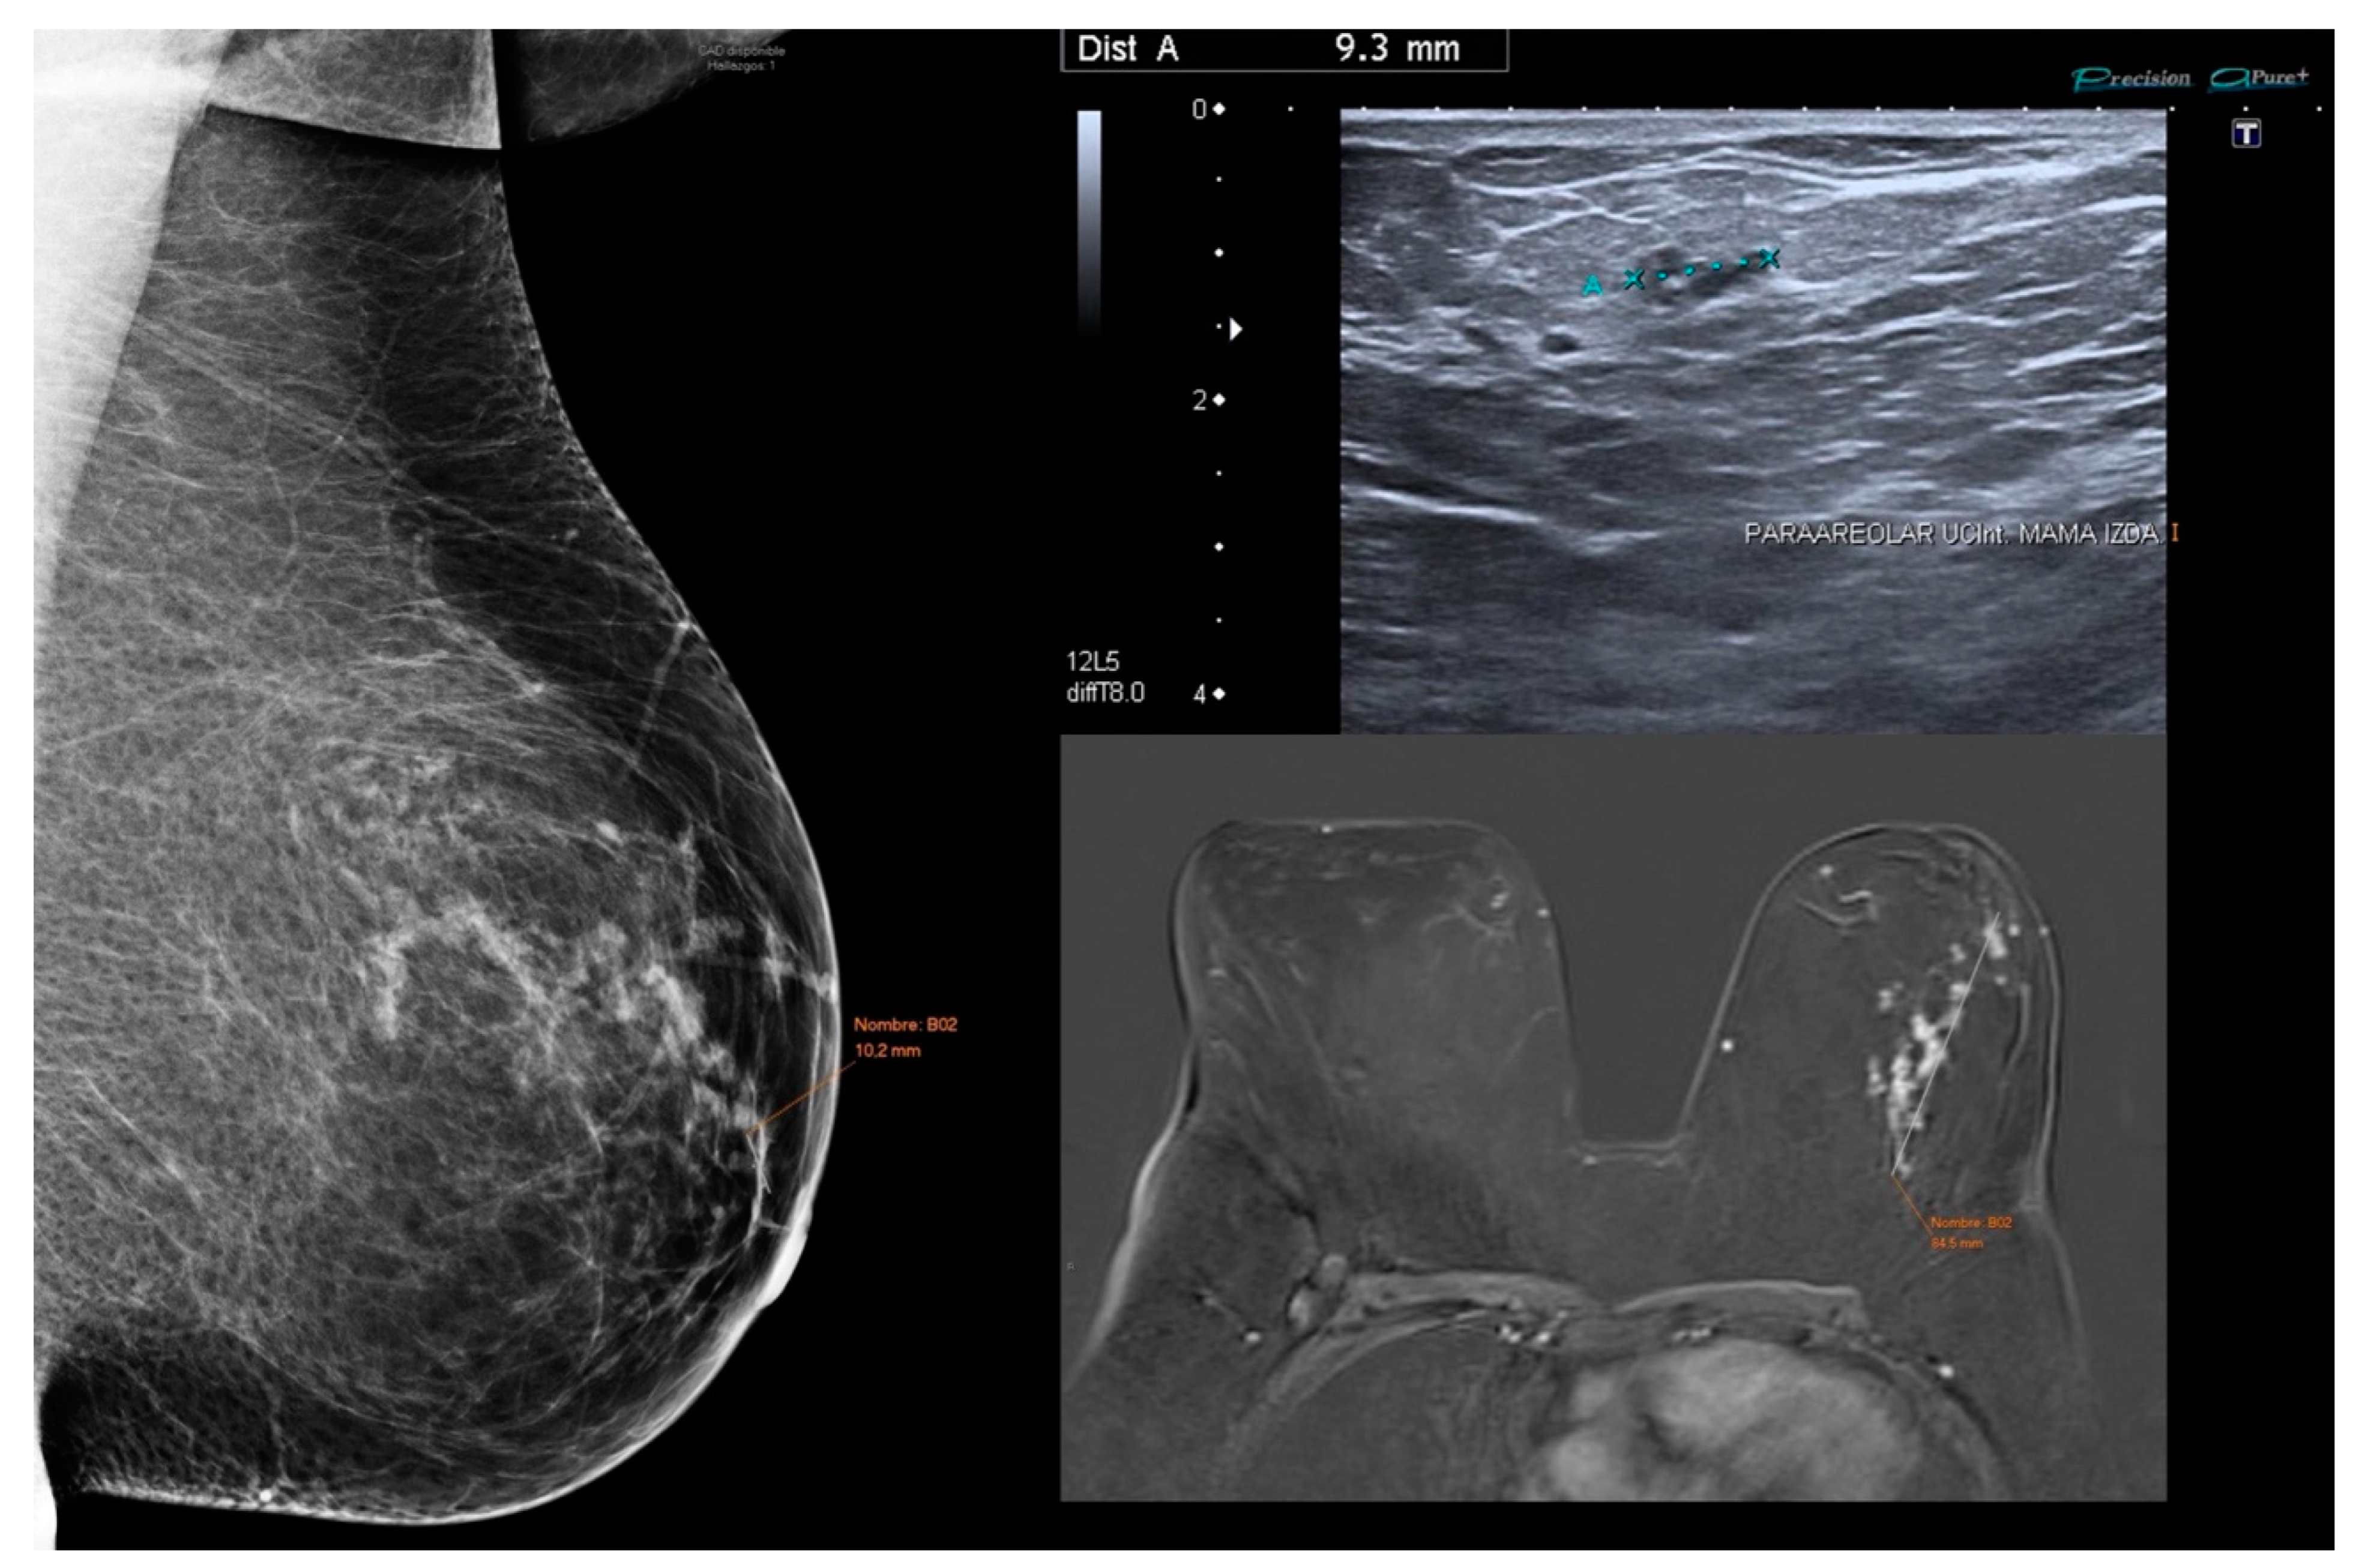
3.2. Mammographic Features
3.3. US Features
3.4. MRI Features
3.5. Histological Diagnosis
3.6. Radiologic–Histopathologic Correlation
3.7. Lin’s Coefficient of Concordance and Its 95% Confidence Intervals
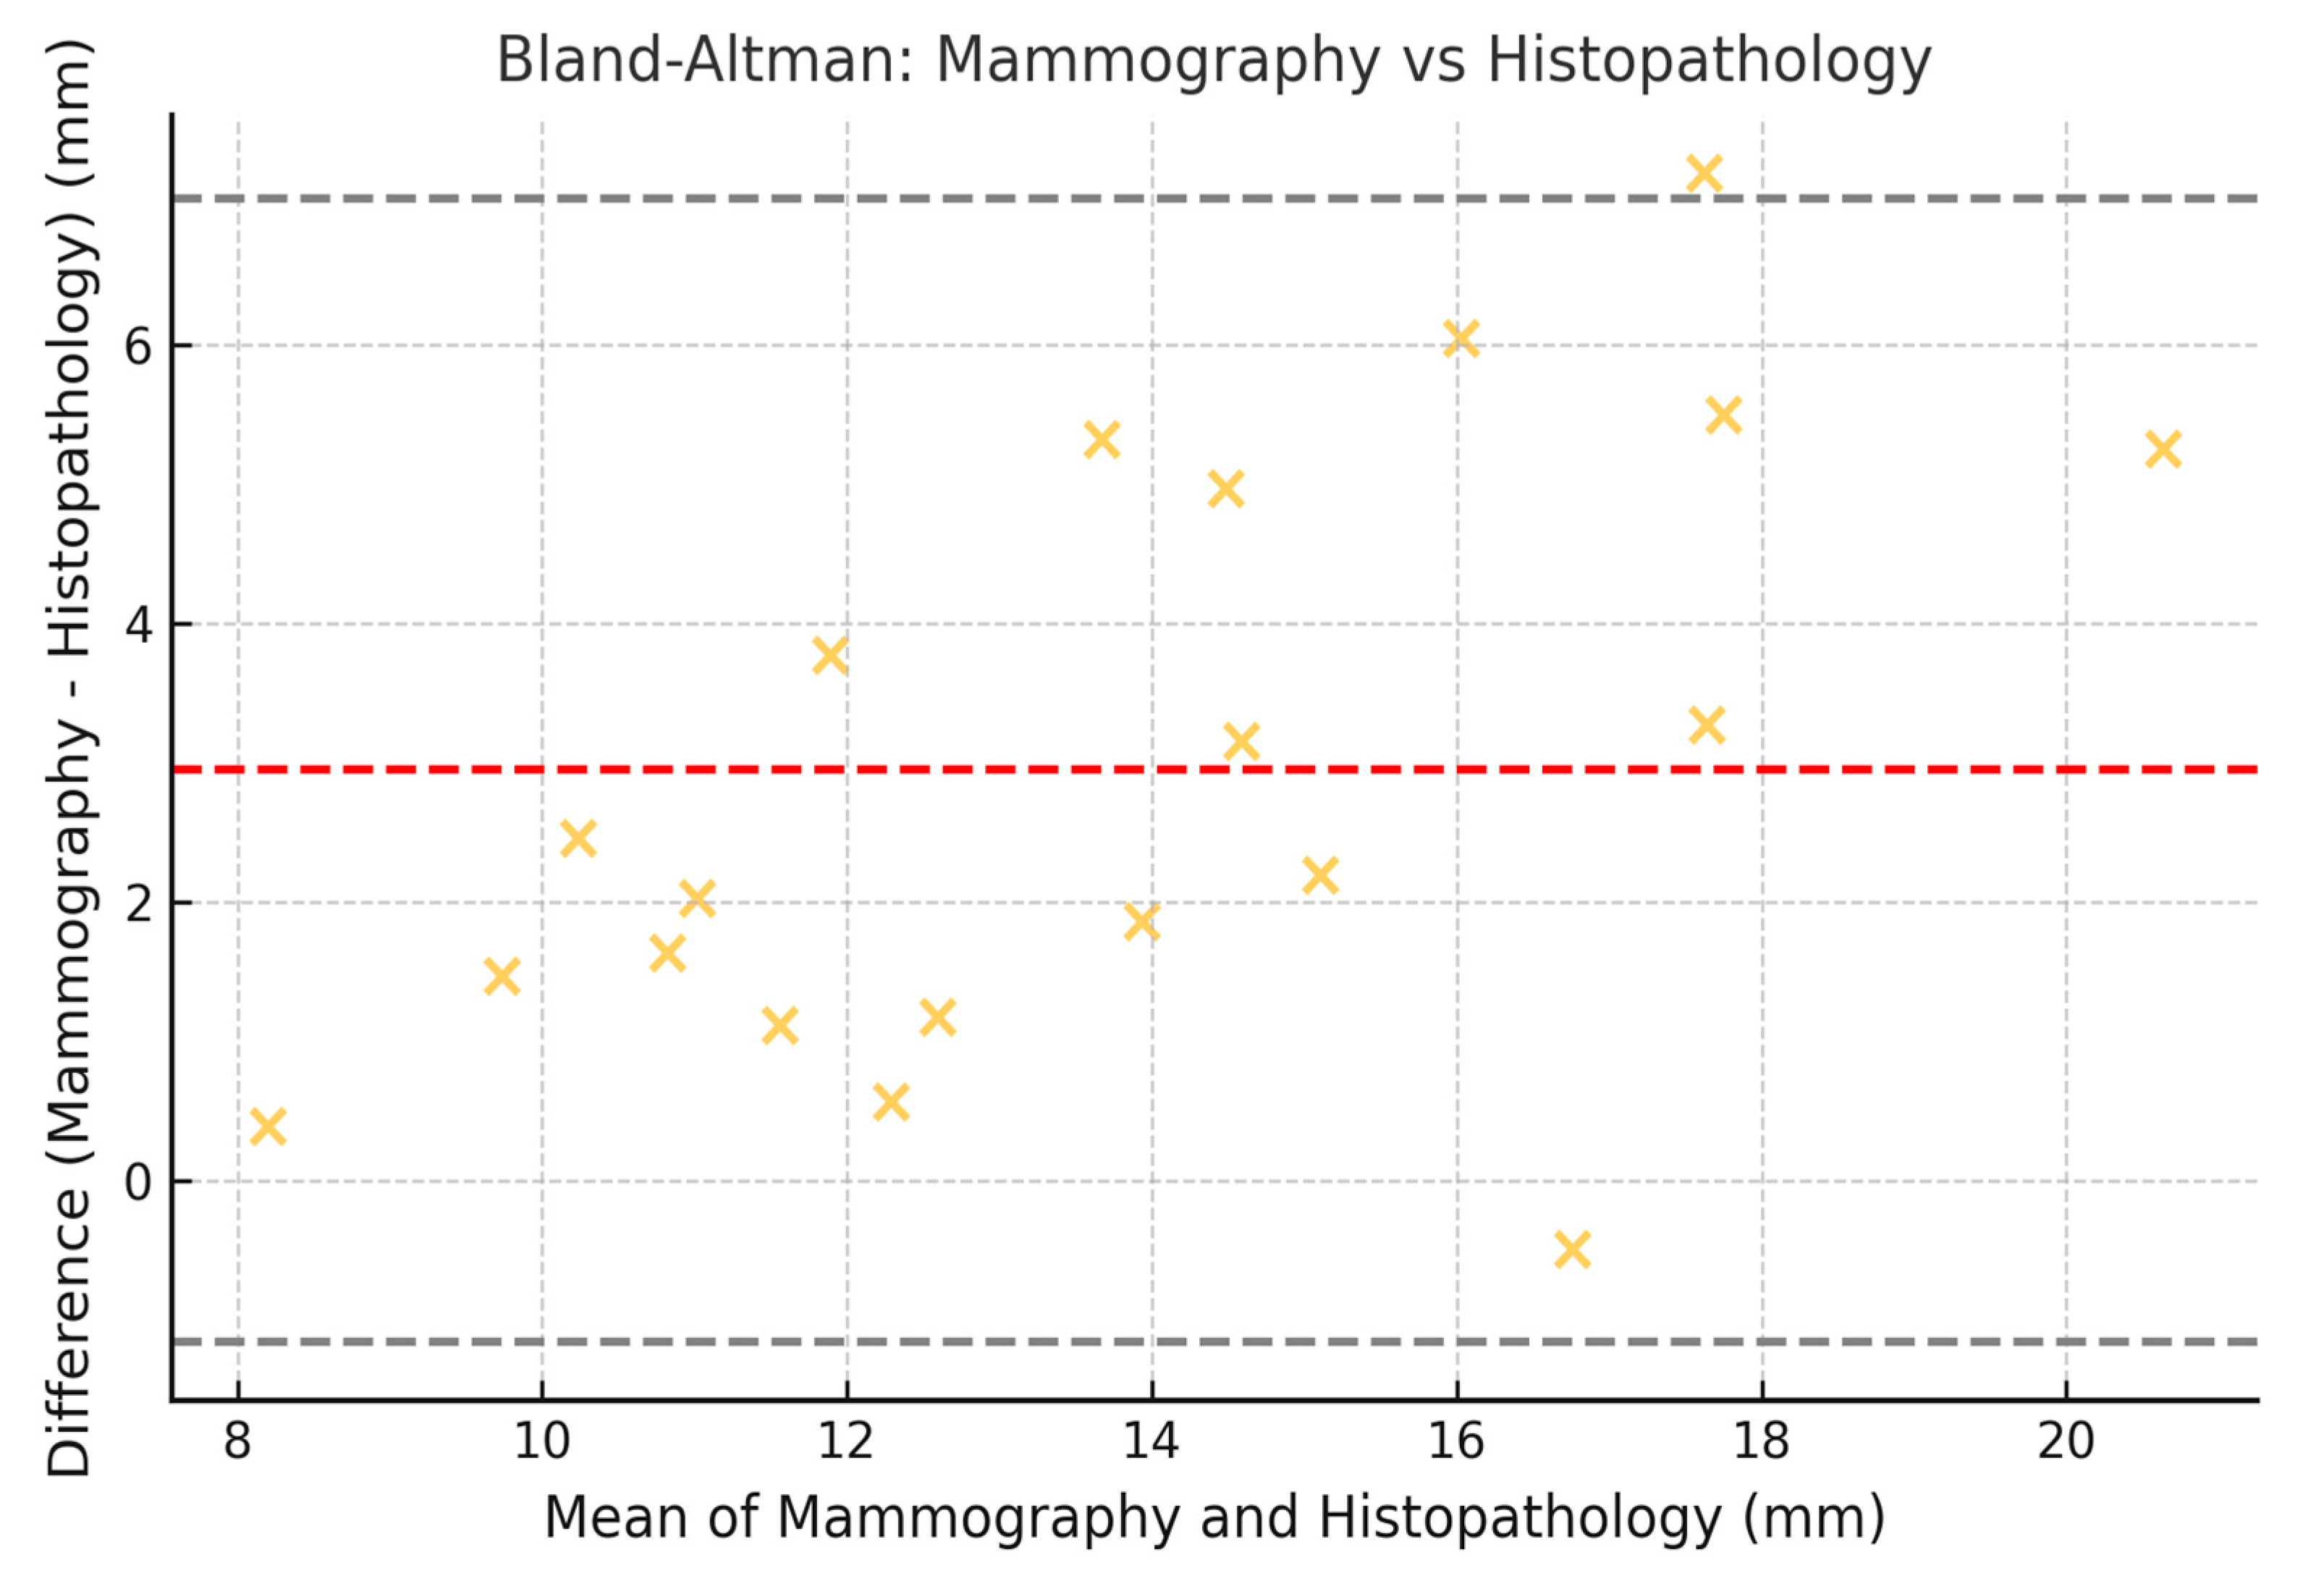
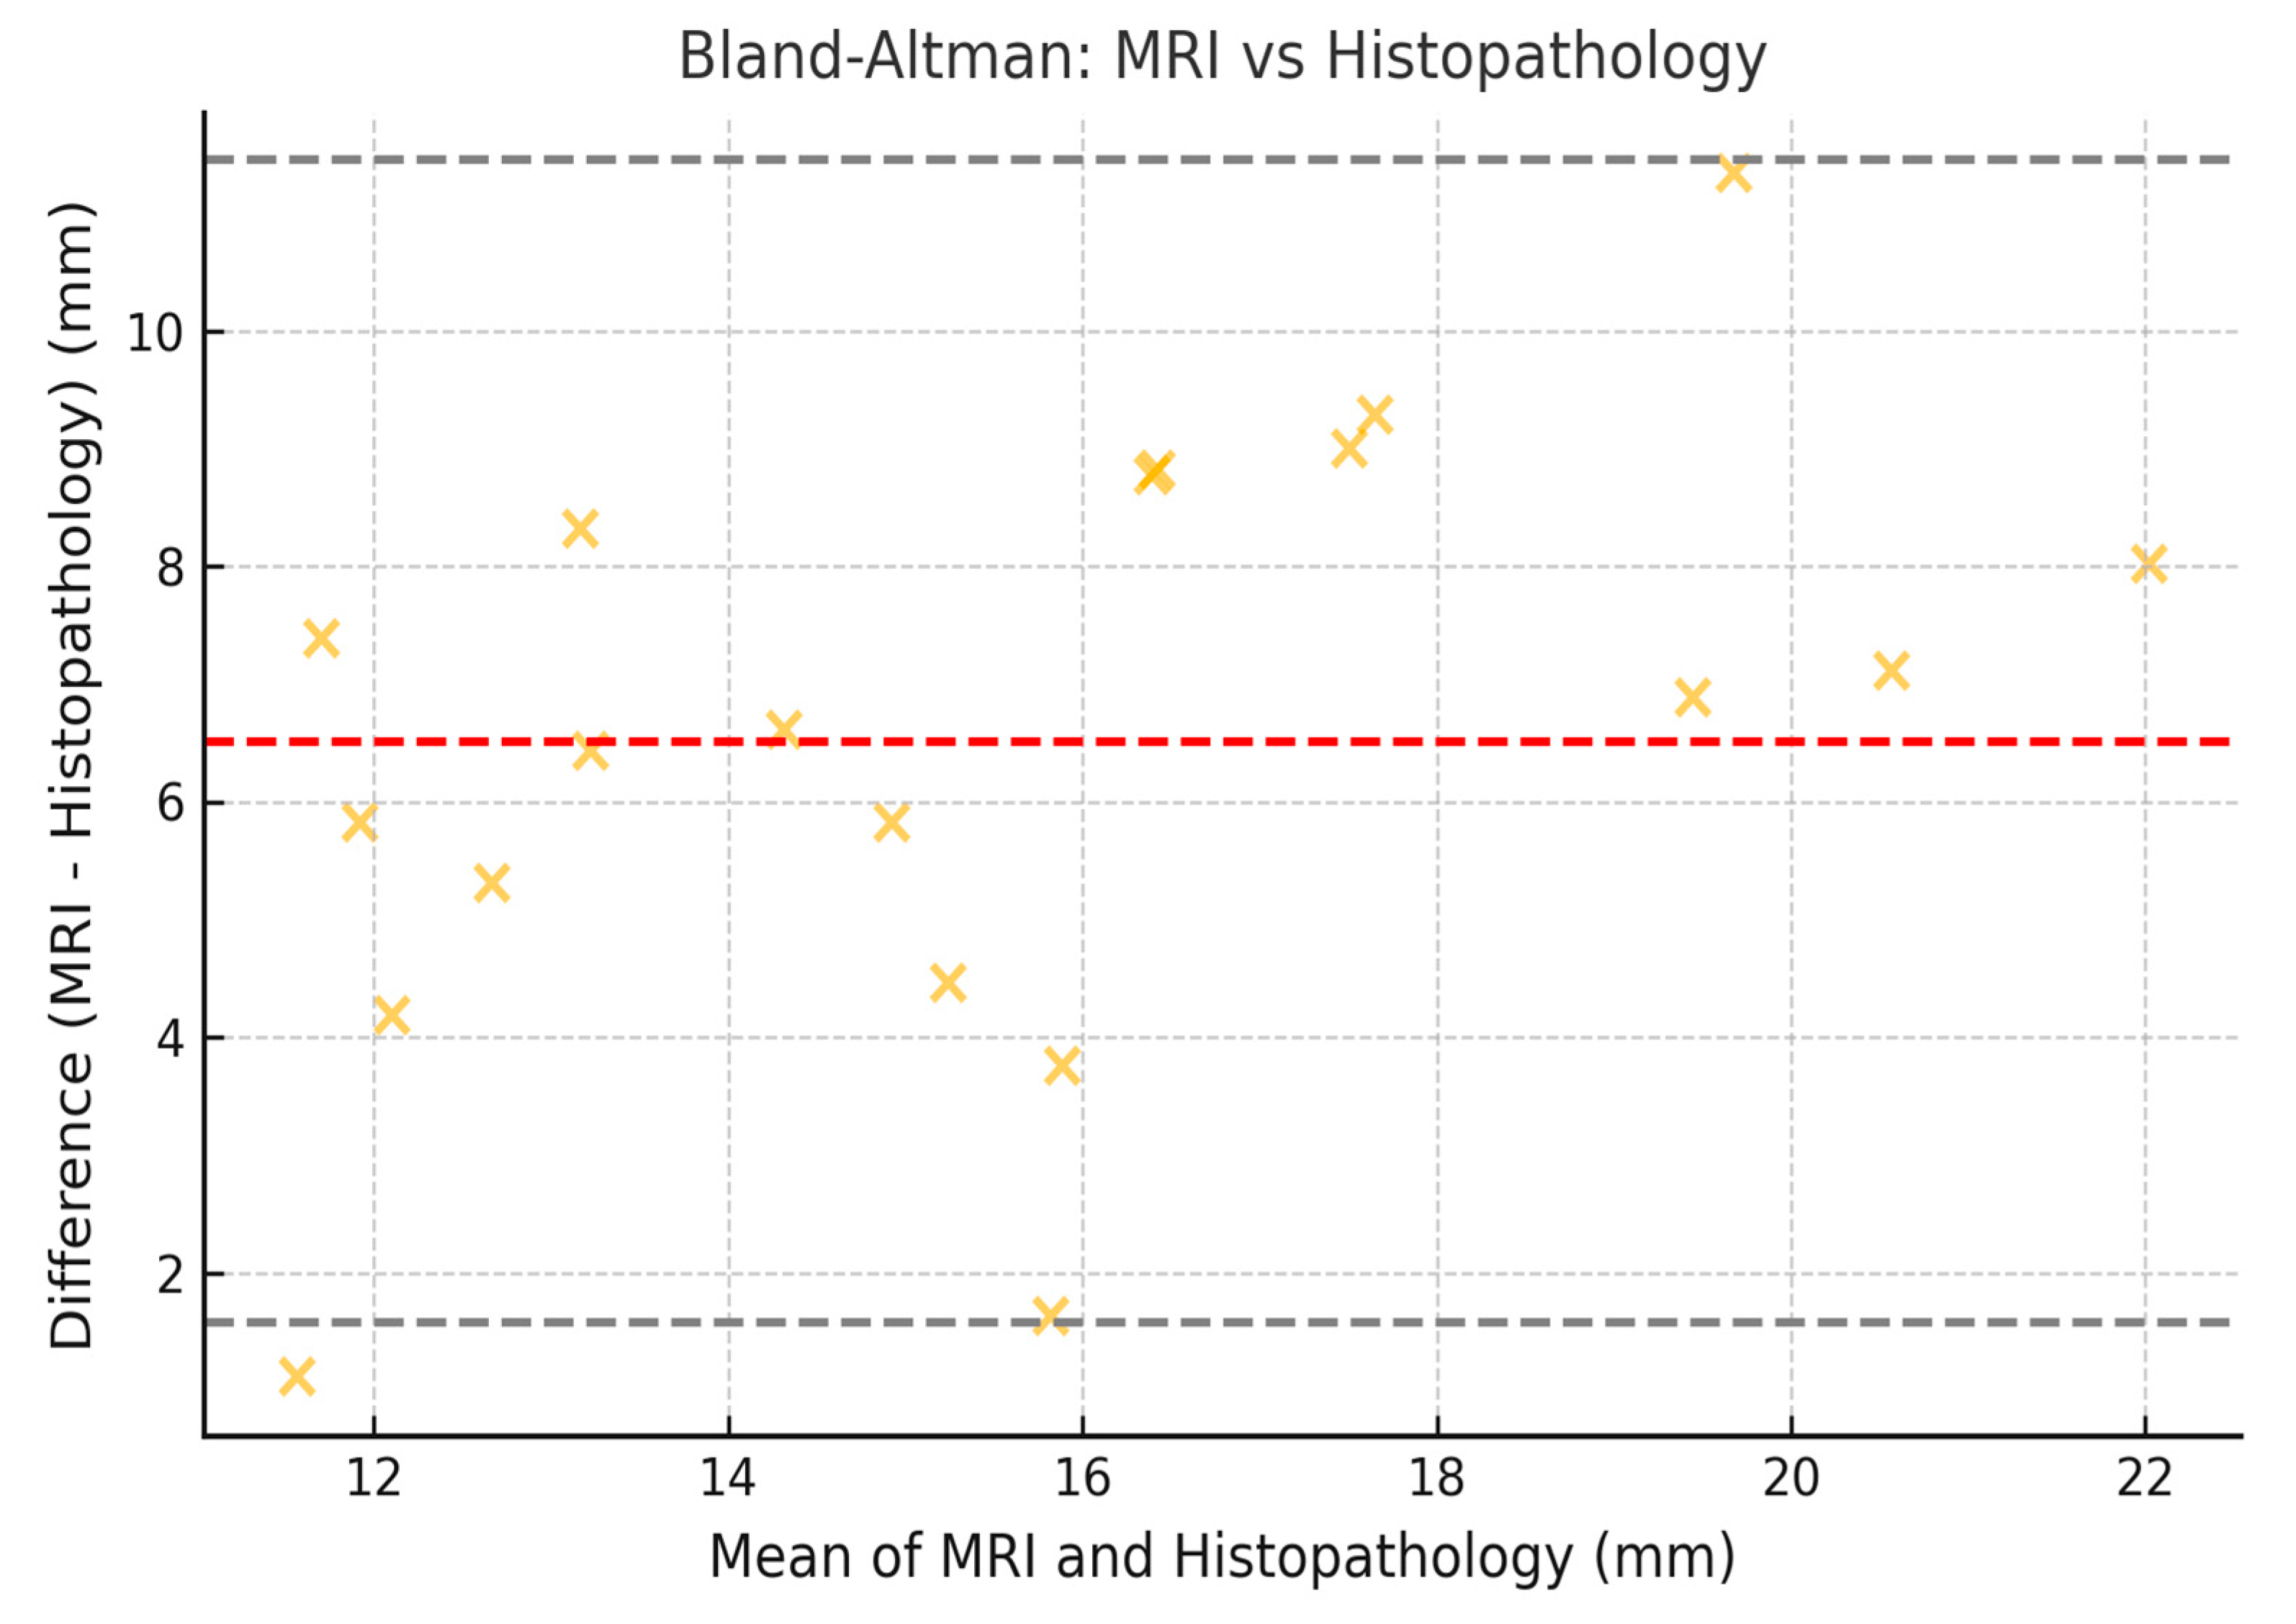
3.8. Limits of Agreement with 95% CI (Bland–Altman)
4. Discussion
4.1. Mammography: Standard Technique with High Specificity
4.2. US: Complementary Method with Low Sensitivity in Pure DCIS
4.3. Radiologic-Histopathologic Findings
4.4. MRI Findings
4.5. Limitations of MRI
4.6. Preoperative MRI and Detection of Additional Malignancies
4.7. The Role of MRI in Surgical Planning
4.8. When Should MRI Be Indicated in DCIS?
- Suspected extensive or multifocal DCIS, where mammography’s assessment of extension is limited;
- Dense breasts, where mammography has lower sensitivity;
- Discordance between mammography and US, causing diagnostic uncertainty;
- Need to rule out an invasive component, especially in extensive lesions with non-homogeneous enhancement.
5. Conclusions
Limitations
Author Contributions
Funding
Institutional Review Board Statement
Informed Consent Statement
Data Availability Statement
Conflicts of Interest
Abbreviations
| DCIS | Ductal carcinoma in situ |
| CNB | Core-needle biopsy |
| MRI | Magnetic resonance imaging |
| US | Ultrasound |
| VAB | Stereotaxy-guided vacuum-assisted biopsy |
References
- Yoon, G.Y.; Choi, W.J.; Kim, H.H.; Cha, J.H.; Shin, H.J.; Chae, E.Y. Surgical Outcomes for Ductal Carcinoma in Situ: Impact of Preoperative MRI. Radiology 2020, 295, 296–303. [Google Scholar] [CrossRef]
- Lee, S.E.; Kim, G.R.; Han, K.; Kim, E.H.; Kim, E.K.; Kim, M.J.; Yoon, J.H.; Park, V.Y.; Moon, H.J. US, Mammography, and Histopathologic Evaluation to Identify Low Nuclear Grade Ductal Carcinoma in Situ. Radiology 2022, 303, 276–284. [Google Scholar] [CrossRef] [PubMed]
- Yamada, T.; Mori, N.; Watanabe, M.; Kimijima, I.; Okumoto, T.; Seiji, K. Radiologic-pathologic correlation of ductal carcinoma in situ. Radiographics 2010, 30, 1183–1198. [Google Scholar] [CrossRef]
- Benveniste, A.P.; Ortiz-Perez, T.; Ebuoma, L.O.; Sepulveda, K.A.; Severs, F.J.; Roark, A.; Wang, T.; Sedgwick, E. Is breast magnetic resonance imaging (MRI) useful for diagnosis of additional sites of disease in patients recently diagnosed with pure ductal carcinoma in situ (DCIS)? Eur. J. Radiol. 2017, 96, 74–79. [Google Scholar] [CrossRef] [PubMed]
- Greenwood, H.I.; Wilmes, L.J.; Kelil, T.; Joe, B.N. Role of Breast MRI in the Evaluation and Detection of DCIS: Opportunities and Challenges. J. Magn. Reson. Imaging 2020, 52, 697–709. [Google Scholar] [CrossRef]
- Grimm, L.J.; Rahbar, H.; Abdelmalak, M.; Hall, A.H.; Ryser, M.D. Ductal Carcinoma in Situ: State-of-the-Art Review. Radiology. 2022, 302, 246–255. [Google Scholar] [CrossRef]
- Amornsiripanitch, N.M.D.; Lam, D.L.M.D.; Rahbar, H.M.D. Advances in Breast MRI in the setting of Ductal Carcinoma in situ. Semin. Roetgenol. 2018, 53, 261–269. [Google Scholar] [CrossRef] [PubMed]
- Baek, S.H.; Choi, W.J.; Cha, J.H.; Kim, H.H.; Shin, H.J.; Chae, E.Y. Comparison of mammography, ultrasound, and MRI in size assessment of ductal carcinoma in situ with histopathologic correlation. Acta Radiol. 2017, 58, 1434–1441. [Google Scholar] [CrossRef]
- Pilewskie, M.; Kennedy, C.; Shappell, C.; Helenowski, I.; Scholtens, D.; Hansen, N.; Bethke, K.; Jeruss, J.; Karstaedt, P.; Khan, S.A. Effect of MRI on the management of ductal carcinoma in situ of the breast. Ann. Surg. Oncol. 2013, 20, 1522–1529. [Google Scholar] [CrossRef]
- Shehata, M.; Grimm, L.; Ballantyne, N.; Lourenco, A.; Demello, L.R.; Kilgore, M.R.; Rahbar, H. Ductal Carcinoma in Situ: Current Concepts in Biology, Imaging, and Treatment. J. Breast Imaging 2019, 1, 166–176. [Google Scholar] [CrossRef]
- Rauch, G.M.; Kuerer, H.M.; Scoggins, M.E.; Fox, P.S.; Benveniste, A.P.; Park, Y.M.; Lari, S.A.; Hobbs, B.P.; Adrada, B.E.; Krishnamurthy, S.; et al. Clinicopathologic, mammographic, and sonographic features in 1,187 patients with pure ductal carcinoma in situ of the breast by estrogen receptor status. Breast Cancer Res. Treat. 2013, 139, 639–647. [Google Scholar] [CrossRef] [PubMed]
- D’Orsi, C.J.; Sickles, E.A.; Mendelson, E.B.; Morris, E.A. American College of Radiology (ACR) Breast Imaging Reporting and Data System Atlas (BI-RADS Atlas), 5th ed.; American College of Radiology: Reston, VA, USA, 2013; Available online: https://www.acr.org/Clinical-Resources/Reporting-and-Data-Systems/Bi-Rads (accessed on 15 April 2025).
- Sociedad Española de Oncología Médica [Internet]. España. Sociedad Española de Oncología Médica. 2022. Available online: https://seom.org/notas-prensa/209551-dia-mundial-cancer-de-mama-la-incidencia-de-cancer-de-mama-en-espana-aumenta-y-supone-el-28-9-del-total-de-canceres-en-las-mujeres-y-desciende-la-mortalidad (accessed on 14 March 2022).
- Rizzo, V.; Cicciarelli, F.; Galati, F.; Moffa, G.; Maroncelli, R.; Pasculli, M.; Pediconi, F. Could breast multiparametric MRI discriminate between pure ductal carcinoma in situ and microinvasive carcinoma? Acta Radiol. 2024, 65, 565–574. [Google Scholar] [CrossRef] [PubMed]
- Balleyguier, C.; Dunant, A.; Ceugnart, L.; Kandel, M.; Chauvet, M.-P.; Chérel, P.; Mazouni, C.; Henrot, P.; Rauch, P.; Chopier, J.; et al. Preoperative breast magnetic resonance imaging in women with local ductal carcinoma in situ to optimize surgical outcomes: Results from the Randomized Phase III Trial IRCIS. J. Clin. Oncol. 2019, 37, 885–892. [Google Scholar] [CrossRef]
- Kuhl, C.K.; Strobel, K.; Bieling, H.; Wardelmann, E.; Kuhn, W.; Maass, N.; Schrading, S. Impact of preoperative breast MR imaging and MR-guided surgery on diagnosis and surgical outcome of women with invasive breast cancer with and without DCIS component. Radiology 2017, 284, 645–655. [Google Scholar] [CrossRef] [PubMed]
- Tseng, J.; Kyrillos, A.; Liederbach, E.; Spear, G.G.; Ecanow, J.; Wang, C.; Czechura, T.; Kantor, O.; Miller, M.; Winchester, D.J.; et al. Clinical accuracy of preoperative breast MRI for breast cancer. J. Surg. Oncol. 2017, 115, 924–931. [Google Scholar] [CrossRef]
- Tajima, C.C.; de Sousa, L.L.C.; Venys, G.L.; Guatelli, C.S.; Bitencourt, A.G.V.; Marques, E.F. Magnetic resonance imaging of the breast: Role in the evaluation of ductal carcinoma in situ. Radiol. Bras. 2019, 52, 43–47. [Google Scholar] [CrossRef]
- Nadrljanski MM, Marković BB, Milošević ZČ. Breast ductal carcinoma in situ: Morphologic and kinetic MRI findings. Iran. J. Radiol. 2013, 10, 99–102. [Google Scholar] [CrossRef]
- Turnbull, L.; Brown, S.; Harvey, I.; Olivier, C.; Drew, P.; Napp, V.; Hanby, A.; Brown, J. Comparative effectiveness of MRI in breast cancer (COMICE) trial: A randomized controlled trial. Lancet 2010, 375, 563–571. [Google Scholar] [CrossRef]
- Lehman, C.D.; Gatsonis, C.; Romanoff, J.; Khan, S.A.; Carlos, R.; Solin, L.J.; Badve, S.; McCaskill-Stevens, W.; Corsetti, R.L.; Rahbar, H.; et al. Association of magnetic resonance imaging and a 12-gene expression assay with breast ductal carcinoma in situ treatment. JAMA Oncol. 2019, 5, 1036–1042. [Google Scholar] [CrossRef]
- Lam, D.L.; Smith, J.; Partridge, S.C.; Kim, A.; Javid, S.H.; Hippe, D.S.; Lehman, C.D.; Lee, J.M.; Rahbar, H. The impact of preoperative breast mri on surgical management of women with newly diagnosed ductal carcinoma in situ. Acad. Radiol. 2020, 27, 478–486. [Google Scholar] [CrossRef]
- Jethava, A.; Ali, S.; Wakefield, D.; Crowell, R.; Sporn, J.; Vrendenburgh, J. Diagnostic accuracy of MRI in predicting breast tumor size: Comparative analysis of MRI vs histopathological assessed breast tumor size. Conn. Med. 2015, 79, 261–267. [Google Scholar] [PubMed]
- Barrett, A. Preoperative breast MR imaging: Its role in surgical planning. Radiol. Technol. 2015, 86, 499–510. [Google Scholar] [PubMed]
- Davis, K.L.; Barth RJJr Gui, J.; Dann, E.; Eisenberg, B.; Rosenkranz, K. Use of MRI in preoperative planning for women with newly diagnosed DCIS: Risk or benefit? Ann. Surg. Oncol. 2012, 19, 3270–3274. [Google Scholar] [CrossRef]
- Fancellu, A.; Turner, R.M.; Dixon, J.M.; Pinna, A.; Cottu, P.; Houssami, N. Meta-analysis of the effect of preoperative breast MRI on the surgical management of ductal carcinoma in situ. Br. J. Surg. 2015, 102, 883–893. [Google Scholar] [CrossRef]
- Itakura, K.; Lessing, J.; Sakata, T.; Heinzerling, A.; Vriens, E.; Wisner, D.; Alvarado, M.; Esserman, L.; Ewing, C.; Hylton, N.; et al. The impact of preoperative magnetic resonance imaging on surgical treatment and outcomes for ductal carcinoma in situ. Clin. Breast Cancer 2011, 11, 33–38. [Google Scholar] [CrossRef] [PubMed]
- Kropcho, L.C.; Steen, S.T.; Chung, A.P.; Sim, M.S.; Kirsch, D.L.; Giuliano, A.E. Preoperative breast MRI in the surgical treatment of ductal carcinoma in situ. Breast J. 2012, 18, 151–156. [Google Scholar] [CrossRef]
- Pilewskie, M.; Olcese, C.; Eaton, A.; Patil, S.; Morris, E.; Morrow, M.; Van Zee, K.J. Perioperative breast MRI is not associated with lower locoregional recurrence rates in DCIS patients treated with or without radiation. Ann. Surg. Oncol. 2014, 21, 1552–1560. [Google Scholar] [CrossRef] [PubMed] [PubMed Central]
- Lee, J.; Tanaka, E.; Eby, P.R.; Zhou, S.; Wei, W.; Eppelheimer, C.; Loving, V.A. Preoperative Breast MRI: Surgeons’ Patient Selection Patterns and Potential Bias in Outcomes Analyses. AJR Am. J. Roentgenol. 2017, 208, 923–932. [Google Scholar] [CrossRef] [PubMed]
- Sun, H.; Li, H.; Si, S.; Qi, S.; Zhang, W.; Ma, H.; Liu, S.; Yingxue, L.; Qian, W. Performance evaluation of breast cancer diagnosis with mammography, ultrasonography and magnetic resonance imaging. J. X-Ray Sci. Technol. 2018, 26, 805–813. [Google Scholar] [CrossRef]
- Peters, N.H.; Borel Rinkes, I.H.; Zuithoff, N.P.; Mali, W.P.; Moons, K.G.; Peeters, P.H. Meta-analysis of MR imaging in the diagnosis of breast lesions. Radiology 2008, 246, 116–124. [Google Scholar] [CrossRef]


| Variable | Low-Nuclear Grade | Intermediate-Nuclear Grade | High-Nuclear Grade | Total | p Value | p Value (H-B) |
|---|---|---|---|---|---|---|
| No. of lesions | 52 (35.92%) | 67 (47.18%) | 25 (16.90%) | 144 | NA | NA |
| Median age at diagnosis (IR) Y | 55.5 (49.8–64) | 55 (48–62) | 50 (48–58) | 55 (48–62) | 0.23 1 | 1 |
| Mean age at diagnosis (std) Y | 56.5 (10.1) | 54.8 (10.4) | 51.8 (9.1) | 55.1 (10.3) | ||
| Patients’ origin | ||||||
| Population screening program | 25 (48.08%) | 34 (50.75%) | 13 (52.00%) | 72 (50.00%) | ||
| Gynecology consultation | 9 (17.31%) | 8 (11.94%) | 5 (20.00%) | 22 (15.28%) | ||
| General surgery consultation | 4 (7.69%) | 2 (2.99%) | 0 (0%) | 6 (4.17%) | 0.77 2 | 1 |
| Oncology consultation | 6 (11.54%) | 8 (11.94%) | 5 (20.00%) | 19 (13.19%) | ||
| Primary care consultation | 6 (11.54%) | 12 (17.91%) | 2 (8.00%) | 20 (13.89%) | ||
| Other | 2 (3.85%) | 3 (4.48%) | 0 (0%) | 5 (3.47%) | ||
| Biopsy method | ||||||
| Core-needle biopsy | 35 (67.31%) | 39 (58.21%) | 18 (72.00%) | 92 (63.89%) | 0.38 3 | 1 |
| Vacuum-assisted biopsy | 17 (32.69%) | 28 (41.79%) | 7 (28.00%) | 52 (36.11%) | ||
| Lesion size median [IR] (mm) | ||||||
| Mammography | 15.0 [11.0; 26.5] | 21.0 [12.0; 45.0] | 23.0 [15.0; 53.0] | 18.0 [12.0; 40.0] | 0.05 *,4 | 0.50 |
| MRI | 21.5 [14.0; 45.0] | 21.0 [13.5; 47.5] | 26.0 [16.0; 50.0] | 24.0 [14.0; 46.2] | 0.66 4 | 1 |
| Histopathologic evaluation | 12.0 [7.5; 23.5] | 18.5 [10.0; 30.0] | 24.5 [10.0; 40.5] | 17.0 [9.5; 30.0] | 0.04 *,4 | 0.44 |
| Imaging finding | ||||||
| Microcalcifications only (mammography) | 26 (50.00%) | 53 (79.10%) | 16 (64.00%) | 95 (65.97%) | 0.004 *,3 | 0.048 |
| Microcalcifications+ Asymmetric Focal Density | 8 (15.38%) | 7 (10.45%) | 5 (20.00%) | 20 (13.89%) | 0.43 2 | 1 |
| Microcalcifications+ Parenchymal distortion | 1 (1.92%) | 1 (1.49%) | 1 (4.00%) | 3 (2.08%) | 0.58 2 | 1 |
| Microcalcifications+ Nodule/mass | 1 (1.92%) | 0 (0%) | 0 (0%) | 1 (0.69%) | 0.53 2 | 1 |
| Nodule/mass only (US) | 6 (11.54%) | 2 (2.99%) | 0 (0%) | 8 (5.56%) | 0.09 2 | 0.094 |
| Parenchymal distortion | 3 (5.77%) | 1 (1.49%) | 1 (4.00%) | 5 (3.47%) | 0.40 2 | 1 |
| Asymmetric Focal Density | 4 (7.69%) | 2 (2.99%) | 1 (4.00%) | 7 (4.86%) | 0.60 2 | 1 |
| US | ||||||
| Positive findings | 37 (71.15%) | 44 (65.67%) | 18 (72.00%) | 99 (68.75%) | 0.76 3 | 0.82 |
| Negative findings | 15 (28.85%) | 23 (34.33%) | 7 (28.00%) | 45 (31.25%) | ||
| MRI: Presence of enhancement | ||||||
| No | 0 (0%) | 3 (100.00%) | 0 (0%) | 3 (2.08%) | 0.29 2 | 0.35 |
| Yes | 52 (36.88%) | 64 (45.39%) | 25 (17.73%) | 141 (97.92%) |
| Indicators | Pathological Staging: Low | Pathological Staging: Medium | Pathological Staging: High | Total | p Value | p Value (H-B) |
|---|---|---|---|---|---|---|
| Morphologic feature of microcalcifications | ||||||
| Round/Punctiform | 7 (13.46%) | 1 (1.49%) | 1 (4%) | 9 (6.25%) | 0.02 *,1 | 0.04 |
| Amorphous | 8 (15.28%) | 7 (10.45%) | 4 (16%) | 19 (13.19%) | 0.68 1 | 1 |
| Coarse heterogeneous | 5 (9.62%) | 4 (5.97%) | 0 (0%) | 9 (6.25%) | 0.31 1 | 1 |
| Fine pleomorphic | 17 (32.69%) | 45 (67.16%) | 16 (64%) | 78 (54.17%) | 0.001 *,2 | 0.01 |
| Linear branched or fine linear | 1 (1.92%) | 5 (7.46%) | 2 (8.00%) | 8 (5.56%) | 0.39 1 | 1 |
| Microcalcifications distribution | ||||||
| Diffuse | 1 (1.92%) | 0 (0%) | 0 (0%) | 1 (0.69%) | 0.53 1 | 1 |
| Regional | 1 (1.92%) | 5 (7.46%) | 3 (12%) | 9 (6.25%) | 0.19 1 | 1 |
| Grouped | 22 (42.31%) | 27 (40.30%) | 10 (40%) | 59 (40.97%) | 0.97 2 | 1 |
| Linear | 7 (13.46%) | 18 (26.87%) | 6 (24%) | 31 (21.53%) | 0.22 2 | 1 |
| Segmental | 7 (13.46%) | 12 (17.91%) | 4 (16%) | 23 (15.97%) | 0.83 1 | 1 |
| Variable | Low-Nuclear Grade | Intermediate-Nuclear Grade | High-Nuclear Grade | Total | p Value | p Value (H-B) | Lower 95% CI | Upper 95% CI |
|---|---|---|---|---|---|---|---|---|
| MRI Enhancement | ||||||||
| No | 0 (0%) | 3 (100.00%) | 0 (0%) | 3 (2.08%) | 0.29 1 | 1 | 0.14 | 0.44 |
| Yes | 52 (36.88%) | 64 (45.39%) | 25 (17.73%) | 141 (97.92%) | ||||
| Curve type | ||||||||
| 1 | 3 (5.88%) | 3 (4.69%) | 0 (0%) | 6 (4.35%) | 0.49 1 | 1 | ||
| 2 | 43 (84.31%) | 57 (89.06%) | 19 (82.61%) | 119 (86.23%) | 0.34 | 0.64 | ||
| 3 | 5 (9.80%) | 4 (6.25%) | 4 (17.39%) | 13 (9.42%) | ||||
| Enhancement type | ||||||||
| Nodular/mass | 8 (15.38%) | 4 (5.97%) | 2 (8%) | 14 (9.72%) | 0.25 1 | 1 | 0.1 | 0.35 |
| Non mass | 41 (78.85%) | 60 (89.55%) | 23 (92.00%) | 124 (86.11%) | 0.17 1 | 1 | 0.02 | 0.32 |
| RFocus | 1 (1.96%) | 0 (0%) | 0 (0%) | 1 (0.69%) | 0.53 1 | 1 | 0.38 | 0.68 |
| Internal enhancement pattern | ||||||||
| Paved | 17 (32.69%) | 31 (46.27%) | 7 (28.00%) | 55 (38.19%) | 0.16 2 | 1 | 0.01 | 0.31 |
| Heterogeneous | 19 (36.54%) | 17 (25.37%) | 7 (28.00%) | 43 (29.86%) | 0.41 2 | 1 | 0.26 | 0.56 |
| Homogeneous | 15 (29.41%) | 15 (28.85%) | 16 (23.88%) | 6 (24.00%) | 0.81 2 | 1 | 0.66 | 0.96 |
| Clustered Ring | 0 (0%) | 0 (0%) | 2 (8%) | 2 (1.39%) | 0.03 *,1 | 0.33 | −0.12 | 0.18 |
| Enhancement distribution | ||||||||
| Focal | 16 (30.77%) | 16 (23.88%) | 8 (32.00%) | 40 (27.78%) | 0.62 2 | 1.0 | 0.47 | 0.77 |
| Linear | 10 (19.23%) | 25 (37.31%) | 5 (20.00%) | 40 (27.78%) | 0.06 *,2 | 0.60 | 0.45 | 0.75 |
| Segmental | 11 (21.15%) | 11 (16.42%) | 3 (12.00%) | 25 (17.36%) | 0.65 1 | 1 | 0.50 | 0.80 |
| Regional | 3 (5.77%) | 6 (8.96%) | 3 (12.00%) | 12 (8.33% | 0.62 1 | 1 | 0.47 | 0.77 |
| Multi regional | 2 (3.85%) | 2 (2.99%) | 2 (8.00%) | 6 (4.17%) | 0.47 1 | 1 | 0.32 | 0.32 |
| Diffuse | 0 (0%) | 0 (%) | 0 (%) | 0 (0%) | NA | |||
| Multifocality | 9 (17.31%) | 11 (16.42%) | 4 (16.00%) | 24 (16.67%) | 0.96 1 | 1 | 0.81 | 1.11 |
| Multicentricity | 3 (5.77%) | 3 (4.48%) | 2 (8.00%) | 8 (5.56%) | 0.82 1 | 1 | 0.67 | 0.67 |
| Bilaterality | 3 (5.88%) | 0 (0%) | 0 (0%) | 3 (2.08%) | 0.23 1 | 1 | 0.08 | 0.38 |
| Variable | Low-Nuclear Grade | Intermediate-Nuclear Grade | High-Nuclear Grade | Total | p Value | p Value (H-B) |
|---|---|---|---|---|---|---|
| Presence of premalignant lesions | 24 (46.15%) | 11 (16.42%) | 3 (12.00%) | 38 (26.39%) | 0.005 *,1 | 0.035 |
| Presence of necrosis foci | 8 (25.8%) | 12 (38.7%) | 11 (35.5%) | 31 (21.53%) | 0.15 2 | 1 |
| Premalignant lesions | ||||||
| Papillomatosis/Papilloma | 19 (36.54%) | 4 (5.97%) | 2 (8.00%) | 25 (17.36%) | 0.001 *2 | 0.007 |
| Atypical ductal hyperplasia | 0 (0%) | 0 (0%) | 1 (4%) | 1 (0.69%) | 0.17 2 | 1.0 |
| Atypical squamous epithelium | 1 (1.96%) | 2 (2.99%) | 0 (0%) | 3 (2.08%) | 1.0 2 | 1.0 |
| Complex sclerosing lesion | 0 (0%) | 1 (1.49%) | 0 (0%) | 1 (0.69%) | 1.0 2 | 1.0 |
| Lobular carcinoma in situ | 1 (1.92%) | 0 (0%) | 0 (0%) | 1 (0.69%) | 0.53 2 | 1.0 |
| >1 | 3 (5.77%) | 4 (5.97%) | 0 (0%) | 7 (4.86%) | 0.68 2 | 1.0 |
| Image Modality | Median (IQR), mm | Wilcoxon Test (p Value) |
|---|---|---|
| Mammography | 15.0 [11.0–26.5] | |
| MRI | 21.5 [14.0–45.0] | 0.0 (p < 0.001) |
| Histopathological evaluation | 12.0 [7.5–23.5] |
| Comparison | Lin Coefficient | Lower CI 95% | Upper CI 95% |
|---|---|---|---|
| Mammography vs. Histopathology | 0.70 | 0.62 | 0.75 |
| MRI vs. Histopathology | 0.69 | 0.61 | 0.74 |
| Mammography vs. MRI | 0.62 | 0.54 | 0.70 |
| Comparison | Lower Limit | Upper Limit | Lower CI 95% | Upper CI 95% |
|---|---|---|---|---|
| Mammography vs. Histopathology | −8.3 mm | 11.3 mm | −9.1 mm | 12.1 mm |
| MRI vs. Histopathology | −10.2 mm | 14.2 mm | −11.0 mm | 15.0 mm |
| Mammography vs. MRI | −7.5 mm | 9.1 mm | −8.2 mm | 9.8 mm |
Disclaimer/Publisher’s Note: The statements, opinions and data contained in all publications are solely those of the individual author(s) and contributor(s) and not of MDPI and/or the editor(s). MDPI and/or the editor(s) disclaim responsibility for any injury to people or property resulting from any ideas, methods, instructions or products referred to in the content. |
© 2025 by the authors. Licensee MDPI, Basel, Switzerland. This article is an open access article distributed under the terms and conditions of the Creative Commons Attribution (CC BY) license (https://creativecommons.org/licenses/by/4.0/).
Share and Cite
García Ruiz, C.; Saidi, L.Z.; Zambrana Aguilar, L.; Moreira Cabrera, M.; Carvia Ponsaille, C.; Vázquez Sousa, R.; Martínez Porras, C.; Murillo-Cancho, A.F. Role of MRI in the Diagnosis of Ductal Carcinoma In Situ: A Retrospective Study. J. Clin. Med. 2025, 14, 2842. https://doi.org/10.3390/jcm14082842
García Ruiz C, Saidi LZ, Zambrana Aguilar L, Moreira Cabrera M, Carvia Ponsaille C, Vázquez Sousa R, Martínez Porras C, Murillo-Cancho AF. Role of MRI in the Diagnosis of Ductal Carcinoma In Situ: A Retrospective Study. Journal of Clinical Medicine. 2025; 14(8):2842. https://doi.org/10.3390/jcm14082842
Chicago/Turabian StyleGarcía Ruiz, Cristina, Laila Zitan Saidi, Lucía Zambrana Aguilar, Maricela Moreira Cabrera, Carolina Carvia Ponsaille, Rosa Vázquez Sousa, Carmen Martínez Porras, and Antonio Fernando Murillo-Cancho. 2025. "Role of MRI in the Diagnosis of Ductal Carcinoma In Situ: A Retrospective Study" Journal of Clinical Medicine 14, no. 8: 2842. https://doi.org/10.3390/jcm14082842
APA StyleGarcía Ruiz, C., Saidi, L. Z., Zambrana Aguilar, L., Moreira Cabrera, M., Carvia Ponsaille, C., Vázquez Sousa, R., Martínez Porras, C., & Murillo-Cancho, A. F. (2025). Role of MRI in the Diagnosis of Ductal Carcinoma In Situ: A Retrospective Study. Journal of Clinical Medicine, 14(8), 2842. https://doi.org/10.3390/jcm14082842