
On the Intensity of the Microvascular Magnetic Field in Normal State and Septic Shock


Abstract
1. Introduction
2. Materials and Methods
2.1. Study Objective
2.2. Patients and Measurements
2.3. Intensity of the Magnetic Field
2.4. Statistical Analysis
3. Results
3.1. Demographics, Systemic Hemodynamics, and Microcirculation
3.2. Magnetic Field Parameters
4. Discussion
5. Conclusions
6. Future Perspectives
- Development of novel microvascular magnetic field monitoring techniques: The clinical introduction of hand-held microscopes allows clear visualization of the microcirculation and flowing RBCs. The promising results of the present study together with future technological advances could lead to the development of fully automated software for the analysis of HRBC, HCAP, and FCAP in patients with septic shock.
- Investigating the association between microvascular magnetic fields and microvascular (dys)function: More research is needed to establish a clear association between the characteristics of RBC- and tortuosity-induced magnetic fields and key hemodynamic/microvascular/metabolic/oxygen transport parameters, such as RBC velocity, capillary perfusion, and oxygen extraction. Understanding these relationships is crucial for developing targeted therapies.
- Exploring the therapeutic potential of external magnetic fields: The present study evaluated HRBC, HCAP, and FCAP in normal state and septic shock. Investigating the application of specific parameters, such as external magnetic fields, to modulate microvascular magnetic fields and improve tissue perfusion and oxygenation of adjacent tissues could offer a novel therapeutic approach in critically ill patients.
- Overcoming the limitations of current models: Accurately modeling the complex interplay between perfusion, microvascular magnetic field generation, and oxygenation requires further refinement of existing or novel translational/integrative/computational models.
- Targeting microvascular magnetic field influencing factors: Developing therapies that specifically address factors that disrupt microvascular magnetic fields, such as inflammation, endothelial dysfunction, and coagulation abnormalities, could indirectly optimize HRBC, HCAP, and FCAP behavior and hemodynamic coherence.
- Personalized medicine approach: Recognizing the heterogeneity of septic shock, a personalized approach that considers individual differences in capillary tortuosity, and HRBC, HCAP, and FCAP characteristics could lead to more effective and targeted therapies. For example, monitoring the HRBC, HCAP, and FCAP response to different drug concentrations or fluid volumes could help determine the optimal dosage for each patient, allowing for a timely individualized treatment strategy and improving outcomes.
Supplementary Materials
Funding
Institutional Review Board Statement
Informed Consent Statement
Data Availability Statement
Acknowledgments
Conflicts of Interest
Abbreviations
| RBC | Red blood cell |
| CTS | Capillary tortuosity score |
| H | Intensity of the magnetic field |
| NRBC | Number of capillary red blood cells |
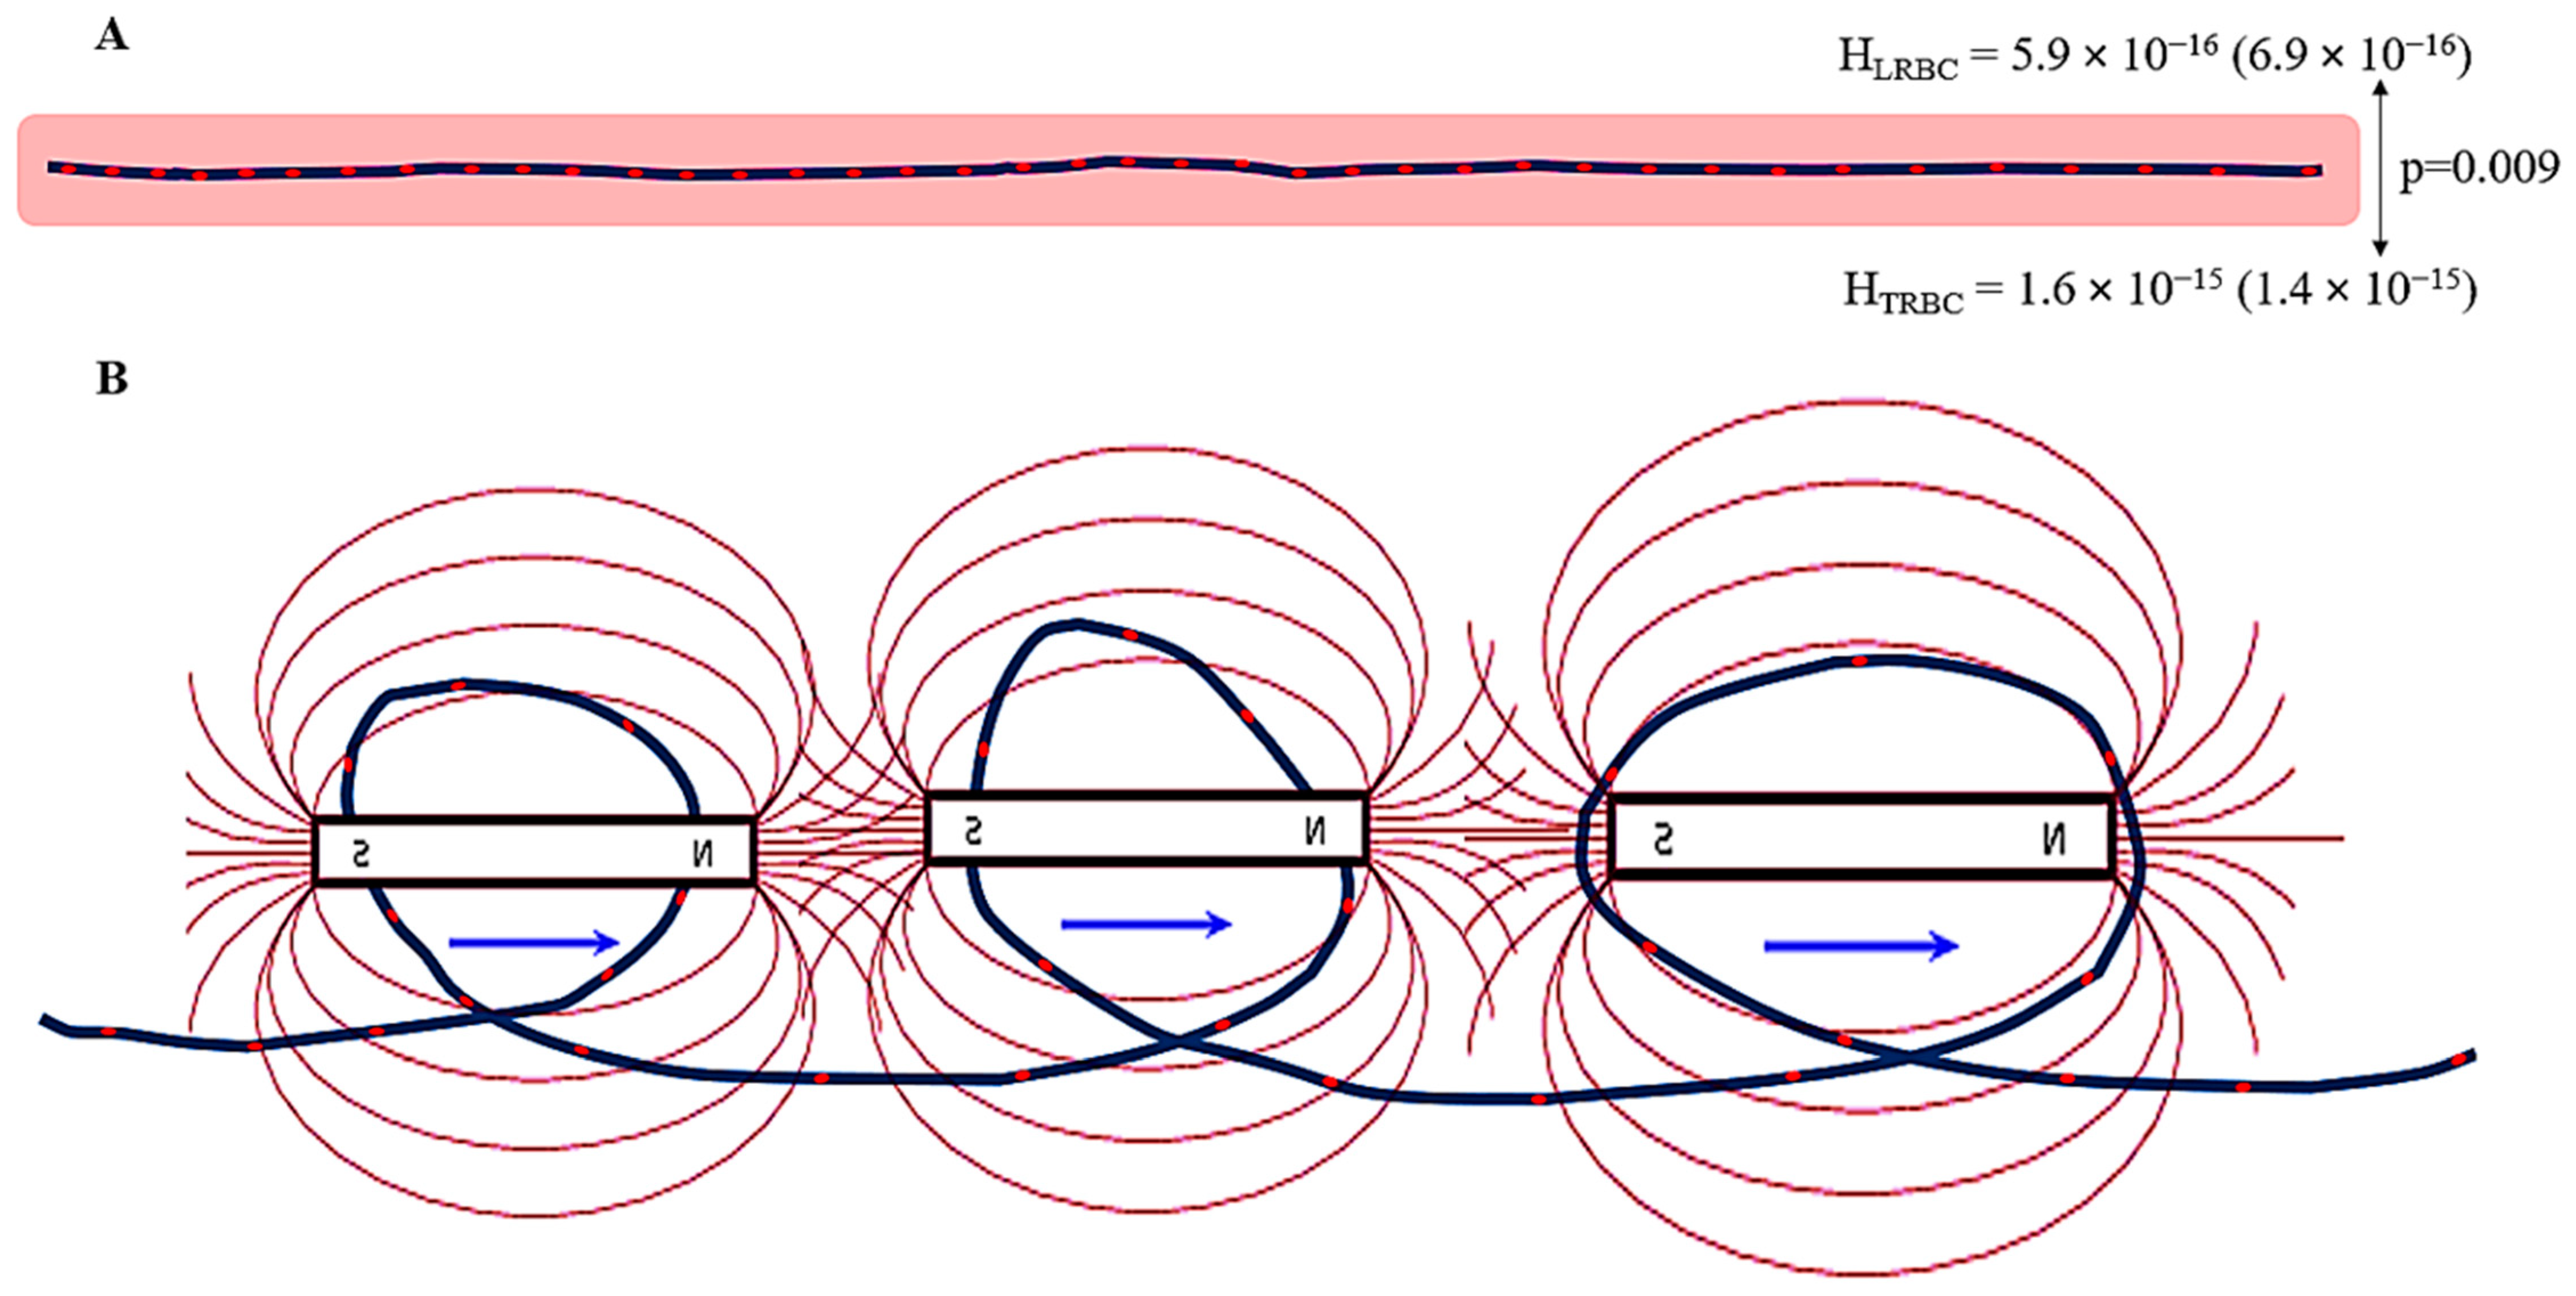
| HRBC | Intensity of the magnetic field of a red blood cell |
| HCAP | Intensity of the magnetic field of each capillary |
| FCAP | Intensity of the capillary magnetic field acting on a single red blood cell |
| A-a O2 gradient | Alveolar-to-arterial oxygen gradient |
References
- Chalkias, A.; Xenos, M. Relationship of Effective Circulating Volume with Sublingual Red Blood Cell Velocity and Microvessel Pressure Difference: A Clinical Investigation and Computational Fluid Dynamics Modeling. J. Clin. Med. 2022, 11, 4885. [Google Scholar] [CrossRef] [PubMed]
- Ast, T.; Mootha, V.K. Oxygen and mammalian cell culture: Are we repeating the experiment of Dr. Ox? Nat. Metab. 2019, 1, 858–860. [Google Scholar]
- Chalkias, A.; Laou, E.; Mermiri, M.; Michou, A.; Ntalarizou, N.; Koutsona, S.; Chasiotis, G.; Garoufalis, G.; Agorogiannis, V.; Kyriakaki, A.; et al. Microcirculation-guided treatment improves tissue perfusion and hemodynamic coherence in surgical patients with septic shock. Eur. J. Trauma Emerg. Surg. 2022, 48, 4699–4711. [Google Scholar] [PubMed]
- Keeley, T.P.; Mann, G.E. Defining Physiological Normoxia for Improved Translation of Cell Physiology to Animal Models and Humans. Physiol. Rev. 2019, 99, 161–234. [Google Scholar] [CrossRef]
- Schödel, J.; Ratcliffe, P.J. Mechanisms of hypoxia signalling: New implications for nephrology. Nat. Rev. Nephrol. 2019, 15, 641–659. [Google Scholar] [PubMed]
- Batra, S.; Rakusan, K. Capillary length, tortuosity, and spacing in rat myocardium during cardiac cycle. Am. J. Physiol. 1992, 263, H1369–H1376. [Google Scholar]
- Zebic Mihic, P.; Saric, S.; Bilic Curcic, I.; Mihaljevic, I.; Juric, I. The Association of Severe Coronary Tortuosity and Non-Obstructive Coronary Artery Disease. Medicina 2023, 59, 1619. [Google Scholar] [CrossRef]
- Pittman, R.N. Oxygen transport in the microcirculation and its regulation. Microcirculation 2013, 20, 117–137. [Google Scholar]
- Han, H.C. Twisted blood vessels: Symptoms, etiology and biomechanical mechanisms. J. Vasc. Res. 2012, 49, 185–197. [Google Scholar]
- Chong, D.C.; Yu, Z.; Brighton, H.E.; Bear, J.E.; Bautch, V.L. Tortuous Microvessels Contribute to Wound Healing via Sprouting Angiogenesis. Arterioscler. Thromb. Vasc. Biol. 2017, 37, 1903–1912. [Google Scholar]
- Chalkias, A.; Papagiannakis, N.; Katsifa, K.; Destounis, A.; Gravos, A.; Kanakaki, S.; Karapiperis, G.; Koufaki, F.; Prekates, A.; Tselioti, P. Characterization of Sublingual Microvascular Tortuosity in Steady-State Physiology and Septic Shock. Biomedicines 2025, 13, 691. [Google Scholar] [CrossRef] [PubMed]
- Gasparovic, C.; Matwiyoff, N.A. The magnetic properties and water dynamics of the red blood cell: A study by proton-NMR lineshape analysis. Magn. Reson. Med. 1992, 26, 274–299. [Google Scholar] [CrossRef]
- Kumar, A.; Verma, M.; Jha, K.K. Resealed Erythrocytes as a Carrier for Drug Targeting: A Review. Pharma Innov. 2012, 1, 8–16. [Google Scholar]
- Agha, R.; Abdall-Razak, A.; Crossley, E.; Dowlut, N.; Iosifidis, C.; Mathew, G.; STROCSS Group. STROCSS 2019 Guideline: Strengthening the reporting of cohort studies in surgery. Int. J. Surg. 2019, 72, 156–165. [Google Scholar] [CrossRef]
- Ince, C.; Boerma, E.C.; Cecconi, M.; De Backer, D.; Shapiro, N.I.; Duranteau, J.; Pinsky, M.R.; Artigas, A.; Teboul, J.L.; Reiss, I.K.M.; et al. Second consensus on the assessment of sublingual microcirculation in critically ill patients: Results from a task force of the European Society of Intensive Care Medicine. Intensive Care Med. 2018, 44, 281–299. [Google Scholar]
- Massey, M.J.; Larochelle, E.; Najarro, G.; Karmacharla, A.; Arnold, R.; Trzeciak, S.; Angus, D.C.; Shapiro, N.I. The micro-circulation image quality score: Development and preliminary evaluation of a proposed approach to grading quality of image acquisition for bedside videomicroscopy. J. Crit. Care 2013, 28, 913–917. [Google Scholar] [PubMed]
- Dobbe, J.G.; Streekstra, G.J.; Atasever, B.; van Zijderveld, R.; Ince, C. Measurement of functional microcirculatory geometry and velocity distributions using automated image analysis. Med. Biol. Eng. Comput. 2008, 46, 659–670. [Google Scholar] [CrossRef]
- Djaberi, R.; Schuijf, J.D.; de Koning, E.J.; Wijewickrama, D.C.; Pereira, A.M.; Smit, J.W.; Kroft, L.J.; Roos, A.d.; Bax, J.J.; Rabelink, T.J.; et al. Non-invasive assessment of microcirculation by sidestream dark field imaging as a marker of coronary artery disease in diabetes. Diabetes Vasc. Dis. Res. 2013, 10, 123–134. [Google Scholar] [CrossRef]
- Beraia, M.; Beraia, G. Electromagnetic properties of the human blood circulation. Health Educ. Public Health 2018, 1, 121–130. [Google Scholar]
- Gulati, G.; Uppal, G.; Gong, J. Unreliable Automated Complete Blood Count Results: Causes, Recognition, and Resolution. Ann. Lab. Med. 2022, 42, 515–530. [Google Scholar] [CrossRef]
- Fåhræus, R. The suspension stability of blood. Physiol. Rev. 1929, 9, 241–274. [Google Scholar] [CrossRef]
- Farina, A.; Fasano, A.; Rosso, F. A theoretical model for the Fahraeus effect in medium-large microvessels. J. Theor. Biol. 2023, 558, 111355. [Google Scholar] [CrossRef] [PubMed]
- Archontakis-Barakakis, P.; Mavridis, T.; Chlorogiannis, D.-D.; Barakakis, G.; Laou, E.; Sessler, D.I.; Gkiokas, G.; Chalkias, A. Intestinal oxygen utilisation and cellular adaptation during intestinal ischaemia-reperfusion injury. Clin. Transl. Med. 2025, 15, e70136. [Google Scholar] [CrossRef] [PubMed]
- Kopyltsov, A.V. Mathematical modeling of the magnetic field of red blood cells in narrow capillaries. IOP Conf. Ser. Earth Environ. Sci. 2019, 315, 042019. [Google Scholar]
- Feynman, R.P.; Leighton, R.B.; Sands, M. The Feynman Lectures on Physics; Addison-Wesley Publishing Company: London, UK, 1964. [Google Scholar]
- Orear, J. Physics; Macmillan Publishing Co.: New York, NY, USA, 1980. [Google Scholar]
- Beraia, M.; Beraia, G. Electromagnetism—Properties of Erythrocytes. Glob. J. Health Sci. 2024, 16, 16–26. [Google Scholar] [CrossRef]
- Brealey, D.; Brand, M.; Hargreaves, I.; Heales, S.; Land, J.; Smolenski, R.; Davies, N.A.; Cooper, C.E.; Singer, M. Association between mitochondrial dysfunction and severity and outcome of septic shock. Lancet 2002, 360, 219–223. [Google Scholar] [CrossRef]
- Fredriksson, K.; Hammarqvist, F.; Strigård, K.; Hultenby, K.; Ljungqvist, O.; Wernerman, J.; Rooyackers, O. Derangements in mitochondrial metabolism in intercostal and leg muscle of critically ill patients with sepsis-induced multiple organ failure. Am. J. Physiol. Endocrinol. Metab. 2006, 291, E1044–E1050. [Google Scholar] [CrossRef]
- Mizobata, Y.; Prechek, D.; Rounds, J.D.; Robinson, V.; Wilmore, D.W.; Jacobs, D.O. The duration of infection modifies mitochondrial oxidative capacity in rat skeletal muscle. J. Surg. Res. 1995, 59, 165–173. [Google Scholar] [CrossRef]
- Kantrow, S.P.; Taylor, D.E.; Carraway, M.S.; Piantadosi, C.A. Oxidative Metabolism in Rat Hepatocytes and Mitochondria during Sepsis. Arch. Biochem. Biophys. 1997, 345, 278–288. [Google Scholar] [CrossRef]
- Wasyluk, W.; Zwolak, A. Metabolic Alterations in Sepsis. J. Clin. Med. 2021, 10, 2412. [Google Scholar] [CrossRef]
- Singer, M. The role of mitochondrial dysfunction in sepsis-induced multi-organ failure. Virulence 2014, 5, 66–72. [Google Scholar] [CrossRef]
- Zhang, H.; Feng, Y.W.; Yao, Y.M. Potential therapy strategy: Targeting mitochondrial dysfunction in sepsis. Mil. Med. Res. 2018, 5, 41. [Google Scholar]
- Corrêa, T.D.; Jakob, S.M.; Takala, J. Mitochondrial Function in Sepsis. Crit. Care Horiz. 2015, 1, 31–41. [Google Scholar]
- Elblbesy, M.A. Effect of physiological parameters of blood on magnetophoretic mobility of erythrocytes. Electromagn. Biol. Med. 2011, 30, 86–92. [Google Scholar]
- Taylor, D.S.; Coryell, C.A. The magnetic susceptibility of the iron in ferrohemoglobin. J. Am. Chem. Soc. 1938, 60, 1177. [Google Scholar] [CrossRef]
- Segal, S. Regulation of blood flow in the microcirculation. Microcirculation 2005, 12, 33–45. [Google Scholar] [PubMed]
- Marshall, J.M. The influence of the sympathetic nervous system on individual vessels of the microcirculation of skeletal muscle of the rat. J. Physiol. 1982, 332, 169–186. [Google Scholar] [CrossRef] [PubMed]
- Hébert, M.T.; Marshall, J.M. Direct observations of responses of mesenteric microcirculation of the rat to circulating noradrenaline. J. Physiol. 1985, 368, 393–407. [Google Scholar]
- Østergaard, L.; Granfeldt, A.; Secher, N.; Tietze, A.; Iversen, N.K.; Jensen, M.S.; Andersen, K.K.; Nagenthiraja, K.; Gutiérrez-Lizardi, P.; Mouridsen, K.; et al. Microcirculatory dysfunction and tissue oxygenation in critical illness. Acta Anaesthesiol. Scand. 2015, 59, 1246–1259. [Google Scholar] [CrossRef]
- Zborowski, M.; Ostera, G.R.; Moore, L.R.; Milliron, S.; Chalmers, J.J.; Schechter, A.N. Red blood cell magnetophoresis. Biophys. J. 2003, 84, 2638–2645. [Google Scholar]
- Javadi Eshkalak, N.; Aminfar, H.; Mohammadpourfard, M.; Taheri, M.H.; Ahookhosh, K. Numerical investigation of blood flow and red blood cell rheology: The magnetic field effect. Electromagn. Biol. Med. 2022, 41, 129–141. [Google Scholar] [CrossRef]
- Farndale, R.W.; Maroudas, A.; Marsland, T.P. Effects of low-amplitude pulsed magnetic fields on cellular ion transport. Bioelectromagnetics 1987, 8, 119–134. [Google Scholar] [CrossRef]
- Kramer, I.; Vienken, K.; Vienken, J.; Zimmermann, U. Magneto-electro-fusion of human erythrocytes. Biochim. Biophys. Acta 1984, 772, 407–410. [Google Scholar] [CrossRef] [PubMed]
- Buchachenko, A.L.; Kuznetsov, D.A. Magnetic field affects enzymatic ATP synthesis. J. Am. Chem. Soc. 2008, 130, 12868–12869. [Google Scholar] [CrossRef]
- Sheu, S.S.; Beutner, G.; Yuh, H.J.; Goldenberg, I.; Moss, A. Low intensity magnetic fields stimulate the electron transport chain in heart mitochondria. Biophys. J. 2022, 121, S508A. [Google Scholar] [CrossRef]
- Zadeh-Haghighi, H.; Simon, C. Magnetic field effects in biology from the perspective of the radical pair mechanism. J. R. Soc. Interface 2022, 19, 20220325. [Google Scholar] [CrossRef] [PubMed]
- Oncul, S.; Cuce, E.M.; Aksu, B.; Inhan Garip, A. Effect of extremely low frequency electromagnetic fields on bacterial membrane. Int. J. Radiat. Biol. 2016, 92, 42–49. [Google Scholar] [CrossRef]
- Smith, T.; Wong-Gibbons, D.; Maultsby, J. Microcirculatory effects of pulsed electromagnetic fields. J. Orthop. Res. 2004, 22, 80–84. [Google Scholar] [CrossRef]
- Xu, S.; Okano, H.; Ohkubo, C. Acute effects of whole-body exposure to static magnetic fields and 50-Hz electromagnetic fields on muscle microcirculation in anesthetized mice. Bioelectrochemistry 2001, 53, 127–135. [Google Scholar] [CrossRef]
- Gmitrov, J.; Ohkubo, C.; Okano, H. Effect of 0.25 T static magnetic field on microcirculation in rabbits. Bioelectromagnetics 2002, 23, 224–249. [Google Scholar] [CrossRef]
- Gmitrov, J. Static magnetic field and verapamil effect on baroreflex stimulus-induced microcirculatory responses. Electromagn. Biol. Med. 2004, 23, 141–155. [Google Scholar] [CrossRef]
- Okano, H.; Gmitrov, J.; Ohkubo, C. Biphasic effects of static magnetic fields on cutaneous microcirculation in rabbits. Bioelectromagnetics 1999, 20, 161–171. [Google Scholar] [CrossRef]
- Okano, H.; Ohkubo, C. Anti-pressor effects of whole-body exposure to static magnetic field on pharmacologically induced hypertension in conscious rabbits. Bioelectromagnetics 2003, 24, 139–147. [Google Scholar] [CrossRef] [PubMed]
- Okano, H.; Ohkubo, C. Effects of static magnetic fields on plasma levels of angiotensin II and aldosterone associated with arterial blood pressure in genetically hypertensive rats. Bioelectromagnetics 2003, 24, 403–412. [Google Scholar] [CrossRef]
- Okano, H.; Ohkubo, C. Effects of neck exposure to 5.5 mT static magnetic field on pharmacologically modulated blood pressure in conscious rabbits. Bioelectromagnetics 2005, 26, 469–480. [Google Scholar] [CrossRef]
- Morris, C.; Skalak, T. Static magnetic fields alter arteriolar tone in vivo. Bioelectromagnetics 2005, 26, 1–9. [Google Scholar] [CrossRef]
- Gmitrov, J. Vascular mechanoreceptor magnetic activation, hemodynamic evidence and potential clinical outcomes. Electromagn. Biol. Med. 2025, 3, 1–22. [Google Scholar] [CrossRef]
- Gmitrov, J. Static magnetic field versus systemic calcium channel blockade effect on microcirculation: Possible mechanisms and clinical implementation. Bioelectromagnetics 2020, 41, 447–457. [Google Scholar] [CrossRef] [PubMed]
- Coste, B.; Mathur, J.; Schmidt, M.; Earley, T.J.; Ranade, S.; Petrus, M.J.; Dubin, A.E.; Patapoutian, A. Piezo1 and Piezo2 are essential components of distinct mechanically activated cation channels. Science 2010, 330, 55–60. [Google Scholar] [CrossRef]
- Milstein, D.M.; Helmers, R.; Hackmann, S.; Belterman, C.N.; van Hulst, R.A.; de Lange, J. Sublingual microvascular perfusion is altered during normobaric and hyperbaric hyperoxia. Microvasc. Res. 2016, 105, 93–102. [Google Scholar] [CrossRef]
- Schwarte, L.A.; Schober, P.; Loer, S.A. Benefits and harms of increased inspiratory oxygen concentrations. Curr. Opin. Anaesthesiol. 2019, 32, 783–791. [Google Scholar] [CrossRef] [PubMed]
- Orbegozo Cortés, D.; Puflea, F.; Donadello, K.; Taccone, F.S.; Gottin, L.; Creteur, J.; Vincent, J.L.; De Backer, D. Normobaric hyperoxia alters the microcirculation in healthy volunteers. Microvasc. Res. 2015, 98, 23–28. [Google Scholar] [PubMed]
- Kowalewska, P.M.; Kowalewski, J.E.; Milkovich, S.L.; Sové, R.J.; Wang, L.; Whitehead, S.N.; Ellis, C.G. Spectroscopy detects skeletal muscle microvascular dysfunction during onset of sepsis in a rat fecal peritonitis model. Sci. Rep. 2022, 12, 6339. [Google Scholar]
- Lam, C.; Tyml, K.; Martin, C.; Sibbald, W. Microvascular perfusion is impaired in a rat model of normotensive sepsis. J. Clin. Investig. 1994, 94, 2077–2083. [Google Scholar] [CrossRef]
- Ellis, C.G.; Bateman, R.M.; Sharpe, M.D.; Sibbald, W.J.; Gill, R. Effect of a maldistribution of microvascular blood flow on capillary O(2) extraction in sepsis. Am. J. Physiol.-Heart Circ. Physiol. 2002, 282, H156–H164. [Google Scholar]
- Bateman, R.M.; Sharpe, M.D.; Jagger, J.E.; Ellis, C.G. Sepsis impairs microvascular autoregulation and delays capillary response within hypoxic capillaries. Crit. Care 2015, 19, 389. [Google Scholar]


| Microvessel Diameter (μm) | Blood Volume | Average Velocity of RBCs * | |
|---|---|---|---|
| Microvessel Hct (%) | Plasma (%) (1 − Microvessel Hct) | ||
| 1100 | 40.5 | 59.5 | 100 |
| 750 | 40.1 | 59.9 | 101 |
| 450 | 39.8 | 60.2 | 103 |
| 250 | 39.2 | 60.8 | 106 |
| 95 | 33.6 | 66.4 | 135 |
| 50 | 28.0 | 72.0 | 175 |
| Steady-State (n = 20) | Septic Shock (n = 13) | p-Value | Cohen’s D | |
|---|---|---|---|---|
| Heart rate (bpm) | 67.5 (6.98) | 96.92 (23.5) | <0.001 | 1.89 |
| Systolic arterial pressure (mmHg) | 120 (7.43) | 116.92 (22.13) | 0.863 | 0.21 |
| Diastolic arterial pressure (mmHg) | 71.25 (7.41) | 66.54 (14.91) | 0.595 | 0.43 |
| Mean arterial pressure (mmHg) | 88.13 (6.97) | 83.62 (16.76) | 0.956 | 0.38 |
| Cardiac output (L min−1) | 5.04 (0.68) | 5.48 (1.01) | 0.16 | 0.55 |
| Cardiac index (L min−1 m−2) | 2.6 (0.3) | 2.75 (0.54) | 0.554 | 0.36 |
| Stroke volume (mL beat−1) | 74.7 (9.57) | 61.54 (26.04) | 0.001 | 0.74 |
| Stroke volume variation (%) | 5.9 (1.83) | 12.69 (5.14) | <0.001 | 1.94 |
| Systemic vascular resistance (dynes s cm−5) | 1306.3 (176.32) | 896.31 (247.49) | <0.001 | 1.98 |
| Central venous pressure (mmHg) | 7.05 (0.69) | 11.31 (4.29) | <0.001 | 1.56 |
| Mean circulatory filling pressure analogue (mmHg) | 13.06 (0.86) | 18.62 (4.61) | <0.001 | 1.89 |
| Cardiac power output (W) | 0.99 (0.17) | 1.01 (0.27) | 0.54 | 0.12 |
| Power (W) | 0.9 (0.16) | 0.87 (0.24) | 0.696 | 0.36 |
| Steady-State (n = 20) | Septic Shock (n = 13) | p-Value | Cohen’s D | |
|---|---|---|---|---|
| De Backer score (mm−1) | 3.7 (1.17) | 3.62 (1.19) | 0.754 | 0.07 |
| Consensus PPV (%) | 94.15 (5.66) | 60.2 (11.3) | <0.001 | 4.08 |
| Consensus PPV (small) (%) | 122.89 (146.74) | 50.57 (12.64) | <0.001 | 3.51 |
| Microvascular flow index (AUs) | 2.76 (0.25) | 1.83 (0.61) | <0.001 | 2.2 |
| Vessel diameter (μm) | 10.07 (5.02) | 4.35 (1.83) | <0.001 | 3.39 |
| Vessel length (μm) | 141 (154.25) | 42.54 (15.98) | <0.001 | 3.15 |
| Red blood cell velocity (μm s−1) | 15.69 (15.02) | 13.46 (12.45) | 0.519 | 0.25 |
| Wall shear stress (dyne cm−2) | 3.86 (2.68) | 0.72 (0.36) | <0.001 | 1.49 |
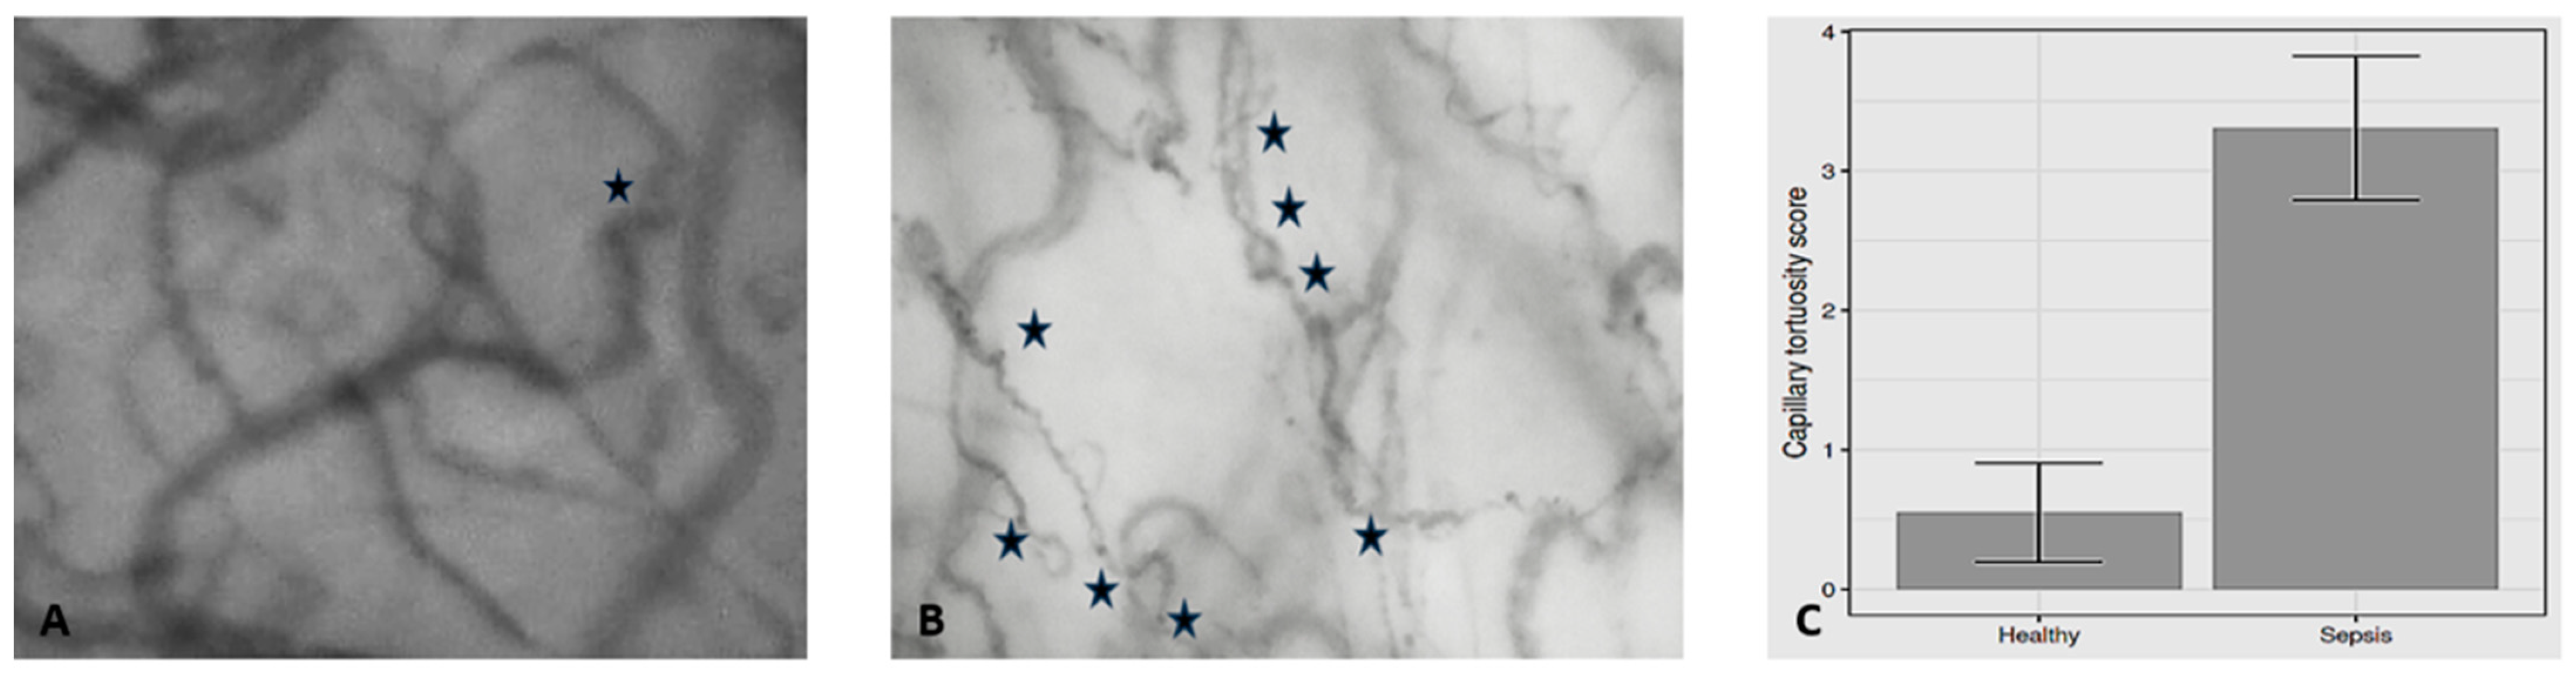
| Capillary tortuosity score | 0.55 (0.76) | 3.31 (0.86) | <0.001 | 3.46 |
| Steady-State (n = 20) | Septic Shock (n = 13) | p-Value | Cohen’s D | |
|---|---|---|---|---|
| Fraction of inspired oxygen | 0.31 (0.03) | 0.49 (0.16) | <0.001 | 1.71 |
| pH | 7.39 (0.02) | 7.32 (0.11) | 0.052 | 1.06 |
| Arterial partial pressure of oxygen (mmHg) | 92.5 (5.12) | 104.31 (38.73) | 0.971 | 0.48 |
| Arterial partial pressure of carbon dioxide (mmHg) | 39.2 (1.28) | 36.85 (6.44) | 0.64 | 0.57 |
| Venous–arterial carbon dioxide difference (mmHg) | 2.8 (0.89) | 9 (1.87) | <0.001 | 4.56 |
| Bicarbonate (mmol L−1) | 25.6 (0.99) | 21.19 (6.85) | 0.003 | 1.02 |
| Base deficit (mmol L−1) | 2.08 (0.19) | −0.19 (7.59) | 0.183 | 0.48 |
| Hemoglobin (g dL−1) | 14.06 (0.94) | 9.73 (1.83) | <0.001 | 3.2 |
| Lactate (mmol L−1) | 0.81 (0.15) | 3.45 (2.78) | <0.001 | 1.52 |
| A-a O2 gradient (mmHg) | 80.33 (25.43) | 198.46 (126.17) | <0.001 | 1.46 |
| Expected A-a O2 gradient for age (mmHg) | 13.95 (1.77) | 21.65 (2.24) | <0.001 | 3.92 |
| Peripheral oxygen saturation (%) | 99.6 (0.5) | 95.31 (4.01) | 0.001 | 1.7 |
| Arterial oxygen saturation (%) | 100 (0) | 96.77 (3.11) | <0.001 | 1.67 |
| Central venous oxygen saturation (%) | 74.15 (2.3) | 77.92 (6.12) | 0.015 | 0.9 |
| Oxygen extraction ratio (%) | 25.85 (2.3) | 19.31 (5.59) | 0.001 | 1.67 |
| Arterial oxygen content (vol%) | 19.7 (1.3) | 13.3 (2.41) | <0.001 | 3.53 |
| Venous oxygen content (vol%) | 14.73 (1.4) | 10.76 (2.27) | <0.001 | 2.22 |
| Venous–arterial oxygen content difference (vol%) | 4.96 (0.78) | 2.54 (0.74) | <0.001 | 3.17 |
| Oxygen delivery (mL min−1) | 973.88 (116.23) | 724.19 (160.4) | <0.001 | 1.85 |
| Oxygen consumption (mL min−1) | 247.43 (35.64) | 136.45 (41.54) | <0.001 | 2.92 |
| Convective oxygen flow (μm2 sec−1 kg−1) | 26.44 (39.96) | 1.1 (1.41) | <0.001 | 0.81 |
| Oxygen debt | −8.62 (1.13) | 13.23 (29.62) | 0.002 | 1.18 |
Disclaimer/Publisher’s Note: The statements, opinions and data contained in all publications are solely those of the individual author(s) and contributor(s) and not of MDPI and/or the editor(s). MDPI and/or the editor(s) disclaim responsibility for any injury to people or property resulting from any ideas, methods, instructions or products referred to in the content. |
© 2025 by the author. Licensee MDPI, Basel, Switzerland. This article is an open access article distributed under the terms and conditions of the Creative Commons Attribution (CC BY) license (https://creativecommons.org/licenses/by/4.0/).
Share and Cite
Chalkias, A. On the Intensity of the Microvascular Magnetic Field in Normal State and Septic Shock. J. Clin. Med. 2025, 14, 2496. https://doi.org/10.3390/jcm14072496
Chalkias A. On the Intensity of the Microvascular Magnetic Field in Normal State and Septic Shock. Journal of Clinical Medicine. 2025; 14(7):2496. https://doi.org/10.3390/jcm14072496
Chicago/Turabian StyleChalkias, Athanasios. 2025. "On the Intensity of the Microvascular Magnetic Field in Normal State and Septic Shock" Journal of Clinical Medicine 14, no. 7: 2496. https://doi.org/10.3390/jcm14072496
APA StyleChalkias, A. (2025). On the Intensity of the Microvascular Magnetic Field in Normal State and Septic Shock. Journal of Clinical Medicine, 14(7), 2496. https://doi.org/10.3390/jcm14072496