
Prognostic Value of Systemic Immune Inflammation Index in Squamous Cell Lung Cancer

 , and
, and
Abstract
1. Introduction
2. Materials and Methods
2.1. Patients
2.2. Collection of Clinical Data
2.3. Neutrophil-to-Lymphocyte Ratio (NLR), Platelet-to-Lymphocyte Ratio (PLR), and Systemic Immune-Inflammation Index (SII) Evaluation
2.4. Statistical Analysis
3. Results
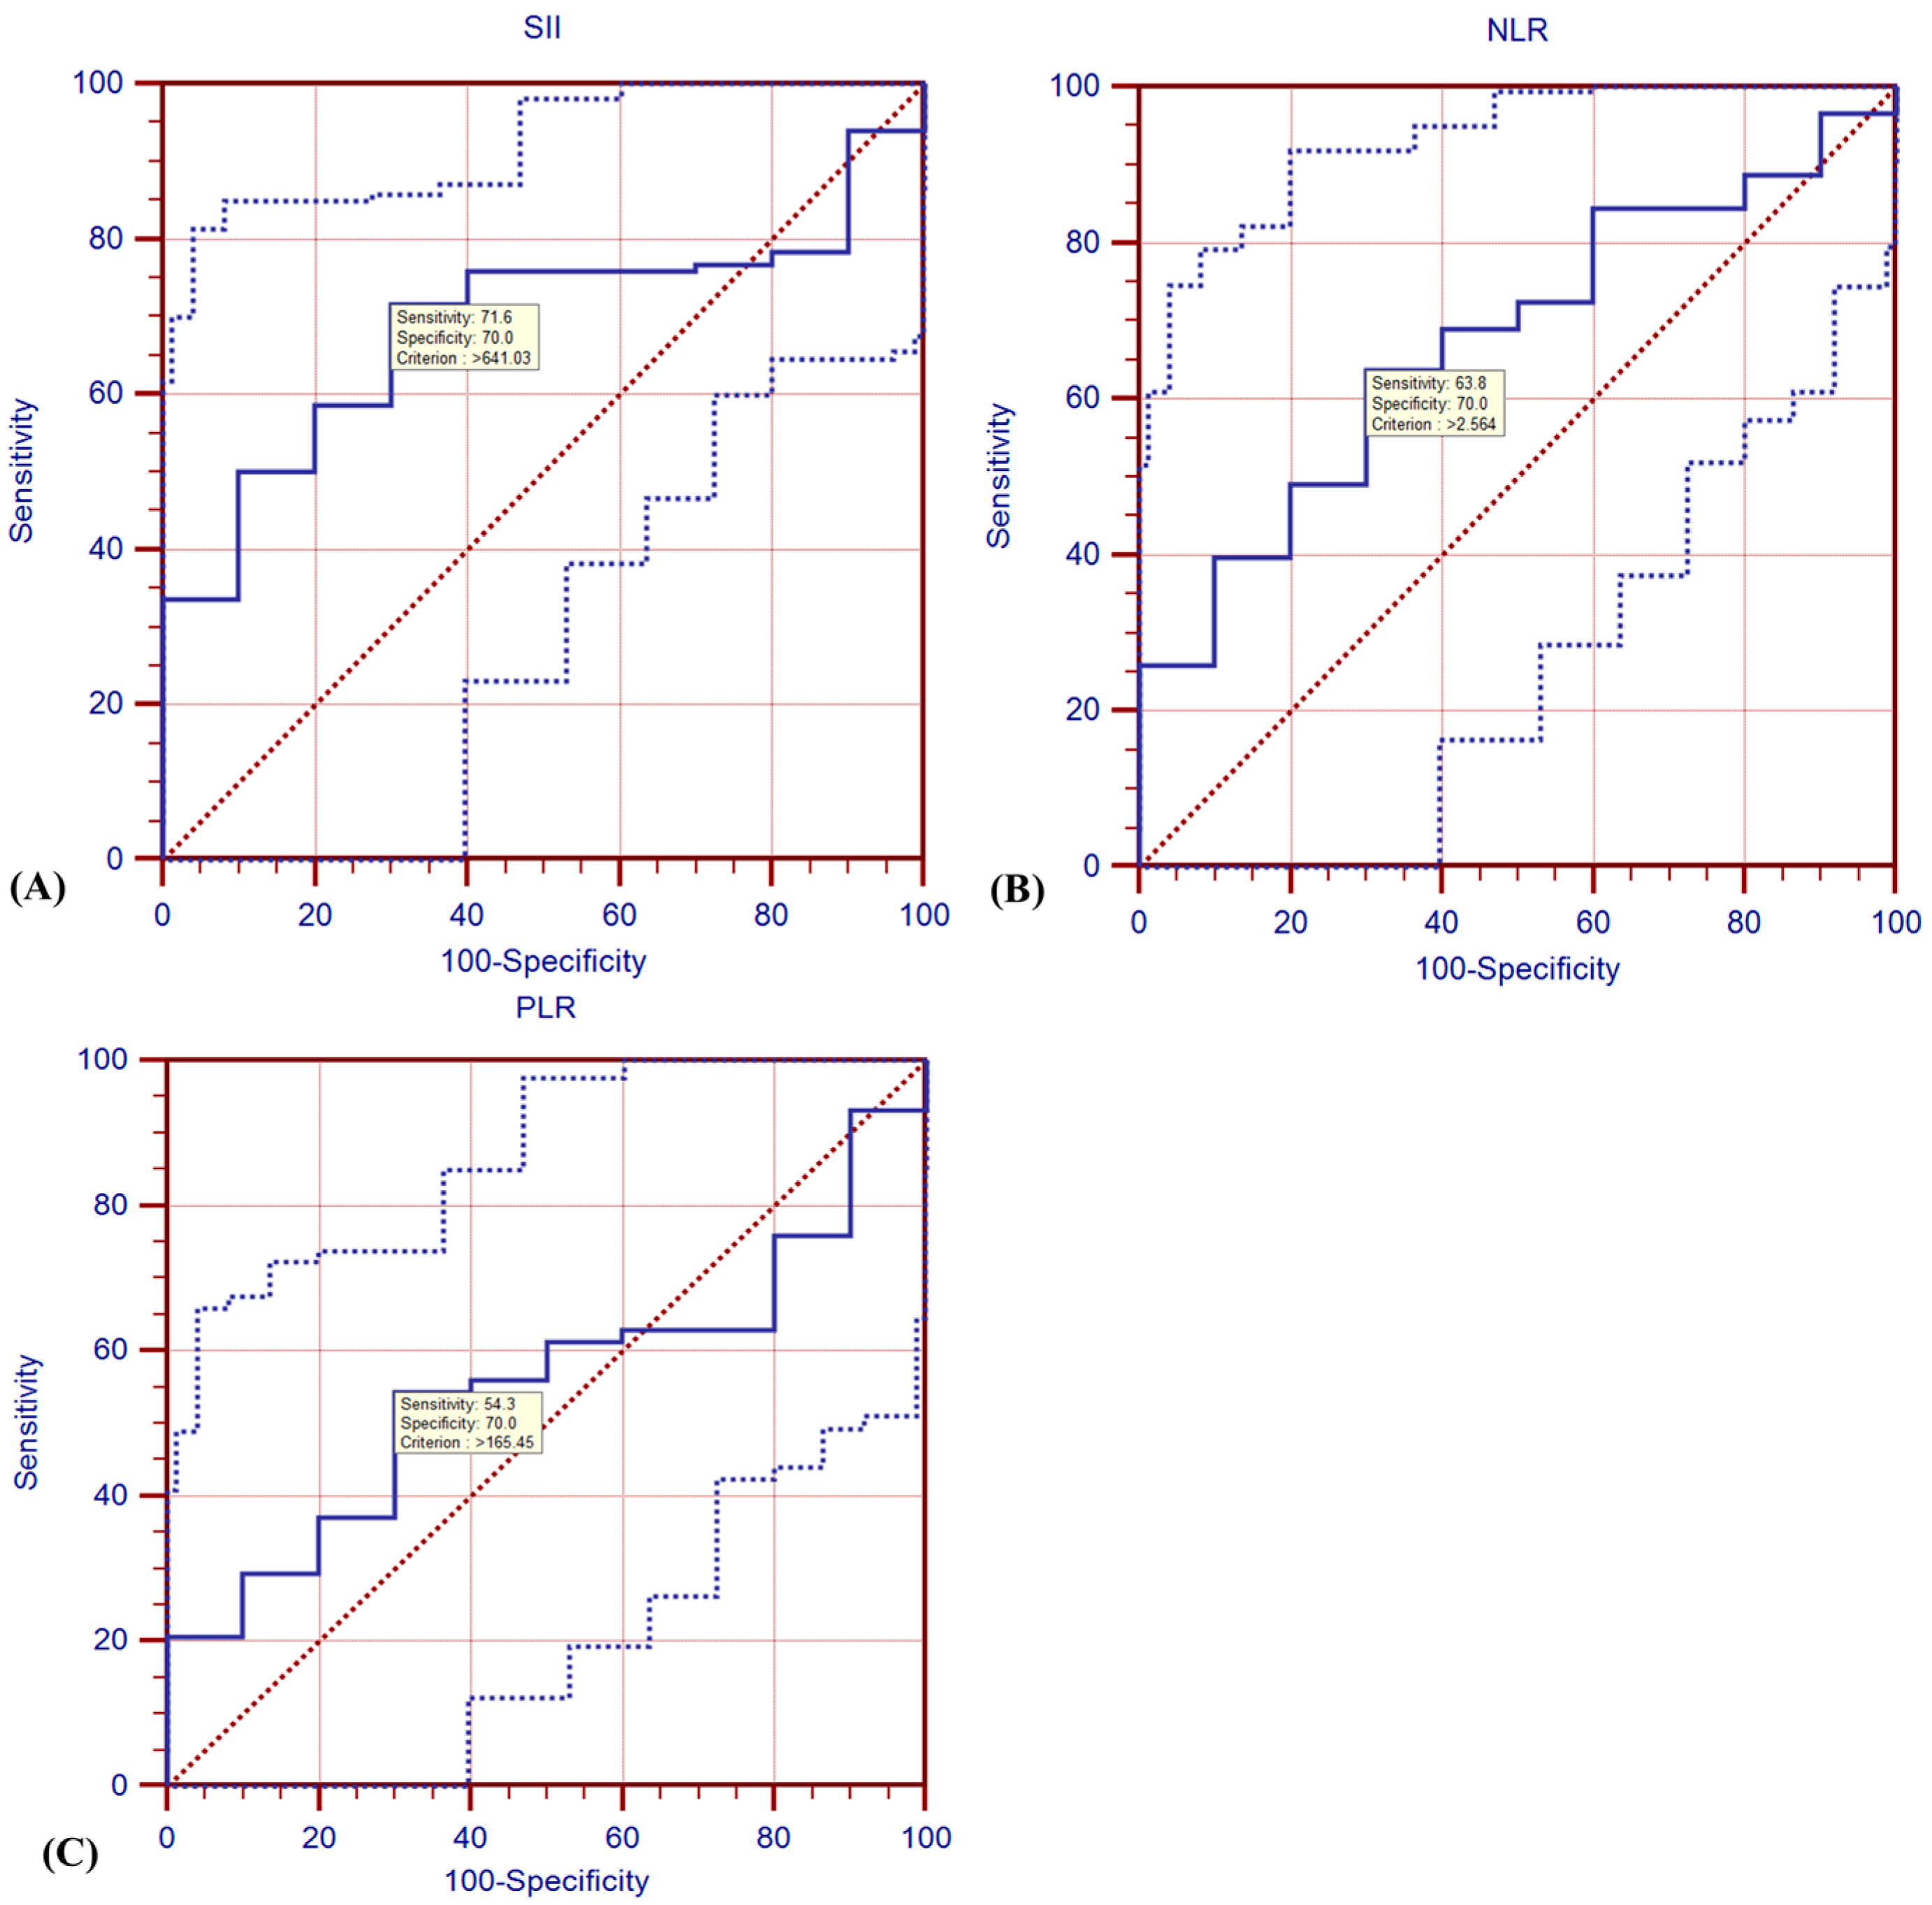
3.1. ROC Analysis
3.2. Cox Regression Model
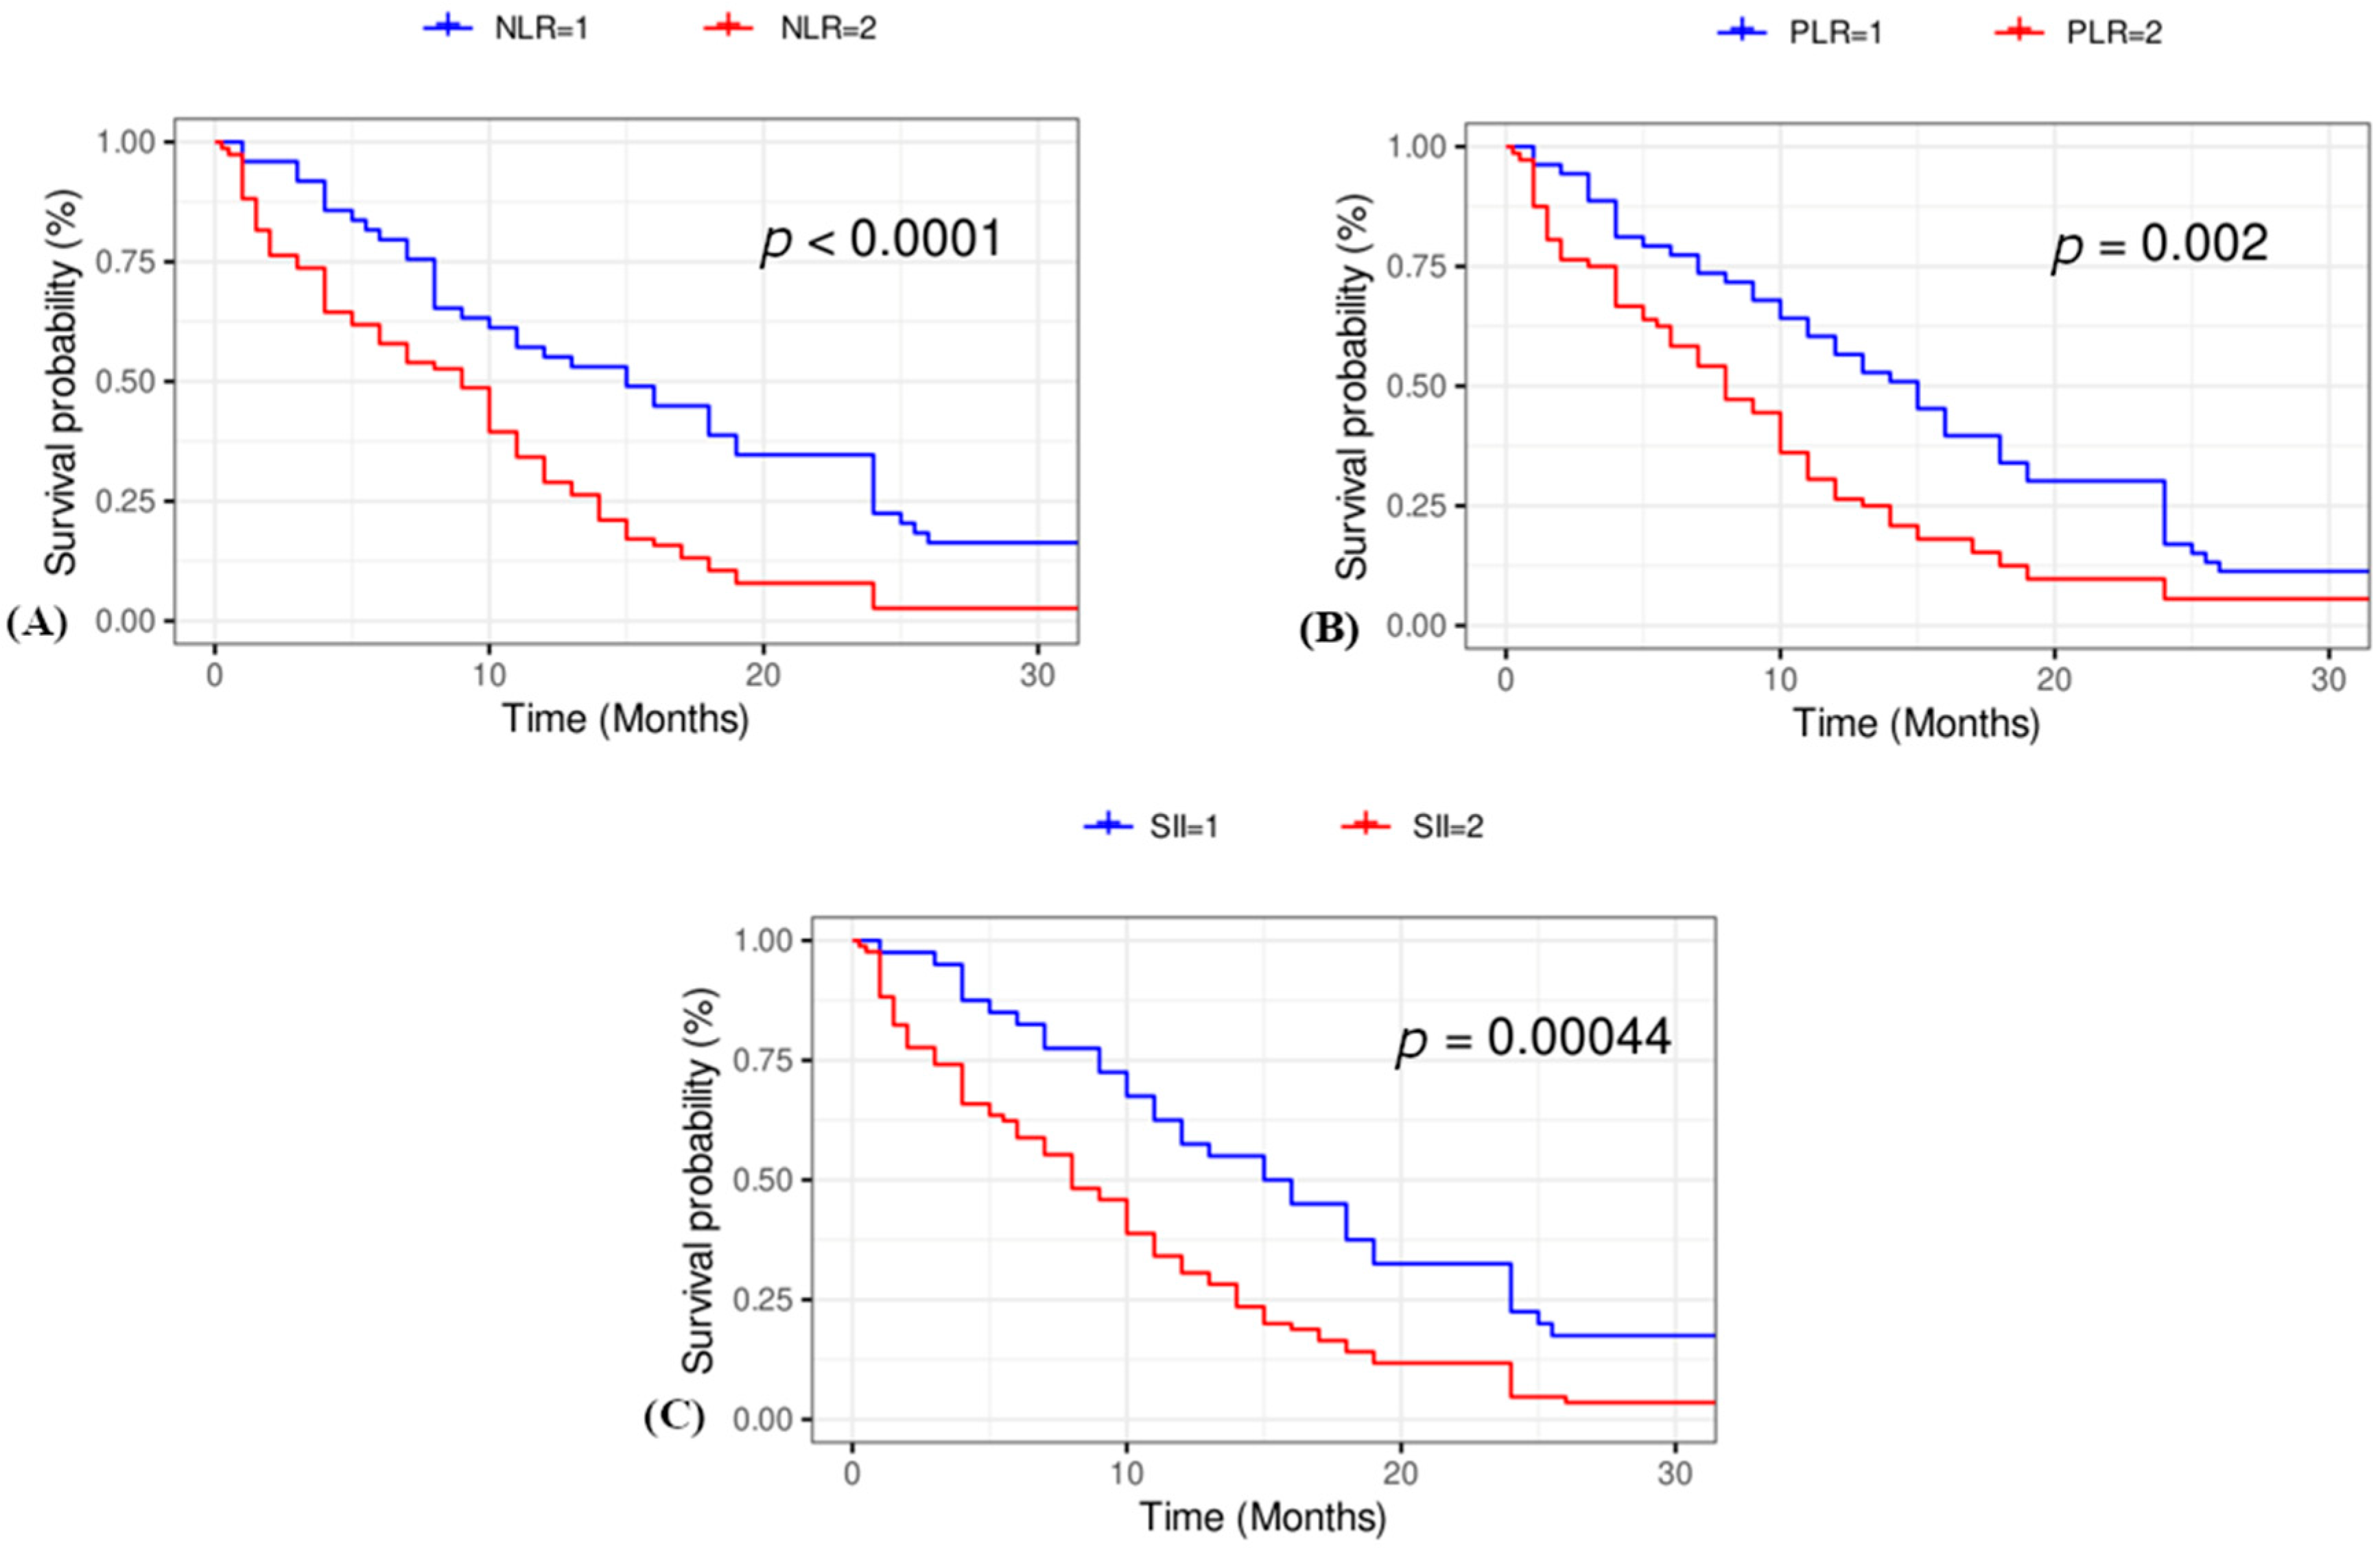
3.3. Kaplan–Meier Survival Curves
4. Discussion
5. Conclusions
Author Contributions
Funding
Institutional Review Board Statement
Informed Consent Statement
Data Availability Statement
Conflicts of Interest
Abbreviations
| SII | Systemic immune-inflammation index |
| NLR | Neutrophil-to-lymphocyte ratio |
| PLR | Platelet-to-lymphocyte ratio |
| ROC | Receiver operating characteristic |
| SCC | Squamous cell carcinoma |
| NSCLC | Non-small cell lung cancer |
| ICB | Immune checkpoint blockade |
| PD-1 | Programmed cell death protein 1 |
| PD-L1 | Programmed death-ligand 1 |
| SCCA | Squamous cell carcinoma antigen |
References
- Kristina Gregory, N.; Lisa Hang, M.; Aisner, D.L.; Akerley, W.; Bauman, J.R.; Bruno, D.S.; Chang, J.Y.; Chirieac, L.R.; DeCamp, M.; Desai, A.P.; et al. NCCN Guidelines Version 7.2024 Non-Small Cell Lung Cancer Continue NCCN Guidelines Panel Disclosures; National Comprehensive Cancer Network: Plymouth Meeting, PA, USA, 2024. [Google Scholar]
- Friedlaender, A.; Banna, G.; Malapelle, U.; Pisapia, P.; Addeo, A. Next Generation Sequencing and Genetic Alterations in Squamous Cell Lung Carcinoma: Where Are We Today? Front. Oncol. 2019, 9, 166. [Google Scholar]
- Patel, A.; Goldstein, D.A.; Tannock, I.F. Improving Access to Immunotherapy in Low- and Middle-Income Countries. Ann. Oncol. 2022, 33, 360–361. [Google Scholar] [CrossRef] [PubMed]
- Hanahan, D.; Weinberg, R.A. Hallmarks of Cancer: The next Generation. Cell 2011, 144, 646–674. [Google Scholar] [CrossRef] [PubMed]
- Gomes, M.; Teixeira, A.L.; Coelho, A.; Araújo, A.; Medeiros, R. The Role of Inflammation in Lung Cancer. Adv Exp Med Biol. 2014, 816, 1–23. [Google Scholar]
- Diakos, C.I.; Charles, K.A.; McMillan, D.C.; Clarke, S.J. Cancer-Related Inflammation and Treatment Effectiveness. Lancet Oncol. 2014, 15, e493–e503. [Google Scholar]
- Qiu, X.; Nair, M.G.; Jaroszewski, L.; Godzik, A. Deciphering Abnormal Platelet Subpopulations in COVID-19, Sepsis and Systemic Lupus Erythematosus through Machine Learning and Single-Cell Transcriptomics. Int. J. Mol. Sci. 2024, 25, 5941. [Google Scholar] [CrossRef] [PubMed]
- Wang, L.; Wang, X.; Guo, E.; Mao, X.; Miao, S. Emerging Roles of Platelets in Cancer Biology and Their Potential as Therapeutic Targets. Front. Oncol. 2022, 12, 939089. [Google Scholar] [CrossRef]
- Łochowski, M.; Chałubińska-Fendler, J.; Zawadzka, I.; Łochowska, B.; Rębowski, M.; Brzeziński, D.; Kozak, J. The Prognostic Significance of Preoperative Platelet-to-Lymphocyte and Neutrophil-to-Lymphocyte Ratios in Patients Operated for Non-Small Cell Lung Cancer. Cancer Manag. Res. 2021, 13, 7795–7802. [Google Scholar] [CrossRef]
- Mizuguchi, S.; Izumi, N.; Tsukioka, T.; Komatsu, H.; Nishiyama, N. Neutrophil-Lymphocyte Ratio Predicts Recurrence in Patients with Resected Stage 1 Non-Small Cell Lung Cancer. J. Cardiothorac. Surg. 2018, 13, 78. [Google Scholar] [CrossRef]
- Toda, M.; Tsukioka, T.; Izumi, N.; Komatsu, H.; Okada, S.; Hara, K.; Miyamoto, H.; Ito, R.; Shibata, T.; Nishiyama, N. Platelet-to-Lymphocyte Ratio Predicts the Prognosis of Patients with Non-Small Cell Lung Cancer Treated with Surgery and Postoperative Adjuvant Chemotherapy. Thorac. Cancer 2018, 9, 112–119. [Google Scholar] [CrossRef]
- Yang, R.; Chang, Q.; Meng, X.; Gao, N.; Wang, W. Prognostic Value of Systemic Immune-Inflammation Index in Cancer: A Meta-Analysis. J. Cancer 2018, 9, 3295–3302. [Google Scholar] [CrossRef] [PubMed]
- Huang, W.; Luo, J.; Wen, J.; Jiang, M. The Relationship Between Systemic Immune Inflammatory Index and Prognosis of Patients With Non-Small Cell Lung Cancer: A Meta-Analysis and Systematic Review. Front. Surg. 2022, 9, 898304. [Google Scholar] [CrossRef] [PubMed]
- Bates, I. 2—Reference Ranges and Normal Values. In Dacie and Lewis Practical Haematology, 12th ed.; Bain, B.J., Bates, I., Laffan, M.A., Eds.; Elsevier: Amsterdam, The Netherlands, 2017; pp. 8–17. ISBN 978-0-7020-6696-2. [Google Scholar]
- Tsukioka, T.; Izumi, N.; Komatsu, H.; Inoue, H.; Ito, R.; Suzuki, S.; Nishiyama, N. Elevation of Neutrophil-to-Lymphocyte Ratio Is a Significant Poor Prognostic Factor in Completely Resected Centrally Located Lung Squamous Cell Carcinoma. In Vivo 2022, 36, 2303–2307. [Google Scholar] [CrossRef]
- Li, X.; Gu, L.; Chen, Y.; Chong, Y.; Wang, X.; Guo, P.; He, D. Systemic Immune-Inflammation Index Is a Promising Non-Invasive Biomarker for Predicting the Survival of Urinary System Cancers: A Systematic Review and Meta-Analysis. Ann. Med. 2021, 53, 1827–1838. [Google Scholar] [CrossRef]
- Ohashi, K.; Nishito, Y.; Fukuda, H.; Sadahiro, R.; Yoshida, Y.; Watanabe, S.; Motoi, N.; Sonobe, Y.; Mizuno, H.; Tsunoda, H.; et al. Neutrophil-to-Lymphocyte Ratio Is a Prognostic Factor Reflecting Immune Condition of Tumor Microenvironment in Squamous Cell Lung Cancer. Sci. Rep. 2024, 14, 429. [Google Scholar] [CrossRef] [PubMed]
- Yao, Y.; Yuan, D.; Liu, H.; Gu, X.; Song, Y. Pretreatment Neutrophil to Lymphocyte Ratio Is Associated with Response to Therapy and Prognosis of Advanced Non-Small Cell Lung Cancer Patients Treated with First-Line Platinum-Based Chemotherapy. Cancer Immunol. Immunother. 2013, 62, 471–479. [Google Scholar] [CrossRef]
- Romano, F.J.; Ronga, R.; Ambrosio, F.; Arundine, D.; Longo, V.; Galetta, D.; Gridelli, C.; Maione, P.; Palma, V.; Damiano, V.; et al. Neutrophil-to-Lymphocyte Ratio Is a Major Prognostic Factor in Non-Small Cell Lung Carcinoma Patients Undergoing First Line Immunotherapy With Pembrolizumab. Cancer Diagn. Progn. 2022, 3, 44–52. [Google Scholar] [CrossRef]
- Molinier, O.; Goupil, F.; Debieuvre, D.; Auliac, J.-B.; Jeandeau, S.; Lacroix, S.; Martin, F.; Grivaux, M. Five-Year Survival and Prognostic Factors According to Histology in 6101 Non-Small-Cell Lung Cancer Patients. Respir. Med. Res. 2020, 77, 46–54. [Google Scholar] [CrossRef]
- Pezzella, F. Early Squamous Cell Lung Carcinoma: Prognostic Biomarkers for the Many. Thorax 2019, 74, 527–528. [Google Scholar] [CrossRef]
- Erciyestepe, M.; Selvi, O.; Dinc Sonusen, S.; Ozturk, A.E.; Dinc, G.; Gunes, T.K.; Aydln, O.; Yasar, N.; Balkaya Aykut, G.; Vatansever, S. Prognostic Value of Inflammation and Nutrition-Based Scores in Non-Small Cell Lung Cancer. Med. Princ. Pract. 2023, 33, 122–132. [Google Scholar] [CrossRef]
- Cao, H.; Shi, H.; Zhao, M.; Liu, Z.; Qian, J. Prognostic Value of the Combined Preoperative Plasma Fibrinogen and Systemic Inflammatory Indexes in ESCC Patients. Discov. Oncol. 2023, 14, 143. [Google Scholar] [CrossRef] [PubMed]
- Yu, L.; Jiang, R.; Chen, W.; Liu, Y.; Wang, G.; Gong, X.; Wang, Y. Novel Prognostic Indicator Combining Inflammatory Indicators and Tumor Markers for Gastric Cancer. World J. Surg. Oncol. 2023, 21, 50. [Google Scholar] [CrossRef] [PubMed]
- Shoji, F. Clinical Impact of the Systemic Immune-Inflammation Index in Non-Small Cell Lung Cancer Patients. Ann. Transl. Med. 2020, 8, 668. [Google Scholar] [CrossRef] [PubMed]
- Mahat, R.K.; Panda, S.; Rathore, V.; Swain, S.; Yadav, L.; Sah, S.P. The Dynamics of Inflammatory Markers in Coronavirus Disease-2019 (COVID-19) Patients: A Systematic Review and Meta-Analysis. Clin. Epidemiol. Glob. Health 2021, 11, 100727. [Google Scholar] [CrossRef]


| Variable | |
|---|---|
| Age, mean | 69.10 ± 6.83 |
| Sex | |
| Male | 120 (89.55%) |
| Female | 14 (10.45%) |
| Smoking history | |
| No | 24 (17.91%) |
| Yes | 110 (82.09%) |
| Stage | |
| I | 3 (2.24%) |
| II | 15 (11.19%) |
| III | 65 (48.51%) |
| IV | 51 (38.06%) |
| Progression | |
| No | 27 (20.61%) |
| Yes | 104 (79.39%) |
| Survival | |
| Yes | 11 (8.40%) |
| No | 120 (91.60%) |
| Lymphocytes, mean (×10⁹/L) | 1.80 ± 0.92 |
| Monocytes, mean (×10⁹/L) | 0.71 ± 0.38 |
| Neutrophils, mean (×10⁹/L) | 6.82 ± 4.63 |
| Thrombocytes, mean (×10⁹/L) | 333.25 ± 146.07 |
| Time to progression, months, mean | 9.80 ± 8.86 |
| Overall survival, months, mean | 12.01 ± 9.17 |
| SII, median | 981.72 (522.91–2276.86) |
| NLR, median | 3.22 (2.12–5.89) |
| PLR, median | 172.00 (124.17–279.34) |
| Variable | Lymphocytes (Mean) * (×10⁹/L) | p Value | Monocytes (Mean) * (×10⁹/L) | p Value | Neutrophils (Mean) * (×10⁹/L) | p Value | Thrombocytes (Mean) * (×10⁹/L) | p Value | SII (Median) # | p Value | NLR (Median)# | p Value | PLR (Median) # | p Value | |
|---|---|---|---|---|---|---|---|---|---|---|---|---|---|---|---|
| Sex | Male | 1.80 ± 0.93 | 0.96 | 0.72 ± 0.04 | 0.54 | 6.74 ± 4.75 | 0.62 | 327.56 ± 143.61 | 0.19 | 908.26 (522.91–2204.26) | 0.31 | 3.16 (2.12–5.89) | 0.45 | 166.96 (127.17–276.32) | 0.41 |
| Female | 1.79 ± 0.90 | 0.65 ± 0.12 | 7.39 ± 3.51 | 380.79 ± 163.08 | 1479.92 (576.50–2517.50 | 4.03 (2.85–5.07) | 212.07 (131.32–346.84) | ||||||||
| Smoking history | Yes | 1.85 ± 0.95 | 0.24 | 0.72 ± 0.04 | 0.75 | 7.01 ± 4.82 | 0.33 | 332.03 ± 150.12 | 0.84 | 1070.44 (522.67–2262.50) | 0.97 | 3.25 (2.14–5.89) | 0.56 | 171.01 (118.29–276.32) | 0.33 |
| No | 1.58 ± 0.78 | 0.69 ± 0.07 | 5.99 ± 3.62 | 338.71 ± 129.20 | 864.25 (598.97–2392.22) | 2.69 (1.90–6.18) | 197.13 (135.02–313.05) | ||||||||
| Stage | I | 1.72 ± 0.21 | 0.215 | NA | 0.15 | 5.04 ± 2.65 | 0.51 | 240.33 ± 38.42 b | 0.52 | 641.03 (506.29–813.21 | 0.098 | 2.56 (1.86–4.11) | 0.54 | 160.26 (101.02–165.45) | 0.009 |
| II | 2.09 ± 0.83 | 0.64 a | 6.20 ± 3.51 | 299.36 ± 140.83 | 637.27 (446.40–1383.71) | 2.24 (1.99–3.97) | 137.06 (105.23–176.37) | ||||||||
| III | 1.90 ± 0.71 | 0.68 ± 0.38 | 6.44 ± 4.66 | 337.42 ± 135.61 | 908.26 (576.50–1677.72) | 2.81 (2.05–4.92) | 171.01 (118.29–262.84) | ||||||||
| IV | 1.59 ± 1.16 | 0.75 ± 0.40S | 7.55 ± 4.89 | 342.98 ± 163.28 | 1697.06 (535.38–3619.08) | 4.80 (2.85–8.30) | 240.99 (138.67–372.57) | ||||||||
| Progression | Yes | 1.77 ± 0.39 | 0.56 | 0.73 ± 0.04 | 0.36 | 7.05 ± 4.91 | 0.37 | 337.48 ± 150.04 | 0.53 | 1004.17 (568.70–2517.50) | 0.29 | 3.25 (2.17–5.89) | 0.22 | 195.83 (128.67–280.77) | 0.19 |
| No | 1.94 ± 0.88 | 0.63 ± 0.12 | 6.13 ± 3.33 | 317.77 ± 134.99 | 751.20 (458.50–1349.47) | 2.56 (2.03–4.50) | 153.31 (113.33–237.74) | ||||||||
| Survival | No | 1.81 ± 0.94 | 0.69 | 0.74 ± 0.37 | 0.002 | 7.12 ± 4.72 | 0.04 | 340.60 ± 150.13 | 0.07 | 1070.39 (572.60–2532.01) | 0.046 | 3.24 (2.14–6.92) | 0.068 | 179.28 (123.22–280.06) | 0.575 |
| Yes | 1.69 ± 0.66 | 0.21 ± 0.16 | 4.00 ± 1.89 | 257.73 ± 72.61 | 529.36 (506.29–878.94) | 2.30 (1.86–3.35) | 154.89 (141.33–237.74) |
| Univariate Cox Regression | Multivariate Cox Regression | ||||
|---|---|---|---|---|---|
| HR (95% CI) | p-value | HR (95% CI) | p-value | ||
| Age | 1.02 (0.99–1.05) | 0.183 | |||
| Smoking history | No | 1 | |||
| Yes | 1.18 (0.74–1.86) | 0.487 | |||
| Sex | Male | 1 | |||
| Female | 1.25 (0.70–2.22) | 0.451 | |||
| PLR | 1 | 1 | |||
| 2 | 1.23 (1.06–1.44) | 0.007 | 1.19 (0.73–1.95) | 0.478 | |
| NLR | 1 | 1 | |||
| 2 | 1.38 (1.12–1.71) | 0.003 | 1.54 (0.90–2.62) | 0.113 | |
| SII | 1 | 1 | |||
| 2 | 1.39 (1.09–1.77) | 0.001 | 1.53 (0.81–2.88) | 0.192 | |
| Model 1 | HR | 95% CI | p Value |
|---|---|---|---|
| SII | 1.449 | 1.134–1.851 | 0.003 |
| Age | 1.008 | 0.981–1.036 | 0.546 |
| Smoking history (Ref: No) | 0.698 | 0.439–1.111 | 0.13 |
| Sex (Ref: Male) | 0.687 | 0.382–1.234 | 0.209 |
| Model 2 | |||
| NLR | 1.439 | 1.159–1.788 | 0.001 |
| Age | 1.005 | 0.978–1.032 | 0.73 |
| Smoking history (Ref: No) | 0.663 | 0.414–1.063 | 0.088 |
| Sex (Ref: Male) | 0.726 | 0.405–1.303 | 0.283 |
| Model 3 | |||
| PLR | 1.335 | 1.13–1.578 | 0.001 |
| Age | 1.005 | 0.978–1.032 | 0.733 |
| Smoking history (Ref: No) | 0.59 | 0.357–0.976 | 0.04 |
| Sex (Ref: Male) | 0.679 | 0.378–1.22 | 0.196 |
Disclaimer/Publisher’s Note: The statements, opinions and data contained in all publications are solely those of the individual author(s) and contributor(s) and not of MDPI and/or the editor(s). MDPI and/or the editor(s) disclaim responsibility for any injury to people or property resulting from any ideas, methods, instructions or products referred to in the content. |
© 2025 by the authors. Licensee MDPI, Basel, Switzerland. This article is an open access article distributed under the terms and conditions of the Creative Commons Attribution (CC BY) license (https://creativecommons.org/licenses/by/4.0/).
Share and Cite
Umihanic, S.; Novakovic, L.; Alidzanovic, L.; Kuduzovic, M.B.; Sehic, A.; Muhic, A.; Kovcic, A.; Selak, N. Prognostic Value of Systemic Immune Inflammation Index in Squamous Cell Lung Cancer. J. Clin. Med. 2025, 14, 2219. https://doi.org/10.3390/jcm14072219
Umihanic S, Novakovic L, Alidzanovic L, Kuduzovic MB, Sehic A, Muhic A, Kovcic A, Selak N. Prognostic Value of Systemic Immune Inflammation Index in Squamous Cell Lung Cancer. Journal of Clinical Medicine. 2025; 14(7):2219. https://doi.org/10.3390/jcm14072219
Chicago/Turabian StyleUmihanic, Sefika, Lora Novakovic, Lejla Alidzanovic, Medina Bandovic Kuduzovic, Anida Sehic, Almedina Muhic, Amila Kovcic, and Nejra Selak. 2025. "Prognostic Value of Systemic Immune Inflammation Index in Squamous Cell Lung Cancer" Journal of Clinical Medicine 14, no. 7: 2219. https://doi.org/10.3390/jcm14072219
APA StyleUmihanic, S., Novakovic, L., Alidzanovic, L., Kuduzovic, M. B., Sehic, A., Muhic, A., Kovcic, A., & Selak, N. (2025). Prognostic Value of Systemic Immune Inflammation Index in Squamous Cell Lung Cancer. Journal of Clinical Medicine, 14(7), 2219. https://doi.org/10.3390/jcm14072219