
Epidural Stimulation and Resistance Training (REST-SCI) for Overground Locomotion After Spinal Cord Injury: Randomized Clinical Trial Protocol

 ,
, 
Abstract
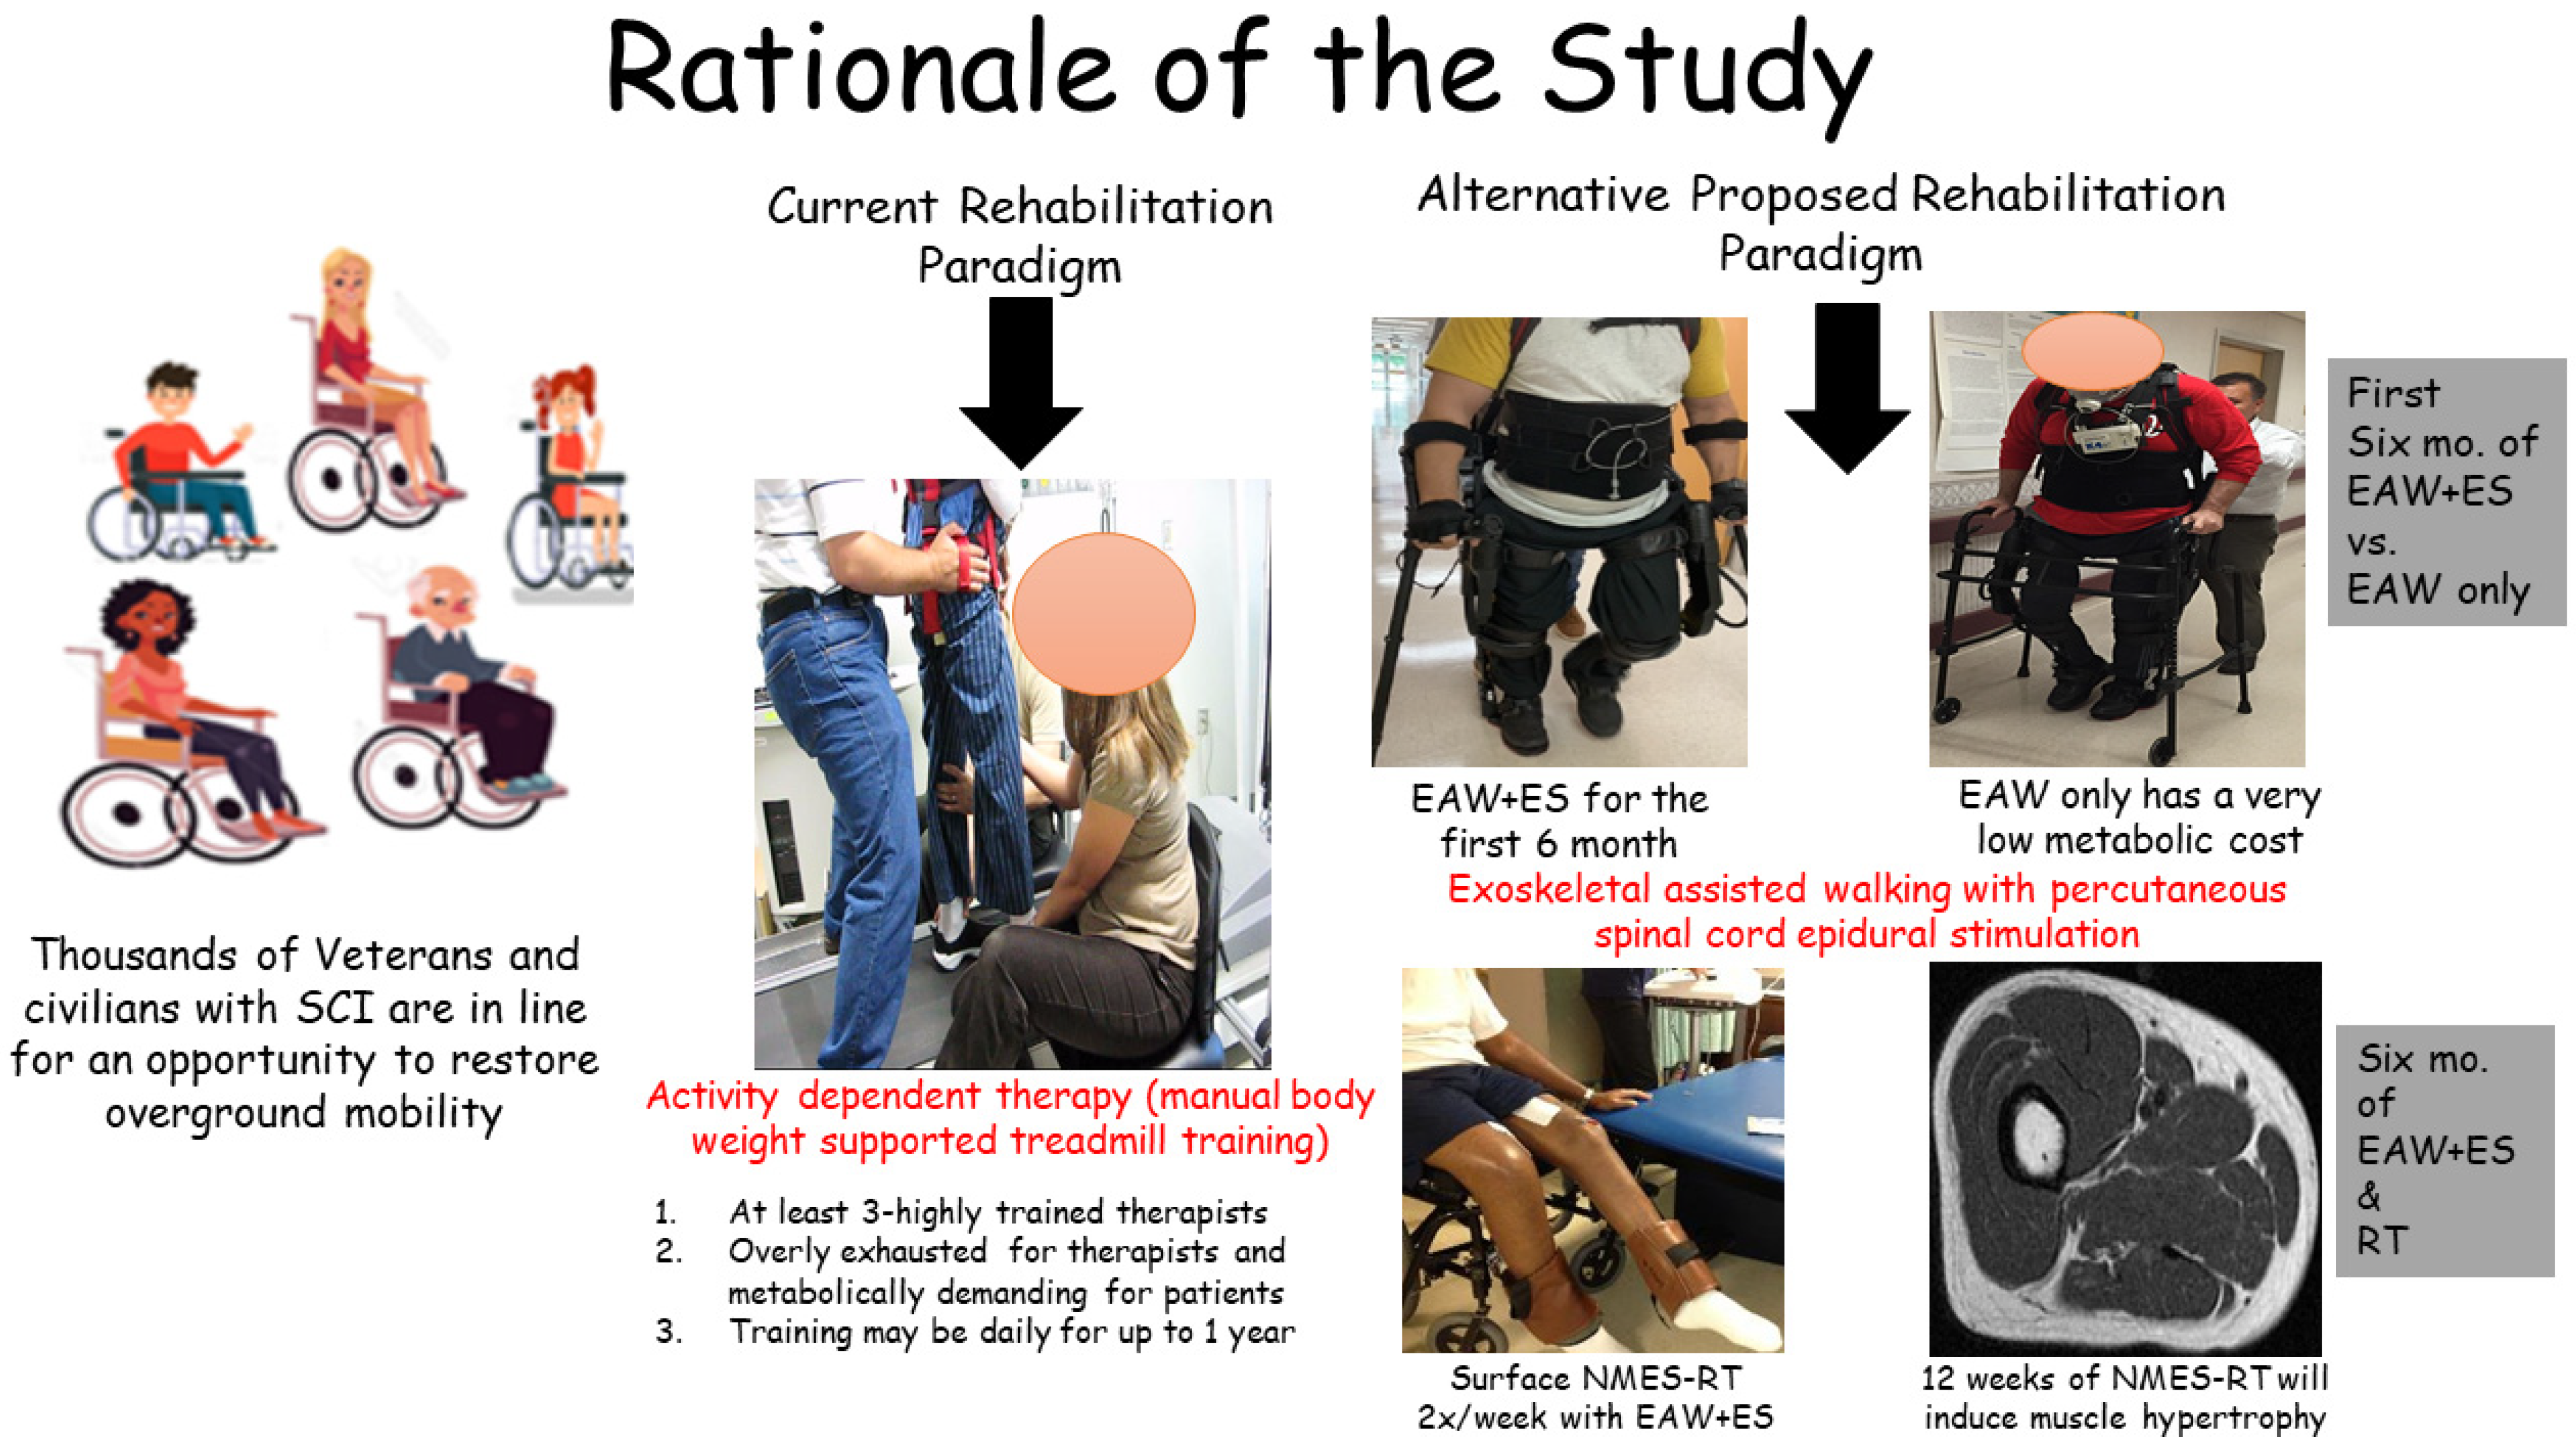
1. Background
2. Methods
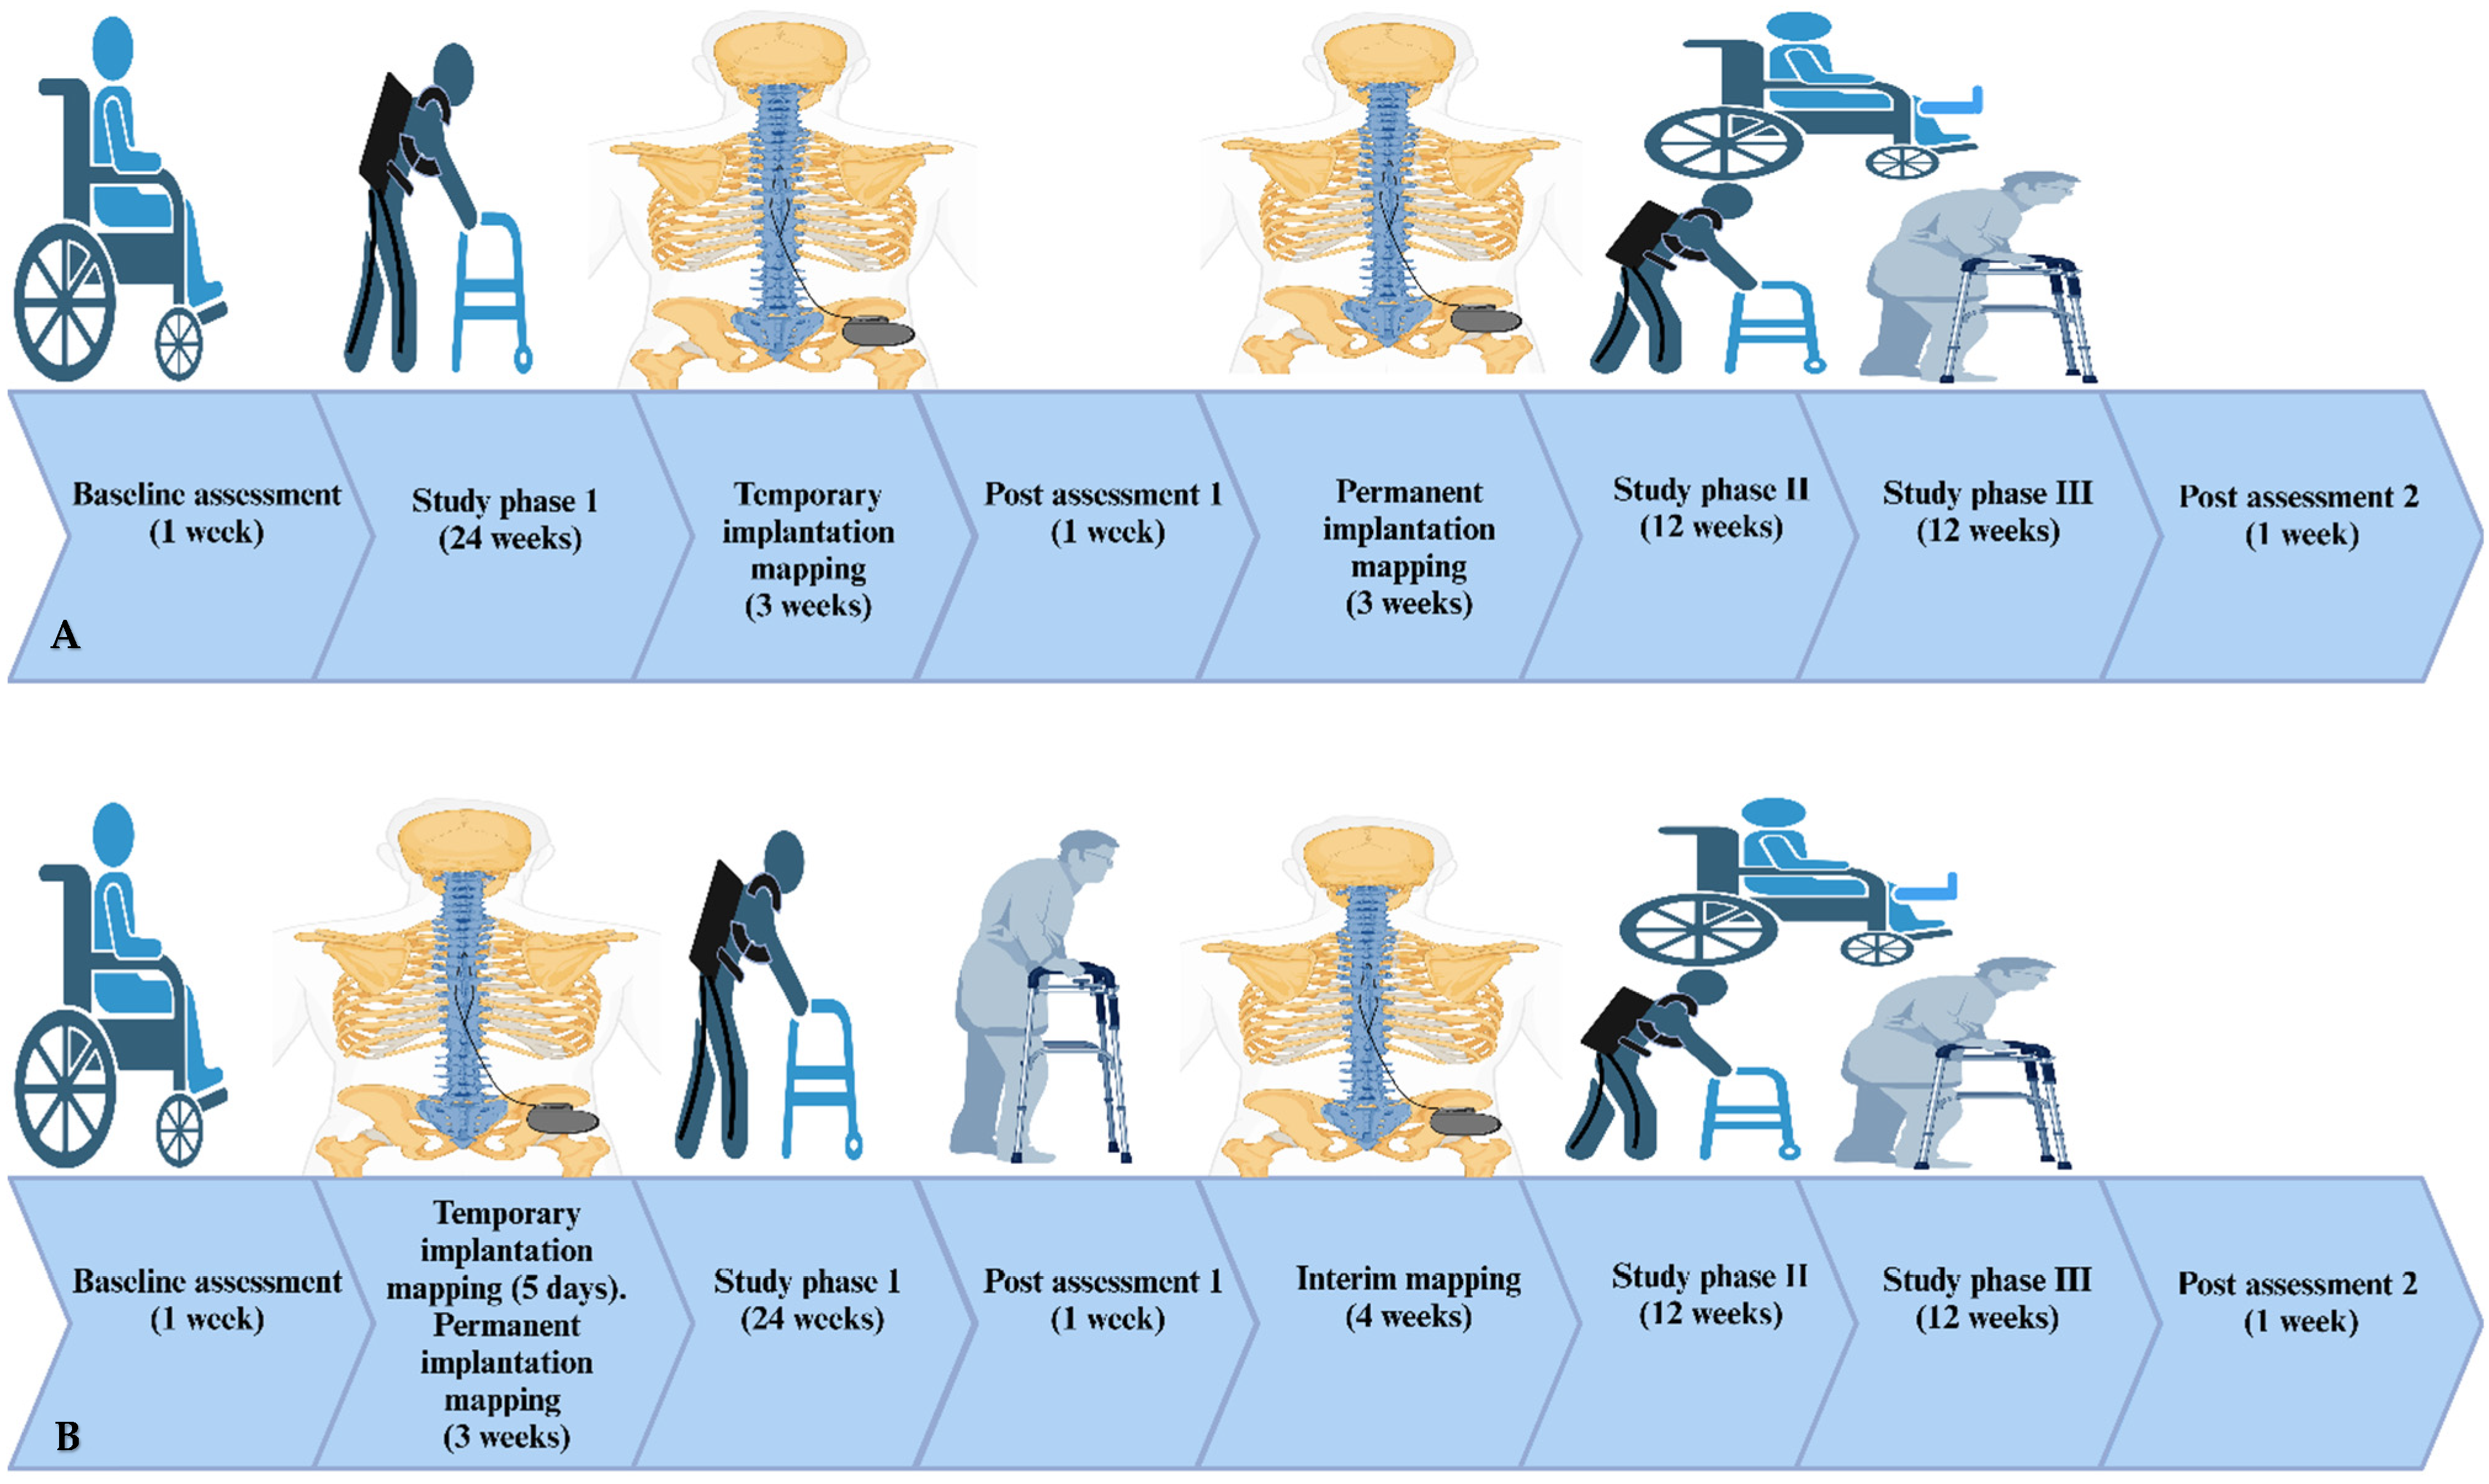
2.1. Study Design
2.2. Screening and Consenting
2.3. Randomization and Allocation
2.3.1. Implantation Procedures
- MRI
- b.
- Temporary Implantation
- c.
- Permanent Implantation and Recovery
- d.
- Spinal segmental mapping
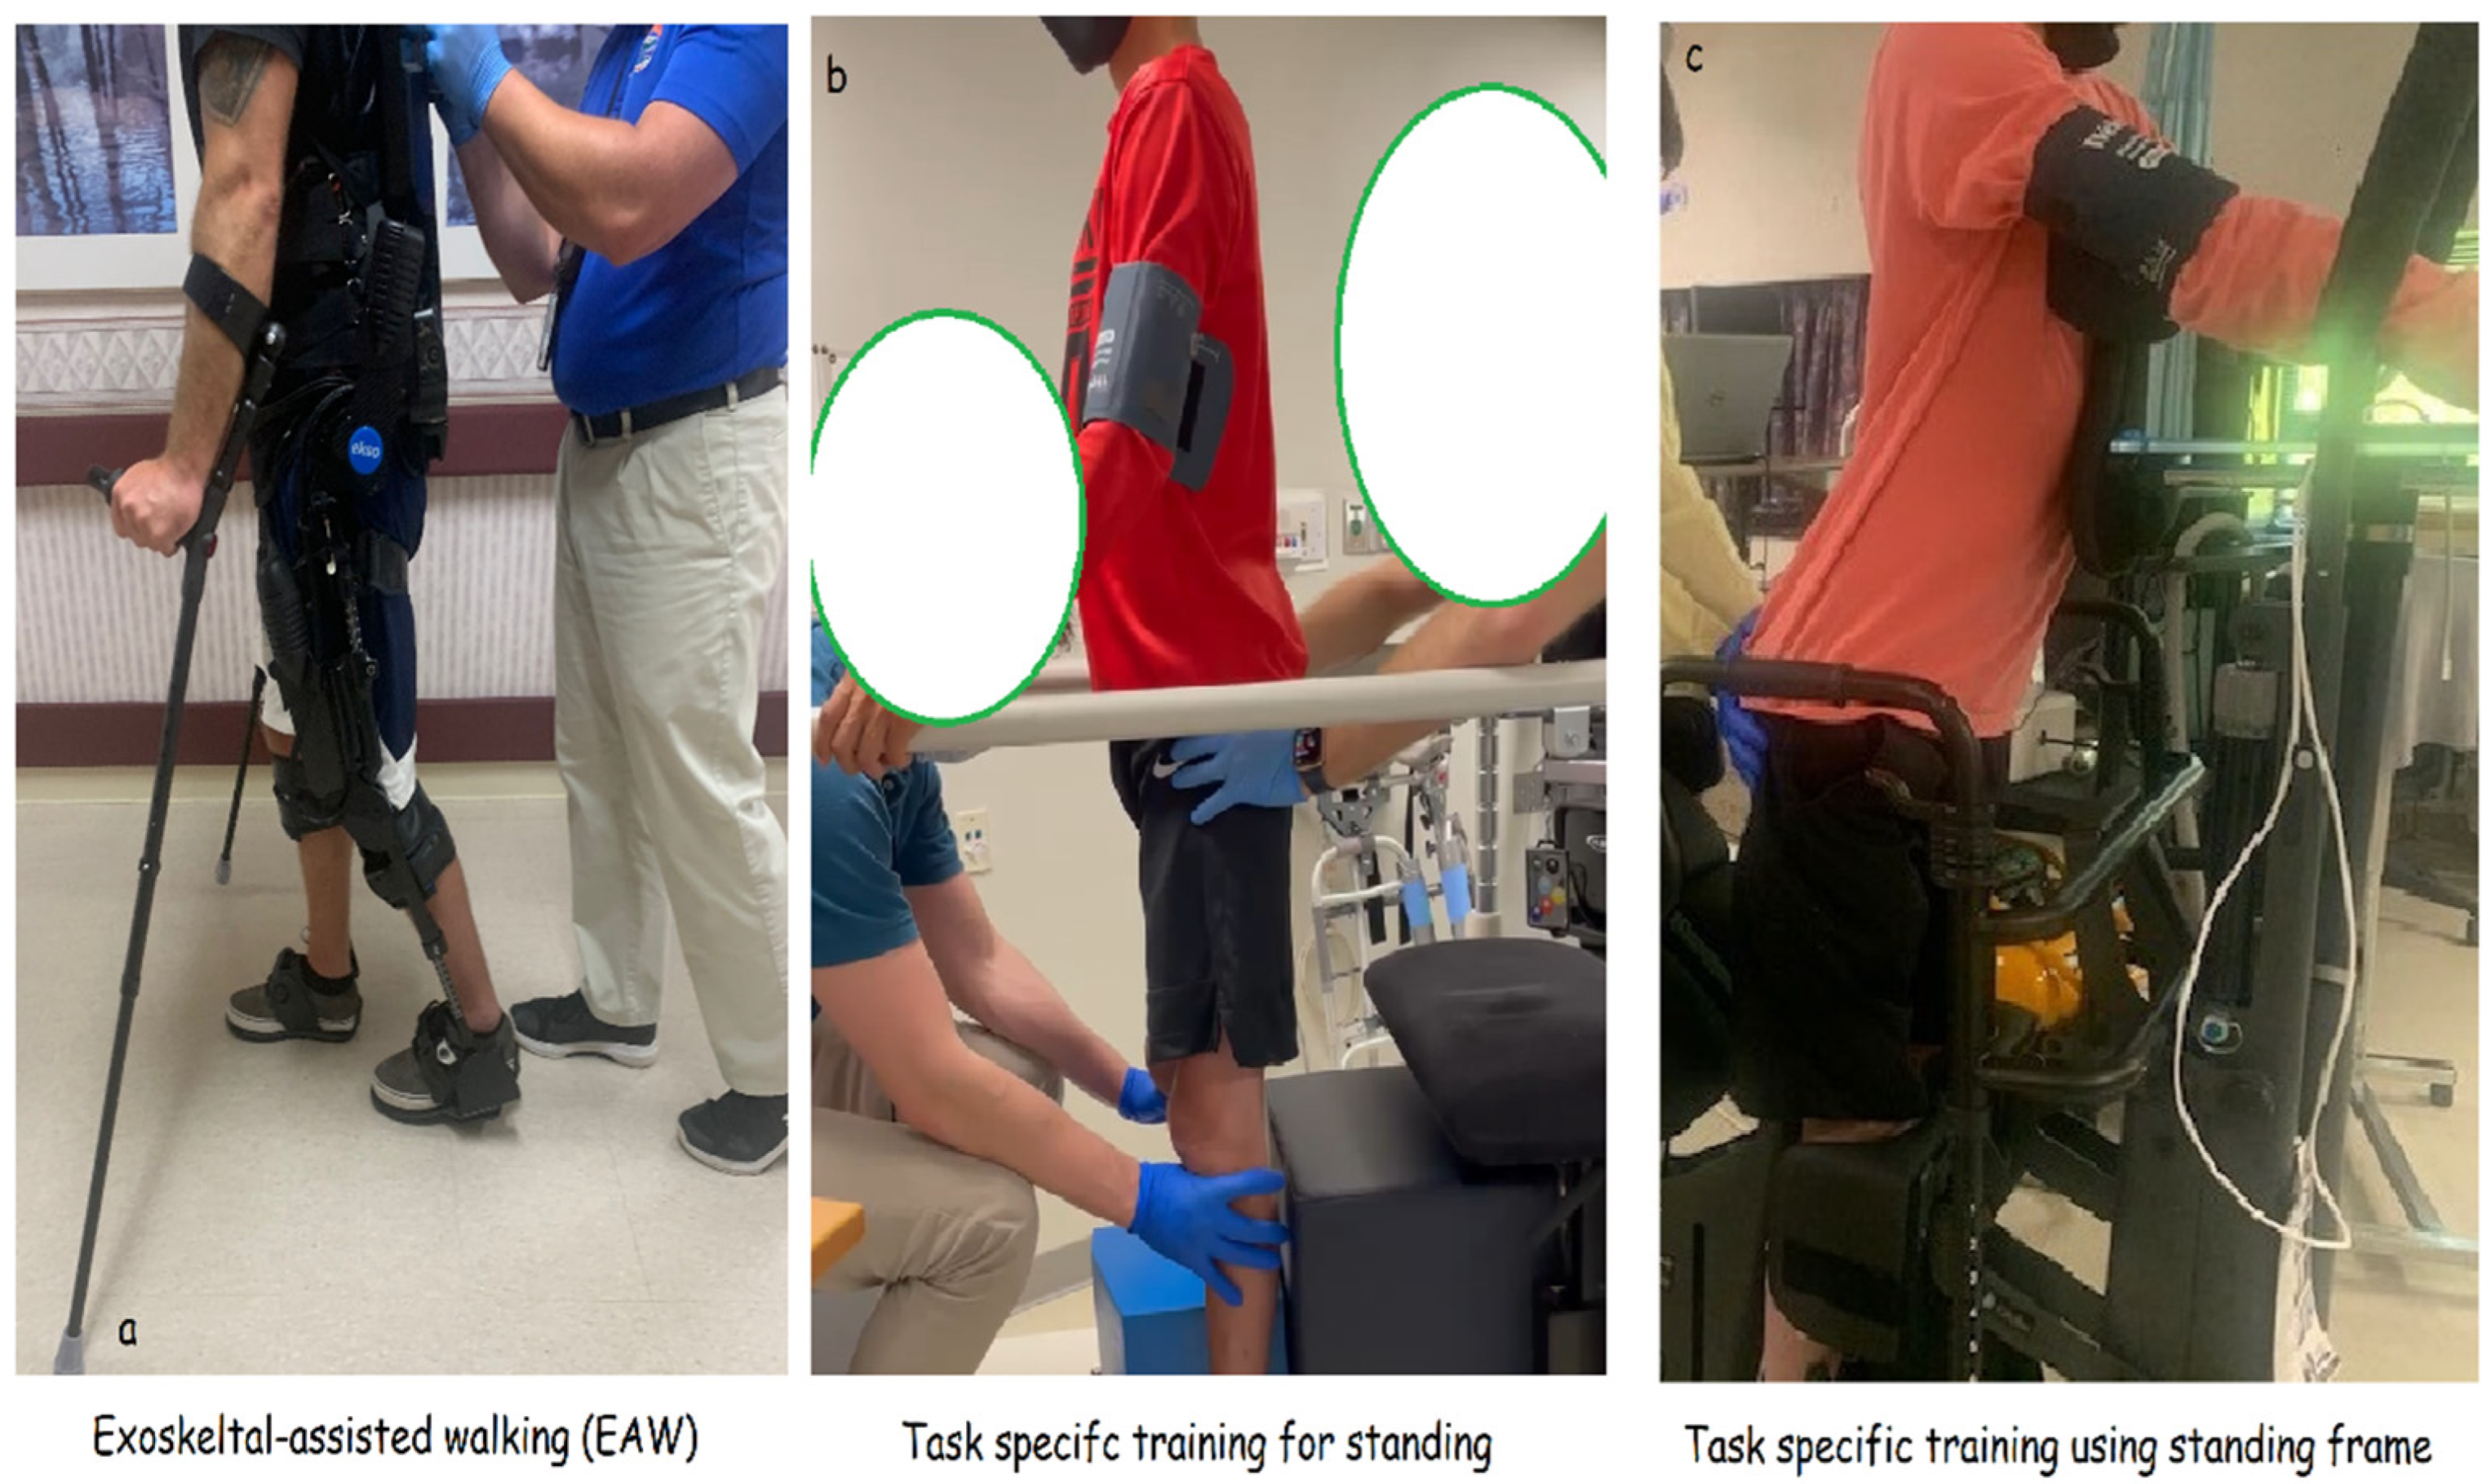
2.3.2. Training
- Exoskeleton-assisted walking (EAW)
- b.
- Task-specific training
- c.
- Resistance training (EAW + ES + RT group)
- d.
- Passive range of motion or passive stretching for the control group (EAW + delayed ES + noRT)
2.3.3. Measurements
- A.
- Motor Adaptations
- B.
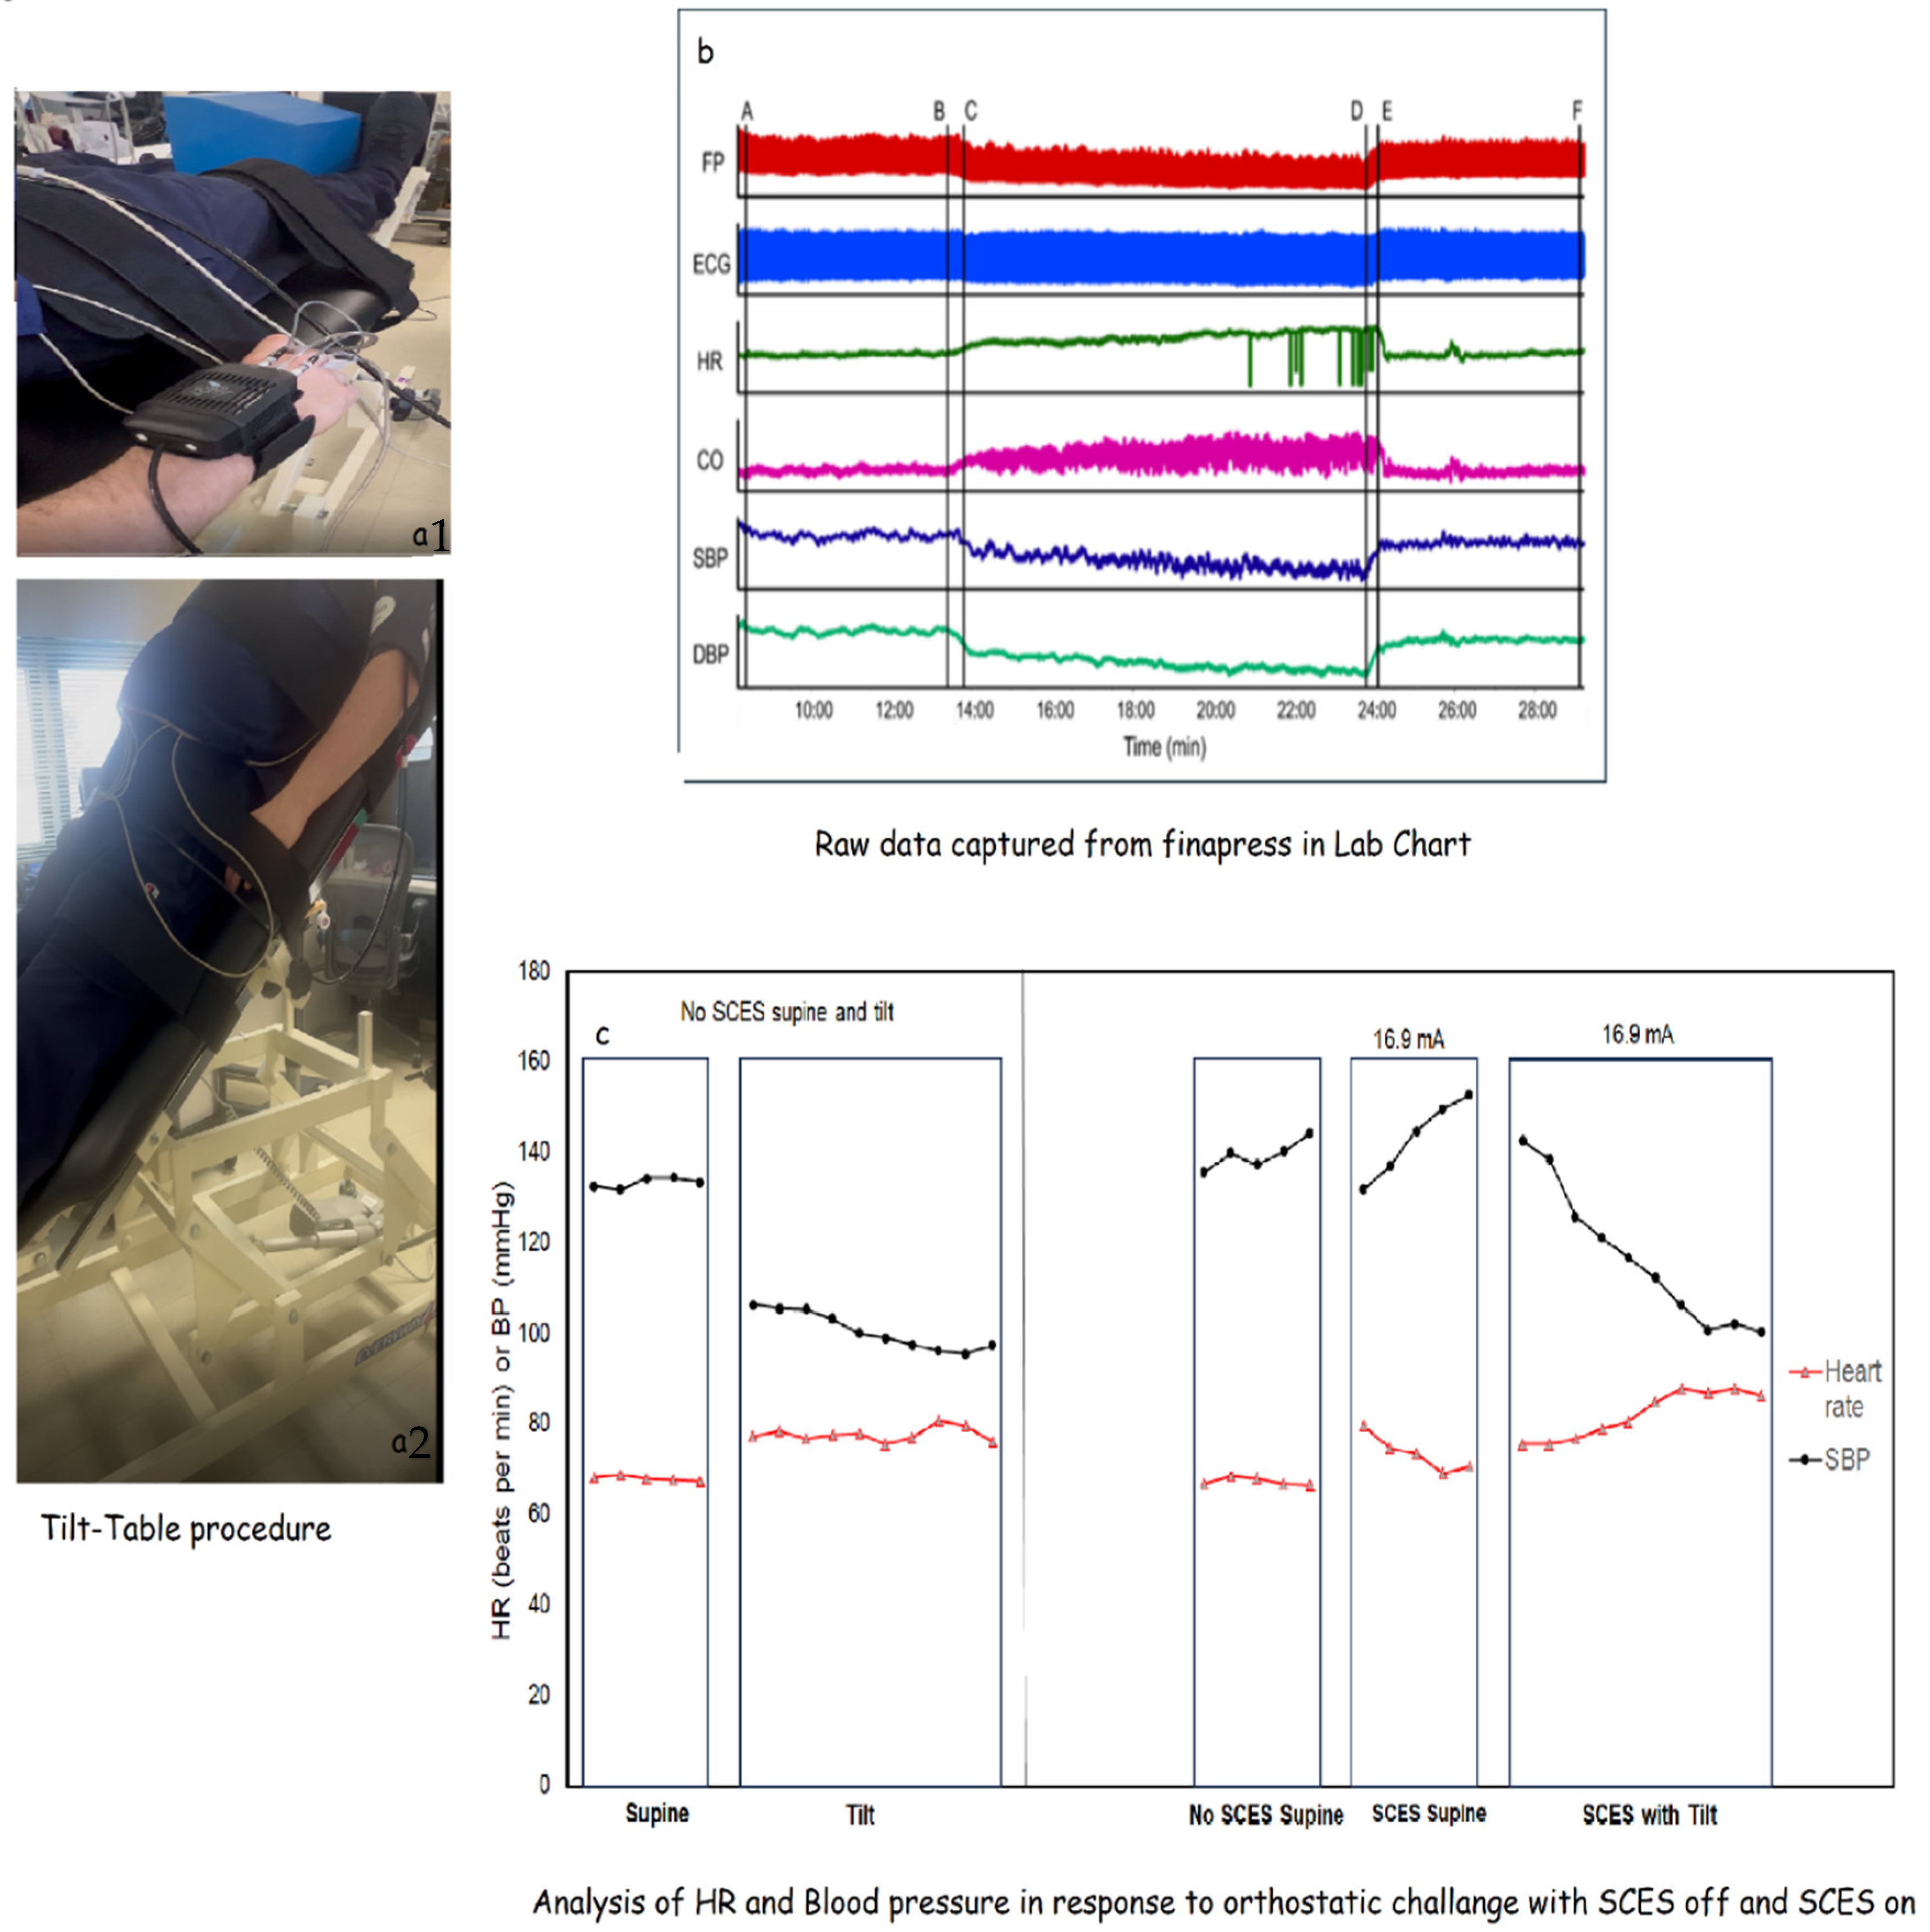
- Cardio-metabolic and Autonomic Adaptations
- -
- Duration of tilt: The length of time the participant can safely maintain tilt. It is anticipated there will be a ceiling effect on this outcome as some participants may safely tolerate the entire 10 min duration of the tilt from the first assessment.
- -
- Low-frequency (LF) power during tilt: The frequency spectrum power of low-frequency oscillations in RR intervals derived from ECG recordings. The spectral power itself will be determined offline in our data collection software (LabChart) using built-in calculation modules. LF power is indicative of how much baroreceptor activity underlies changes seen in the heart rate or blood pressure when changing postures.
- -
- High-frequency (HF) power during tilt: The frequency spectrum power of high-frequency oscillations in RR intervals derived from ECG recordings. The spectral power itself will be determined offline in our data collection software (LabChart) using built-in calculation modules. HF power is indicative of how much parasympathetic activity underlies changes seen in the heart rate or blood pressure when changing postures.
- -
- Cardiovascular responses to initiation of tilt: The 30 s average of HR, SBP, and DBP from the beginning of tilt minus the 30 s average from the end of the supine baseline.
- -
- Cardiovascular responses during tilt: The 30 s average of HR, SBP, and DBP from the beginning of tilt minus the 30 s average from end of tilt.
- C.
- Urodynamic Measurements
- Development of volitional voiding:
- 2.
- Time to volitional voiding:
- 3.
- Voiding efficiency:
- 4.
- Suppression of involuntary contractions:
- 5.
- Suppression of urinary urgency:
- 6.
- Alterations of bladder sensation:
- 7.
- Assessment of bladder outlet obstruction:
- 8.
- Bladder contractility:
3. Recruitment Strategy
4. Statistical Analyses
5. Discussion
5.1. Novelty of the Current Work
5.2. Autonomic and Cardio-Metabolic Benefits
5.3. Percutaneous ES Configurations
6. Limitations
7. Trial Status
Supplementary Materials
Author Contributions
Funding
Institutional Review Board Statement
Informed Consent Statement
Data Availability Statement
Conflicts of Interest
References
- National Spinal Cord Injury Statistical Center. Available online: http://main.uab.edu (accessed on 27 August 2019).
- DeVivo, M.J.; Go, B.K.; Jackson, A.B. Overview of the national spinal cord injury statistical center database. J. Spinal Cord. Med. 2002, 25, 335–338. [Google Scholar] [CrossRef]
- Strauss, D.J.; Devivo, M.J.; Paculdo, D.R.; Shavelle, R.M. Trends in life expectancy after spinal cord injury. Arch. Phys. Med. Rehabil. 2006, 87, 1079–1085. [Google Scholar] [CrossRef] [PubMed]
- DeVivo, M.J. Causes and costs of spinal cord injury in the United States. Spinal Cord. 1997, 35, 809–813. [Google Scholar] [CrossRef] [PubMed]
- Gater, D.R. Obesity after Spinal Cord Injury. Phys. Med. Rehabil. Clin. N. Am. 2007, 18, 331–351. [Google Scholar] [CrossRef] [PubMed]
- Bauman, W.A.; Spungen, A.M. Coronary heart disease in individuals with spinal cord injury: Assessment of risk factors. Spinal Cord. 2008, 46, 466–476. [Google Scholar] [CrossRef]
- Nash, M.S.; Gater, D.R., Jr. Cardiometabolic Disease and Dysfunction Following Spinal Cord Injury: Origins and Guideline-Based Countermeasures. Phys. Med. Rehabil. Clin. N. Am. 2020, 31, 415–436. [Google Scholar] [CrossRef]
- Barbeau, H. Locomotor training in neurorehabilitation: Emerging rehabilitation concepts. Neurorehabil. Neural Repair. 2003, 17, 3–11. [Google Scholar] [CrossRef]
- Dobkin, B.; Apple, D.; Barbeau, H.; Basso, M.; Behrman, A.; Deforge, D.; Ditunno, J.; Dudley, G.; Elashoff, R.; Fugate, L.; et al. Weight-supported treadmill vs over-ground training for walking after acute incomplete SCI. Neurology 2006, 66, 484–493. [Google Scholar] [CrossRef]
- Behrman, A.L.; Lawless-Dixon, A.R.; Davis, S.B.; Browden, M.G.; Naie, P.; Phadke, C.; Hannold, E.M.; Plummer, P.; Harkema, S.J. Locomotor training progression and outcomes after incomplete spinal cord injury. Phys. Ther. 2005, 85, 1356–1371. [Google Scholar] [CrossRef]
- Dietz, V.; Harkema, S.J. Locomotor activity in spinal cord-injured persons. J. Appl. Physiol. 2004, 96, 1954–1960. [Google Scholar] [CrossRef]
- Harkema, S.J.; Hillyer, J.; Schmidt-Read, M.; Ardolino, E.; Sisto, S.A.; Behrman, A.L. Locomotor training: As a treatment of spinal cord injury and in the progression of neurologic rehabilitation. Arch. Phys. Med. Rehabil. 2012, 93, 1588–1597. [Google Scholar] [CrossRef] [PubMed]
- Giangregorio, L.M.; Hicks, A.L.; Webber, C.E.; Phillips, S.M.; Craven, B.C.; Bugaresti, J.M.; McCartney, N. Body weight supported treadmill training in acute spinal cord injury: Impact on muscle and bone. Spinal Cord. 2005, 43, 649–657. [Google Scholar] [CrossRef]
- Hornby, T.G.; Zemon, D.H.; Campbell, D. Robotic-assisted, body-weight-supported treadmill training in individuals following motor incomplete spinal cord injury. PhysTher. 2005, 85, 52–66. [Google Scholar] [CrossRef]
- Maxwell, J.L.; Granat, M.H.; Baardman, G.; Hermens, H.J. Demand for and use of functional electrical stimulation systems and conventional orthoses in the spinal lesioned community of the UK. Artif. Organs 1999, 23, 410–412. [Google Scholar] [CrossRef]
- Ambrosia, R.D.; Solomonow, M.; Baratta, R. Current status of walking orthosis for thoracic paraplegics. Iowa Orthop. J. 1995, 15, 174–181. [Google Scholar]
- Gorgey, A.S.; Poarch, H.; Miller, J.; Castillo, T.; Gater, D.R. Locomotor and resistance training restore walking in an elderly person with a chronic incomplete spinal cord injury. NeuroRehabilitation 2010, 26, 127–133. [Google Scholar] [CrossRef]
- Castro, M.J.; Apple, D.F., Jr.; Hillegass, E.A.; Dudley, G.A. Influence of complete spinal cord injury on skeletal muscle cross-sectional area within the first 6 months of injury. Eur. J. Appl. Physiol. Occup. Physiol. 1999, 80, 373–378. [Google Scholar] [CrossRef]
- Spungen, A.M.; Wang, J.; Pierson, R.N., Jr.; Bauman, W.A. Soft tissue body composition differences in monozygotic twins discordant for spinal cord injury. J. Appl. Physiol. 2000, 88, 1310–1315. [Google Scholar] [CrossRef]
- Holman, M.E.; Gorgey, A.S. Testosterone and Resistance Training Improve Muscle Quality in Spinal Cord Injury. Med. Sci. Sports Exerc. 2019, 51, 1591–1598. [Google Scholar] [CrossRef]
- Gorgey, A.S.; Graham, Z.A.; Chen, Q.; Rivers, J.; Adler, R.A.; Lesnefsky, E.J.; Cardozo, C.P. Sixteen weeks of testosterone with or without evoked resistance training on protein expression, fiber hypertrophy and mitochondrial health after spinal cord injury. J. Appl. Physiol. 2020, 128, 1487–1496. [Google Scholar] [CrossRef]
- Calvert, J.S.; Grahn, P.J.; Strommen, J.A.; Lavrov, I.A.; Beck, L.A.; Gill, M.L.; Linde, M.B.; Brown, D.A.; Van Straaten, M.G.; Veith, D.D.; et al. Electrophysiological Guidance of Epidural Electrode Array Implantation over the Human Lumbosacral Spinal Cord to Enable Motor Function after Chronic Paralysis. J. Neurotrauma 2018, 35, 1451–1460. [Google Scholar] [CrossRef] [PubMed]
- Wagner, F.B.; Mignardot, J.-B.; Le Goff-Mignardot, C.G.; Demesmaeker, R.; Komi, S.; Capogrosso, M.; Rowald, A.; Seáñez, I.; Caban, M.; Pirondini, E.; et al. Targeted neurotechnology restores walking in humans with spinal cord injury. Nature 2018, 563, 65–71. [Google Scholar] [CrossRef] [PubMed]
- Harkema, S.; Gerasimenko, Y.; Hodes, J.; Burdick, J.; Angeli, C.; Chen, Y.; Ferreira, C.; Willhite, A.; Rejc, E.; Grossman, R.G.; et al. Effect of epidural stimulation of the lumbosacral spinal cord on voluntary movement, standing, and assisted stepping after motor complete paraplegia: A case study. Lancet 2011, 377, 1938–1947. [Google Scholar] [CrossRef] [PubMed]
- Gill, M.L.; Grahn, P.J.; Calvert, J.S.; Linde, M.B.; Lavrov, I.A.; Strommen, J.A.; Beck, L.A.; Sayenko, D.G.; Van Straaten, M.G.; Drubach, D.I.; et al. Neuromodulation of lumbosacral spinal networks enables independent stepping after complete paraplegia. Nat. Med. 2018, 24, 1677–1682. [Google Scholar] [CrossRef]
- Darrow, D.; Balser, D.; Netoff, T.I.; Krassioukov, A.; Philips, A.; Parr, A.; Samadani, U. Epidural Spinal Cord Stimulation facilitates immediate restoration of dormant motor and autonomic supraspinal pathways after chronic neurologically complete spinal cord injury. J. Neurotrauma 2019, 36, 2325–2336. [Google Scholar] [CrossRef]
- Huang, H.; He, J.; Herman, R.; Carhart, M.R. Modulation effects of epidural spinal cord stimulation on muscle activities during walking. IEEE Trans. Neural Syst. Rehabil. Eng. 2006, 14, 14–23. [Google Scholar] [CrossRef]
- Grahn, P.J.; Lavrov, I.A.; Sayenko, D.G.; Van Straaten, M.G.; Gill, M.L.; Strommen, J.A.; Calvert, J.S.; Drubach, D.I.; Beck, L.A.; Linde, M.B.; et al. Enabling Task-Specific Volitional Motor Functions via Spinal Cord Neuromodulation in a Human with Paraplegia. Mayo Clin. Proc. 2017, 92, 544–554. [Google Scholar] [CrossRef]
- Rejc, E.; Angeli, C.A.; Atkinson, D.; Harkema, S.J. Motor recovery after activity-based training with spinal cord epidural stimulation in a chronic motor complete paraplegic. Sci. Rep. 2017, 7, 13476. [Google Scholar] [CrossRef]
- Angeli, C.; Rejc, E.; Boakye, M.; Herrity, A.; Mesbah, S.; Hubscher, C.; Forrest, G.; Harkema, S. Targeted Selection of Stimulation Parameters for Restoration of Motor and Autonomic Function in Individuals with Spinal Cord Injury. Neuromodulation 2024, 27, 645–660. [Google Scholar] [CrossRef]
- Angeli, C.A.; Boakye, M.; Morton, R.A.; Vogt, J.; Benton, K.; Chen, Y.; Ferreira, C.K.; Harkema, S.J. Recovery of Over-Ground Walking after Chronic Motor Complete Spinal Cord Injury. N. Engl. J. Med. 2018, 379, 1244–1250. [Google Scholar] [CrossRef]
- Rowald, A.; Komi, S.; Demesmaeker, R.; Baaklini, E.; Hernandez-Charpak, S.D.; Paoles, E.; Montanaro, H.; Cassara, A.; Becce, F.; Lloyd, B.; et al. Activity-dependent spinal cord neuromodulation rapidly restores trunk and leg motor functions after complete paralysis. Nat. Med. 2022, 28, 260–271. [Google Scholar] [CrossRef] [PubMed]
- Gorgey, A.S.; Wade, R.; Sumrell, R.; Villadelgado, L.; Khalil, R.E.; Lavis, T. Exoskeleton Training May Improve Level of Physical Activity After Spinal Cord Injury: A Case Series. Top. Spinal Cord. Inj. Rehabil. 2017, 23, 245–255. [Google Scholar] [CrossRef] [PubMed]
- Miller, L.E.; Zimmermann, A.K.; Herbert, W.G. Clinical effectiveness and safety of powered exoskeleton-assisted walking in patients with spinal cord injury: Systematic review with meta-analysis. Med. Devices 2016, 9, 455–466. [Google Scholar] [CrossRef]
- Evans, N.; Hartigan, C.; Kandilakis, C.; Pharo, E.; Clesson, I. Acute cardiorespiratory and metabolic responses during exoskeleton-assisted walking overground among persons with chronic spinal cord injury. Top. Spinal Cord. Inj. Rehabil. 2015, 21, 122–132. [Google Scholar] [CrossRef]
- Kressler, J.; Thomas, C.K.; Field-Fote, E.C.; Sanchez, J.; Widerström-Noga, E.; Cilien, D.C.; Gant, K.; Ginnety, K.; Gonzalez, H.; Martinez, A.; et al. Understanding therapeutic benefits of overground bionic ambulation: Exploratory case series in persons with chronic, complete spinal cord injury. Arch. Phys. Med. Rehabil. 2014, 95, 1878.e4–1887.e4. [Google Scholar] [CrossRef]
- Shackleton, C.; Evans, R.; West, S.; Derman, W.; Albertus, Y. Robotic locomotor training for spasticity, pain, and quality of life in individuals with chronic SCI: A pilot randomized controlled trial. Front. Rehabil. Sci. 2023, 4, 1003360. [Google Scholar] [CrossRef]
- Sawicki, G.S.; Ferris, D.P. Mechanics and energetics of level walking with powered ankle exoskeletons. J. Exp. Biol. 2008, 211 Pt 9, 1402–1413. [Google Scholar] [CrossRef]
- Gad, P.; Gerasimenko, Y.; Zdunowski, S.; Turner, A.; Sayenko, D.; Lu, D.C.; Edgerton, V.R. Weight Bearing Over-ground Stepping in an Exoskeleton with Non-invasive Spinal Cord Neuromodulation after Motor Complete Paraplegia. Front. Neurosci. 2017, 11, 333. [Google Scholar] [CrossRef]
- Gorgey, A.S.; Gill, S.; Holman, M.E.; Davis, J.C.; Atri, R.; Bai, O.; Goetz, L.; Lester, D.L.; Trainer, R.; Lavis, T.D. The feasibility of using exoskeletal-assisted walking with epidural stimulation: A case report study. Ann. Clin. Transl. Neurol. 2020, 7, 259–265. [Google Scholar] [CrossRef]
- Gorgey, A.S.; Trainer, R.; Sutor, T.W.; Goldsmith, J.A.; Alazzam, A.; Goetz, L.L.; Lester, D.; Lavis, T.D. A case study of percutaneous epidural stimulation to enable motor control in two men after spinal cord injury. Nat. Commun. 2023, 14, 2064. [Google Scholar] [CrossRef]
- Henke, A.M.; Billington, Z.J.; Gater, D.R., Jr. Autonomic Dysfunction and Management after Spinal Cord Injury: A Narrative Review. J. Pers. Med. 2022, 12, 1110. [Google Scholar] [CrossRef] [PubMed]
- Nash, M.S.; Mendez, A.J. A guideline-driven assessment of need for cardiovascular disease risk intervention in persons with chronic paraplegia. Arch. Phys. Med. Rehabil. 2007, 88, 751–757. [Google Scholar] [CrossRef] [PubMed]
- Krassioukov, A.V.; Karlsson, A.K.; Wecht, J.M.; Wuermser, L.A.; Mathias, C.J.; Marino, R.J.; Joint Committee of American Spinal Injury Association and International Spinal Cord Society. Assessment of autonomic dysfunction following spinal cord injury: Rationale for additions to International Standards for Neurological Assessment. J. Rehabil. Res. Dev. 2007, 44, 103–112. [Google Scholar] [CrossRef]
- Wang, S.; Wecht, J.M.; Ditterline, B.L.; Ugiliweneza, B.; Maher, M.T.; Lombard, A.T.; Aslan, A.C.; Ovechkin, A.V.; Bethke, B.; Gunter, J.T.H.; et al. Heart rate and blood pressure response improve the prediction of orthostatic cardiovascular dysregulation in persons with chronic spinal cord injury. Physiol. Rep. 2020, 8, e14617. [Google Scholar] [CrossRef]
- Milicevic, S.; Sekulic, A.; Nikolic, D.; Tomasevic-Todorovic, S.; Lazarevic, K.; Pelemis, S.; Petrovic, M.; Mitrovic, S.Z. Urinary Tract Infections in Relation to Bladder Emptying in Patients with Spinal Cord Injury. J. Clin. Med. 2024, 13, 3898. [Google Scholar] [CrossRef]
- Gad, P.N.; Kreydin, E.; Zhong, H.; Latack, K.; Edgerton, V.R. Non-invasive Neuromodulation of Spinal Cord Restores Lower Urinary Tract Function After Paralysis. Front. Neurosci. 2018, 12, 432. [Google Scholar] [CrossRef]
- Hubscher, C.H.; Herrity, A.N.; Wiliams, C.S.; Montgomery, L.R.; Willhite, A.M.; Angeli, C.A.; Harkema, S.J. Improvements in bladder, bowel and sexual outcomes following taskspecific locomotor training in human spinal cord injury. PLoS ONE 2018, 13, e0190998. [Google Scholar] [CrossRef]
- Herrity, A.N.; Williams, C.S.; Angeli, C.A.; Harkema, S.J.; Hubscher, C.H. Lumbosacral spinal cord epidural stimulation improves voiding function after human spinal cord injury. Sci. Rep. 2018, 8, 8688. [Google Scholar] [CrossRef]
- Goetz, L.L.; Klausner, A.P. Strategies for prevention of urinary tract infections in neurogenic bladder dysfunction. Phys. Med. Rehabil. Clin. N. Am. 2014, 25, 605–618. [Google Scholar] [CrossRef]
- Herrity, A.N.; Aslan, S.C.; Ugiliweneza, B.; Mohamed, A.Z.; Hubscher, C.H.; Harkema, S.J. Improvements in Bladder Function Following Activity-Based Recovery Training with Epidural Stimulation After Chronic Spinal Cord Injury. Front. Syst. Neurosci. 2021, 14, 614691. [Google Scholar] [CrossRef]
- Calvert, J.S.; Grahn, P.J.; Zhao, K.D.; Lee, K.H. Emergence of Epidural Electrical Stimulation to Facilitate Sensorimotor Network Functionality After Spinal Cord Injury. Neuromodulation 2019, 22, 244–252. [Google Scholar] [CrossRef] [PubMed]
- Formento, E.; Minassian, K.; Wagner, F.; Mignardot, J.B.; Le Goff-Mignardot, C.G.; Rowald, A.; Bloch, J.; Micera, S.; Capogrosso, M.; Courtine, G. Electrical spinal cord stimulation must preserve proprioception to enable locomotion in humans with spinal cord injury. Nat. Neurosci. 2018, 21, 1728–1741. [Google Scholar] [CrossRef] [PubMed]
- Alazzam, A.M.; Ballance, W.B.; Smith, A.C.; Rejc, E.; Weber, K.A., II; Trainer, R.; Gorgey, A.S. Peak Slope Ratio of the Recruitment Curves Compared to Muscle Evoked Potentials to Optimize Standing Configurations with Percutaneous Epidural Stimulation after Spinal Cord Injury. J. Clin. Med. 2024, 13, 1344. [Google Scholar] [CrossRef]
- Harvey, L.A.; Herbert, R.D. Muscle stretching for treatment and prevention of contracture in people with spinal cord injury. Spinal Cord. 2002, 40, 1–9. [Google Scholar] [CrossRef] [PubMed]
- Elaraby, A.; Shahein, M.; Bekhet, A.H.; Perrin, P.B.; Gorgey, A.S. The COVID-19 pandemic impacts all domains of quality of life in Egyptians with spinal cord injury: A retrospective longitudinal study. Spinal Cord. 2022, 60, 757–762. [Google Scholar] [CrossRef]
- Venigalla, S.; Rehman, M.U.; Deitrich, J.N.; Trainer, R.; Gorgey, A.S. MRI Spinal Cord Reconstruction Provides Insights into Mapping and Migration Following Percutaneous Epidural Stimulation Implantation in Spinal Cord Injury. J. Clin. Med. 2024, 13, 6826. [Google Scholar] [CrossRef]
- Ditunno, J.F., Jr.; Ditunno, P.L.; Scivoletto, G.; Patrick, M.; Dijkers, M.; Barbeau, H.; Burns, A.S.; Marino, R.J.; Schmidt-Read, M. The Walking Index for Spinal Cord Injury (WISCI/WISCI II): Nature, metric properties, use and misuse. Spinal Cord. 2013, 51, 346–355. [Google Scholar] [CrossRef]
- Forrest, G.F.; Hutchinson, K.; Lorenz, D.J.; Buehner, J.J.; Vanhiel, L.R.; Sisto, S.A.; Basso, D.M. Are the 10 meter and 6 minute walk tests redundant in patients with spinal cord injury? PLoS ONE 2014, 9, e94108. [Google Scholar] [CrossRef]
- Knikou, M.; Angeli, C.A.; Ferreira, C.K.; Harkema, S.J. Soleus H-reflex gain, threshold, and amplitude as function of body posture and load in spinal cord intact and injured subjects. Int. J. Neurosci. 2009, 119, 2056–2073. [Google Scholar] [CrossRef]
- Smith, A.C.; Rymer, W.Z.; Knikou, M. Locomotor training modifies soleus monosynaptic motoneuron responses in human spinal cord injury. Exp. Brain Res. 2015, 233, 89–103. [Google Scholar] [CrossRef]
- Gorgey, A.S.; Goldsmith, J.; Alazzam, A.; Trainer, R. Effects of percutaneously-implanted epidural stimulation on cardiovascular autonomic function and spasticity after complete spinal cord injury: A case report. Front. Neurosci. 2023, 17, 1112853. [Google Scholar] [CrossRef] [PubMed]
- Dittuno, P.L.; Ditunno, J.F., Jr. Walking index for spinal cord injury (WISCI II): Scale revision. Spinal Cord. 2001, 39, 654–656. [Google Scholar] [CrossRef] [PubMed]
- Gorgey, A.S.; Poarch, H.J.; Dolbow, D.D.; Castillo, T.; Gater, D.R. Effect of adjusting pulse durations of functional electrical stimulation cycling on energy expenditure and fatigue after spinal cord injury. J. Rehabil. Res. Dev. 2014, 51, 1455–1468. [Google Scholar] [CrossRef] [PubMed]
- Gorgey, A.S.; Cirnigliaro, C.M.; Bauman, W.A.; Adler, R.A. Estimates of the precision of regional and whole body composition by dual-energy x-ray absorptiometry in persons with chronic spinal cord injury. Spinal Cord. 2018, 56, 987–995. [Google Scholar] [CrossRef]
- Lester, R.M.; Ghatas, M.P.; Khan, R.M.; Gorgey, A.S. Prediction of thigh skeletal muscle mass using dual energy x-ray absorptiometry compared to magnetic resonance imaging after spinal cord injury. J. Spinal Cord. Med. 2019, 42, 622–630. [Google Scholar] [CrossRef]
- Sumrell, R.M.; Nightingale, T.E.; McCauley, L.S.; Gorgey, A.S. Anthropometric cutoffs and associations with visceral adiposity and metabolic biomarkers after spinal cord injury. PLoS ONE 2018, 13, e0203049. [Google Scholar] [CrossRef]
- Gollie, J.M.; Herrick, J.E.; Keyser, R.E.; Chin, L.M.K.; Collins, J.P.; Shields, R.K.; Panza, G.S.; Guccione, A.A. Fatigability, oxygen uptake kinetics and muscle deoxygenation in incomplete spinal cord injury during treadmill walking. Eur. J. Appl. Physiol. 2017, 117, 1989–2000. [Google Scholar] [CrossRef]
- Aslan, S.C.; Legg Ditterline, B.E.; Park, M.C.; Angeli, C.A.; Rejc, E.; Chen, Y.; Ovechkin, A.V.; Krassioukov, A.; Harkema, S.J. Epidural Spinal Cord Stimulation of Lumbosacral Networks Modulates Arterial Blood Pressure in Individuals with Spinal Cord Injury-Induced Cardiovascular Deficits. Front. Physiol. 2018, 9, 565. [Google Scholar] [CrossRef]
- Harkema, S.J.; Legg Ditterline, B.; Wang, S.; Aslan, S.; Angeli, C.A.; Ovechkin, A.; Hirsch, G.A. Epidural Spinal Cord Stimulation Training and Sustained Recovery of Cardiovascular Function in Individuals with Chronic Cervical Spinal Cord Injury. JAMA Neurol. 2018, 75, 1569–1571. [Google Scholar] [CrossRef]
- Gorgey, A.S.; Sutor, T.W.; Goldsmith, J.A.; Ennasr, A.N.; Lavis, T.D.; Cifu, D.X.; Trainer, R. Epidural stimulation with locomotor training ameliorates unstable blood pressure after tetraplegia. A case report. Ann. Clin. Transl. Neurol. 2022, 9, 232–238. [Google Scholar] [CrossRef]
- Glass Clark, S.; Nagle, A.S.; Bernardo, R.; Vinod, N.; Carucci, L.; Carroll, A.; Speich, J.; Klausner, A.P. Use of Ultrasound Urodynamics to Identify Differences in Bladder Shape Between Individuals With and Without Overactive Bladder. Female Pelvic Med. Reconstr. Surg. 2020, 26, 635–639. [Google Scholar] [CrossRef]
- Cullingsworth, Z.E.; Kelly, B.B.; Deebel, N.A.; Colhoun, A.F.; Nagle, A.S.; Klausner, A.P.; Speich, J.E. Automated quantification of low amplitude rhythmic contractions (LARC) during real-world urodynamics identifies a potential detrusor overactivity subgroup. PLoS ONE 2018, 13, e0201594. [Google Scholar] [CrossRef] [PubMed]
- Nagle, A.S.; Bernardo, R.J.; Varghese, J.; Carucci, L.R.; Klausner, A.P.; Speich, J.E. Comparison of 2D and 3D ultrasound methods to measure serial bladder volumes during filling: Steps toward development of non-invasive ultrasound urodynamics. Bladder 2018, 5, e32. [Google Scholar] [CrossRef] [PubMed]
- Nagle, A.S.; Klausner, A.P.; Varghese, J.; Bernardo, R.J.; Colhoun, A.F.; Barbee, R.W.; Carucci, L.R.; Speich, J.E. Quantification of bladder wall biomechanics during urodynamics: A methodologic investigation using ultrasound. J. Biomech. 2017, 61, 232–241. [Google Scholar] [CrossRef]
- Stamatakis, E.; Gale, J.; Bauman, A.; Ekelund, U.; Hamer, M.; Ding, D. Sitting Time, Physical Activity, and Risk of Mortality in Adults. J. Am. Coll. Cardiol. 2019, 73, 2062–2072, Erratum in: J. Am. Coll. Cardiol. 2019, 73, 2789. [Google Scholar] [CrossRef] [PubMed]
- Gorman, P.H.; Forrest, G.F.; Asselin, P.K.; Scott, W.; Kornfeld, S.; Hong, E.; Spungen, A.M. The Effect of Exoskeletal-Assisted Walking on Spinal Cord Injury Bowel Function: Results from a Randomized Trial and Comparison to Other Physical Interventions. J. Clin. Med. 2021, 10, 964. [Google Scholar] [CrossRef]
- Spungen, A.M.; Dematt, E.J.; Biswas, K.; Jones, K.M.; Mi, Z.; Snodgrass, A.J.; Morin, K.; Asselin, P.K.; Cirnigliaro, C.M.; Kirshblum, S.; et al. Exoskeletal-Assisted Walking in Veterans with Paralysis: A Randomized Clinical Trial. JAMA Netw. Open. 2024, 7, e2431501. [Google Scholar] [CrossRef]
- Hofstoetter, U.S.; Perret, I.; Bayart, A.; Lackner, P.; Binder, H.; Freundl, B.; Minassian, K. Spinal motor mapping by epidural stimulation of lumbosacral posterior roots in humans. iScience 2020, 24, 101930. [Google Scholar] [CrossRef]
- Gorgey, A.S.; Gouda, J.J. Single Lead Epidural Spinal Cord Stimulation Targeted Trunk Control and Standing in Complete Paraplegia. J. Clin. Med. 2022, 11, 5120. [Google Scholar] [CrossRef]
- Gorgey, A.S.; Venigalla, S.; Rehman, M.U.; George, B.; Rejc, E.; Gouda, J.J. Interleaved configurations of percutaneous epidural stimulation enhanced overground stepping in a person with chronic paraplegia. Front. Neurosci. 2023, 17, 1284581. [Google Scholar] [CrossRef]
- De Andrade, D.C.; Bendib, B.; Hattou, M.; Keravel, Y.; Nguyen, J.P.; Lefaucheur, J.P. Neurophysiological assessment of spinal cord stimulation in failed back surgery syndrome. Pain 2010, 150, 485–491. [Google Scholar] [CrossRef] [PubMed]
- Bydon, M.; Macki, M.; Abt, N.B.; Sciubba, D.M.; Wolinsky, J.P.; Witham, T.F.; Gokaslan, Z.L.; Bydon, A. Clinical and surgical outcomes after lumbar laminectomy: An analysis of 500 patients. Surg. Neurol. Int. 2015, 6 (Suppl. S4), S190–S193. [Google Scholar] [CrossRef] [PubMed]
- Liu, P.; Cheng, Y.; Xu, Z.; Li, X.; Chen, Z.; Duan, W. Spatiotemporal spinal cord stimulation with real-time triggering exoskeleton restores walking capability: A case report. Ann. Clin. Transl. Neurol. 2024; in press. [Google Scholar] [CrossRef]
- Terson de Paleville, D.G.L.; Harkema, S.J.; Angeli, C.A. Epidural stimulation with locomotor training improves body composition in individuals with cervical or upper thoracic motor complete spinal cord injury: A series of case studies. J. Spinal Cord. Med. 2019, 42, 32–38. [Google Scholar] [CrossRef] [PubMed]
- Veith, D.D.; Asp, A.J.; Gill, M.L.; Fernandez, K.A.; Mills, C.J.; Linde, M.B.; Jahanian, O.; Beck, L.A.; Zhao, K.D.; Grahn, P.J.; et al. Prevalence of autonomic dysreflexia during spinal cord stimulation after spinal cord injury. J. Neurophysiol. 2024, 132, 1371–1375. [Google Scholar] [CrossRef]


| Researcher | Subjects | Management | Outcome |
|---|---|---|---|
| Harkema [26] | Chronic Paraplegia | ES over L5-S1 7 months of BWSTT |
|
| Huang [31] | C5-6 AIS C Tetraplegia T8 AIS Paraplegia | ES over T10-L2 with BWSTT |
|
| Grahn [32] | T6 AIS A Paraplegia | ES over L5-S1 2 weeks of supported movement |
|
| Rejc [33] | C7 AIS A | ES over L5-S1 |
|
| Subject ID | Randomization | Assignment | Order in the Group |
|---|---|---|---|
| 0881 | 1 | EAW + ES + RT | 1 |
| 0882 | 1 | EAW + ES + RT | 2 |
| 0883 | 0 | EAW + delayed-ES + noRT | 1C |
| 0884 | 1 | EAW + ES + RT | 3 |
| 0885 | 0 | EAW + delayed-ES + noRT | 2C |
| 0886 | 1 | EAW + ES + RT | 4 |
| 0887 | 1 | EAW + ES + RT | 5 |
| 0888 | 0 | EAW + delayed-ES + noRT | 3C |
| 0889 | 0 | EAW + delayed-ES + noRT | 4C |
| 08810 | 0 | EAW + delayed-ES + noRT | 5C |
| 08811 | 0 | EAW + delayed-ES + noRT | 6C |
| 08812 | 0 | EAW + delayed-ES + noRT | 7C |
| 08813 | 0 | EAW + delayed-ES + noRT | 8C |
| 08814 | 0 | EAW + delayed-ES + noRT | 9C |
| 08815 | 1 | EAW + ES + RT | 6 |
| 08816 | 1 | EAW + ES + RT | 7 |
| 08817 | 1 | EAW + ES + RT | 8 |
| 08818 | 1 | EAW + ES + RT | 9 |
| 08819 | 1 | EAW + ES + RT | 10 |
| 08820 | 0 | EAW + delayed-ES + noRT | 10C |
| Progression | ||
|---|---|---|
| Both feet flat on the floor with the knees and hips flexed > 90-degrees | Both feet flat on the floor with the knees and hips flexed = to 90 degrees | Both feet flat on the floor with the knees and hips flexed < 90 degrees |
| 4 sets of 10 reps | 4 sets of 10 reps | 4 sets of 10 reps |
| Subject ID | TT + LPWS/NMES | Baseline 1 | Post-Intervention | Post-Intervention 2 | Sex | LOI | TSI (yrs.) | AIS | Classification |
|---|---|---|---|---|---|---|---|---|---|
| 0881 | EAW + ES + RT | C | C | C | M | C8 | 5 | A | Tetraplegia |
| 0882 | EAW + ES + RT | C | C | X | M | T11 | 7 | B | Paraplegia |
| 0883 | EAW + delayed-ES + noRT | C | C | C | M | T6 | 12 | A | Paraplegia |
| 0884 | EAW + ES + RT | C | C | C | M | T4 | 24 | A | Paraplegia |
| 0885 | Withdrew | X | X | X | M | T7 | 2 | B | Paraplegia |
| 0886 | Withdrew | X | X | X | M | T9 | 3 | A | Paraplegia |
| 0887 | Screen failed | X | X | X | M | T3 | 2.5 | A | Paraplegia |
Disclaimer/Publisher’s Note: The statements, opinions and data contained in all publications are solely those of the individual author(s) and contributor(s) and not of MDPI and/or the editor(s). MDPI and/or the editor(s) disclaim responsibility for any injury to people or property resulting from any ideas, methods, instructions or products referred to in the content. |
© 2025 by the authors. Licensee MDPI, Basel, Switzerland. This article is an open access article distributed under the terms and conditions of the Creative Commons Attribution (CC BY) license (https://creativecommons.org/licenses/by/4.0/).
Share and Cite
Gorgey, A.S.; Trainer, R.; Khalil, R.E.; Deitrich, J.; Rehman, M.U.; Goetz, L.L.; Lester, D.; Klausner, A.; Peterson, C.L.; Lavis, T. Epidural Stimulation and Resistance Training (REST-SCI) for Overground Locomotion After Spinal Cord Injury: Randomized Clinical Trial Protocol. J. Clin. Med. 2025, 14, 1829. https://doi.org/10.3390/jcm14061829
Gorgey AS, Trainer R, Khalil RE, Deitrich J, Rehman MU, Goetz LL, Lester D, Klausner A, Peterson CL, Lavis T. Epidural Stimulation and Resistance Training (REST-SCI) for Overground Locomotion After Spinal Cord Injury: Randomized Clinical Trial Protocol. Journal of Clinical Medicine. 2025; 14(6):1829. https://doi.org/10.3390/jcm14061829
Chicago/Turabian StyleGorgey, Ashraf S., Robert Trainer, Refka E. Khalil, Jakob Deitrich, Muhammad Uzair Rehman, Lance L. Goetz, Denise Lester, Adam Klausner, Carrie L. Peterson, and Timothy Lavis. 2025. "Epidural Stimulation and Resistance Training (REST-SCI) for Overground Locomotion After Spinal Cord Injury: Randomized Clinical Trial Protocol" Journal of Clinical Medicine 14, no. 6: 1829. https://doi.org/10.3390/jcm14061829
APA StyleGorgey, A. S., Trainer, R., Khalil, R. E., Deitrich, J., Rehman, M. U., Goetz, L. L., Lester, D., Klausner, A., Peterson, C. L., & Lavis, T. (2025). Epidural Stimulation and Resistance Training (REST-SCI) for Overground Locomotion After Spinal Cord Injury: Randomized Clinical Trial Protocol. Journal of Clinical Medicine, 14(6), 1829. https://doi.org/10.3390/jcm14061829