1. Introduction
Salivary gland tumors are uncommon, representing only 5% of head and neck tumors [
1,
2]. Diagnosing these tumors is challenging due to their rarity, varied clinical presentations, and diverse histological characteristics. Regarding salivary gland tumors, the oral cavity is the second most frequently affected site after the parotid gland [
3,
4]. Distinguishing between benign salivary gland tumors (BSGTs) and malignant salivary gland tumors (MSGT) is particularly difficult because of overlapping clinical features, underscoring the need for advanced diagnostic tools [
4]. GNP-EGFR use for bio-imaging suspected malignant salivary gland tumors may enhance tumor identification.
Nanomedicine has gained significant attention in recent years, particularly the use of nanoparticles for diagnostic purposes and targeted drug delivery to cancerous tissues [
5,
6,
7,
8]. Nanophotonics, which exploits the light absorption properties of gold nanoparticles (GNPs) in the red to infrared spectrum, offers a promising avenue for cancer detection and imaging [
9]. GNPs conjugated with anti-epidermal growth factor receptor (GNPs-EGFR) monoclonal antibodies selectively bind to cancer cells with elevated EGFR expression [
10,
11,
12]. Recent studies utilizing GNPs-EGFR have demonstrated significant differentiation between malignant and benign oral lesions [
9,
10,
11,
12].
Increased EGFR expression has been observed in malignant compared to benign salivary gland tumors, correlating with tumor grade [
13,
14,
15,
16,
17]. The superficial location of these tumors and their high EGFR expression levels make them ideal candidates for nanophotonic methods, enabling the detection of GNPs-EGFR reflections on tumor cells.
The objectives of the present study were to evaluate the detection sensitivity of GNPs-EGFR in a subset of human salivary gland tumors for discriminating benign from malignant tumors with histopathology as a gold standard. The reflectance spectra were captured using hyperspectral imaging microscopy.
2. Materials and Methods
Archival cases, previously diagnosed as malignant and benign salivary gland tumors, as well as normal salivary glands, were selected from the archives of the oral and maxillofacial surgery departments at Tzafon Medical Center, Sourasky Medical Center, and Barzilay Medical Center.
The study was approved by the Institutional Review Board of Poriya Medical Center (approval # POR-0011-21), Bazilay Medical Center (approval # BRZ-0111), and the Tel-Aviv Sourasky Medical Center (approval # 0158-18-tlv). The study was performed in accordance with the Declaration of Helsinki, seventh revision (2013). All cases were anonymous, and informed consent was not required. Data concerning age, gender, and salivary gland involvement were recorded.
The cases were divided according to histopathologic diagnosis based on the 5th edition of the World Health Organization (WHO) classification of head and neck tumors [
18]. The samples originated from both minor and major salivary glands. The original slides were reviewed, and the diagnosis was confirmed by two of the researchers, both certified oral pathologists (A.H., I.A.). Only cases with definitive diagnoses based on histopathology were included.
From each paraffin-embedded block, three consecutive 5 μm sections were cut on a glass slide. The first was stained with hematoxylin and eosin (H&E) to confirm the diagnosis, the second was used for an immunohistochemical stain for anti-EGFR (NBP1-84814-25ul, Novus Biologicals, Centennial, CO, USA), and an unstained slide was submitted for hyperspectral imaging. The area of interest (AOI) was marked on the H&E-stained slide and copied exactly on the other slides; the hyperspectral imaging and the immunohistochemical measurements were performed only within the AOI.
2.1. GNPs Fabrication and Targeting
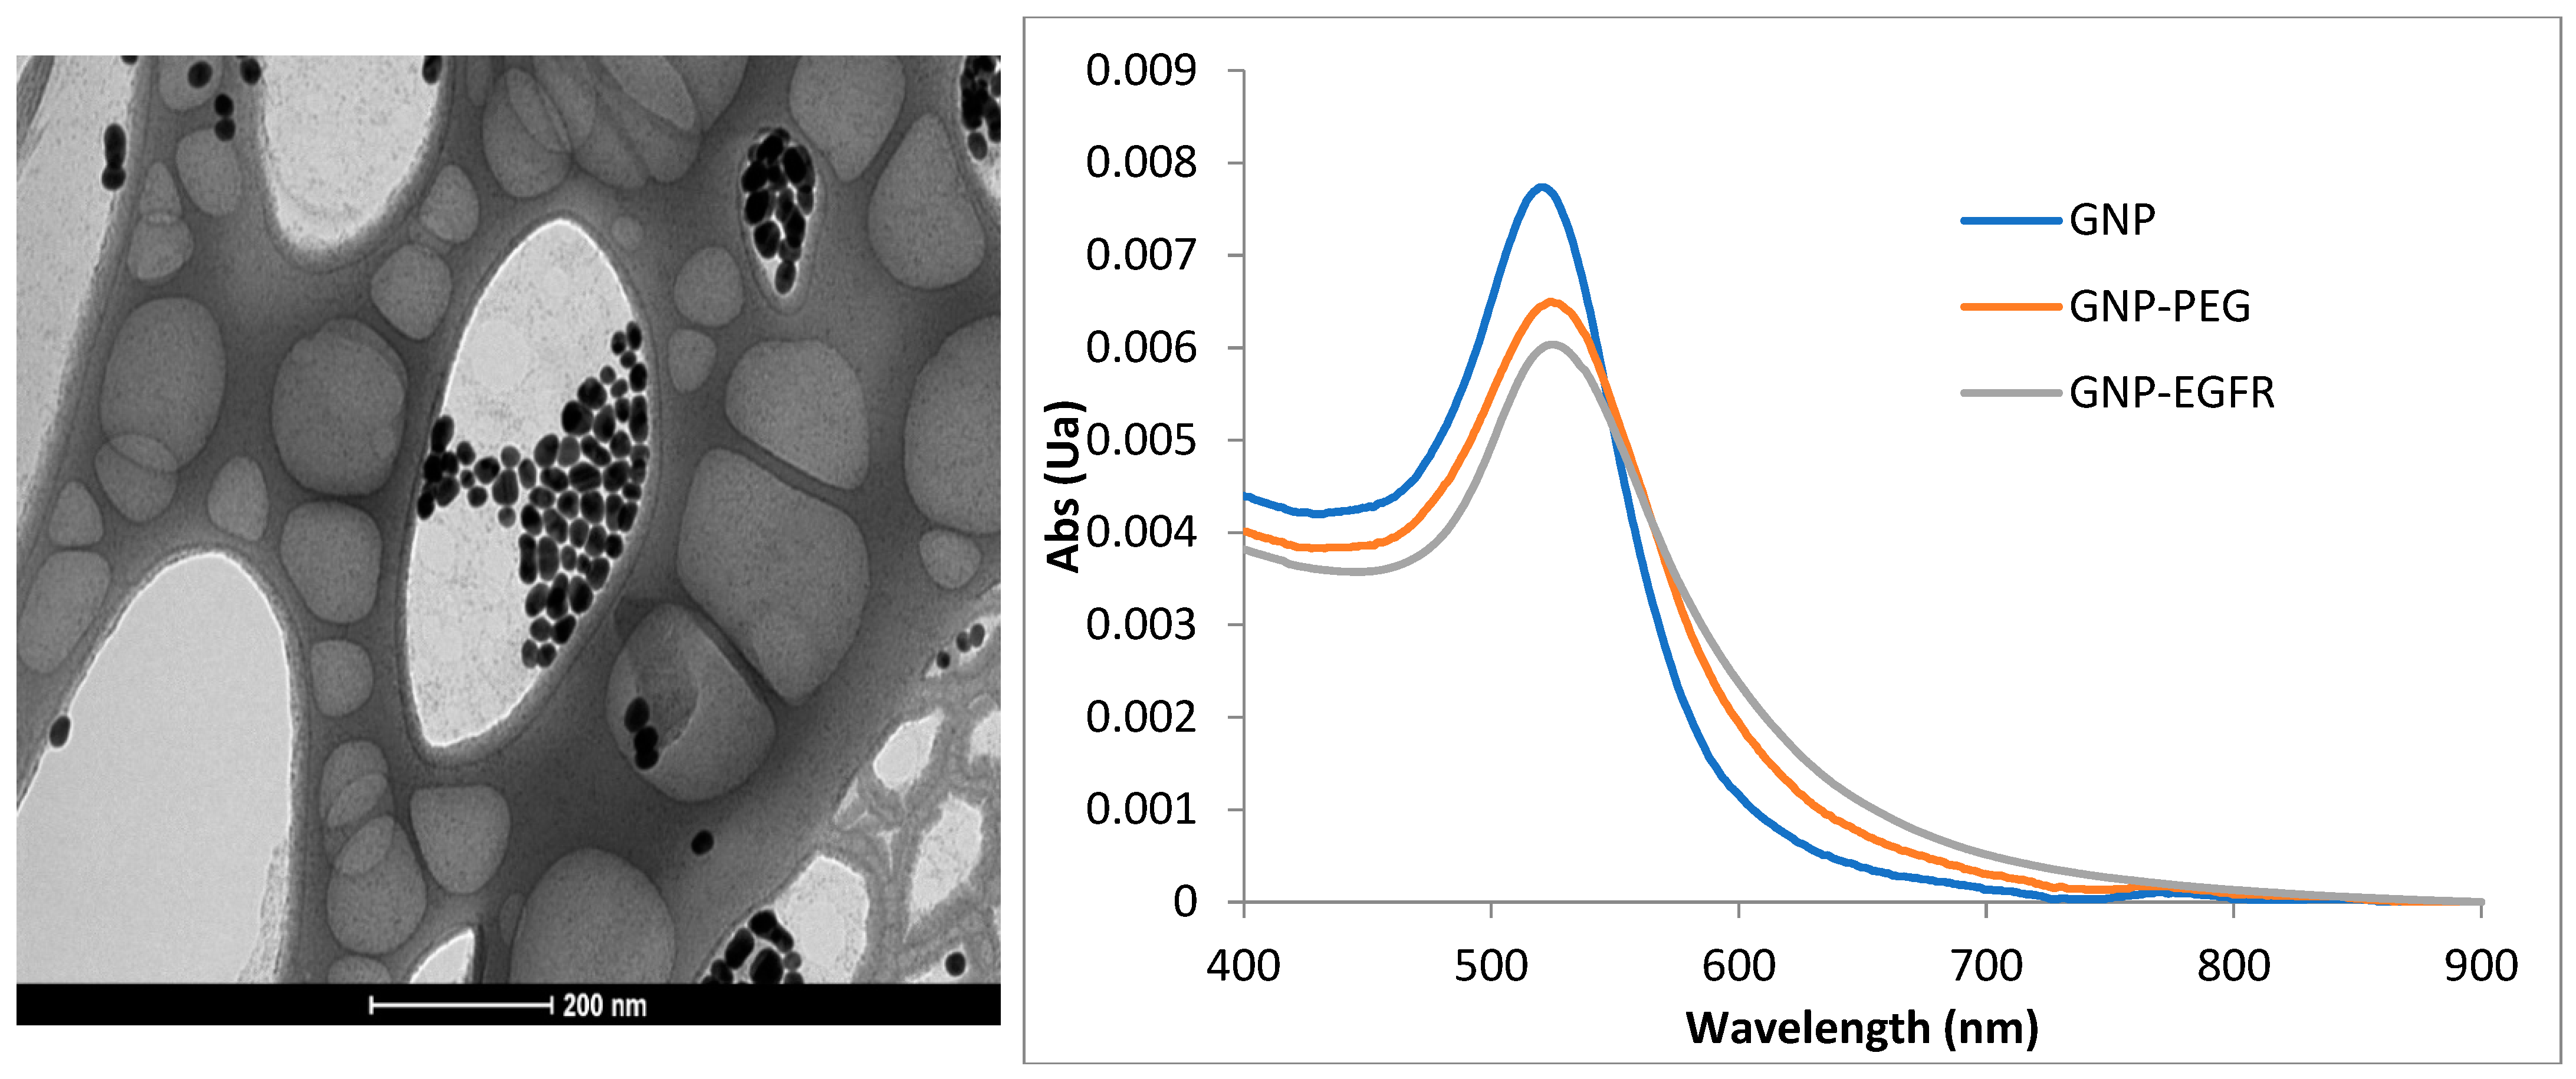
Self-fabricated gold nanospheres (GNSs) conjugated with anti-EGFR monoclonal antibody Cetuximab (GNS-EGFR) at a concentration of 6 mg/mL were used. Spectrophotometer analysis determined an extinction peak of 530 nm for the GNS-EGFR. GNSs were prepared following the Enüstün and Turkevich method [
19], and their uniformity and size were confirmed using a transmission electron microscope. Polyethylene glycol (PEG) was applied to prevent aggregation, and bioconjugation to anti-EGFR antibodies was achieved using the Lvov polystyrene sulfonate method [
20]. Bioconjugation was validated using zeta potential and dynamic light scattering measurements.
2.2. Hyper Spectral Imaging System
Reflectance measurements were conducted using a hyperspectral imaging system (Nuance, CRi, MA) equipped with a halogen illuminator, a 32-bit ultrasensitive CCD camera detector, and a 40× objective lens. Images were acquired at 530 nm using Nuance software, version 2.1. Reflectance intensities were analyzed after subtracting background and glass spectra. Slides were scanned before and after applying GNS-EGFR for control comparisons (
Figure 1).
2.3. Immunohistochemistry
Immunohistochemical stain for anti-EGFR (NBP1-84814-25ul, Novusbio) was used according to the protocol of the manufacturer. Tumor cells were identified in each spot by comparison with the H&E-stained consecutively cut.
EGFR expression was evaluated semi-quantitatively based on staining intensity (0, 1+, 2+, 3+) and the fraction of positive tumor cells on the histological slides. Only cells with membranous staining were scored. A composite score was calculated as follows [
15]:
0: No staining or membranous staining in <10% of tumor cells.
1: Faint, incomplete membranous staining in ≥10% of tumor cells.
2+: Weak to moderate membranous staining in ≥10% of tumor cells.
3+: Strong membranous staining in ≥10% of tumor cells.
2.4. Statistics
The main goal of the analysis was to investigate the power of GNS-EGFR reflectance measurements in discriminating between normal salivary glands and benign and malignant salivary gland tumors.
Hyperspectral measurements were taken from the AOI of each slide and sample and are therefore not homogenous and nonlinear mixed effect models, which is a standard method for repeated measured data that cannot be used. Instead, we defined two intensity indices for each case, maximum and average. We performed analyses for both values; however, the maximum value is more important.
The status of the patient was defined as A for controls (normal salivary gland), B for BSGT, and C for MSGT.
Due to a relatively small sample size and skewed distribution of intensity, we paid attention to the dependence of the results on the method of analysis.
Cuzick’s non-parametric test for trend to test the different diagnoses by three groups and also by nine subgroups.
Mann–Whitney and t-test to compare between the three groups (normal vs. BSGT and BSGT Vs MSGT).
Mann–Whitney and t-test tests to compare between the EGFR immunohistochemical grades in accordance with hyperspectral microscopy results (healthy vs. BSGT and BSGT vs. MSGT).
We investigated the distribution of the hyperspectral imaging and defined the best cut-point. The sensitivity and specificity are presented for this cut-point. Discrimination ability between classes of maximum or average intensity was tested using exact logistic regression and receiver operating characteristic (ROC) analysis.
The analysis was performed using STATA 16 SE software. All tests were two-sided. p-values under 0.05 were described as significant.
3. Results
A total of 49 cases were examined.
Table 1 summarizes the various groups: Group A included 12 cases of normal salivary glands; Group B, BSGT, included 15 cases of pleomorphic adenoma; Group C, MSGT, included 22 cases divided into six subgroups: squamous cell carcinoma, polymorphous low-grade carcinoma, salivary duct carcinoma, mucoepidermoid carcinoma, adenoid cystic carcinoma, and acinic cell carcinoma.
A total of 19 of the cases originated from minor salivary glands, and 30 originated from major salivary glands.
The most effective discriminating statistic was derived from the maximum intensities measured by hyperspectral microscopy, reflecting the maximum absorption values of GNP-EGFR. The optimal cut-off point for this statistical analysis was determined to be 100 arbitrary units (Au).
Immunohistochemical expression of EGFR score was evaluated using intensity (0, 1+, 2+, 3+) and the fraction of positive cells at the AOI. The 0 and 1 intensities were combined and referred to as 1 due to the low number of samples ranked as 0 and the clinical meaning of the results (both refer to the control group).
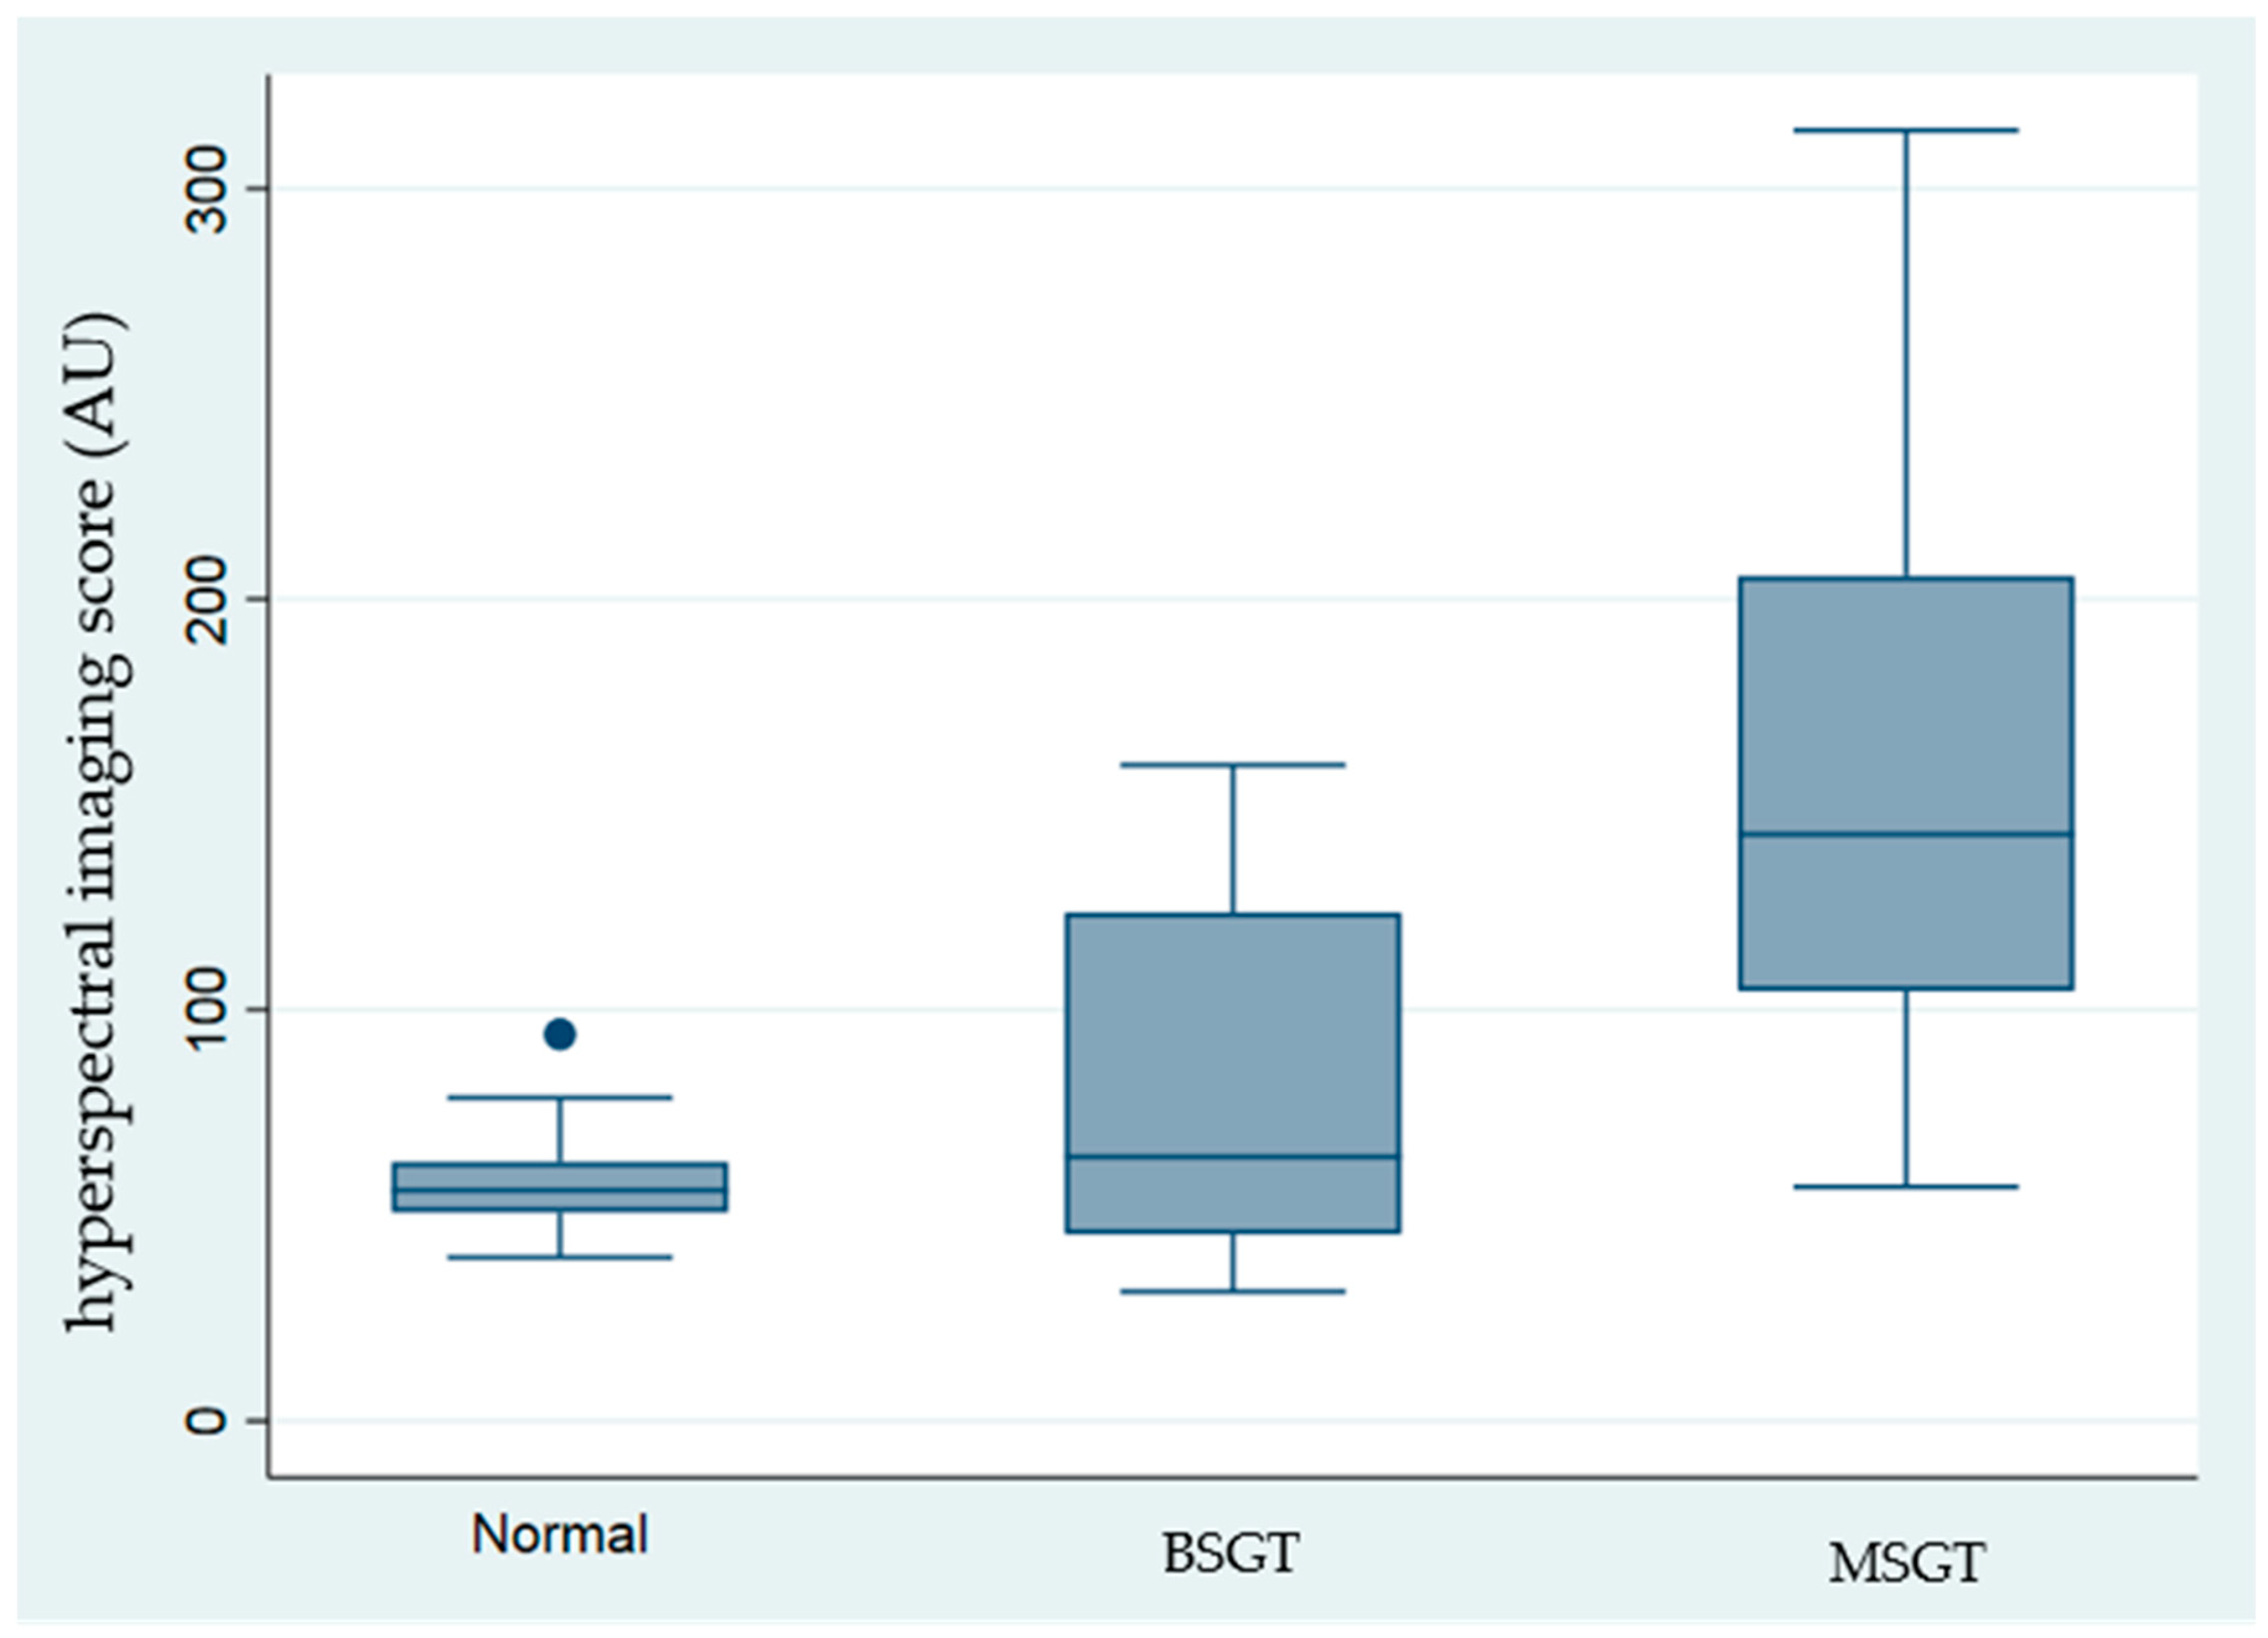
Table 1 and
Figure 2 present the recorded hyperspectral values alongside the EGFR immunobiological score. The highest values were recorded in MSGT, mainly in the adenoid cystic carcinoma and acinic cell carcinoma subgroups (203.3 ± 50.71 and 212.29 ± 62.29, respectively).
The average EGFR immunohistochemical score was 3 ± 0 for the adenoid cystic carcinoma subgroup and 2.67 ± 0.47 for acinic cell carcinoma. The lowest values were measured in the normal salivary gland group with hyperspectral values of 50.68 ± 16.29 and an EGFR score of 0.83 ± 0.55, reflecting the low concentration of EGFR. Intermediate values were recorded in pleomorphic adenoma 69.79 ± 27.97, 1.2 ± 0.4, respectively. The mucoepidermoid carcinoma group is composed of high-grade and low-grade tumors. Due to the low number of samples, the two groups were combined. The mean hyperspectral values were 114.57 ± 48.77, and the EGFR score was 2.14 ± 0.83.
Figure 2, the Cuzick non-parametric test of trend, revealed that significantly high intensities were recorded in the malignant salivary gland tumors, compared with benign and control groups (
p < 0.001).
Mann–Whitney and
t-tests were performed to compare between all groups (
Table 2 and
Table 3). Both tests found significant differences comparing normal salivary glands (group A) and MSGT (group C) (
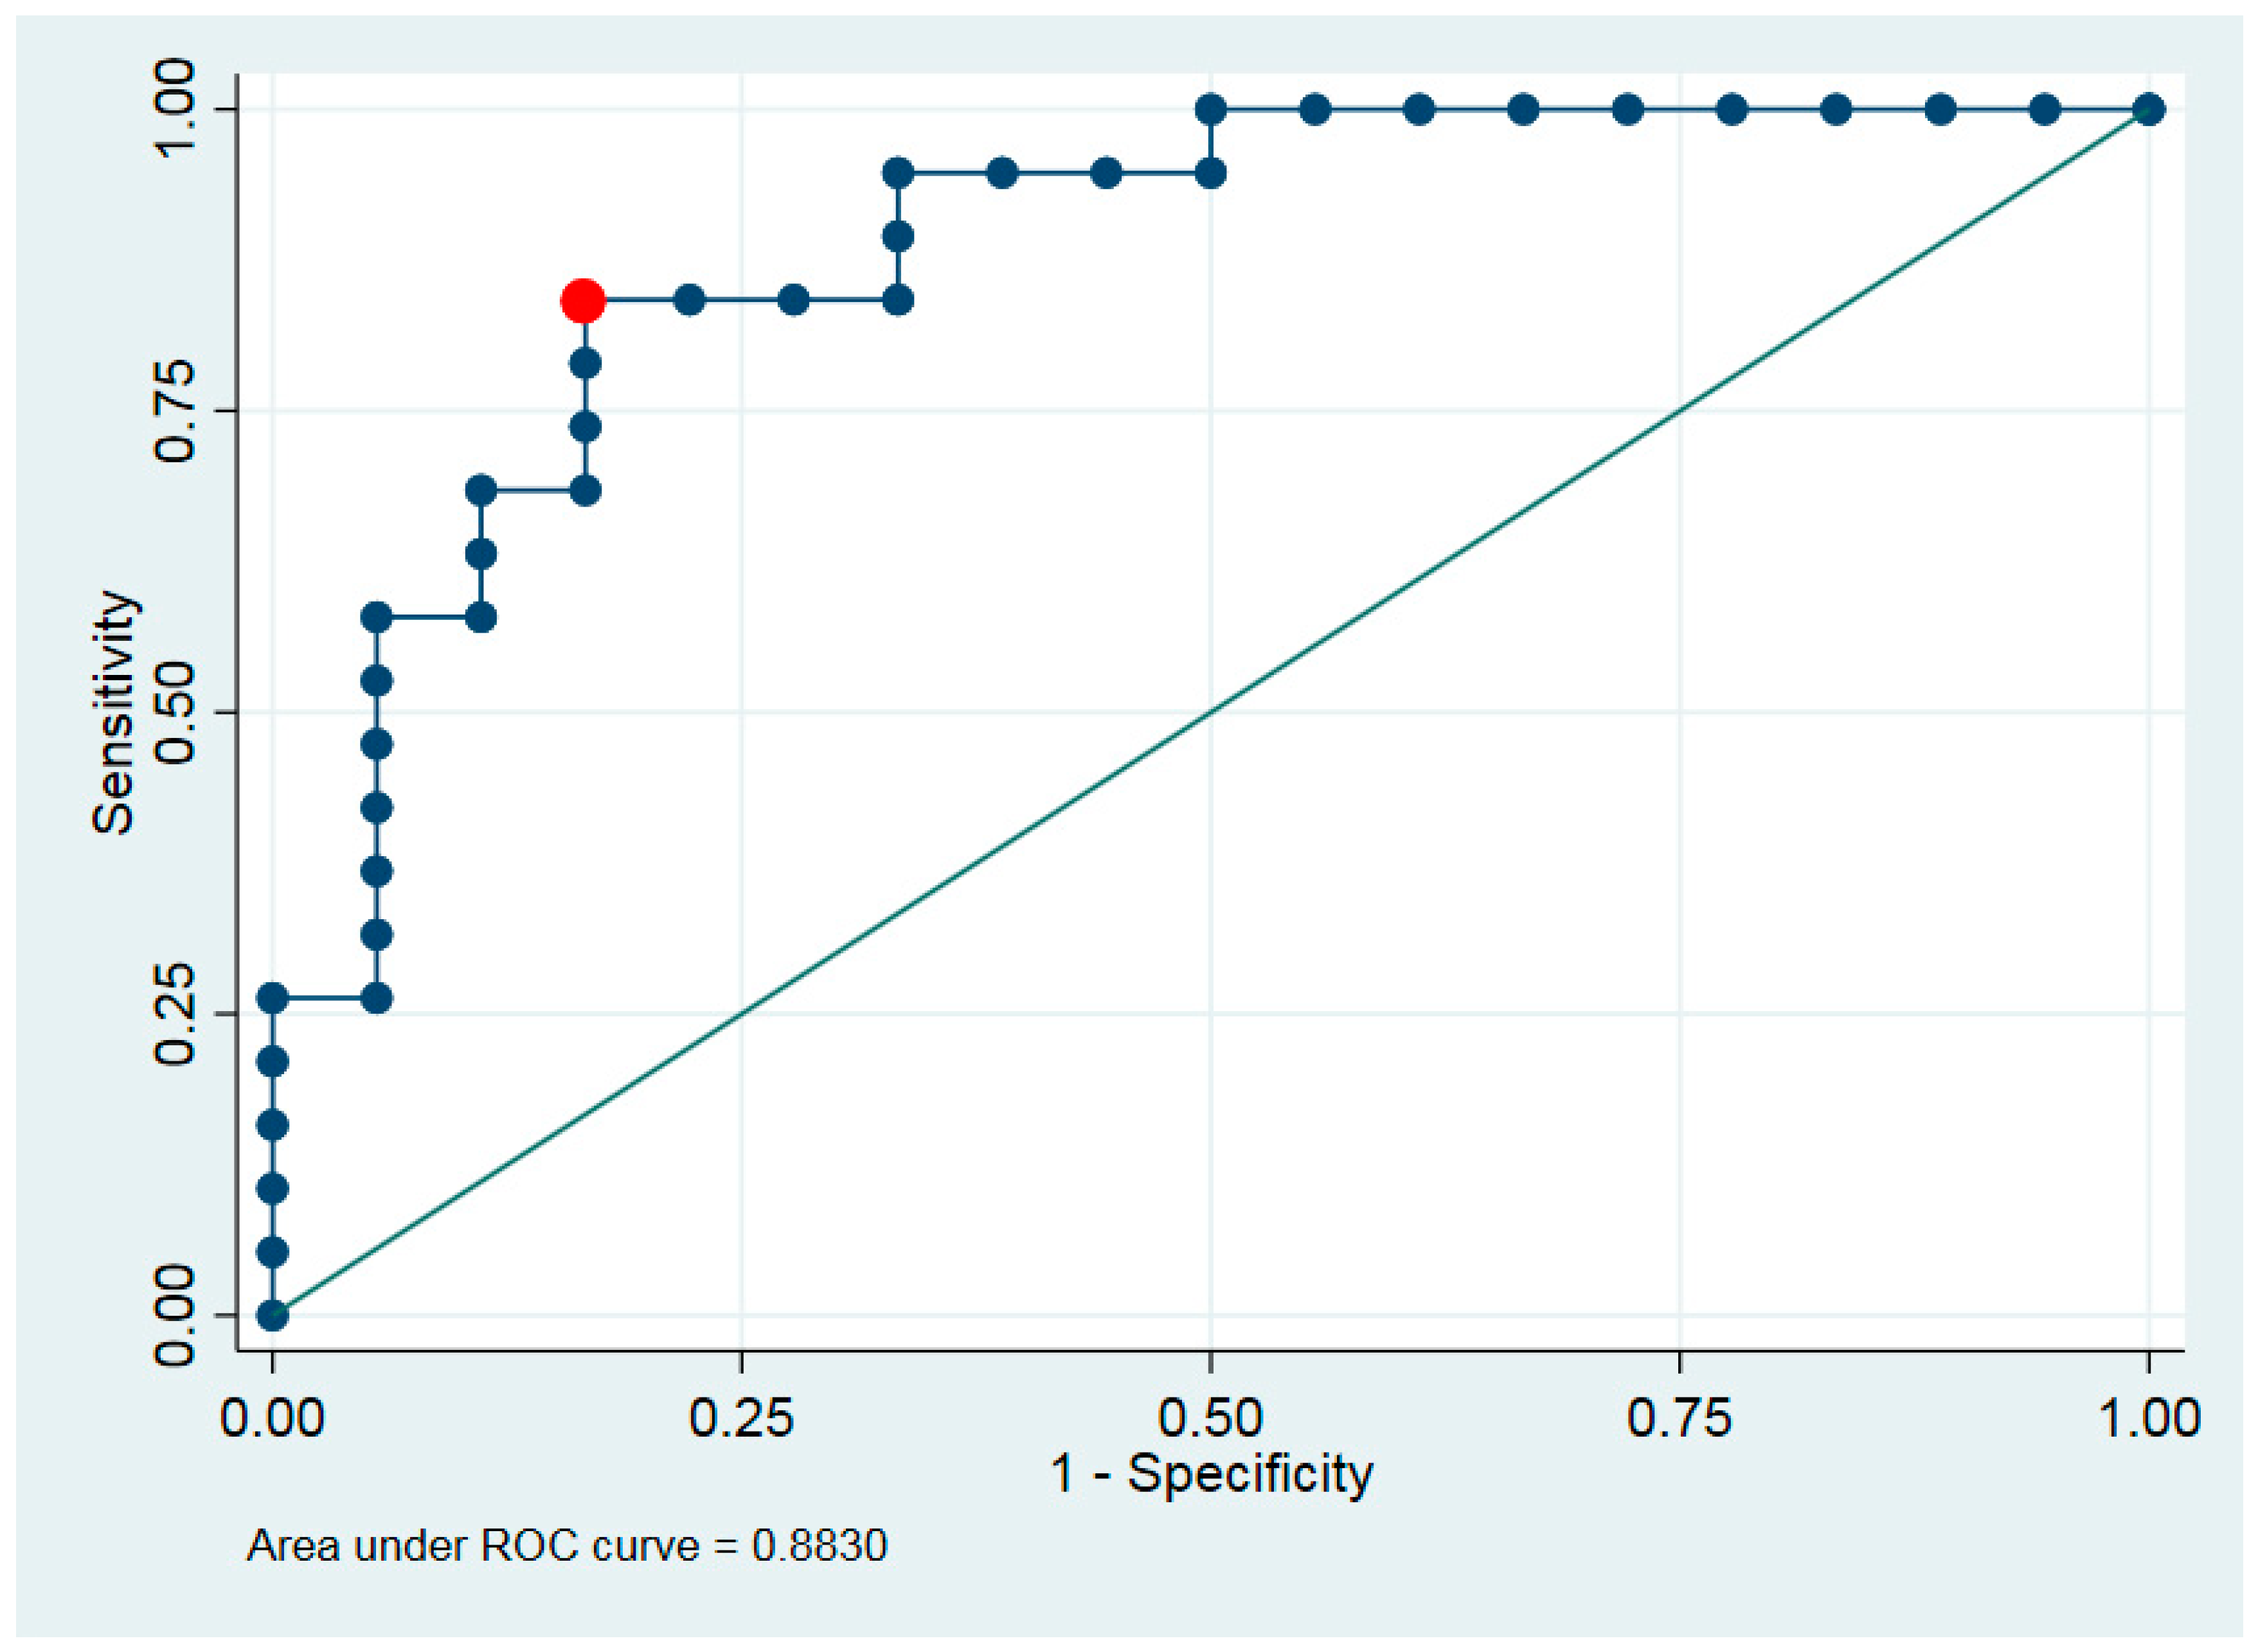
p < 0.005). Comparing MSGT with normal salivary glands revealed a sensitivity of 79% and a specificity of 100%. Comparing between MSGT (group C) and the other groups (normal salivary gland—A, and BSGT—B), the sensitivity was 79% and specificity 83% (
p < 0.01).
The comparison between normal salivary gland tumor (A) and BSGT (B) was insignificant (p > 0.05). Similar results were found comparing the differences in highest intensity scores and the immunohistochemical EGFR staining grade.
The differences between groups A vs. B and B vs. C were significant even after Bonferroni adjustment for multiple comparisons (
p-values of
t-test and Mann–Whitney test were less than 0.001) (
Table 2 and
Table 3).
The average hyperspectral values strongly correlate with the EGFR immunohistochemical score and differ between the subgroups. All paired comparisons had p < 0.001 even after corrections for multiple comparisons.
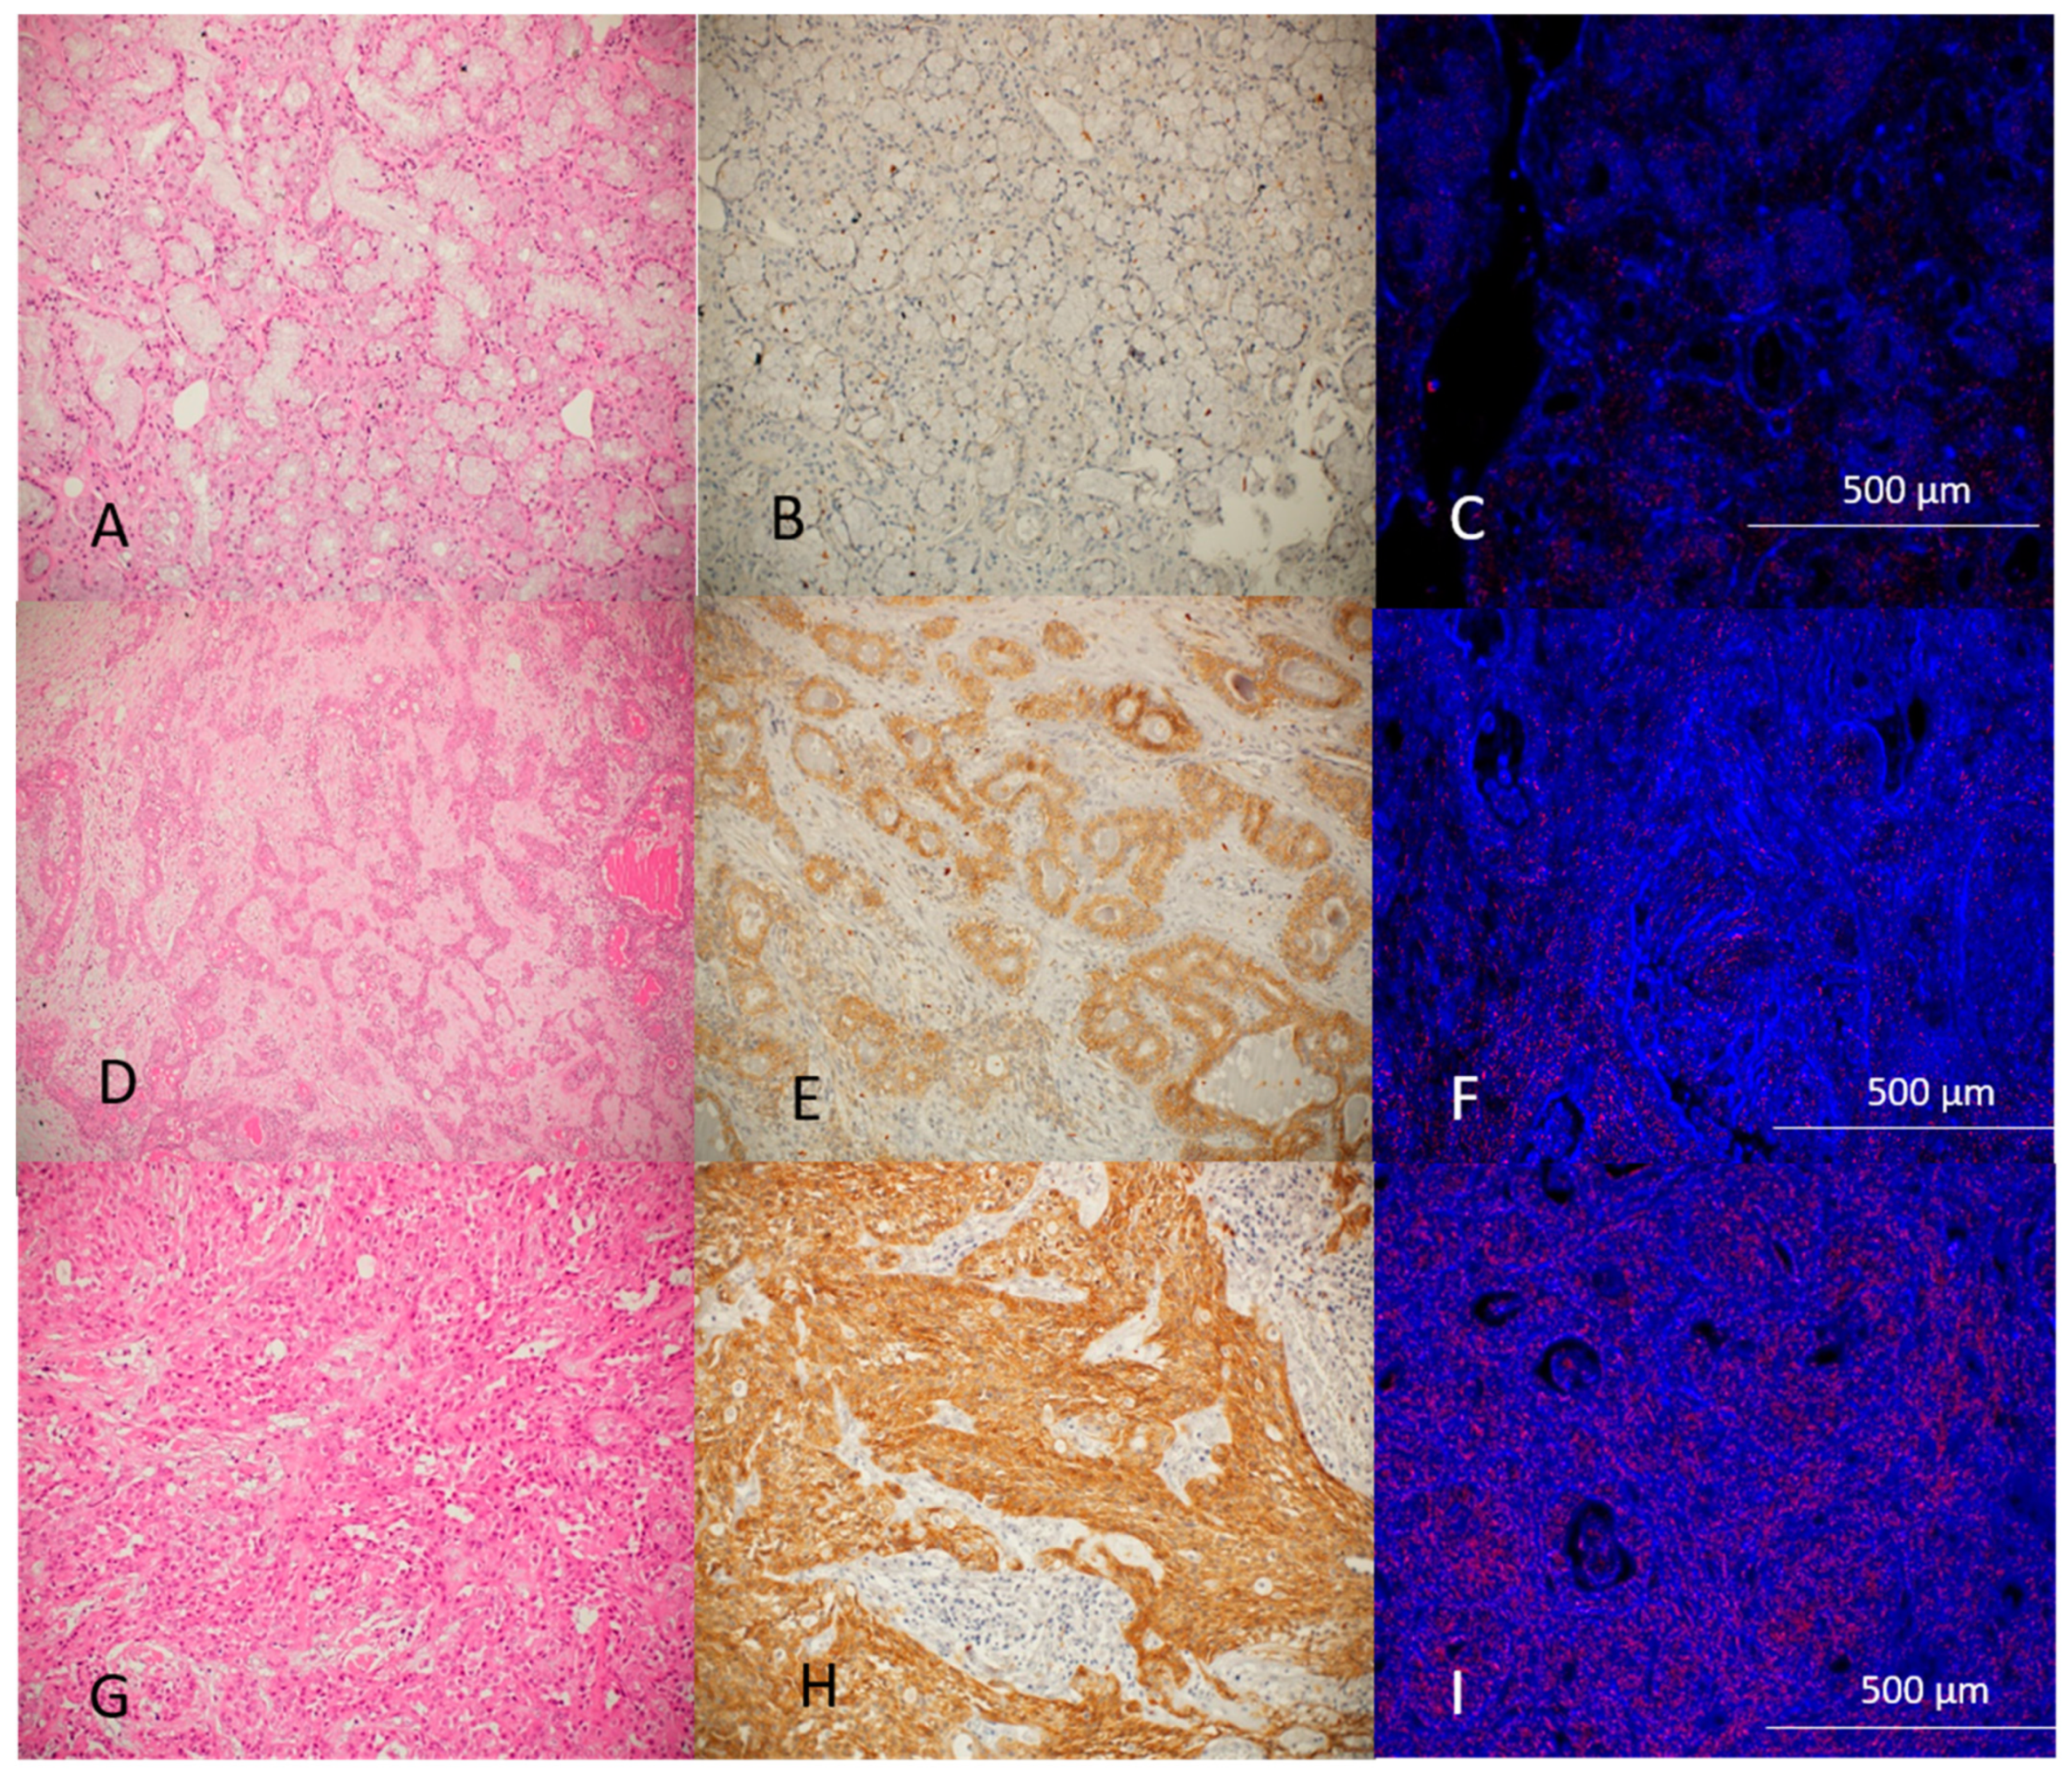
Figure 3 demonstrates the histological, immunohistochemical, and hyperspectral imaging of normal salivary glands, benign tumors, and malignant tumors. GNP-EGFR are marked as red dots concentrated in higher amounts at MSGT as well as high intensity of immunohistochemical stain.
Discrimination ability was characterized by area under ROC curve (AUC) (
Figure 4).
4. Discussion
The ability to distinguish between benign and malignant salivary gland tumors preoperatively is essential for determining the most appropriate surgical approach, particularly for small intraoral tumors. Although imaging modalities such as ultrasonography, CT, and MRI have been explored, their diagnostic value is often limited due to challenges in accurately defining tumor margins and tissue characteristics [
21,
22,
23]. For intraoral salivary gland tumors, clinical examination remains the primary diagnostic approach; however, histological confirmation is mandatory as clinical appearance alone cannot reliably predict tumor behavior.
Fine-needle aspiration (FNA) is a commonly employed method for diagnosing salivary gland masses, especially for major glands like the parotid and submandibular glands. While FNA offers the advantages of minimal invasiveness and low complication risk, its diagnostic accuracy can be inconsistent. Sensitivity and specificity rates vary widely across studies, with recent meta-analyses reporting sensitivity as low as 65% and specificity around 97% [
24,
25,
26]. FNA also lacks the ability to assess critical histological factors such as tumor grade, lymphatic involvement, and perineural invasion, which are crucial in determining the extent of surgical resection and the need for adjuvant therapy [
27].
The present study demonstrates the power of direct GNP-EGFR reflectance measurements as a novel method for discriminating benign from malignant salivary gland neoplasms and even suggesting a specific tumor detection method. Significantly high intensity, corresponding with the maximum absorption values of the GNS-EGFR, has been found in malignant neoplasms compared with benign tumors. To strengthen our results, due to the rarity and diversity of the lesion, we used different statistical analysis methods.
The use of optical techniques for tumor diagnosis is a relatively new frontier in medicine. These methods leverage the unique light absorption properties of GNPs in the red-to-infrared spectrum, which enables targeted imaging of cancer cells. GNP-EGFR specifically binds to cells with high EGFR expression, making it a powerful tool for distinguishing malignant tumors [
9,
10,
11,
12]. Our previous studies demonstrated the efficacy of GNP-EGFR in differentiating oral squamous cell carcinoma from less severe lesions, and the current findings extend this potential to salivary gland tumors [
9,
11,
12].
An increased number of reports have been published in recent years on the expression of epidermal growth factor receptor in salivary gland tumors due to the potential for treatment with targeted therapy, particularly in aggressive salivary duct carcinomas [
13,
14,
15,
16,
17]. Using immunohistochemistry and FISH analysis performed on surgical material disclosed an increased expression of EGFR in malignant as opposed to benign salivary gland tumors, correlating with the grade of the tumor [
13,
14,
15,
16,
17]. The results of the present study using semi-quantitative analysis of the immunohistochemical stain with anti-EGFR agree with previous reports [
10,
11,
12], revealing a significant statistical difference between malignant and benign salivary gland tumors with a significant correlation with the nanophotonic results. The diversity inside the subgroups can be referred to as the histological grade of the tumor. The hyperspectral values for high-grade malignancy were higher than in low-grade tumors.
Reflectance measurements of GNP-EGFR attached to tumor cells have great potential in several clinical aspects. It may serve as an objective method augmenting the histopathologic diagnosis, as has been shown in the present study. The use of GNP-EGFR for bio-imaging of suspected malignant salivary gland tumors may enhance tumor identification. Added GNPs as contrast agents for X-ray, computed tomography (CT), surface-enhanced Raman scattering, and photoacoustic tomography (PAT) have been proven to be useful in imaging body structures, providing a relatively high spatial resolution [
7,
28,
29]. In accordance with our latest research in the field of oral cancer [
12], using the in vivo diffusion–reflection method may provide a highly sensitive tool for non-invasive clinical tumor detection in discriminating benign from malignant salivary gland tumors, determining the surgical margins accurately, and detecting residual disease in the surgical bed intraoperatively, and this study can be used as a proof of concept for that.
The limitations of our method derive from its reliance on nanoparticles coated with antibodies, as not all salivary gland malignancies express the same antibodies or share identical molecular markers [
30,
31]. Therefore, a panel of antibodies is required for the specific and definitive diagnosis of the tumors. Further advancements and research are essential to enhance the diagnostic capabilities of this approach.
Accurate and early detection of MSGT is a critical challenge. The relatively superficial presence of these lesions and the overexpression of EGFR make them ideal for the use of nanophotonic-based detection.
The development of various nanophotonic technologies for in vivo applications will have a substantial impact on the field of early cancer detection.
5. Conclusions
The GNPs-EGFR reflection measurements effectively differentiate malignant from benign salivary gland tumors. We anticipate that employing the diffusion–reflection method in vivo could offer a highly sensitive tool for clinical tumor detection, aiding in the distinction between benign and malignant salivary gland tumors, accurately determining surgical margins, and detecting residual disease in the surgical bed during surgery.
Author Contributions
Conceptualization, S.S. and A.H.; methodology, D.F. and A.H.; validation S.S., A.H. and D.F.; formal analysis, S.S. and I.A.; investigation, S.S. and I.A.; data curation, I.K., I.A. and I.A.E.-N.; writing—original draft preparation, S.S. and A.H.; writing—review and editing, I.A., I.A.E.-N. and D.F.; supervision, A.H. and D.F. All authors have read and agreed to the published version of the manuscript.
Funding
This study was supported by the Israel Science Foundation (grant No. 1760/16).
Institutional Review Board Statement
The study was performed in accordance with the Declaration of Helsinki, seventh revision (2013). The study was approved by the Institutional Review Board of Poriya Medical Center (approval # POR-0011-21, 11.3.2021), Bazilay Medical Center (approval # BRZ-0111, 6 August 2023) and the Tel-Aviv Sourasky Medical Center (approval # 0158-18-tlv, 19 November 2018).
Informed Consent Statement
All cases were anonymous, and informed consent was not required.
Data Availability Statement
The raw data supporting the conclusions of this article will be made available by the authors on request.
Acknowledgments
The authors thank Ilya Novikov, Biostatistical unit, Gertner Institute for Epidemiology and Health Policy Research, Ramat Gan, Israel for help with the statistical analysis.
Conflicts of Interest
The authors report no conflicts of interest in this work.
References
- To, V.S.; Chan, J.Y.; Tsang, R.K.; Wei, W.I. Review of salivary gland neoplasms. ISRN Otolaryngol. 2012, 2012, 872982. [Google Scholar] [CrossRef] [PubMed]
- Mckenzie, J.; Lockyer, J.; Singh, T.; Nguyen, E. Salivary gland tumours: An epidemiological review of non-neoplastic and neoplastic pathology. Br. J. Oral Maxillofac. Surg. 2023, 61, 12–18. [Google Scholar] [CrossRef]
- Seethlala, R.R. Salivary gland tumors: Current concepts and controversies. Surg. Pathol. Clin. 2017, 10, 155–176. [Google Scholar] [CrossRef] [PubMed]
- Seethlala, R.R.; Stenman, G. Update from the 4th Edition of the World Health Organization classification of head and neck tumours: Tumors of the salivary gland. Head Neck Pathol. 2017, 11, 55–67. [Google Scholar] [CrossRef]
- Song, S.; Hao, Y.; Yang, X.; Patra, P.; Chen, J. Using Gold Nanoparticles as Delivery Vehicles for Targeted Delivery of Chemotherapy Drug Fludarabine Phosphate to Treat Hematological Cancers. J. Nanosci. Nanotechnol. 2016, 16, 2582–2586. [Google Scholar] [CrossRef]
- Biffi, S.; Voltan, R.; Bortot, B.; Zauli, G.; Secchiero, P. Actively targeted nanocarriers for drug delivery to cancer cells. Expert Opin. Drug Deliv. 2019, 16, 481–496. [Google Scholar] [CrossRef]
- Barnoy, E.A.; Motiei, M.; Tzror, C.; Rahimipour, S.; Popovtzer, R.; Fixler, D. Biological Logic Gate Using Gold Nanoparticles and Fluorescence Lifetime Imaging Microscopy. ACS Appl. Nano Mater. 2019, 2, 6527–6536. [Google Scholar] [CrossRef]
- Aminabad, N.S.; Farshbaf, M.; Akbarzadeh, A. Recent Advances of Gold Nanoparticles in Biomedical Applications: State of the Art. Cell Biochem. Biophys. 2019, 77, 123–137. [Google Scholar] [CrossRef]
- Fixler, D.; Ankri, R.; Kaplan, I.; Novikov, I.; Hirshberg, A. Diffusion Reflection: A Novel Method for Detection of Oral Cancer. J. Dent. Res. 2014, 93, 602–606. [Google Scholar] [CrossRef]
- Hirshberg, A.; Allon, I.; Novikov, I.; Ankri, R.; Ashkenaz, A.; Fixler, D. Gold–nanorods reflectance discriminate benign from malignant oral lesions. Nanomedicine 2017, 13, 1333–1339. [Google Scholar] [CrossRef]
- Ankri, R.; Ashkenazy, A.; Milstein, Y.; Brami, Y.; Olshinka, A.; Goldenberg-Cohen, N.; Popovtzer, A.; Fixler, D.; Hirshberg, A. Gold nano rods based airSEM and diffusion reflection imaging for mapping tumor margins in SCC cells. ACS Nano 2016, 10, 2349–2356. [Google Scholar] [CrossRef] [PubMed]
- Sudri, S.; Duadi, H.; Altman, F.; Allon, I.; Ashkenazy, A.; Chakraborty, R.; Novikov, I.; Fixler, D.; Hirshberg, A. Diffusion Reflection Method for Early Detection of Oral Squamous Cell Carcinoma Specifically Targeted by Circulating Gold-Nanorods Bio-Conjugated to Anti-Epidermal Growth Factor Receptor. Int. J. Nanomed. 2021, 16, 2237–2246. [Google Scholar] [CrossRef] [PubMed]
- Vidal, L.; Tsao, M.S.; Pond, G.R.; Cohen, E.E.W.; Cohen, R.B.; Chen, E.X.; Agulnik, M.; Hotte, S.; Winquist, E.; Laurie, S.; et al. Fluorescence in situ hybridization gene amplification analysis of EGFR and HER2 in patients with malignant salivary gland tumors treated with lapatinib. Head Neck 2009, 3, 1006–1012. [Google Scholar] [CrossRef]
- Masubuchi, T.; Tada, Y.; Maruya, S.-I.; Osamura, Y.; Kamata, S.-E.; Miura, K.; Fushimi, C.; Takahashi, H.; Kawakita, D.; Kishimoto, S.; et al. Clinicopathological significance of androgen receptor, HER2, Ki-67 and EGFR expressions in salivary duct carcinoma. Int. J. Clin. Oncol. 2015, 20, 35–44. [Google Scholar] [CrossRef]
- Can, N.T.; Lingen, M.W.; Mashek, H.; McElherne, J.; Briese, R.; Fitzpatrick, C.; van Zante, A.; Cipriani, N.A. Expression of Hormone Receptors and HER-2 in Benign and Malignant Salivary Gland Tumors. Head Neck Pathol. 2018, 12, 95–104. [Google Scholar] [CrossRef] [PubMed]
- Clauditz, T.S.; Gontarewicz, A.; Lebok, P.; Tsourlakis, M.-C.; Grob, T.J.; Münscher, A.; Sauter, G.; Bokemeyer, C.; Knecht, R.; Wilczak, W. Epidermal growth factor receptor (EGFR) in salivary gland carcinomas: Potentials as therapeutic target. Oral Oncol. 2012, 48, 991–996. [Google Scholar] [CrossRef]
- Schneider, T.; Strehl, A.; Linz, C.; Brands, R.; Hartmann, S.; Beckford, F.; Rosenwald, A.; Kübler, A.C.; Müller-Richter, U.D. Phosphorylated epidermal growth factor receptor expression and KRAS mutation status in salivary gland carcinomas. Clin. Oral Investig. 2016, 20, 541–551. [Google Scholar] [CrossRef]
- WHO Classification of Tumours Editorial Board. Head and neck tumours. In WHO Classification of Tumours Series, 5th ed.; International Agency for Research on Cancer: Lyon, France, 2022; Volume 9. Available online: https://publications.iarc.fr/ (accessed on 1 June 2023).
- Enustun, B.V.; Turkevich, J. Coagulation of colloidal gold. J. Am. Chem. Soc. 1963, 85, 3317–3328. [Google Scholar] [CrossRef]
- Ai, H.; Fang, M.; Jones, S.A.; Lvov, Y.M. Electrostatic layer-by-layer nanoassembly on biological microplates: Platelets. Biomacromolecules 2002, 3, 560–564. [Google Scholar] [CrossRef]
- Abdel Razek, A.A.K.; Mukherji, S.K. State-of-the-Art Imaging of Salivary Gland Tumors. Neuroimaging Clin. 2018, 28, 303–317. [Google Scholar] [CrossRef]
- Kong, X.; Li, H.; Han, Z. The diagnostic role of ultrasonography, computed tomography, magnetic resonance imaging, positron emission tomography/computed tomography, and real-time elastography in the differentiation of benign and malignant salivary gland tumors: A meta-analysis. Oral Surg. Oral Med. Oral Pathol. Oral Radiol. 2019, 128, 431–443. [Google Scholar] [CrossRef] [PubMed]
- Liu, Y.; Li, J.; Tan, Y.R.; Xiong, P.; Zhong, L.P. Accuracy of diagnosis of salivary gland tumors with the use of ultrasonography, computed tomography, and magnetic resonance imaging: A meta-analysis. Oral Surg. Oral Med. Oral Pathol. Oral Radiol. 2015, 119, 238–245.e2. [Google Scholar] [CrossRef]
- Schmidt, R.L.; Hall, B.J.; Wilson, A.R.; Layfield, L.J. A systematic review and meta-analysis of the diagnostic accuracy of fine-needle aspiration cytology for parotid gland lesions. Am. J. Clin. Pathol. 2011, 136, 45–59. [Google Scholar] [CrossRef] [PubMed]
- Liu, C.C.; Jethwa, A.R.; Khariwala, S.S.; Johnson, J.; Shin, J.J. Sensitivity, specificity, and posttest probability of parotid fine-needle aspiration: A systematic review and meta-analysis. Otolaryngol. Head Neck Surg. 2016, 154, 9–23. [Google Scholar] [CrossRef]
- Cho, J.; Kim, J.; Lee, J.S.; Chee, C.G.; Kim, Y.; Choi, S.I. Comparison of core needle biopsy and fine-needle aspiration in diagnosis of malignant salivary gland neoplasm: Systematic review and meta-analysis. Head Neck 2020, 42, 3041–3050. [Google Scholar] [CrossRef] [PubMed]
- Borsetto, D.; Iocca, O.; De Virgilio, A.; Boscolo-Rizzo, P.; Phillips, V.; Nicolai, P.; Spriano, G.; Fussey, J.; Di Maio, P. Elective neck dissection in primary parotid carcinomas: A systematic review and meta-analysis. J. Oral Pathol. Med. 2021, 50, 136–144. [Google Scholar] [CrossRef]
- Luke, G.P.; Myers, J.N.; Emelianov, S.Y.; Sokolov, K.V. Sentinel lymph node biopsy revisited: Ultrasound-guided photoacoustic detection of micrometastases using molecularly targeted plasmonic nanosensors. Cancer Res. 2014, 74, 5397–5408. [Google Scholar] [CrossRef]
- Kang, J.W.; So, P.T.C.; Dasari, R.R.; Lim, D.K. High resolution live cell Raman imaging using subcellular organelle-targeting SERS-sensitive gold nanoparticles with highly narrow intra-nanogap. Nano Lett. 2015, 15, 1766–1772. [Google Scholar] [CrossRef]
- Swid, M.A.; Li, L.; Drahnak, E.M.; Idom, H.; Quinones, W. Updated Salivary Gland Immunohistochemistry: A Review. Arch. Pathol. Lab. Med. 2023, 147, 1383–1389. [Google Scholar] [CrossRef]
- Foo, W.C.; Jo, V.Y.; Krane, J.F. Usefulness of translocation-associated immunohistochemical stains in the fine-needle aspiration diagnosis of salivary gland neoplasms. Cancer Cytopathol. 2016, 124, 397–405. [Google Scholar] [CrossRef]
| Disclaimer/Publisher’s Note: The statements, opinions and data contained in all publications are solely those of the individual author(s) and contributor(s) and not of MDPI and/or the editor(s). MDPI and/or the editor(s) disclaim responsibility for any injury to people or property resulting from any ideas, methods, instructions or products referred to in the content. |
© 2025 by the authors. Licensee MDPI, Basel, Switzerland. This article is an open access article distributed under the terms and conditions of the Creative Commons Attribution (CC BY) license (https://creativecommons.org/licenses/by/4.0/).


 ,
, 


