
Clinically Accessible Liver Fibrosis Association with CT Scan Coronary Artery Disease Beyond Other Validated Risk Predictors: The ICAP Experience

 , , and
Abstract
1. Introduction
2. Materials and Methods
2.1. Selection Criteria
2.2. Variables
2.3. CCTA Image Acquisition and Analysis
2.4. Statistical Analysis
3. Results
4. Discussion
5. Conclusions
Supplementary Materials
Author Contributions
Funding
Institutional Review Board Statement
Informed Consent Statement
Data Availability Statement
Acknowledgments
Conflicts of Interest
References
- World Health Organization. WHO European Regional Obesity Report 2022. Available online: https://www.who.int/europe/publications/i/item/9789289057738 (accessed on 6 May 2024).
- Cardiovascular Diseases (CVDs). Available online: https://www.who.int/news-room/fact-sheets/detail/cardiovascular-diseases-(cvds) (accessed on 26 May 2024).
- SCORE2 Working Group and ESC Cardiovascular Risk Collaboration. SCORE2 risk prediction algorithms: New models to estimate 10-year risk of cardiovascular disease in Europe. Eur. Heart J. 2021, 42, 2439–2454. [Google Scholar] [CrossRef] [PubMed]
- SCORE2-OP Working Group and ESC Cardiovascular Risk Collaboration. SCORE2-OP risk prediction algorithms: Estimating incident cardiovascular event risk in older persons in four geographical risk regions. Eur. Heart J. 2021, 42, 2455–2467. [Google Scholar] [CrossRef] [PubMed]
- Visseren, F.; Mach, F.; Smulders, Y.M.; Carballo, D.; Koskinas, K.C.; Bäck, M.; Benetos, A.; Biffi, A.; Boavida, J.M.; Capodanno, D.; et al. 2021 ESC Guidelines on cardiovascular disease prevention in clinical practice. Eur. Heart J. 2021, 42, 3227–3337. [Google Scholar] [CrossRef] [PubMed]
- Van Trier, T.J.; Snaterse, M.; Boekholdt, S.M.; Scholte Op Reimer, W.J.M.; Hageman, S.H.J.; Visseren, F.L.J.; Dorresteijn, J.A.N.; Peters, R.J.G.; Jørstad, H.T. Validation of Systematic Coronary Risk Evaluation 2 (SCORE2) and SCORE2-Older Persons in the EPIC-Norfolk prospective population cohort. Eur. J. Prev. Cardiol. 2024, 31, 182–189. [Google Scholar] [CrossRef] [PubMed]
- Mostaza, J.M.; Pintó, X.; Armario, P.; Masana, L.; Real, J.T.; Valdivielso, P.; Arrobas-Velilla, T.; Baeza-Trinidad, R.; Calmarza, P.; Cebollada, J.; et al. SEA 2024 Standards for Global Control of Vascular Risk. Clin. Investig. Arterioscler. 2024, 36, 133–194. [Google Scholar] [CrossRef] [PubMed]
- Global Cardiovascular Risk Consortium; Magnussen, C.; Ojeda, F.M.; Leong, D.P.; Alegre-Diaz, J.; Amouyel, P.; Aviles-Santa, L.; De Bacquer, D.; Ballantyne, C.M.; Bernabé-Ortiz, A.; et al. Global Effect of Modifiable Risk Factors on Cardiovascular Disease and Mortality. N. Engl. J. Med. 2023, 389, 1273–1285. [Google Scholar] [PubMed]
- Wannamethee, S.G.; Shaper, A.G.; Lennon, L.; Morris, R.W. Metabolic syndrome vs. Framingham Risk Score for prediction of coronary heart disease, stroke, and type 2 diabetes mellitus. Arch. Intern. Med. 2005, 165, 2644–2650. [Google Scholar] [CrossRef] [PubMed]
- Emerging Risk Factors Collaboration; Wormser, D.; Kaptoge, S.; Di Angelantonio, E.; Wood, A.M.; Pennells, L.; Thompson, A.; Sarwar, N.; Kizer, J.R.; Lawlor, D.A.; et al. Separate and combined associations of body-mass index and abdominal adiposity with cardiovascular disease: Collaborative analysis of 58 prospective studies. Lancet 2011, 377, 1085–1095. [Google Scholar]
- Mahfood Haddad, T.; Hamdeh, S.; Kanmanthareddy, A.; Alla, V.M. Nonalcoholic fatty liver disease and the risk of clinical cardiovascular events: A systematic review and meta-analysis. Diabetes Metab. Syndr. 2017, 11 (Suppl. S1), S209–S216. [Google Scholar] [CrossRef] [PubMed]
- Alexander, M.; Loomis, A.K.; van der Lei, J.; Duarte-Salles, T.; Prieto-Alhambra, D.; Ansell, D.; Pasqua, A.; Lapi, F.; Rijnbeek, P.; Mosseveld, M.; et al. Non-alcoholic fatty liver disease and risk of incident acute myocardial infarction and stroke: Findings from matched cohort study of 18 million European adults. BMJ 2019, 367, l5367. [Google Scholar] [CrossRef] [PubMed]
- Pennisi, G.; Enea, M.; Romero-Gomez, M.; Viganò, M.; Bugianesi, E.; Wong, V.W.S.; Fracanzani, A.L.; Sebastiani, G.; Boursier, J.; Berzigotti, A.; et al. Liver-Related and Extrahepatic Events in Patients with Non-Alcoholic Fatty Liver Disease: A Retrospective Competing Risks Analysis. Aliment. Pharmacol. Ther. 2022, 55, 604–615. [Google Scholar] [CrossRef] [PubMed]
- Simon, T.G.; Roelstraete, B.; Hagström, H.; Sundström, J.; Ludvigsson, J.F. Non-Alcoholic Fatty Liver Disease and Incident Major Adverse Cardiovascular Events: Results from a Nationwide Histology Cohort. Gut 2022, 71, 1867–1875. [Google Scholar] [CrossRef]
- Zou, B.; Yeo, Y.H.; Nguyen, V.H.; Cheung, R.; Ingelsson, E.; Nguyen, M.H. Prevalence, characteristics, and mortality outcomes of obese, nonobese, and lean NAFLD in the United States, 1999–2016. J. Intern. Med. 2020, 288, 139–151. [Google Scholar] [CrossRef]
- Mantovani, A.; Csermely, A.; Petracca, G.; Beatrice, G.; Corey, K.E.; Simon, T.G.; Byrne, C.D.; Targher, G. Non-alcoholic fatty liver disease and risk of fatal and non-fatal cardiovascular events: An updated systematic review and meta-analysis. Lancet Gastroenterol. Hepatol. 2021, 6, 903–913. [Google Scholar] [CrossRef] [PubMed]
- European Association for the Study of the Liver (EASL); European Association for the Study of Diabetes (EASD); European Association for the Study of Obesity (EASO). EASL-EASD-EASO Clinical Practice Guidelines on the Management of Metabolic Dysfunction-Associated Steatotic Liver Disease (MASLD). J. Hepatol. 2024, 81, 492–542. [Google Scholar] [CrossRef] [PubMed]
- European Association for the Study of the Liver. EASL Clinical Practice Guidelines on Non-Invasive Tests for Evaluation of Liver Disease Severity and Prognosis—2021 Update. J. Hepatol. 2021, 75, 659–689. [Google Scholar] [CrossRef] [PubMed]
- Younes, R.; Caviglia, G.P.; Govaere, O.; Rosso, C.; Armandi, A.; Sanavia, T.; Pennisi, G.; Liguori, A.; Francione, P.; Gallego-Durán, R.; et al. Long-term outcomes and predictive ability of non-invasive scoring systems in patients with non-alcoholic fatty liver disease. J. Hepatol. 2021, 75, 4. [Google Scholar] [CrossRef] [PubMed]
- Arnold, N.; Blaum, C.; Goßling, A.; Brunner, F.J.; Bay, B.; Ferrario, M.M.; Brambilla, P.; Cesana, G.; Leoni, V.; Palmieri, L.; et al. C-reactive Protein Modifies Lipoprotein(a)-Related Risk for Coronary Heart Disease: The BiomarCaRE Project. Eur. Heart J. 2024, 45, 1043–1054. [Google Scholar] [CrossRef] [PubMed]
- Kamstrup, P.R.; Benn, M.; Tybjaerg-Hansen, A.; Nordestgaard, B.G. Extreme lipoprotein(a) levels and risk of myocardial infarction in the general population: The Copenhagen City Heart Study. Circulation 2008, 117, 176–184. [Google Scholar] [CrossRef] [PubMed]
- Emerging Risk Factors Collaboration; Erqou, S.; Kaptoge, S.; Perry, P.L.; Di Angelantonio, E.; Thompson, A.; White, I.R.; Marcovina, S.M.; Collins, R.; Thompson, S.G.; et al. Lipoprotein(a) concentration and the risk of coronary heart disease, stroke, and nonvascular mortality. JAMA 2009, 302, 412–423. [Google Scholar] [PubMed]
- Fuster, V.; García-Álvarez, A.; Devesa, A.; Mass, V.; Owen, R.; Quesada, A.; Fuster, J.J.; García-Lunar, I.; Pocock, S.; Sánchez-González, J.; et al. Influence of Subclinical Atherosclerosis Burden and Progression on Mortality. JACC 2024, 84, 1391–1403. [Google Scholar] [CrossRef] [PubMed]
- Rubinshtein, R.; Hamdan, A. Coronary CTA-Based CAD-RADS Reporting System and the PROMISE to Predict Cardiac Events. JACC Cardiovasc. Imaging 2020, 13, 1546–1548. [Google Scholar] [CrossRef] [PubMed]
- Cury, R.C.; Leipsic, J.; Abbara, S.; Achenbach, S.; Berman, D.; Bittencourt, M.; Budoff, M.; Chinnaiyan, K.; Choi, A.D.; Ghoshhajra, B.; et al. CAD-RADS™ 2.0—2022 Coronary Artery Disease-Reporting and Data System: An Expert Consensus Document of the Society of Cardiovascular Computed Tomography (SCCT), the American College of Cardiology (ACC), the American College of Radiology (ACR), and the North America Society of Cardiovascular Imaging (NASCI). J. Cardiovasc. Comput. Tomogr. 2022, 16, 536–557. [Google Scholar] [PubMed]
- Xie, J.X.; Cury, R.C.; Leipsic, J.; Crim, M.T.; Berman, D.S.; Gransar, H.; Budoff, M.J.; Achenbach, S.; Ó Hartaigh, B.; Callister, T.Q.; et al. The Coronary Artery Disease-Reporting and Data System (CAD-RADS): Prognostic and Clinical Implications Associated with Standardized Coronary Computed Tomography Angiography Reporting. JACC Cardiovasc. Imaging 2018, 11, 78–89. [Google Scholar] [CrossRef]
- Guerrero-Romero, F.; Simental-Mendía, L.E.; González-Ortiz, M.; Martínez-Abundis, E.; Ramos-Zavala, M.G.; Hernández-González, S.O.; Jacques-Camarena, O.; Rodríguez-Morán, M. The product of triglycerides and glucose, a simple measure of insulin sensitivity. Comparison with the euglycemic-hyperinsulinemic clamp. J. Clin. Endocrinol. Metab. 2010, 95, 3347–3351. [Google Scholar] [CrossRef]
- Unger, G.; Benozzi, S.F.; Perruzza, F.; Pennacchiotti, G.L. Triglycerides and glucose index: A useful indicator of insulin resistance. Endocrinol. Nutr. 2014, 61, 533–540. [Google Scholar] [CrossRef]
- Sterling, R.K.; Lissen, E.; Clumeck, N.; Sola, R.; Correa, M.C.; Montaner, J.; Sulkowski, M.S.; Torriani, F.J.; Dieterich, D.T.; Thomas, D.L.; et al. Development of a simple noninvasive index to predict significant fibrosis in patients with HIV/HCV coinfection. Hepatology 2006, 43, 1317–1325. [Google Scholar] [CrossRef] [PubMed]
- Alberti, K.G.; Zimmet, P.; Shaw, J. Metabolic syndrome—A new worldwide definition. A Consensus Statement from the International Diabetes Federation. Diabet. Med. 2006, 23, 469–480. [Google Scholar] [CrossRef] [PubMed]
- Stone, P.H.; Libby, P.; Boden, W.E. Fundamental Pathobiology of Coronary Atherosclerosis and Clinical Implications for Chronic Ischemic Heart Disease Management—The Plaque Hypothesis: A Narrative Review. JAMA Cardiol. 2023, 8, 192–201. [Google Scholar] [CrossRef]
- Andersson, C.; Nayor, M.; Tsao, C.W.; Levy, D.; Vasan, R.S. Framingham Heart Study: JACC Focus Seminar, 1/8. J. Am. Coll. Cardiol. 2021, 77, 2680–2692. [Google Scholar] [CrossRef]
- Elosua, R. Cardiovascular risk functions: Usefulness and limitations. Rev. Esp. Cardiol. (Engl. Ed.) 2014, 67, 77–79. [Google Scholar] [CrossRef] [PubMed]
- Finnikin, S.; Finney, B.; Khatib, R.; McCormack, J. Statins, Risk, and Personalised Care. BMJ 2024, 384, e076774. [Google Scholar] [CrossRef] [PubMed]
- Maitra, N.S.; Mahtta, D.; Navaneethan, S.; Vaughan, E.M.; Kochar, A.; Gulati, M.; Levine, G.N.; Petersen, L.A.; Virani, S.S. A Mistake Not to Be Repeated: What Can We Learn from the Underutilization of Statin Therapy for Efficient Dissemination of Cardioprotective Glucose Lowering Agents? Curr. Cardiol. Rep. 2022, 24, 689–698. [Google Scholar] [CrossRef] [PubMed]
- Bradley, C.K.; Wang, T.Y.; Li, S.; Robinson, J.G.; Roger, V.L.; Goldberg, A.C.; Virani, S.S.; Louie, M.J.; Lee, L.V.; Peterson, E.D.; et al. Patient-Reported Reasons for Declining or Discontinuing Statin Therapy: Insights from the PALM Registry. J. Am. Heart Assoc. 2019, 8, e011765. [Google Scholar] [CrossRef] [PubMed]
- Mortensen, M.B.; Dzaye, O.; Steffensen, F.H.; Bøtker, H.E.; Jensen, J.M.; Rønnow Sand, N.P.; Kragholm, K.H.; Sørensen, H.T.; Leipsic, J.; Mæng, M.; et al. Impact of Plaque Burden Versus Stenosis on Ischemic Events in Patients with Coronary Atherosclerosis. J. Am. Coll. Cardiol. 2020, 76, 2803–2813. [Google Scholar] [CrossRef]
- Cho, I.; Chang, H.J.; Sung, J.M.; Pencina, M.J.; Lin, F.Y.; Dunning, A.M.; Achenbach, S.; Al-Mallah, M.; Berman, D.S.; Budoff, M.J.; et al. Coronary computed tomographic angiography and risk of all-cause mortality and nonfatal myocardial infarction in subjects without chest pain syndrome from the CONFIRM Registry (coronary CT angiography evaluation for clinical outcomes: An international multicenter registry). Circulation 2012, 126, 304–313. [Google Scholar] [PubMed]
- Huang, Z.; Zhang, S.; Jin, N.; Hu, Y.; Xiao, J.; Li, Z.; Yang, Y.; Sun, R.; Wang, Z.; Li, X.; et al. Prognostic value of CAD-RADS classification by coronary CTA in patients with suspected CAD. BMC Cardiovasc. Disord. 2021, 21, 476. [Google Scholar] [CrossRef]
- Ray, K.K.; Haq, I.; Bilitou, A.; Manu, M.C.; Burden, A.; Aguiar, C.; Arca, M.; Connolly, D.L.; Eriksson, M.; Ferrières, J.; et al. Treatment Gaps in the Implementation of LDL Cholesterol Control Among High- and Very High-Risk Patients in Europe Between 2020 and 2021: The Multinational Observational SANTORINI Study. Lancet Reg. Health Eur. 2023, 29, 100624. [Google Scholar] [CrossRef]
- Cholesterol Treatment Trialists’ (CTT) Collaboration; Fulcher, J.; O’Connell, R.; Voysey, M.; Emberson, J.; Blackwell, L.; Mihaylova, B.; Simes, J.; Collins, R.; Kirby, A.; et al. Efficacy and Safety of LDL-Lowering Therapy Among Men and Women: Meta-Analysis of Individual Data from 174,000 Participants in 27 Randomised Trials. Lancet 2015, 385, 1397–1405. [Google Scholar] [PubMed]
- LaRosa, J.C.; Grundy, S.M.; Waters, D.D.; Shear, C.; Barter, P.; Fruchart, J.C.; Gotto, A.M.; Greten, H.; Kastelein, J.J.; Shepherd, J.; et al. Intensive Lipid Lowering with Atorvastatin in Patients with Stable Coronary Disease. N. Engl. J. Med. 2005, 352, 1425–1435. [Google Scholar] [CrossRef] [PubMed]
- Scandinavian Simvastatin Survival Study Group. Randomised Trial of Cholesterol Lowering in 4444 Patients with Coronary Heart Disease: The Scandinavian Simvastatin Survival Study (4S). Lancet 1994, 344, 1383–1389. [Google Scholar]
- van Herpen, N.A.; Schrauwen-Hinderling, V.B. Lipid Accumulation in Non-Adipose Tissue and Lipotoxicity. Physiol. Behav. 2008, 94, 231–241. [Google Scholar] [CrossRef] [PubMed]
- Gustafson, B. Adipose Tissue, Inflammation, and Atherosclerosis. J. Atheroscler. Thromb. 2010, 17, 332–341. [Google Scholar] [CrossRef] [PubMed]
- Jung, U.J.; Choi, M.S. Obesity and Its Metabolic Complications: The Role of Adipokines and the Relationship Between Obesity, Inflammation, Insulin Resistance, Dyslipidemia, and Nonalcoholic Fatty Liver Disease. Int. J. Mol. Sci. 2014, 15, 6184–6223. [Google Scholar] [CrossRef]
- Schulze, M.B.; Stefan, N. Metabolically healthy obesity: From epidemiology and mechanisms to clinical implications. Nat. Rev. Endocrinol. 2024, 20, 633–646. [Google Scholar] [CrossRef]
- Loomis, A.K.; Kabadi, S.; Preiss, D.; Hyde, C.; Bonato, V.; St Louis, M.; Desai, J.; Gill, J.M.; Welsh, P.; Waterworth, D.; et al. Body mass index and risk of nonalcoholic fatty liver disease: Two electronic health record prospective studies. J. Clin. Endocrinol. Metab. 2016, 101, 945–952. [Google Scholar] [CrossRef]
- Aminian, A.; Al-Kurd, A.; Wilson, R.; Bena, J.; Fayazzadeh, H.; Singh, T.; Albaugh, V.L.; Shariff, F.U.; Rodriguez, N.A.; Jin, J.; et al. Association of bariatric surgery with major adverse liver and cardiovascular outcomes in patients with biopsy-proven nonalcoholic steatohepatitis. JAMA 2021, 326, 2031–2042. [Google Scholar] [CrossRef] [PubMed]
- Li, M.; Cui, M.; Li, G.; Liu, Y.; Xu, Y.; Eftekhar, S.P.; Ala, M. The pathophysiological associations between obesity, NAFLD, and atherosclerotic cardiovascular diseases. Horm. Metab. Res. 2024, 56, 683–696. [Google Scholar] [CrossRef] [PubMed]
- Martinez-Urbistondo, D.; D’Avola, D.; Navarro-González, D.; Sanchez-Iñigo, L.; Fernandez-Montero, A.; Perez-Diaz-Del-Campo, N.; Bugianesi, E.; Martinez, J.A.; Pastrana, J.C. Interactive Role of Surrogate Liver Fibrosis Assessment and Insulin Resistance on the Incidence of Major Cardiovascular Events. J. Clin. Med. 2022, 11, 5190. [Google Scholar] [CrossRef] [PubMed]
- Sharp, D.S.; Andrew, M.E.; Burchfiel, C.M.; Violanti, J.M.; Wactawski-Wende, J. Body Mass Index versus Dual Energy X-ray Absorptiometry-Derived Indexes: Predictors of Cardiovascular and Diabetic Disease Risk Factors. Am. J. Hum. Biol. 2012, 24, 400–405. [Google Scholar] [CrossRef]
- Booker, R.; Wong, M.; Bancks, M.P.; Carnethon, M.R.; Chow, L.S.; Lewis, C.E.; Schreiner, P.J.; Alexandria, S.J. The Longitudinal Association of Adipose-to-Lean Ratio with Incident Cardiometabolic Morbidity: The CARDIA Study. J. Diabetes Complicat. 2024, 38, 108725. [Google Scholar] [CrossRef] [PubMed]
- Obesity and Overweight. Available online: https://www.who.int/news-room/fact-sheets/detail/obesity-and-overweight (accessed on 7 October 2024).

| Characteristics | Low-to-Moderate CV Risk n = 95 | High CV Risk n = 108 | Very High CV Risk n = 16 | Total n = 219 | p-Value |
|---|---|---|---|---|---|
| Anthropometry | |||||
| Age (years) | 54.4 ± 1.3 | 59.1 ± 1.8 | 66.4 ± 3.0 | 57.9 ± 1.15 | <0.001 |
| Age group | 0.006 | ||||
| <50 years | 19 (20%) | 22 (20.4%) | 0 (0%) | 41 (18.7%) | |
| 50–70 years | 72 (75.8%) | 72 (66.7%) | 11 (68.8%) | 155 (70.8%) | |
| >70 years | 4 (4.2%) | 14 (13%) | 5 (31.3%) | 23 (10.5%) | |
| Sex (female) | 23 (24.2%) | 6 (5.6%) | 2 (12.5%) | 31 (14.2%) | 0.001 |
| Obesity | 20 (21.1%) | 45 (41.7%) | 5 (31.3%) | 70 (32.0%) | 0.007 |
| BMI mean (kg/m2) | 27.0 ± 0.8 | 29.5 ± 0.8 | 29.6 ± 2.4 | 28.44 ± 0.6 | <0.001 |
| Hypertension | 27 (28.4%) | 59 (54.6%) | 12 (75.0%) | 98 (44.7%) | <0.001 |
| SBP mean (mm Hg) | 127.5 ± 3.0 | 141.8 ± 3.2 | 161.7 ± 9.1 | 137.0 ± 2.5 | <0.001 |
| DBP mean (mm Hg) | 85.0 ± 2.0 | 88.7 ± 2.6 | 94.9 ± 5.8 | 87.5 ± 1.6 | 0.004 |
| Antihypertensive drugs | 25 (26.3%) | 56 (51.9%) | 11 (68.8%) | 95 (43.4%) | 0.001 |
| Dyslipidemia | 40 (42.1%) | 69 (63.9%) | 8 (50.0%) | 117 (53.4%) | 0.008 |
| Total cholesterol (mg/dL) | 194.7 ± 7.7 | 198.4 ± 8.5 | 184.3 ± 17.3 | 195.8 ± 5.5 | 0.419 |
| HDL-C mean (mg/dL) | 63.9 ± 2.9 | 53.4 ± 2.5 | 43.8 ± 3.0 | 57.3 ± 1.9 | <0.001 |
| Low HDL-C | 2 (2.1%) | 15 (13.9%) | 4 (25.0%) | 21 (9.6%) | 0.002 |
| Triglycerides mean (mg/dL) | 80.3 ± 6.7 | 118.5 ± 17.8 | 132.5 ± 18.9 | 103.0 ± 9.7 | <0.001 |
| High triglycerides | 15 (15.8%) | 15 (13.9%) | 2 (12.5%) | 32 (14.6%) | 0.901 |
| LDL-C mean (mg/dL) | 114.9 ± 7.1 | 125.1 ± 8.0 | 115.3 ± 15.7 | 120.0 ± 5.2 | 0.151 |
| High LDL-C for risk group | 63 (66.3%) | 100 (92.6%) | 16 (100%) | 179 (81.7%) | 0.391 |
| Statin use | 26 (27.4%) | 41 (38.0%) | 4 (25.0%) | 71 (32.4%) | 0.221 |
| High LDL-C despite statin use | 11/26 (42.3%) | 34/41 (82.9%) | 4/4 (100%) | 49/71 (69.0%) | 0.001 |
| Lipoprotein (a) (mg/dL) | 24.3 ± 5.9 a | 24.1 ± 5.9 b | 21.3 ± 13.5 c | 24.0 ± 4.0 d | 0.988 |
| Type 2 Diabetes Mellitus | 4 (4.2%) | 14 (13.0%) | 6 (37.5%) | 24 (11.0%) | <0.001 |
| Glycemia (mg/dL) | 98.4 ± 4.8 | 103.6 ± 3.4 | 115.8 ± 9.5 | 102.3 ± 2.8 | <0.001 |
| Antidiabetic treatment | 3 (3.2%) | 11 (10.2%) | 5 (31.3%) | 19 (8.7%) | 0.001 |
| HbA1c (%) | 5.48 ± 0.12 | 5.66 ± 0.11 | 6.14 ± 0.46 | 5.6 ± 0.08 | 0.001 |
| HOMA-IR | 3.4 ± 2.8 | 3.0 ± 0.4 | 4.8 ± 2.6 | 3.3 ± 1.3 | <0.001 |
| Insulin µU/mL | 8.4 ± 1.1 | 11.7 ± 1.5 | 15.6 ± 5.9 | 10.5 ± 1.0 | <0.001 |
| TyG Index | 8.19 ± 0.09 | 8.55 ± 0.11 | 8.89 ± 0.20 | 8.42 ± 0.07 | <0.001 |
| TyG > 8.8 points | 8 (8.4%) | 30 (27.8%) | 9 (56.3%) | 47 (21.5%) | <0.001 |
| Smoking status | <0.001 | ||||
| Never smokers | 51 (53.7%) | 44 (40.7%) | 3 (18.8%) | 98 (44.7%) | |
| Previous smokers | 37 (38.9%) | 31 (28.7%) | 3 (18.8%) | 71 (32.4%) | |
| Active smokers | 7 (7.4%) | 33 (30.6%) | 10 (62.5%) | 50 (22.8%) | |
| Metabolic syndrome | 10 (10.5%) | 42 (38.9%) | 8 (50.0%) | 60 (27.4%) | <0.001 |
| C-reactive protein (mg/dL) | 0.21 ± 0.07 | 0.23 ± 0.04 | 0.29 ± 0.15 | 0.22 ± 0.04 | 0.081 |
| Suspected liver fibrosis (FIB-4 ≥ 1.3) | 35 (36.8%) | 47 (43.5%) | 8 (50.0%) | 90 (41.1%) | 0.473 |
| FIB-4 mean | 1.20 ± 0.08 | 1.34 ± 0.11 | 1.49 ± 0.29 | 1.29 ± 0.07 | 0.137 |
| AST (U/L) | 24.49 ± 16.03 | 25.09 ± 17.63 | 21.38 ± 8.99 | 24.56 ± 16.50 | 0.214 |
| ALT (U/L) | 25.42 ± 24.46 | 27.54 ± 29.22 | 23.63 ± 18.81 | 26.33 ± 26.60 | 0.635 |
| Platelets (109/L) | 234.94 ± 100.03 | 235.24 ± 103.59 | 221.81 ± 128.85 | 234.13 ± 103.80 | 0.628 |
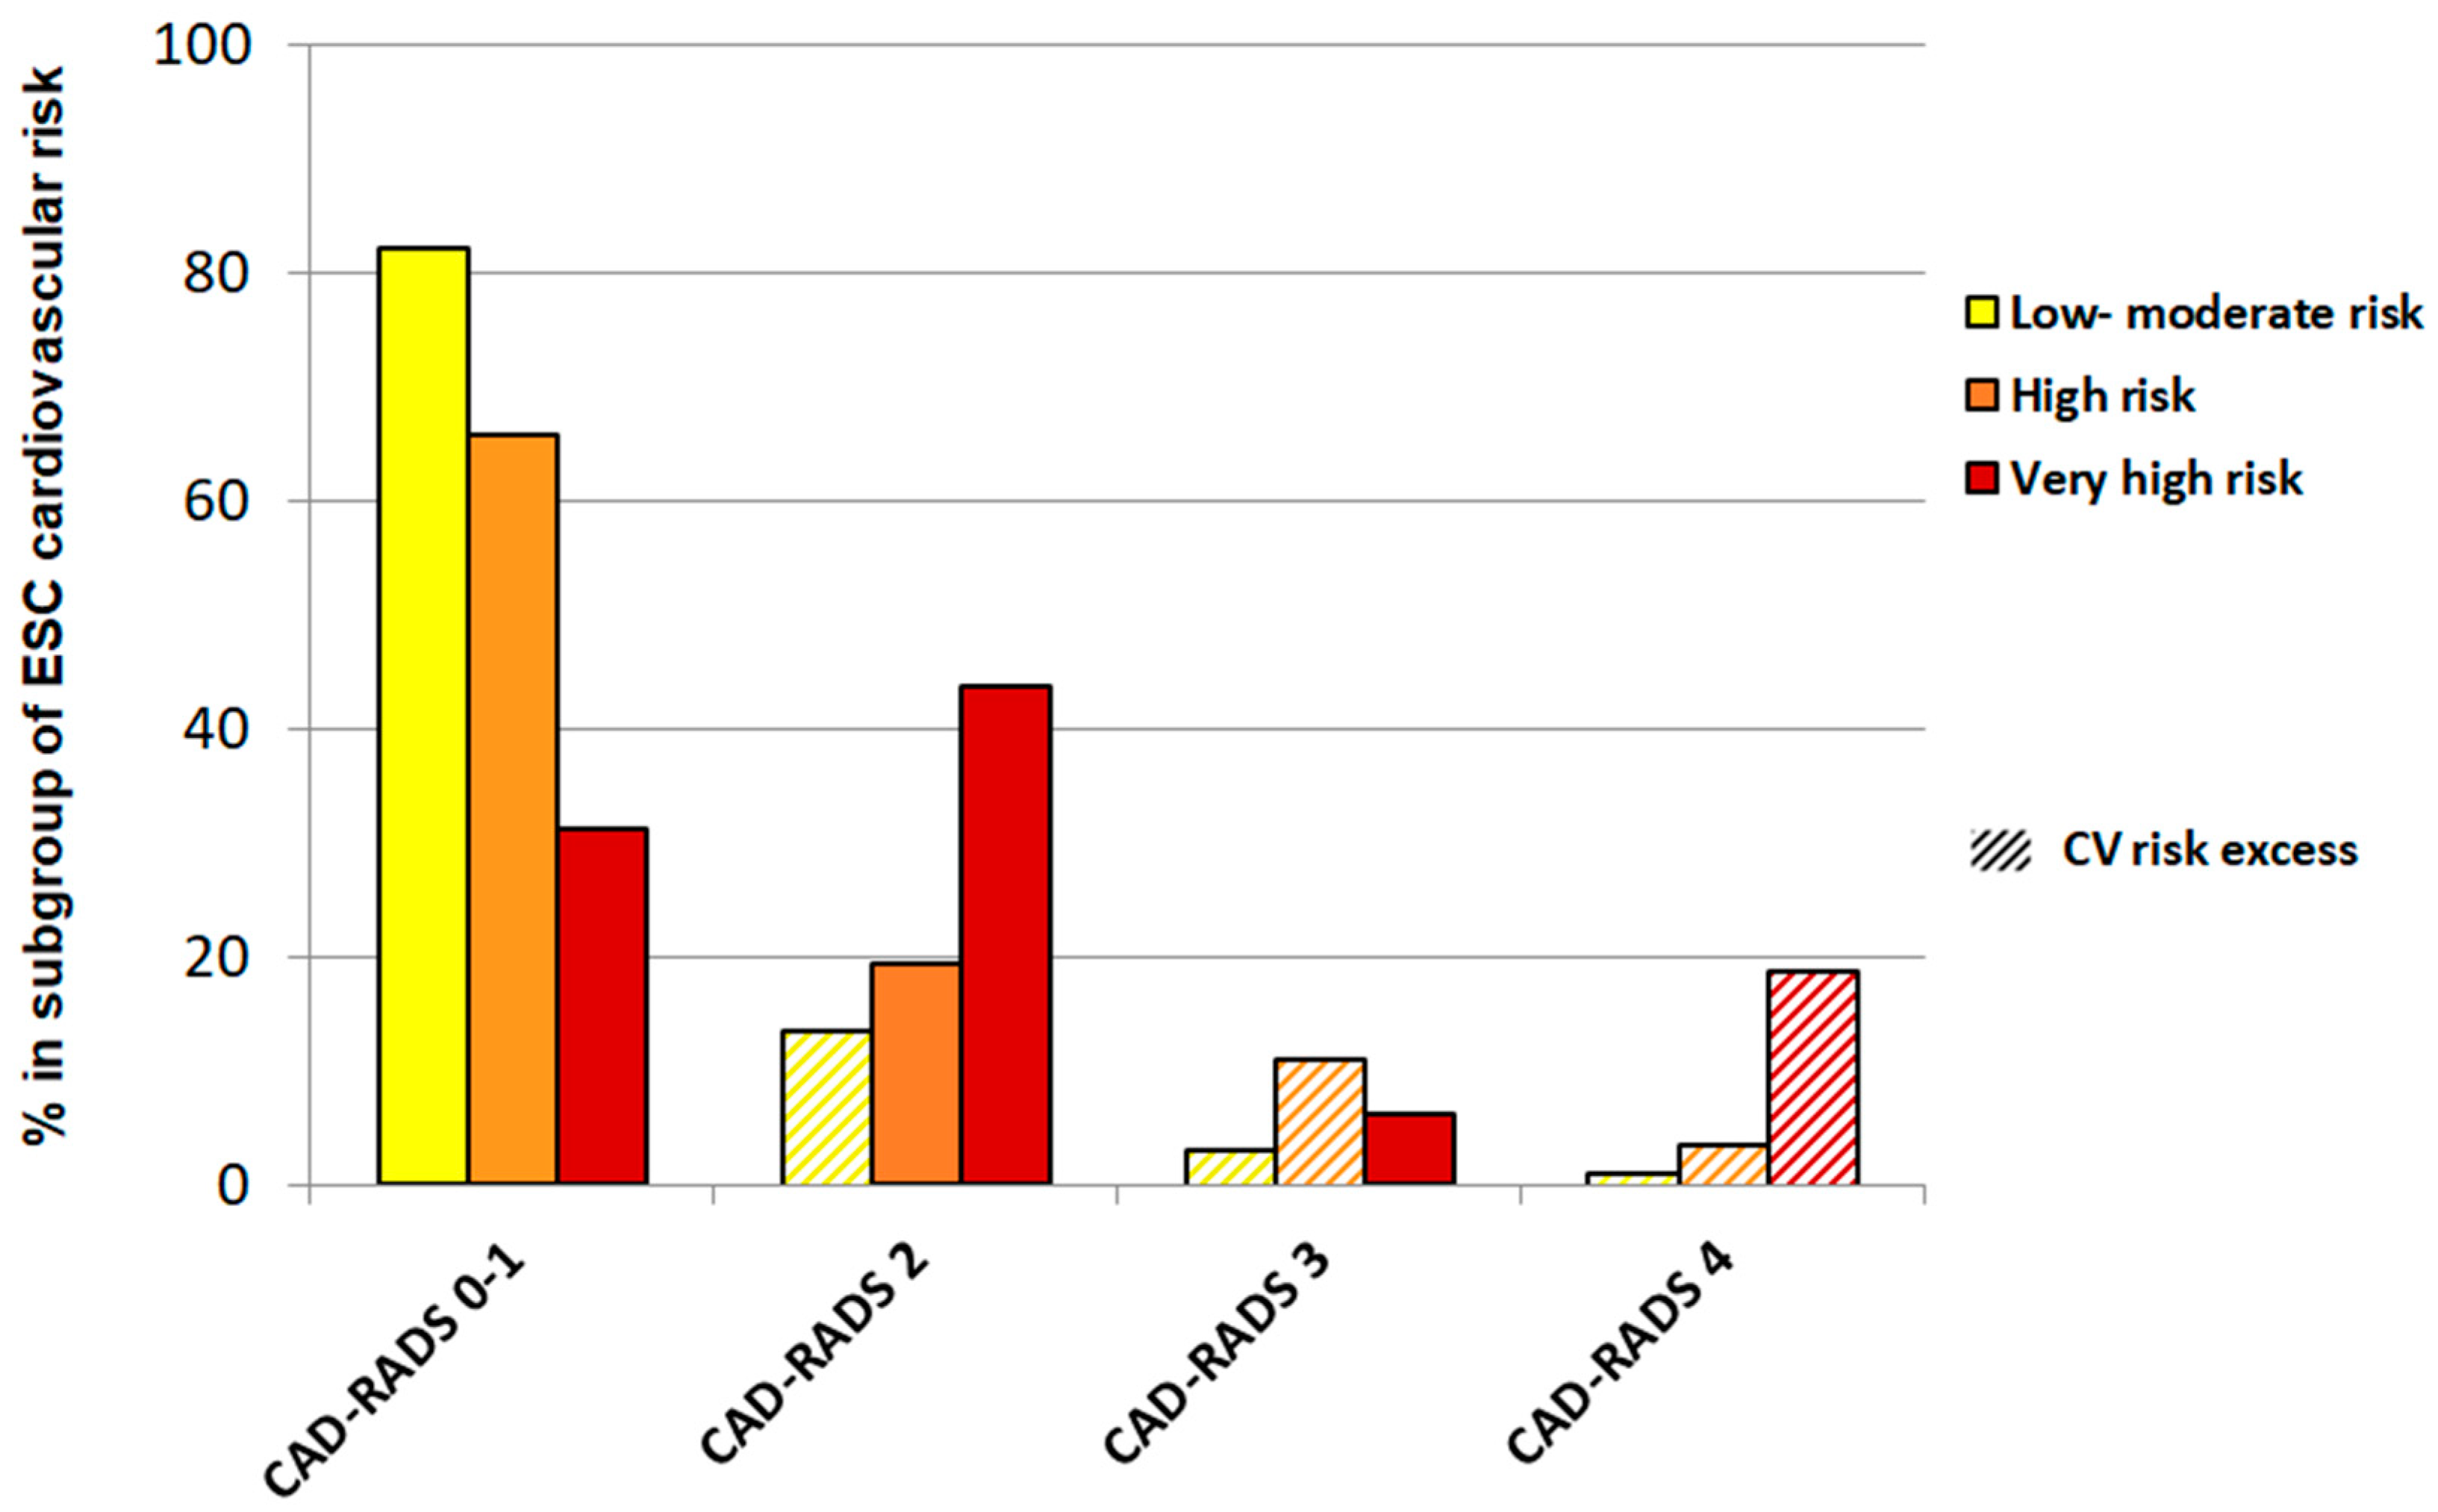
| Coronary CT angiography | <0.001 | ||||
| CAD-RADS 0 | 47 (49.5%) | 28 (25.9%) | 2 (12.5%) | 77 (35.2%) | |
| CAD-RADS 1 | 31 (32.6%) | 43 (39.8%) | 3 (18.8%) | 77 (35.2%) | |
| CAD-RADS 2 | 13 (13.7%) | 21 (19.5%) | 7 (43.8%) | 41 (18.7%) | |
| CAD-RADS 3 | 3 (3.2%) | 12 (11.1%) | 1 (6.3%) | 16 (7.3%) | |
| CAD-RADS 4 | 1 (1.0%) | 4 (3.7%) | 3 (18.8%) | 8 (3.7%) | |
| CV risk excess | 17 (17.9%) | 16 (14.8%) | 3 (18.8%) | 36 (16.4%) | 0.812 |
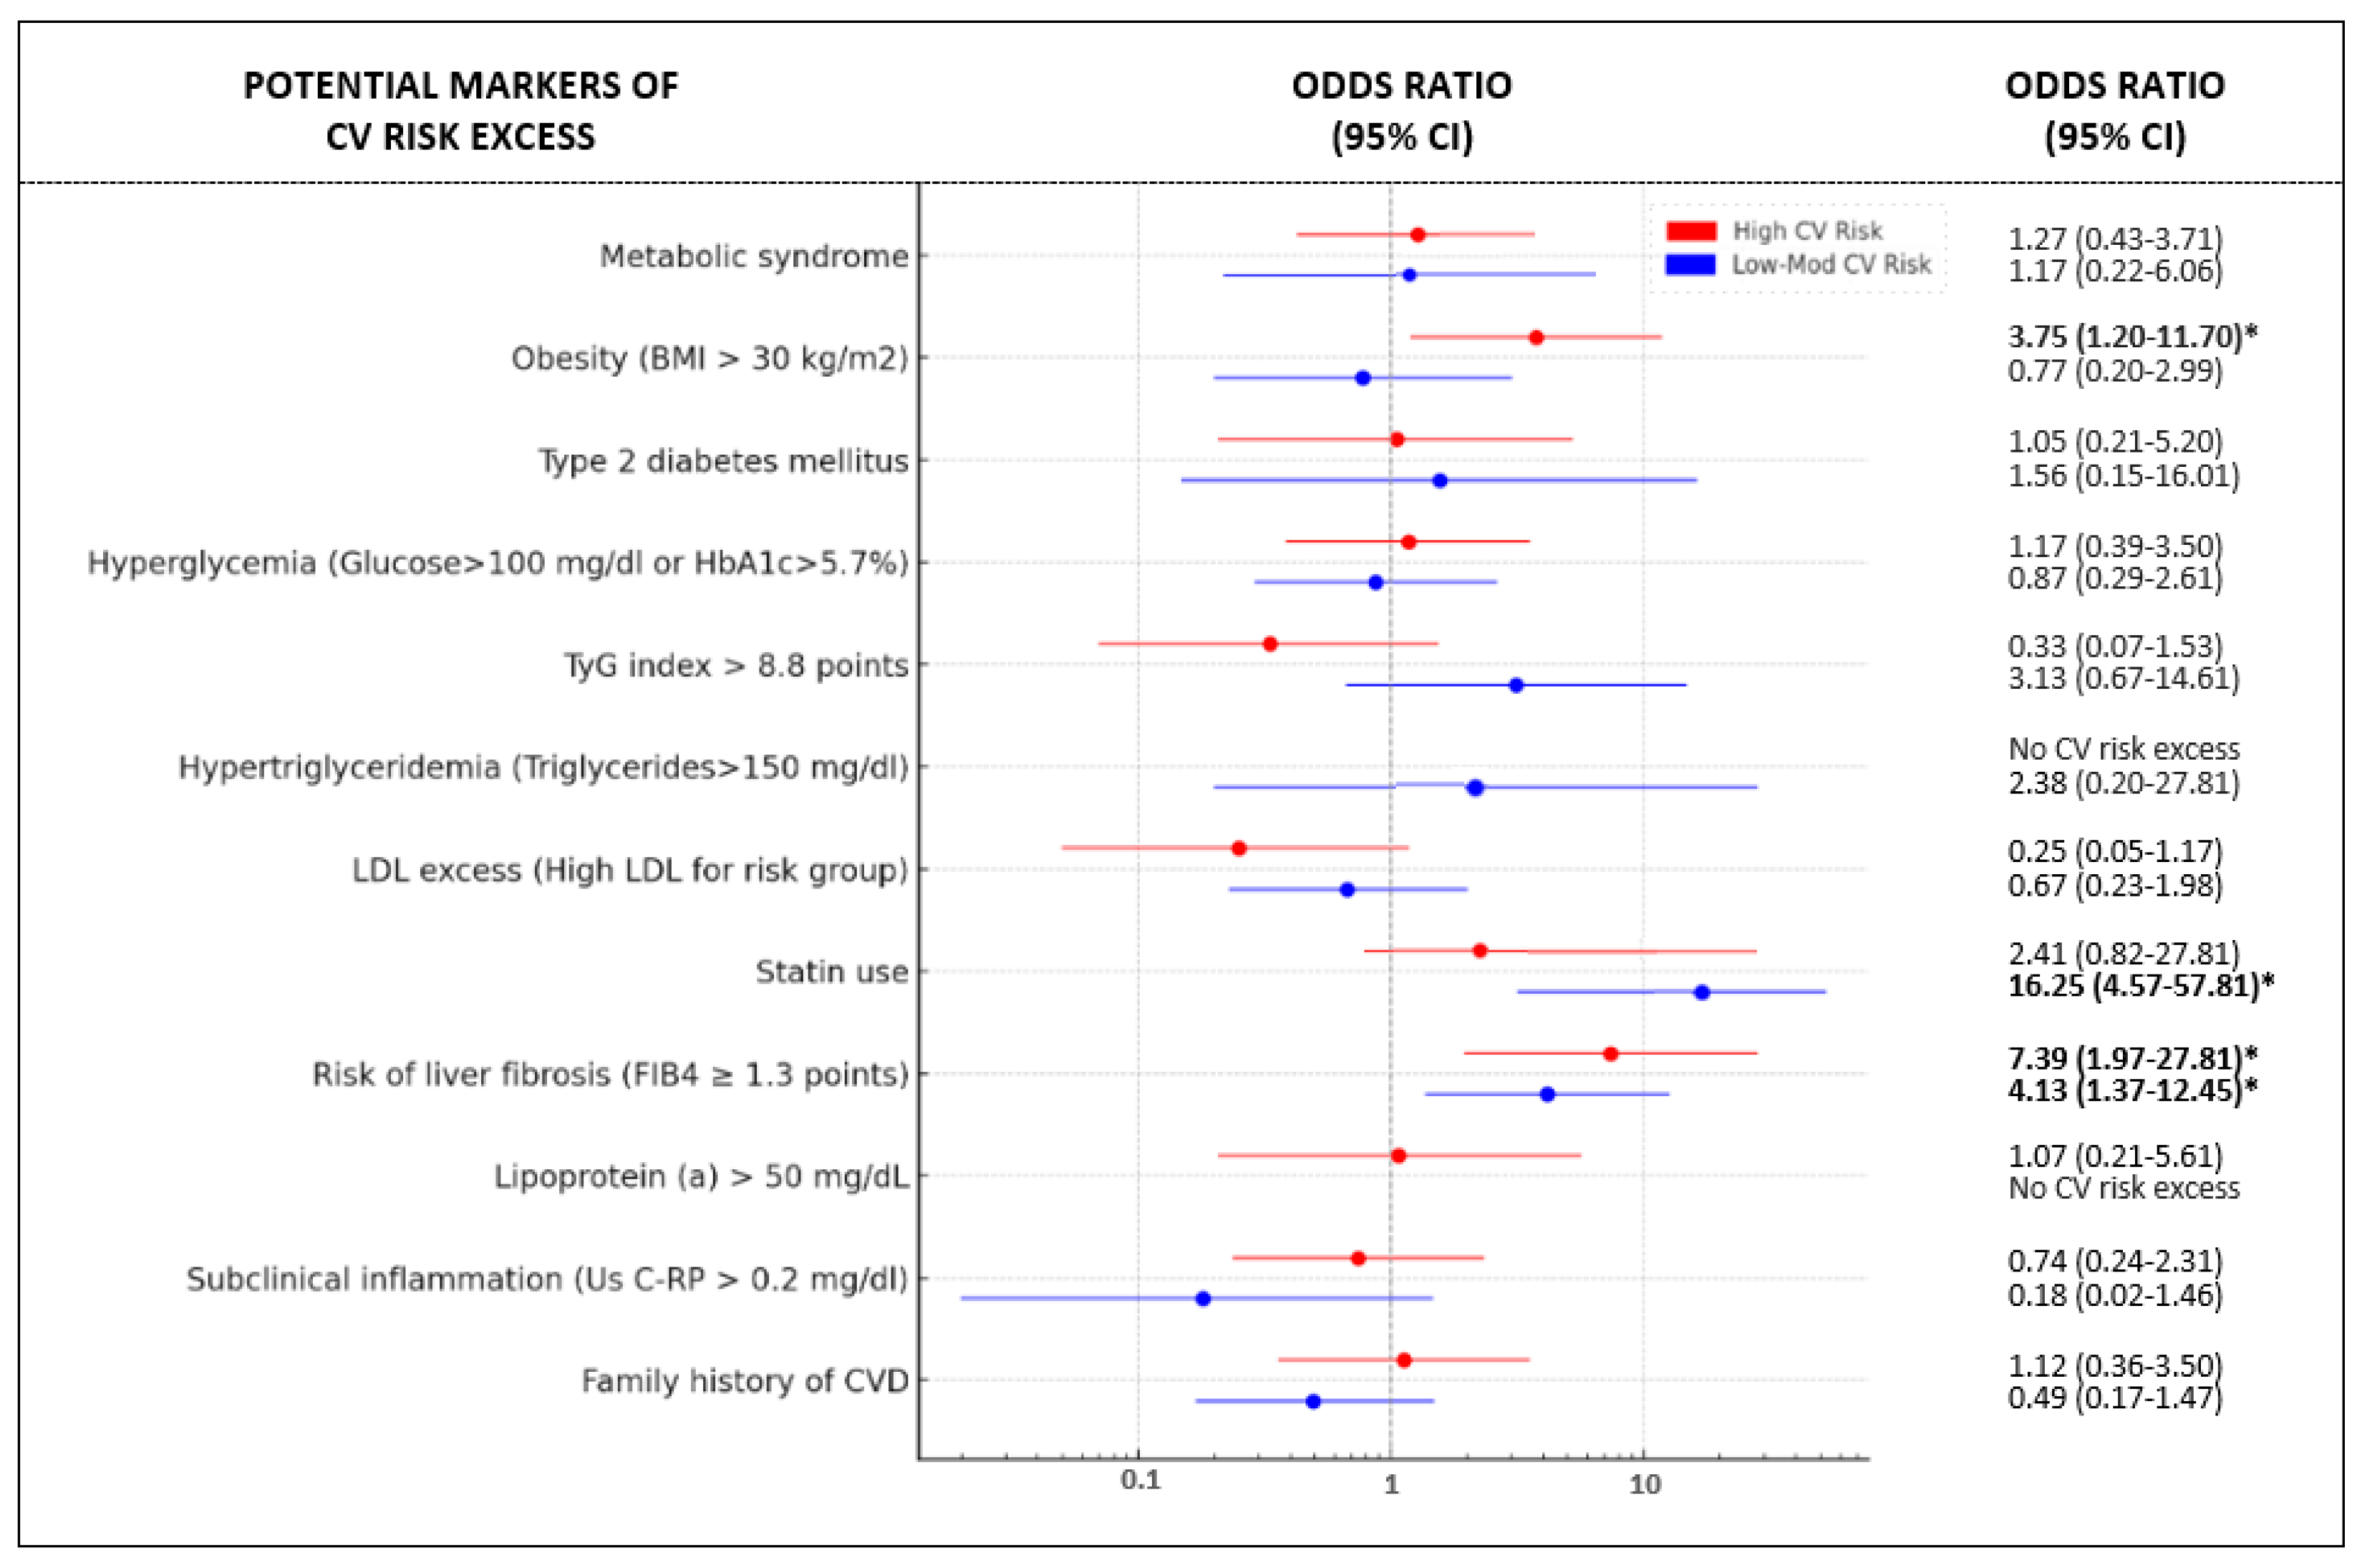
| Low–Moderate CV Risk (n = 95) | Risk Excess, n (%) [n = 17] | p | p Adjusted by Age and Sex | High CV Risk (n = 108) | Risk Excess, n (Total %) [n = 16] | p | p Adjusted by Age and Sex |
|---|---|---|---|---|---|---|---|
| Model 1 | Model 1 | ||||||
| No statin use (n = 69) | 4 (6%) | <0.001 | <0.001 | No Obesity (n = 63) | 5 (8%) | 0.017 | 0.017 |
| Statin use (n = 26) | 13 (50%) | Obesity (n = 45) | 11 (24%) | ||||
| FIB-4 < 1.3 (n = 60) | 6 (10%) | <0.01 | 0.048 | FIB-4 < 1.3 (n = 61) | 3 (5%) | 0.008 | 0.018 |
| FIB-4 ≥ 1.3 (n = 35) | 11 (31%) | FIB-4 ≥ 1.3 (n = 47) | 13 (25%) | ||||
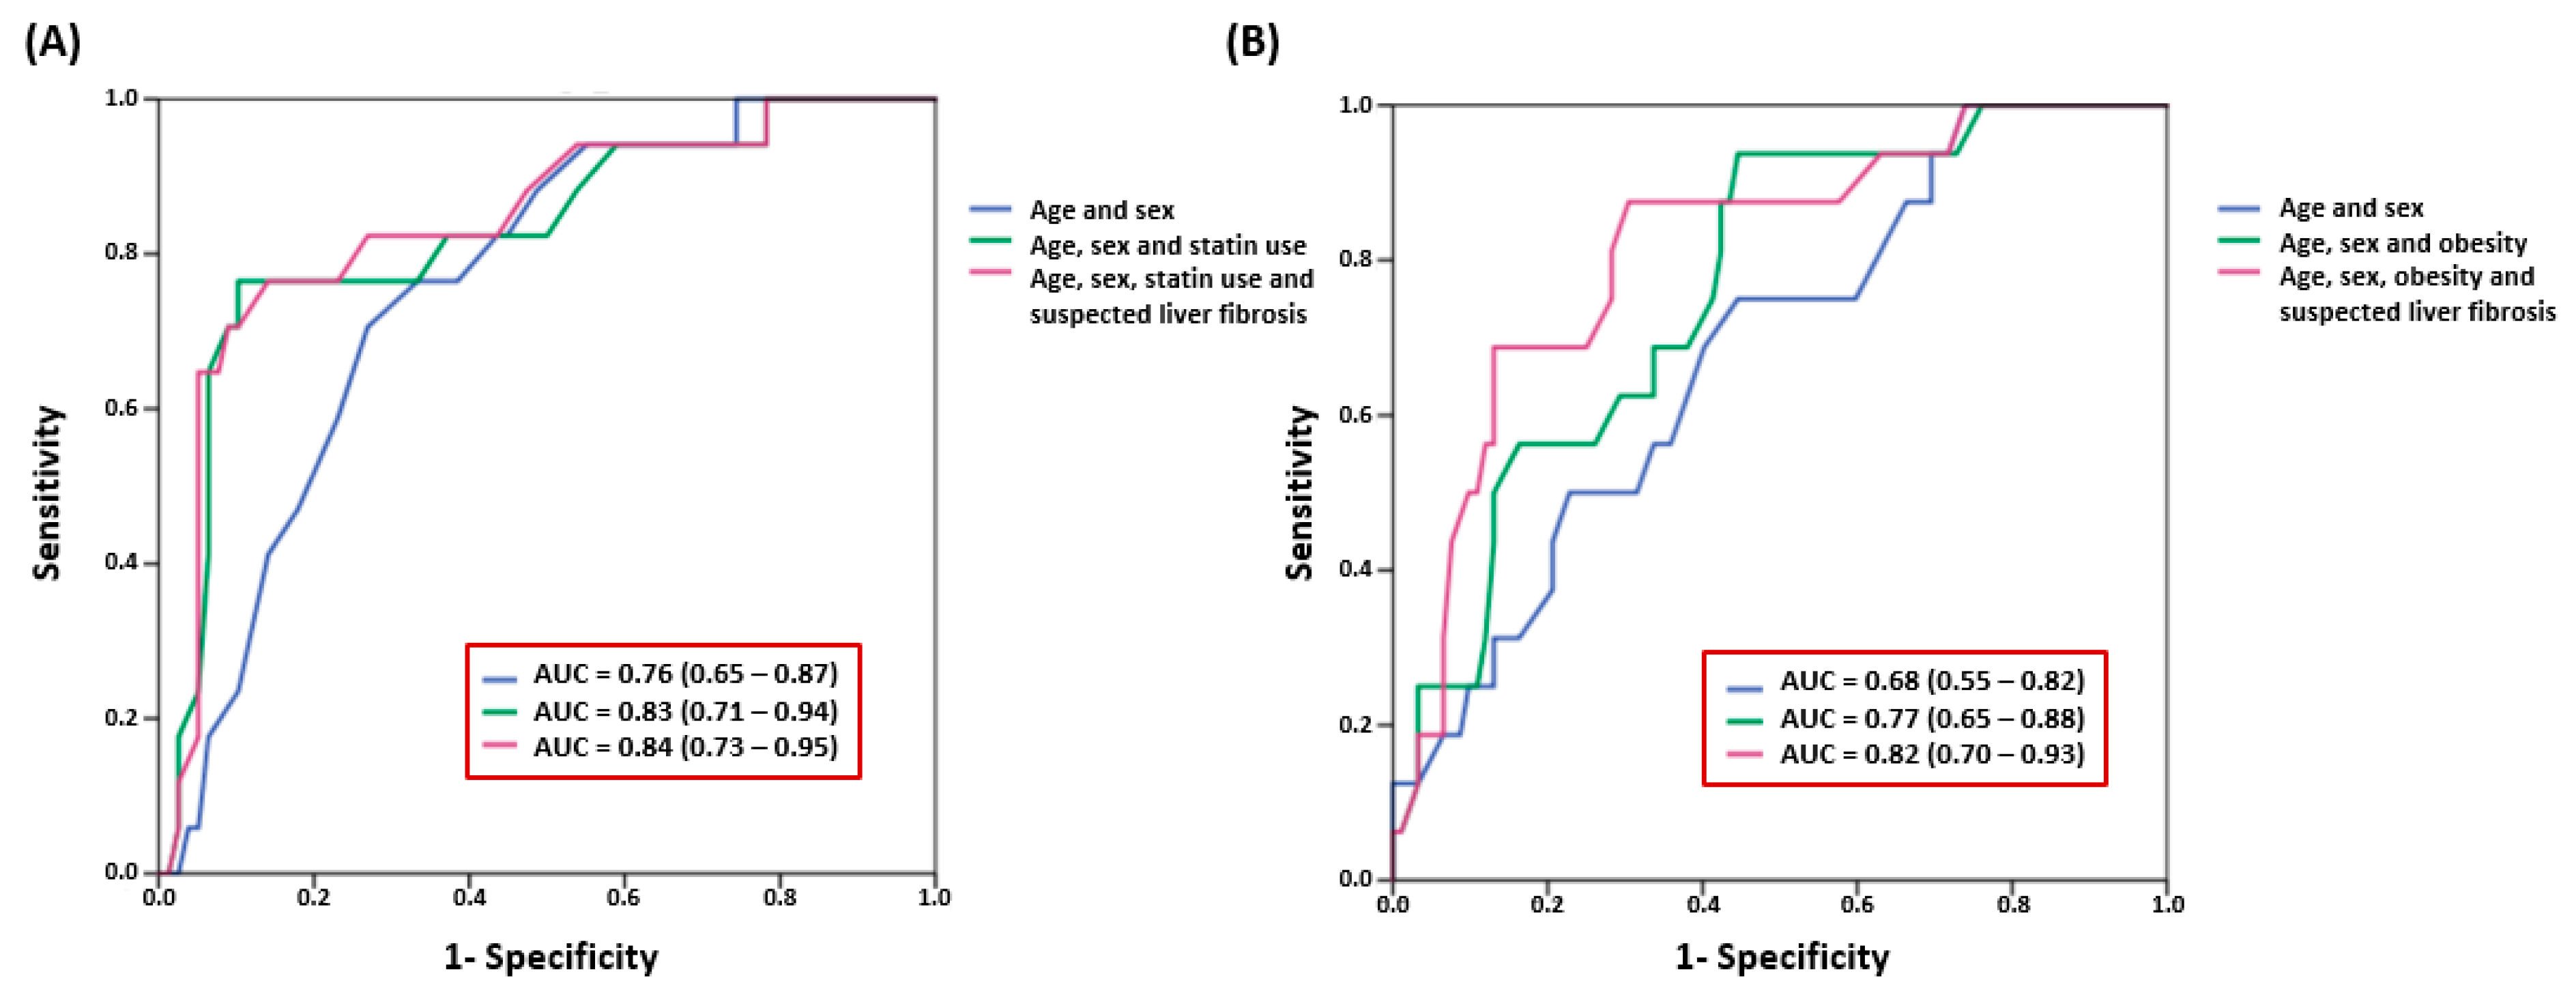
| Interaction Statin use × FIB-4 | <0.001 | <0.001 | Interaction Obesity × FIB-4 | 0.008 | 0.011 | ||
| Model 2 | Model 2 | ||||||
| No statins and FIB-4 < 1.3 (n = 49) | 4 (8%) | <0.001 | <0.001 | No obesity and FIB-4 < 1.3 (n = 38) | 2 (5%) | 0.011 | 0.001 |
| Statins and FIB-4 < 1.3 (n = 11) | 2 (18%) | Obesity and FIB-4 < 1.3 (n = 23) | 1 (4%) | ||||
| No statins and FIB-4 ≥ 1.3 (n = 20) | 0 (0%) | No obesity and FIB-4 ≥ 1.3 (n = 25) | 3 (12%) | ||||
| Statins and FIB-4 ≥ 1.3 (n = 15) | 11 (73%) | Obesity and FIB-4 ≥ 1.3 (n = 22) | 10 (45%) |
Disclaimer/Publisher’s Note: The statements, opinions and data contained in all publications are solely those of the individual author(s) and contributor(s) and not of MDPI and/or the editor(s). MDPI and/or the editor(s) disclaim responsibility for any injury to people or property resulting from any ideas, methods, instructions or products referred to in the content. |
© 2025 by the authors. Licensee MDPI, Basel, Switzerland. This article is an open access article distributed under the terms and conditions of the Creative Commons Attribution (CC BY) license (https://creativecommons.org/licenses/by/4.0/).
Share and Cite
García Izquierdo, B.; Martínez-Urbistondo, D.; Guadalix, S.; Pastrana, M.; Bajo Buenestado, A.; Colina, I.; García de Yébenes, M.; Bastarrika, G.; Páramo, J.A.; Pastrana, J.C. Clinically Accessible Liver Fibrosis Association with CT Scan Coronary Artery Disease Beyond Other Validated Risk Predictors: The ICAP Experience. J. Clin. Med. 2025, 14, 1218. https://doi.org/10.3390/jcm14041218
García Izquierdo B, Martínez-Urbistondo D, Guadalix S, Pastrana M, Bajo Buenestado A, Colina I, García de Yébenes M, Bastarrika G, Páramo JA, Pastrana JC. Clinically Accessible Liver Fibrosis Association with CT Scan Coronary Artery Disease Beyond Other Validated Risk Predictors: The ICAP Experience. Journal of Clinical Medicine. 2025; 14(4):1218. https://doi.org/10.3390/jcm14041218
Chicago/Turabian StyleGarcía Izquierdo, Belén, Diego Martínez-Urbistondo, Sonsoles Guadalix, Marta Pastrana, Ana Bajo Buenestado, Inmaculada Colina, Manuel García de Yébenes, Gorka Bastarrika, José A. Páramo, and Juan Carlos Pastrana. 2025. "Clinically Accessible Liver Fibrosis Association with CT Scan Coronary Artery Disease Beyond Other Validated Risk Predictors: The ICAP Experience" Journal of Clinical Medicine 14, no. 4: 1218. https://doi.org/10.3390/jcm14041218
APA StyleGarcía Izquierdo, B., Martínez-Urbistondo, D., Guadalix, S., Pastrana, M., Bajo Buenestado, A., Colina, I., García de Yébenes, M., Bastarrika, G., Páramo, J. A., & Pastrana, J. C. (2025). Clinically Accessible Liver Fibrosis Association with CT Scan Coronary Artery Disease Beyond Other Validated Risk Predictors: The ICAP Experience. Journal of Clinical Medicine, 14(4), 1218. https://doi.org/10.3390/jcm14041218