
Four-Dimensional Magnetic Resonance Pulmonary Flow Imaging for Assessing Pulmonary Vasculopathy in Patients with Postcapillary Pulmonary Hypertension

 ,
,  , , ,
, , ,  ,
, 
Abstract
1. Introduction
2. Methods
2.1. Hypotheses and Objectives
2.2. Pulmonary Hypertension Definition
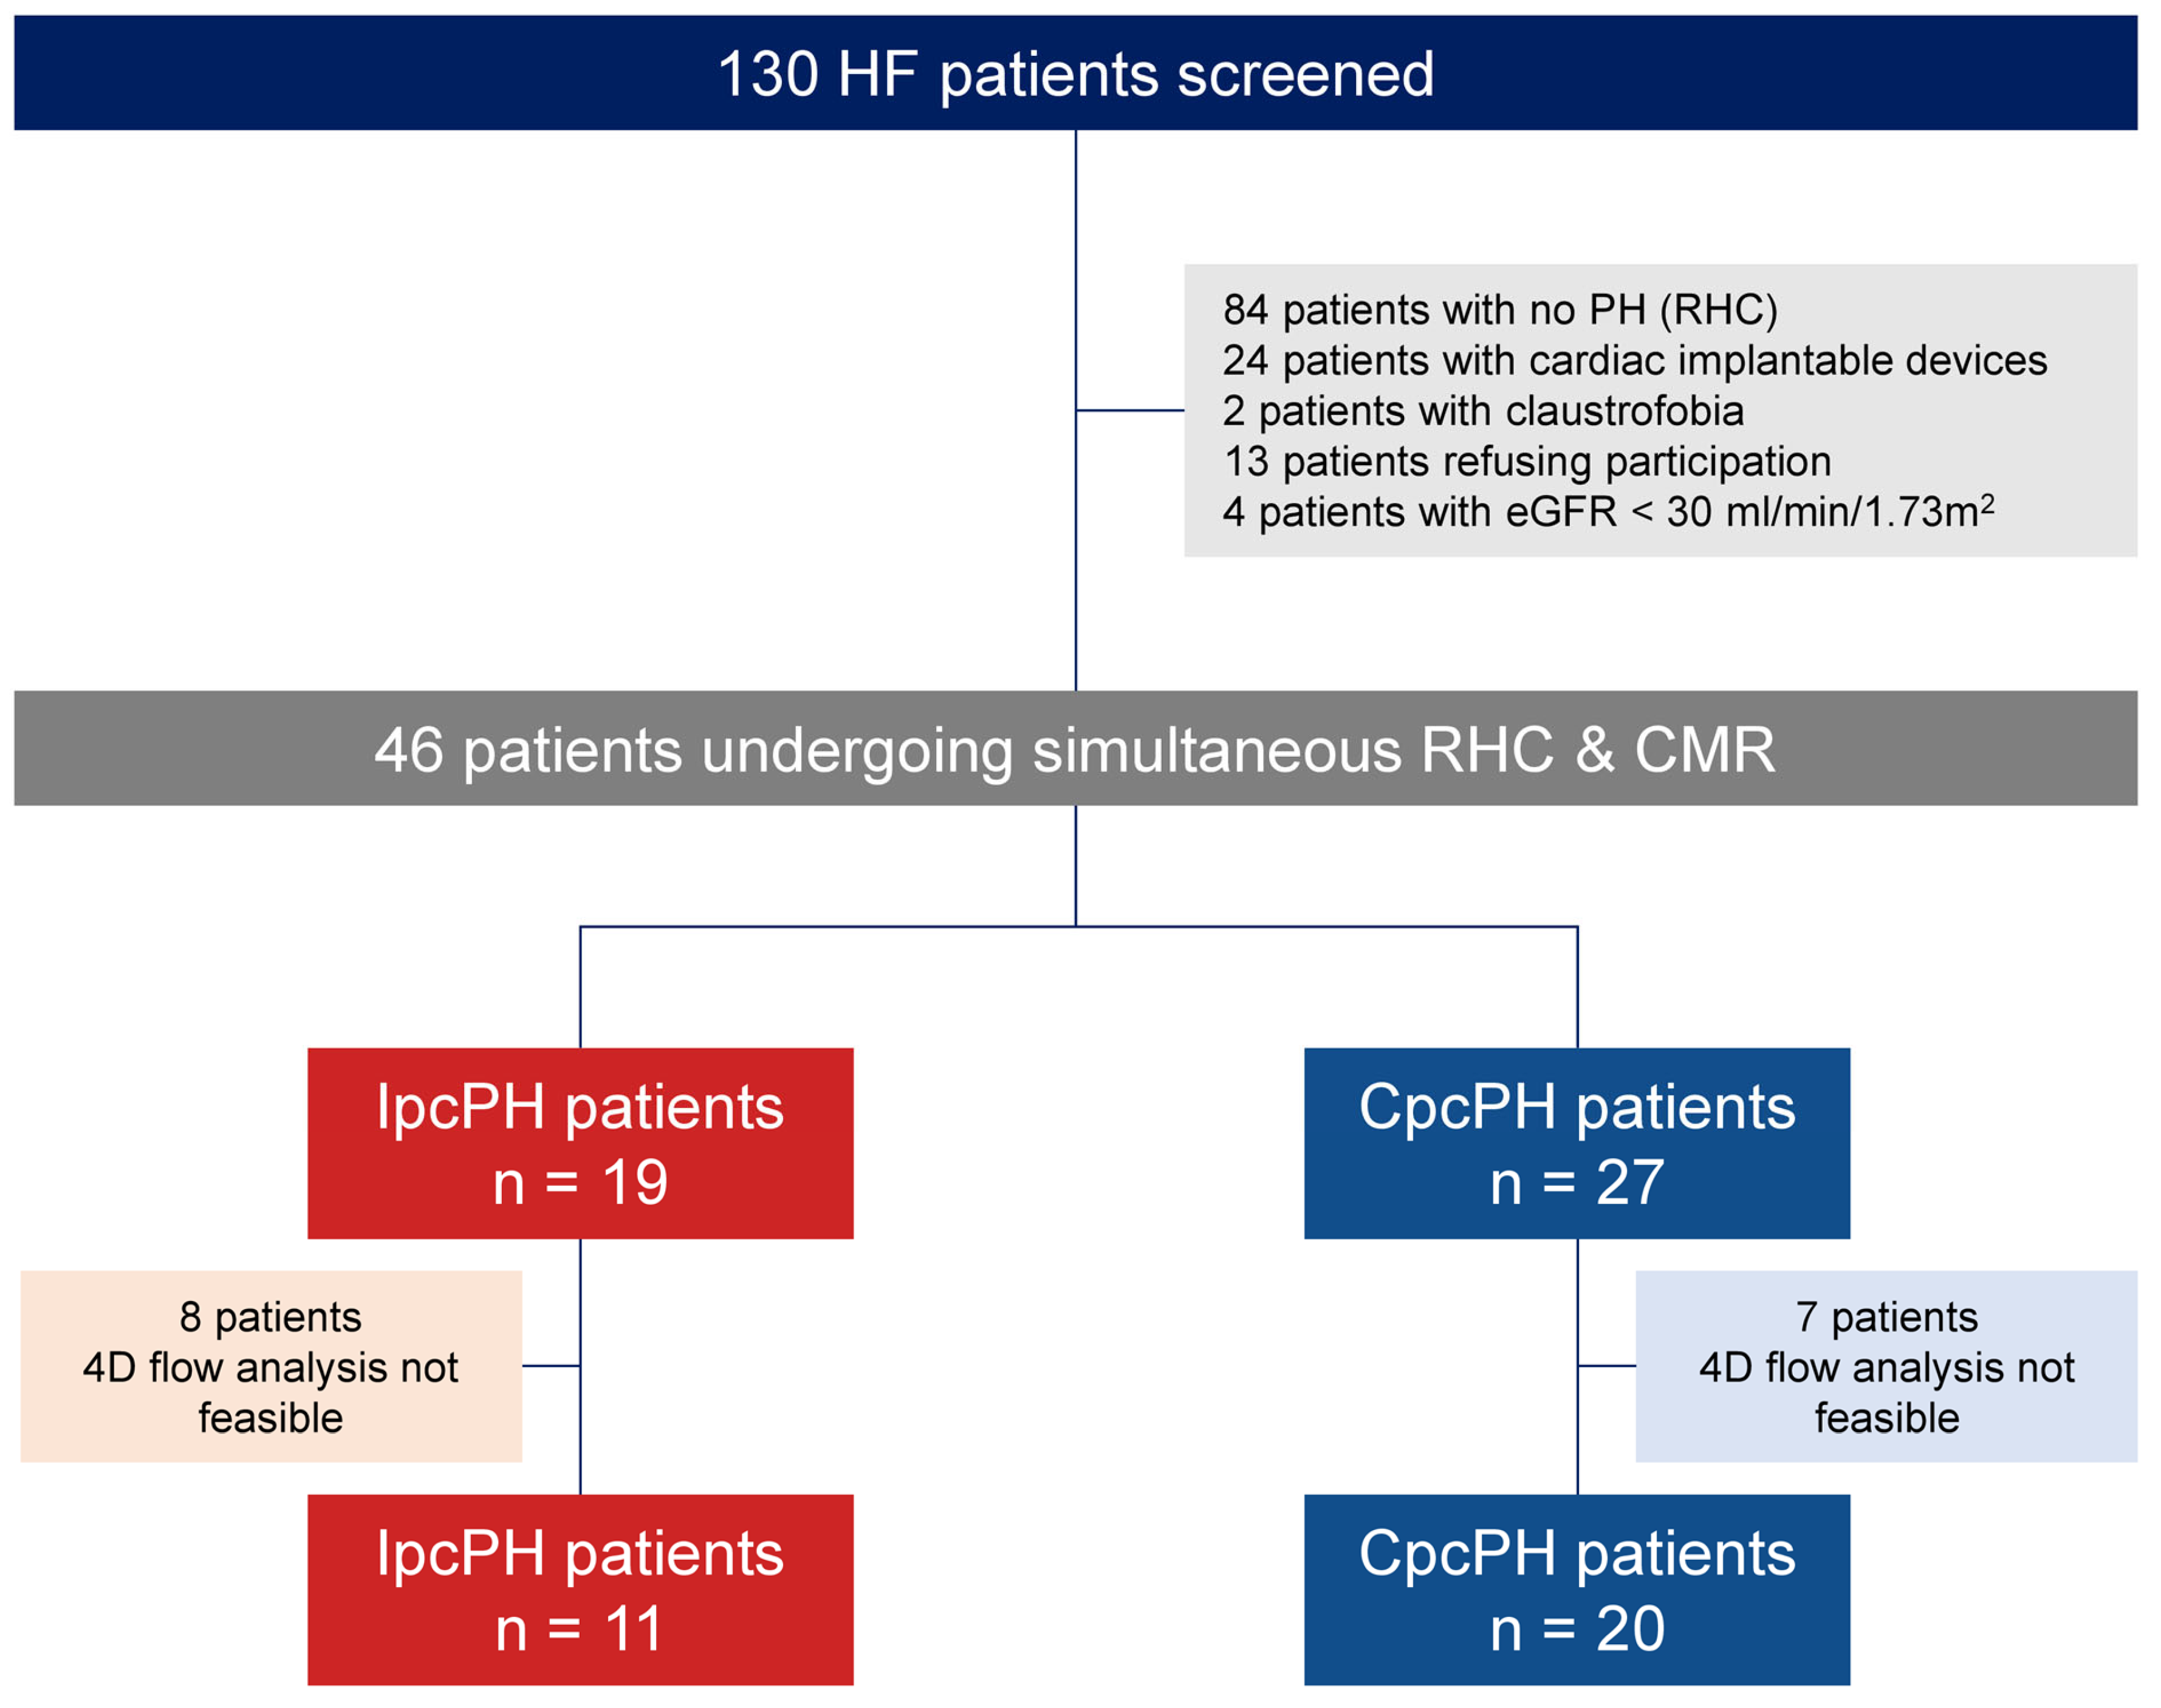
2.3. Study Design and Population
2.4. Right Heart Catheterization
2.5. Cardiac Magnetic Resonance Imaging
2.5.1. Acquisition Protocol
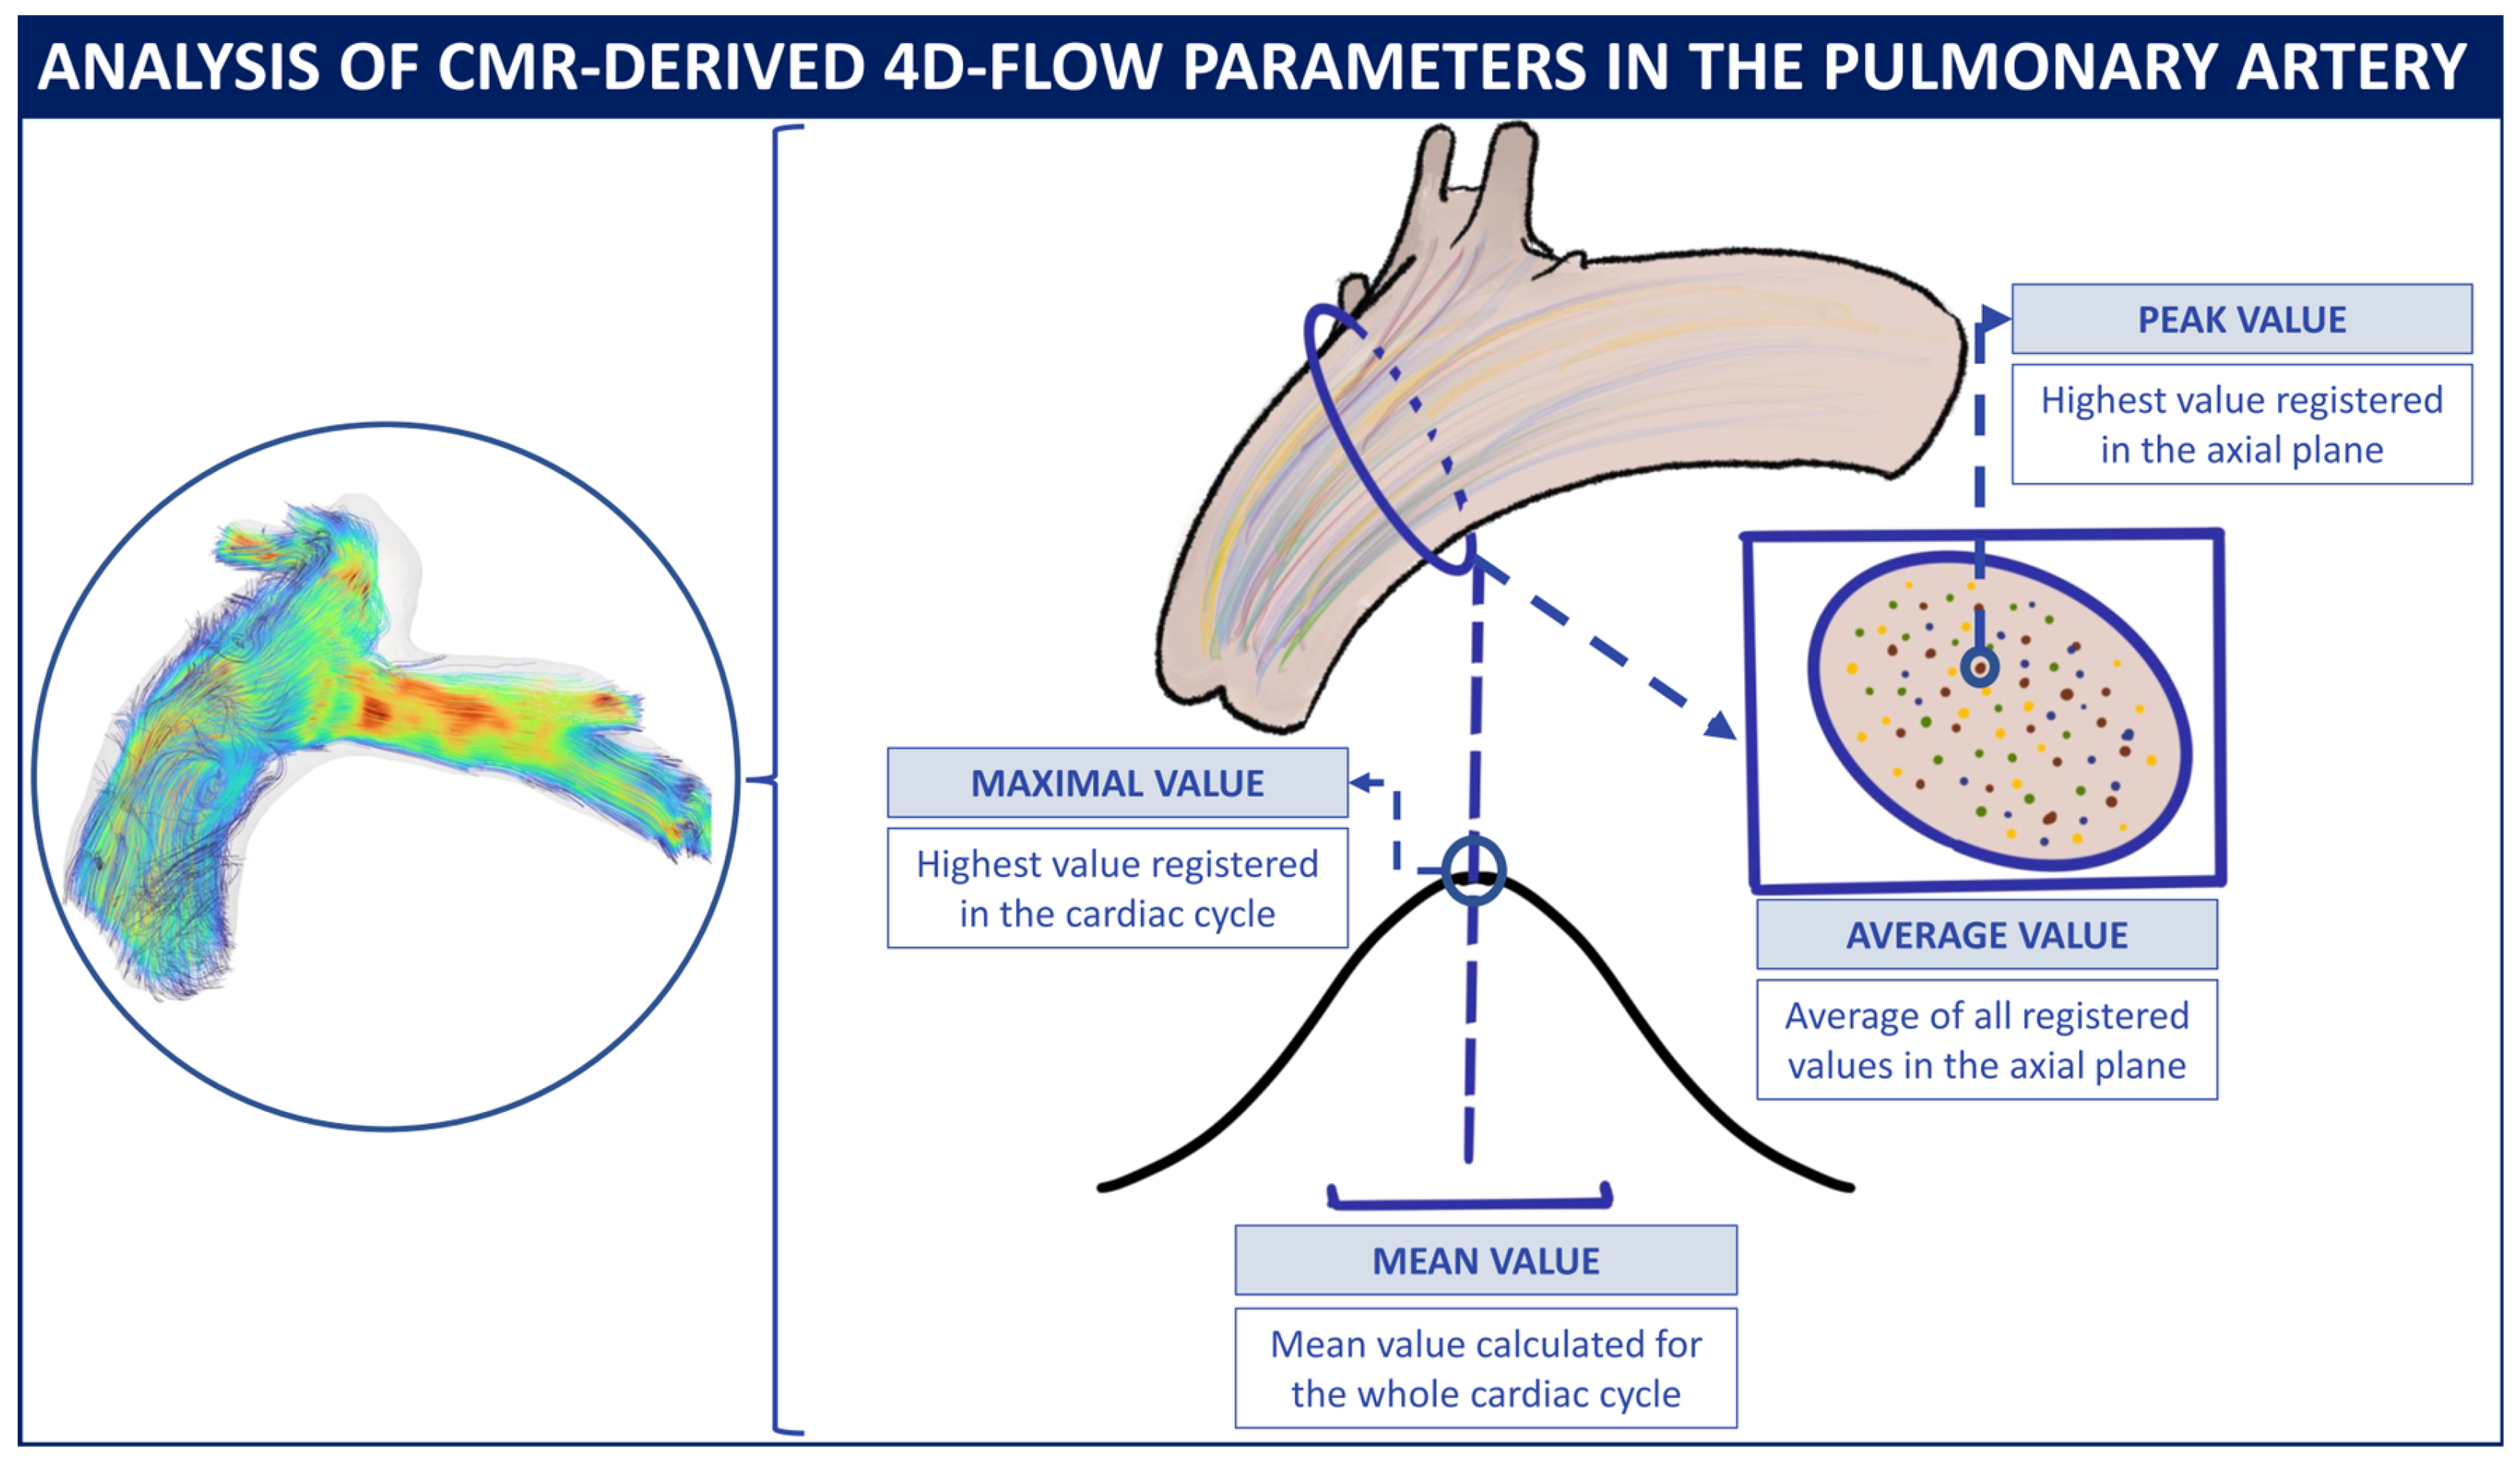
2.5.2. Four-Dimensional-Flow Analysis Protocol
2.6. Data Analysis
3. Results
3.1. Study Population and Baseline Characteristics
3.2. Noninvasive Assessment and Right Heart Catheterization
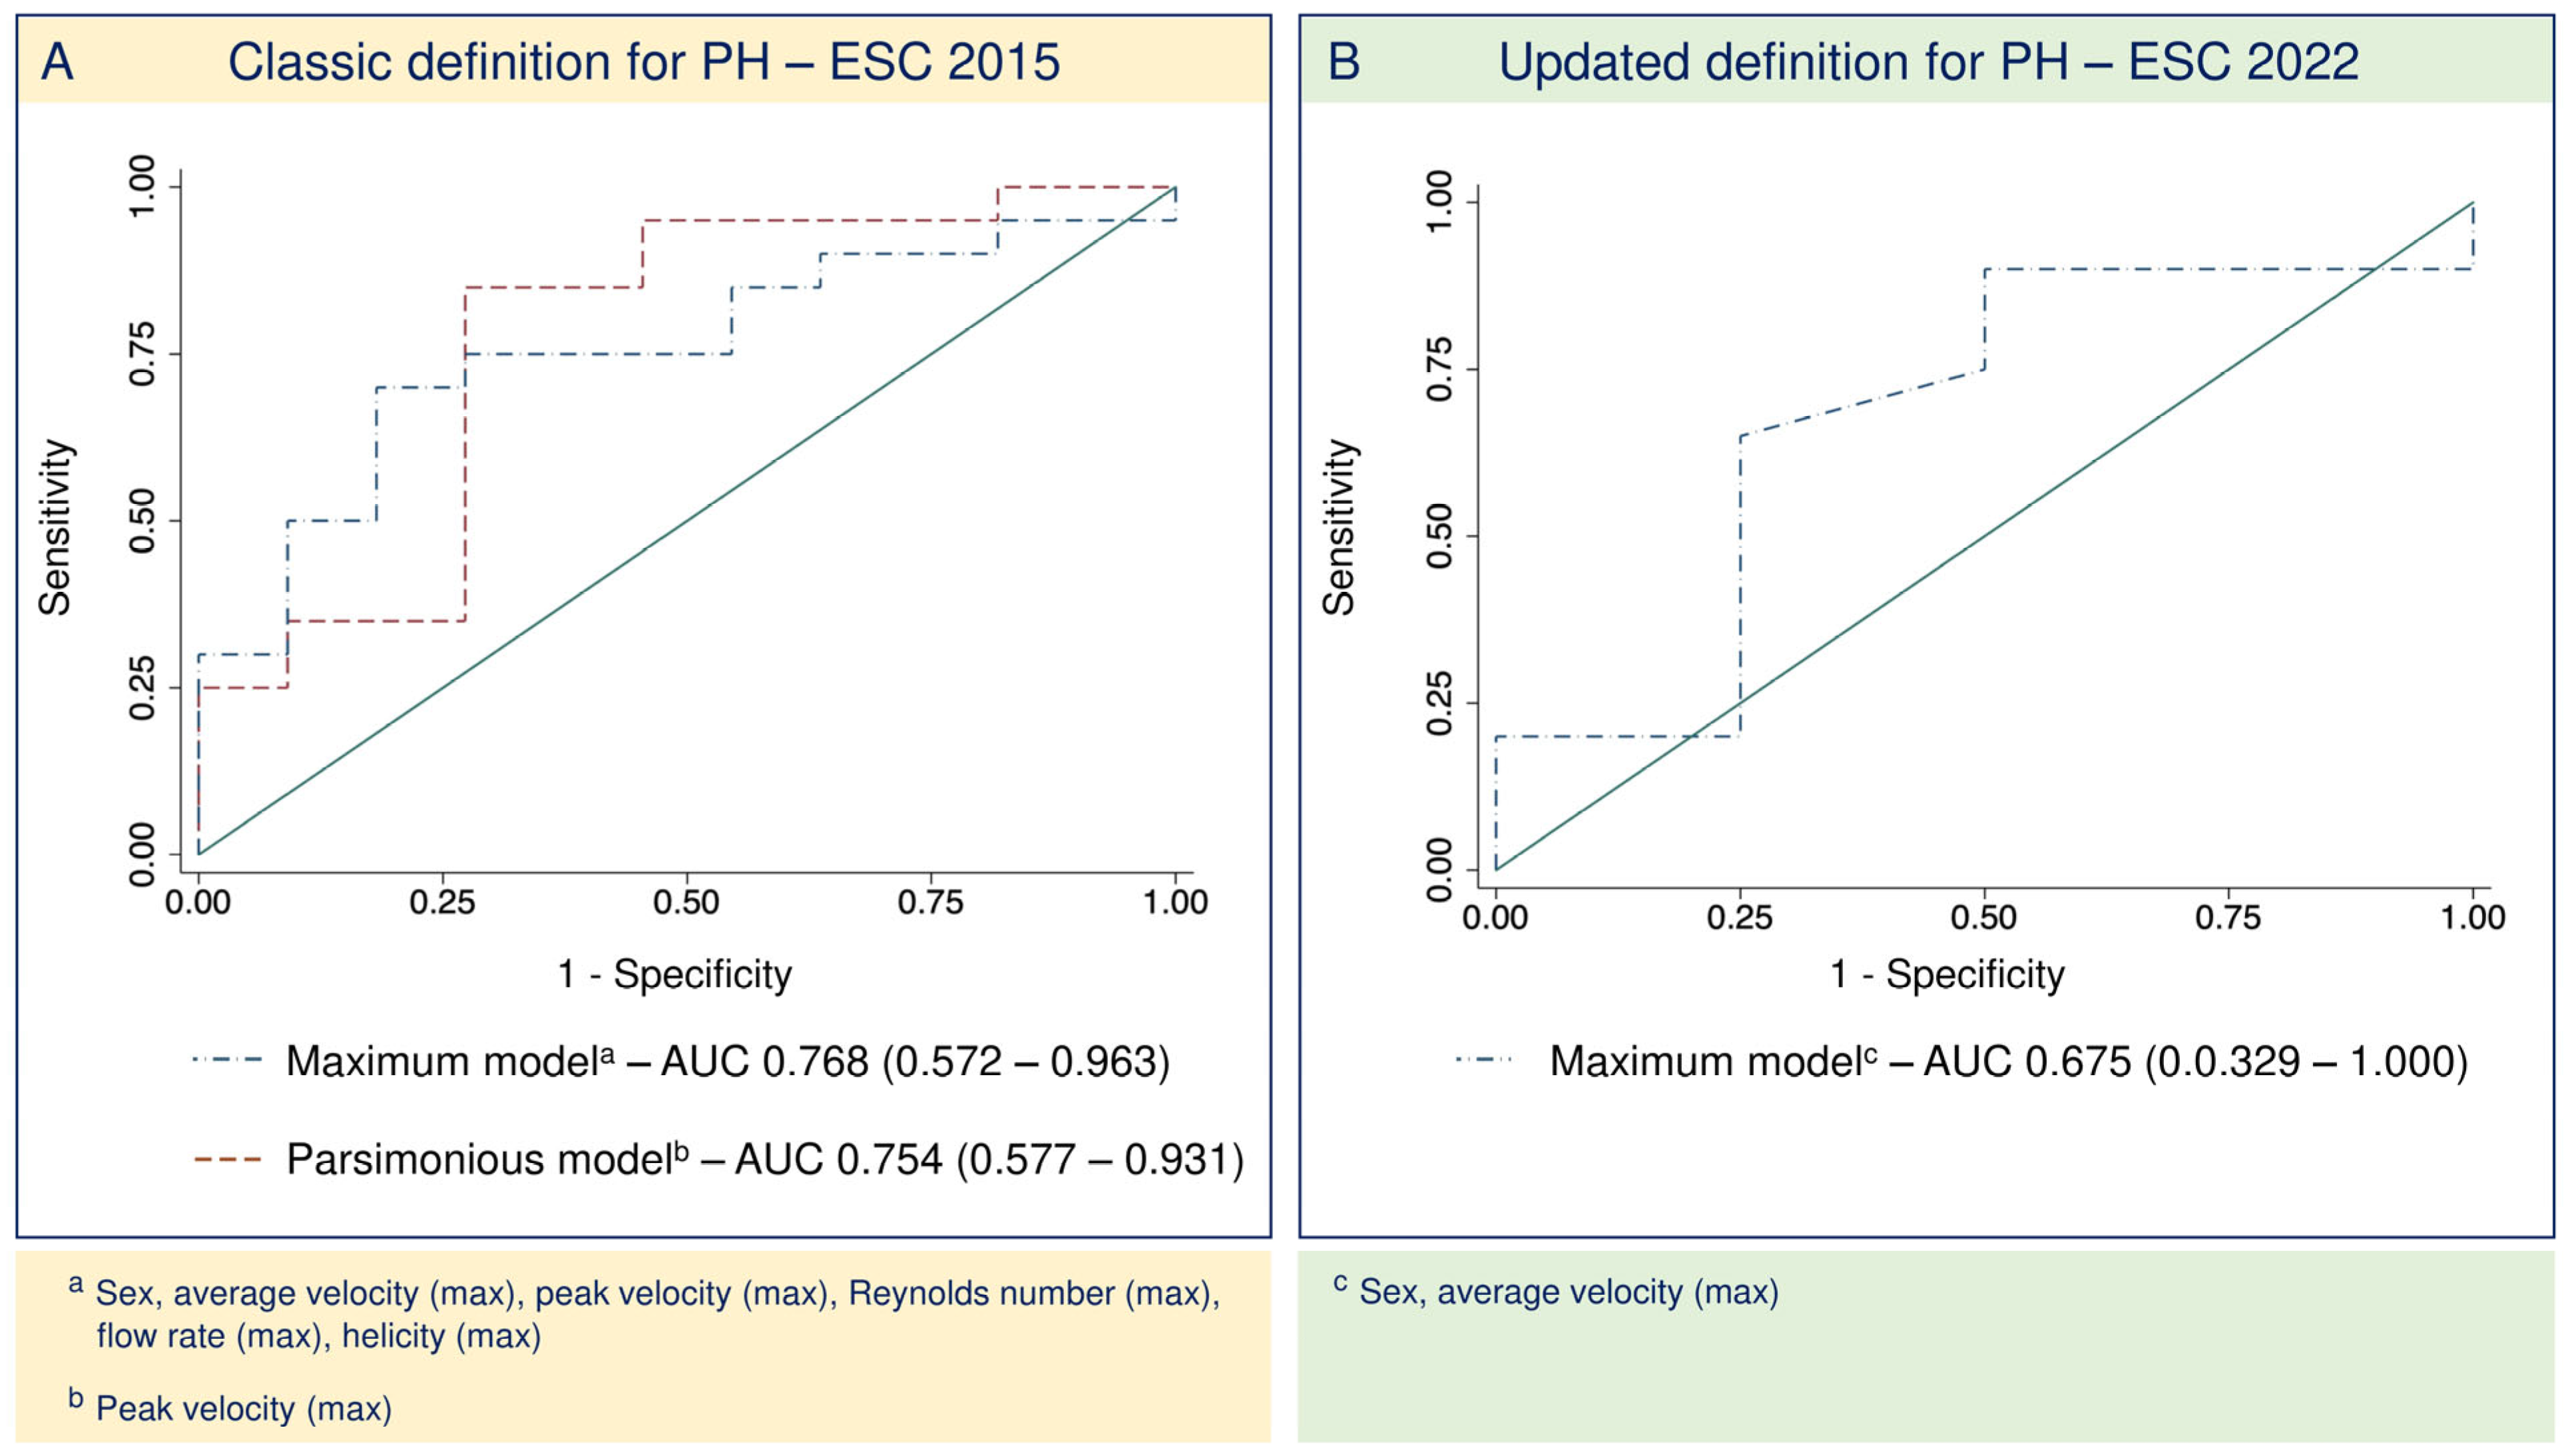
3.3. Four-Dimensional-Flow-Derived Biomarkers as Predictors of CpcPH
3.4. Updated Definition for PH2
4. Discussion
4.1. Noninvasive Assessment of Pulmonary Circulation
4.2. Evaluation of PA Flow Patterns with 4D-Flow Sequences
4.3. Study Limitations
4.4. Potential Translation into Clinical Practice
5. Conclusions
Supplementary Materials
Author Contributions
Funding
Institutional Review Board Statement
Informed Consent Statement
Data Availability Statement
Acknowledgments
Conflicts of Interest
Abbreviations
| AUC | Area under the curve |
| CMR | Cardiac magnetic resonance |
| CpcPH | Combined postcapillary pulmonary hypertension |
| HF | Heart Failure |
| IpcPH | Isolated postcapillary pulmonary hypertension |
| PH | Pulmonary hypertension |
| PH2 | Group 2 pulmonary hypertension |
| RHC | Right Heart Catheterization |
| RV | right ventricle |
References
- Roger, V.L. Epidemiology of Heart Failure: A Contemporary Perspective. Circ. Res. 2021, 128, 1421–1434. [Google Scholar] [CrossRef]
- Vachiéry, J.L.; Tedford, R.J.; Rosenkranz, S.; Palazzini, M.; Lang, I.; Guazzi, M.; Coghlan, G.; Chazova, I.; De Marco, T. Pulmonary hypertension due to left heart disease. Eur. Respir. J. 2019, 53, 1801897. [Google Scholar] [CrossRef] [PubMed]
- Humbert, M.; Kovacs, G.; Hoeper, M.M.; Badagliacca, R.; Berger, R.M.F.; Brida, M.; Carlsen, J.; Coats, A.J.S.; Escribano-Subias, P.; Ferrari, P.; et al. 2022 ESC/ERS Guidelines for the diagnosis and treatment of pulmonary hypertension. Eur. Heart J. 2022, 43, 3618–3731. [Google Scholar] [CrossRef]
- Humbert, M.; Guignabert, C.; Bonnet, S.; Dorfmüller, P.; Klinger, J.R.; Nicolls, M.R.; Olschewski, A.J.; Pullamsetti, S.S.; Schermuly, R.T.; Stenmark, K.R.; et al. Pathology and pathobiology of pulmonary hypertension: State of the art and research perspectives. Eur. Respir. J. 2019, 53, 1801887. [Google Scholar] [CrossRef] [PubMed]
- Gerges, M.; Gerges, C.; Pistritto, A.M.; Lang, M.B.; Trip, P.; Jakowitsch, J.; Binder, T.; Lang, I.M. Pulmonary Hypertension in Heart Failure. Epidemiology, Right Ventricular Function, and Survival. Am. J. Respir. Crit. Care Med. 2015, 192, 1234–1246. [Google Scholar] [CrossRef]
- Ponz, I.; Nuche, J.; Sanchez Sanchez, V.; Sanchez-Gonzalez, J.; Blazquez-Bermejo, Z.; Caravaca Perez, P.; Garcia-Cosio Carmena, M.D.; de Juan Baguda, J.S.; Rodríguez Chaverri, A.; Sarnago Cebada, F.; et al. Non-Invasive Assessment of Pulmonary Vasculopathy. Hearts 2021, 2, 5–14. [Google Scholar] [CrossRef]
- Galiè, N.; Humbert, M.; Vachiery, J.L.; Gibbs, S.; Lang, I.; Torbicki, A.; Simonneau, G.; Peacock, A.; Vonk Noordegraaf, A.; Beghetti, M.; et al. 2015 ESC/ERS Guidelines for the diagnosis and treatment of pulmonary hypertension: The Joint Task Force for the Diagnosis and Treatment of Pulmonary Hypertension of the European Society of Cardiology (ESC) and the European Respiratory Society (ERS): Endorsed by: Association for European Paediatric and Congenital Cardiology (AEPC), International Society for Heart and Lung Transplantation (ISHLT). Eur. Heart J. 2016, 37, 67–119. [Google Scholar] [CrossRef] [PubMed]
- Ponikowski, P.; Voors, A.A.; Anker, S.D.; Bueno, H.; Cleland, J.G.F.; Coats, A.J.S.; Falk, V.; González-Juanatey, J.R.; Harjola, V.P.; Jankowska, E.A.; et al. 2016 ESC Guidelines for the diagnosis and treatment of acute and chronic heart failure: The Task Force for the diagnosis and treatment of acute and chronic heart failure of the European Society of Cardiology (ESC)Developed with the special contribution of the Heart Failure Association (HFA) of the ESC. Eur. Heart J. 2016, 37, 2129–2200. [Google Scholar] [CrossRef]
- Bóbeda, J.; Erostarbe, H.; Stephens, M.; Gaitán, Á.; Kumar, R.; Nuche, J.; Marco, I.; Delgado, J.; Ruíz-Cabello, J.; López-Linares, K. Automatic Tool for Pulmonary Artery Hemodynamic Assessment from 4D flow MRI. In Proceedings of the 2023 IEEE 20th International Symposium on Biomedical Imaging (ISBI), Cartagena, Colombia, 18–21 April 2023; pp. 1–5. [Google Scholar]
- Hoeper, M.M.; Lee, S.H.; Voswinckel, R.; Palazzini, M.; Jais, X.; Marinelli, A.; Barst, R.J.; Ghofrani, H.A.; Jing, Z.C.; Opitz, C.; et al. Complications of right heart catheterization procedures in patients with pulmonary hypertension in experienced centers. J. Am. Coll. Cardiol. 2006, 48, 2546–2552. [Google Scholar] [CrossRef]
- Hur, D.J.; Sugeng, L. Non-invasive Multimodality Cardiovascular Imaging of the Right Heart and Pulmonary Circulation in Pulmonary Hypertension. Front. Cardiovasc. Med. 2019, 6, 24. [Google Scholar] [CrossRef] [PubMed]
- Martelli, G.; Congedi, S.; Lorenzoni, G.; Nardelli, M.; Lucchetta, V.; Gregori, D.; Tiberio, I. Echocardiographic assessment of pulmonary capillary wedge pressure by E/e’ ratio: A systematic review and meta-analysis. J. Crit. Care 2023, 76, 154281. [Google Scholar] [CrossRef]
- Sanz, J.; García-Alvarez, A.; Fernández-Friera, L.; Nair, A.; Mirelis, J.G.; Sawit, S.T.; Pinney, S.; Fuster, V. Right ventriculo-arterial coupling in pulmonary hypertension: A magnetic resonance study. Heart 2012, 98, 238–243. [Google Scholar] [CrossRef]
- Alabed, S.; Shahin, Y.; Garg, P.; Alandejani, F.; Johns, C.S.; Lewis, R.A.; Condliffe, R.; Wild, J.M.; Kiely, D.G.; Swift, A.J. Cardiac-MRI Predicts Clinical Worsening and Mortality in Pulmonary Arterial Hypertension: A Systematic Review and Meta-Analysis. JACC Cardiovasc. Imaging 2021, 14, 931–942. [Google Scholar] [CrossRef]
- García-Álvarez, A.; García-Lunar, I.; Pereda, D.; Fernández-Jimenez, R.; Sánchez-González, J.; Mirelis, J.G.; Nuño-Ayala, M.; Sánchez-Quintana, D.; Fernández-Friera, L.; García-Ruiz, J.M.; et al. Association of myocardial T1-mapping CMR with hemodynamics and RV performance in pulmonary hypertension. JACC Cardiovasc. Imaging 2015, 8, 76–82. [Google Scholar] [CrossRef]
- Nitsche, C.; Kammerlander, A.A.; Binder, C.; Duca, F.; Aschauer, S.; Koschutnik, M.; Snidat, A.; Beitzke, D.; Loewe, C.; Bonderman, D.; et al. Native T1 time of right ventricular insertion points by cardiac magnetic resonance: Relation with invasive haemodynamics and outcome in heart failure with preserved ejection fraction. Eur. Heart J. Cardiovasc. Imaging 2019, 21, 683–691. [Google Scholar] [CrossRef]
- Barker, A.J.; Roldán-Alzate, A.; Entezari, P.; Shah, S.J.; Chesler, N.C.; Wieben, O.; Markl, M.; François, C.J. Four-dimensional flow assessment of pulmonary artery flow and wall shear stress in adult pulmonary arterial hypertension: Results from two institutions. Magn. Reson. Med. 2015, 73, 1904–1913. [Google Scholar] [CrossRef]
- Cerne, J.W.; Pathrose, A.; Gordon, D.Z.; Sarnari, R.; Veer, M.; Blaisdell, J.; Allen, B.D.; Avery, R.; Markl, M.; Ragin, A.; et al. Evaluation of Pulmonary Hypertension Using 4D Flow MRI. J. Magn. Reson. Imaging 2022, 56, 234–245. [Google Scholar] [CrossRef] [PubMed]
- Odagiri, K.; Inui, N.; Hakamata, A.; Inoue, Y.; Suda, T.; Takehara, Y.; Sakahara, H.; Sugiyama, M.; Alley, M.T.; Wakayama, T.; et al. Non-invasive evaluation of pulmonary arterial blood flow and wall shear stress in pulmonary arterial hypertension with 3D phase contrast magnetic resonance imaging. SpringerPlus 2016, 5, 1071. [Google Scholar] [CrossRef] [PubMed]
- Kheyfets, V.O.; Schafer, M.; Podgorski, C.A.; Schroeder, J.D.; Browning, J.; Hertzberg, J.; Buckner, J.K.; Hunter, K.S.; Shandas, R.; Fenster, B.E. 4D magnetic resonance flow imaging for estimating pulmonary vascular resistance in pulmonary hypertension. J. Magn. Reson. Imaging 2016, 44, 914–922. [Google Scholar] [CrossRef] [PubMed]
- Ikoma, T.; Suwa, K.; Sano, M.; Ushio, T.; Saotome, M.; Ogawa, N.; Satoh, H.; Maekawa, Y. Early changes of pulmonary arterial hemodynamics in patients with systemic sclerosis: Flow pattern, WSS, and OSI analysis with 4D flow MRI. Eur. Radiol. 2021, 31, 4253–4263. [Google Scholar] [CrossRef] [PubMed]
- Fayyaz, A.U.; Edwards, W.D.; Maleszewski, J.J.; Konik, E.A.; DuBrock, H.M.; Borlaug, B.A.; Frantz, R.P.; Jenkins, S.M.; Redfield, M.M. Global Pulmonary Vascular Remodeling in Pulmonary Hypertension Associated With Heart Failure and Preserved or Reduced Ejection Fraction. Circulation 2018, 137, 1796–1810. [Google Scholar] [CrossRef] [PubMed]
- Schäfer, M.; Barker, A.J.; Kheyfets, V.; Stenmark, K.R.; Crapo, J.; Yeager, M.E.; Truong, U.; Buckner, J.K.; Fenster, B.E.; Hunter, K.S. Helicity and Vorticity of Pulmonary Arterial Flow in Patients with Pulmonary Hypertension: Quantitative Analysis of Flow Formations. J. Am. Heart Assoc. 2017, 6, e007010. [Google Scholar] [CrossRef]

| Total | IpcPH | CpcPH | p-Value | |
|---|---|---|---|---|
| N = 46 | N = 19 | N = 27 | ||
| Baseline characteristics | ||||
| Age, years | 55.4 (14.0) | 55.8 (14.9) | 55.2 (13.5) | 0.89 |
| Male sex, n (%) | 29 (63%) | 13 (68%) | 16 (59%) | 0.53 |
| BMI, kg/m2 | 27.2 (5.2) | 28.4 (5.0) | 26.3 (5.3) | 0.19 |
| Hypertension, n (%) | 23 (50%) | 7 (37%) | 16 (59%) | 0.13 |
| Dyslipidemia, n (%) | 17 (37%) | 5 (26%) | 12 (44%) | 0.21 |
| Ischemic heart disease, n (%) | 10 (22%) | 2 (11%) | 8 (30%) | 0.12 |
| Chronic kidney disease, n (%) | 16 (35%) | 4 (21%) | 12 (44%) | 0.10 |
| eGFR, mL/min/1.73 m2 | 68.5 (18.4) | 74.5 (18.5) | 64.4 (17.5) | 0.066 |
| Respiratory disease | 9 (20%) | 4 (21%) | 5 (19%) | 0.19 |
| COPD, n (%) | 3 (7%) | 3 (16%) | 0 (0%) | |
| OSA, n (%) | 4 (9%) | 1 (5%) | 3 (11%) | |
| Restrictive, n (%) | 1 (2%) | 0 (0%) | 1 (4%) | |
| Others, n (%) | 1 (2%) | 0 (0%) | 1 (4%) | |
| FVC, % | 75.3 (14.8) | 73.1 (13.1) | 76.6 (16.0) | 0.51 |
| FEV1, % | 70.6 (18.0) | 65.6 (19.6) | 73.5 (16.8) | 0.21 |
| DLCO-VA, % | 79.6 (12.8) | 80.6 (14.3) | 79.1 (12.3) | 0.76 |
| Atrial fibrillation, n (%) | 19 (41%) | 9 (47%) | 10 (37%) | 0.48 |
| Heart failure characteristics | ||||
| Etiology | 0.25 | |||
| Ischemic, n (%) | 10 (22%) | 2 (11%) | 8 (30%) | |
| Hypertrophic, n (%) | 1 (2%) | 0 (0%) | 1 (4%) | |
| Dilated, n (%) | 21 (46%) | 12 (63%) | 9 (33%) | |
| Restrictive, n (%) | 4 (9%) | 2 (11%) | 2 (7%) | |
| Other, n (%) | 10 (22%) | 3 (16%) | 7 (26%) | |
| HF classification LVEF, n (%) | 0.53 | |||
| HFrEF, n (%) | 28 (61%) | 13 (68%) | 15 (56%) | |
| HFmrEF, n (%) | 5 (11%) | 1 (5%) | 4 (15%) | |
| HFpEF, n (%) | 13 (28%) | 5 (26%) | 8 (30%) | |
| NYHA functional class | ||||
| II, n (%) | 24 (52%) | 8 (42%) | 16 (59%) | 0.42 |
| III, n (%) | 19 (41%) | 9 (47%) | 10 (37%) | |
| IV, n (%) | 3 (7%) | 2 (11%) | 1 (4%) | |
| NT-proBNP, pg/mL | 2043.0 (1136.0–3242.0) | 1751.0 (1338.0–4000.0) | 2074.0 (939.0–3114.0) | 0.83 |
| HF hospitalization, n (%) | 20 (43%) | 7 (37%) | 13 (48%) | 0.45 |
| Heart failure treatment | ||||
| ACEI/ARB, n (%) | 22 (48%) | 12 (63%) | 10 (37%) | 0.081 |
| ARNI, n (%) | 10 (22%) | 4 (22%) | 6 (22%) | 1.00 |
| MRA, n (%) | 33 (72%) | 16 (84%) | 17 (63%) | 0.12 |
| Beta-blockers, n (%) | 38 (83%) | 18 (95%) | 20 (74%) | 0.069 |
| Ivabradine, n (%) | 8 (17%) | 4 (21%) | 4 (15%) | 0.58 |
| Loop diuretic, n (%) | 40 (87%) | 16 (84%) | 24 (89%) | 0.64 |
| Furosemide, n (%) | 38 (83%) | 15 (79%) | 23 (85%) | 0.58 |
| Furosemide dose, mg/day | 40 (40–80) | 40 (40–80) | 50 (40–80) | 0.69 |
| Torasemide, n (%) | 2 (4%) | 1 (5%) | 1 (4%) | 0.80 |
| Torasemide dose, mg/day | 10 | 10 | 10 | NA |
| Total | IpcPH | CpcPH | p-Value | |
|---|---|---|---|---|
| N = 46 | N = 19 | N = 27 | ||
| Echocardiography parameters | ||||
| LVEF, % | 38 (25–56) | 33 (24–56) | 39 (28–56) | 0.50 |
| Diastolic dysfunction | 32 (70%) | 12 (63%) | 20 (74%) | 0.42 |
| Grade I, n (%) | 2 (4%) | 1 (5%) | 1 (4%) | |
| Grade II, n (%) | 4 (9%) | 2 (11%) | 2 (7%) | |
| Grade III, n (%) | 26 (57%) | 9 (47%) | 17 (63%) | |
| E/A ratio | 3.0 (2.2–3.5) | 3.2 (2.0–3.6) | 2.9 (2.3–3.4) | 0.96 |
| E/e’ ratio | 12.1 (7.8–15.3) | 10.0 (6.8–14.0) | 13.3 (9.5–15.3) | 0.27 |
| Indexed LA volume, cm3/m2 | 31 (25–39) | 28 (23–38) | 33 (26–44) | 0.30 |
| Right ventricular dysfunction | 0.36 | |||
| Mild, n (%) | 11 (24%) | 2 (11%) | 9 (33%) | |
| Moderate, n (%) | 10 (22%) | 5 (26%) | 5 (19%) | |
| Severe, n (%) | 4 (9%) | 2 (11%) | 2 (7%) | |
| TAPSE, mm | 17.0 (15.0–20.0) | 16.0 (15.0–19.0) | 18.0 (15.0–20.0) | 0.18 |
| Mitral regurgitation (>mild), n (%) | 14 (30%) | 5 (26%) | 9 (33%) | 0.61 |
| Tricuspid regurgitation (>mild), n (%) | 10 (22%) | 4 (21%) | 6 (22%) | 0.92 |
| Systolic PA pressure, mmHg | 55 (50–63) | 50.5 (44.5–55.5) | 61 (54–65) | 0.01 |
| CMR parameters | ||||
| Left chambers | ||||
| LVEF, % | 34 (20–50) | 27 (19–50) | 36 (21–54) | 0.40 |
| LA area, cm2 | 36 (30–43) | 39 (32–43) | 35 (28–42) | 0.26 |
| Indexed end-diastolic LV volume, mL/m2 | 109 (83–159) | 130 (75–169) | 100 (83–147) | 0.35 |
| Indexed end-systolic LV volume, mL/m2 | 70 (43–115) | 93 (44–137) | 64 (38–112) | 0.35 |
| Indexed LV mass, g/m2 | 73 (56–82) | 68 (62–87) | 73 (55–80) | 0.47 |
| Indexed LV cardiac output, mL/min/m2 | 1.9 (1.6–2.4) | 1.7 (1.6–2.0) | 2.2 (1.6–2.6) | 0.07 |
| Right chambers | ||||
| RA area, cm2 | 27 (21–30) | 28 (20–32) | 24 (21–30) | 0.58 |
| RVEF, % | 40 (30–54) | 41 (27–61) | 40 (30–52) | 0.78 |
| Indexed RV end-diastolic volume, mL/m2 | 80 (64–118) | 75 (51–118) | 85 (65–119) | 0.48 |
| Indexed RV end-systolic volume, mL/m2 | 46 (32–78) | 45 (21–80) | 49 (32–78) | 0.40 |
| Indexed RV mass, g/m2 | 29 (21–32) | 23 (19–29) | 32 (29–43) | 0.11 |
| Indexed RV cardiac output, mL/min/m2 | 2.0 (1.6–2.4) | 2.0 (1.6–2.2) | 2.0 (1.6–2.9) | 0.42 |
| PA diameter, mm | 28 (27–31) | 28 (24.5–28) | 31 (28–33) | 0.01 |
| PA pulsatility | 19.9 (10.3–30.9) | 25.4 (15.5–31.7) | 15.7 (9.8–26.2) | 0.18 |
| RV/PA coupling | 1.6 (1.1–2.4) | 1.6 (0.8–2.6) | 1.6 (1.1–2.3) | 0.94 |
| RHC parameters | ||||
| Right atrial pressure, mmHg | 11 (8–13) | 12 (9–15) | 10 (7–11) | 0.05 |
| Systolic PA pressure, mmHg | 58 (50–69) | 48 (39–56) | 65 (56–75) | <0.001 |
| Diastolic PA pressure, mmHg | 24 (21–29) | 23 (21–27) | 25 (20–33) | 0.58 |
| Mean PA pressure, mmHg | 38 (32–43) | 32 (30–38) | 41 (37–46) | <0.001 |
| PAWP, mmHg | 22 (19–27) | 23 (21–30) | 22 (18–26) | 0.07 |
| Cardiac index, L/min/m2 | 2.2 (1.9–2.6) | 2.2 (1.9–2.5) | 2.3 (1.9–2.7) | 0.99 |
| Pulmonary vascular resistance, WU | 4 (2–5) | 2 (1–3) | 5 (4–6) | <0.001 |
| Transpulmonary gradient *, mmHg | 15 (9–20) | 9 (7–11) | 20 (17–24) | <0.001 |
| Total | IpcPH | CpcPH | p-Value | |
|---|---|---|---|---|
| N = 31 | N = 11 | N = 20 | ||
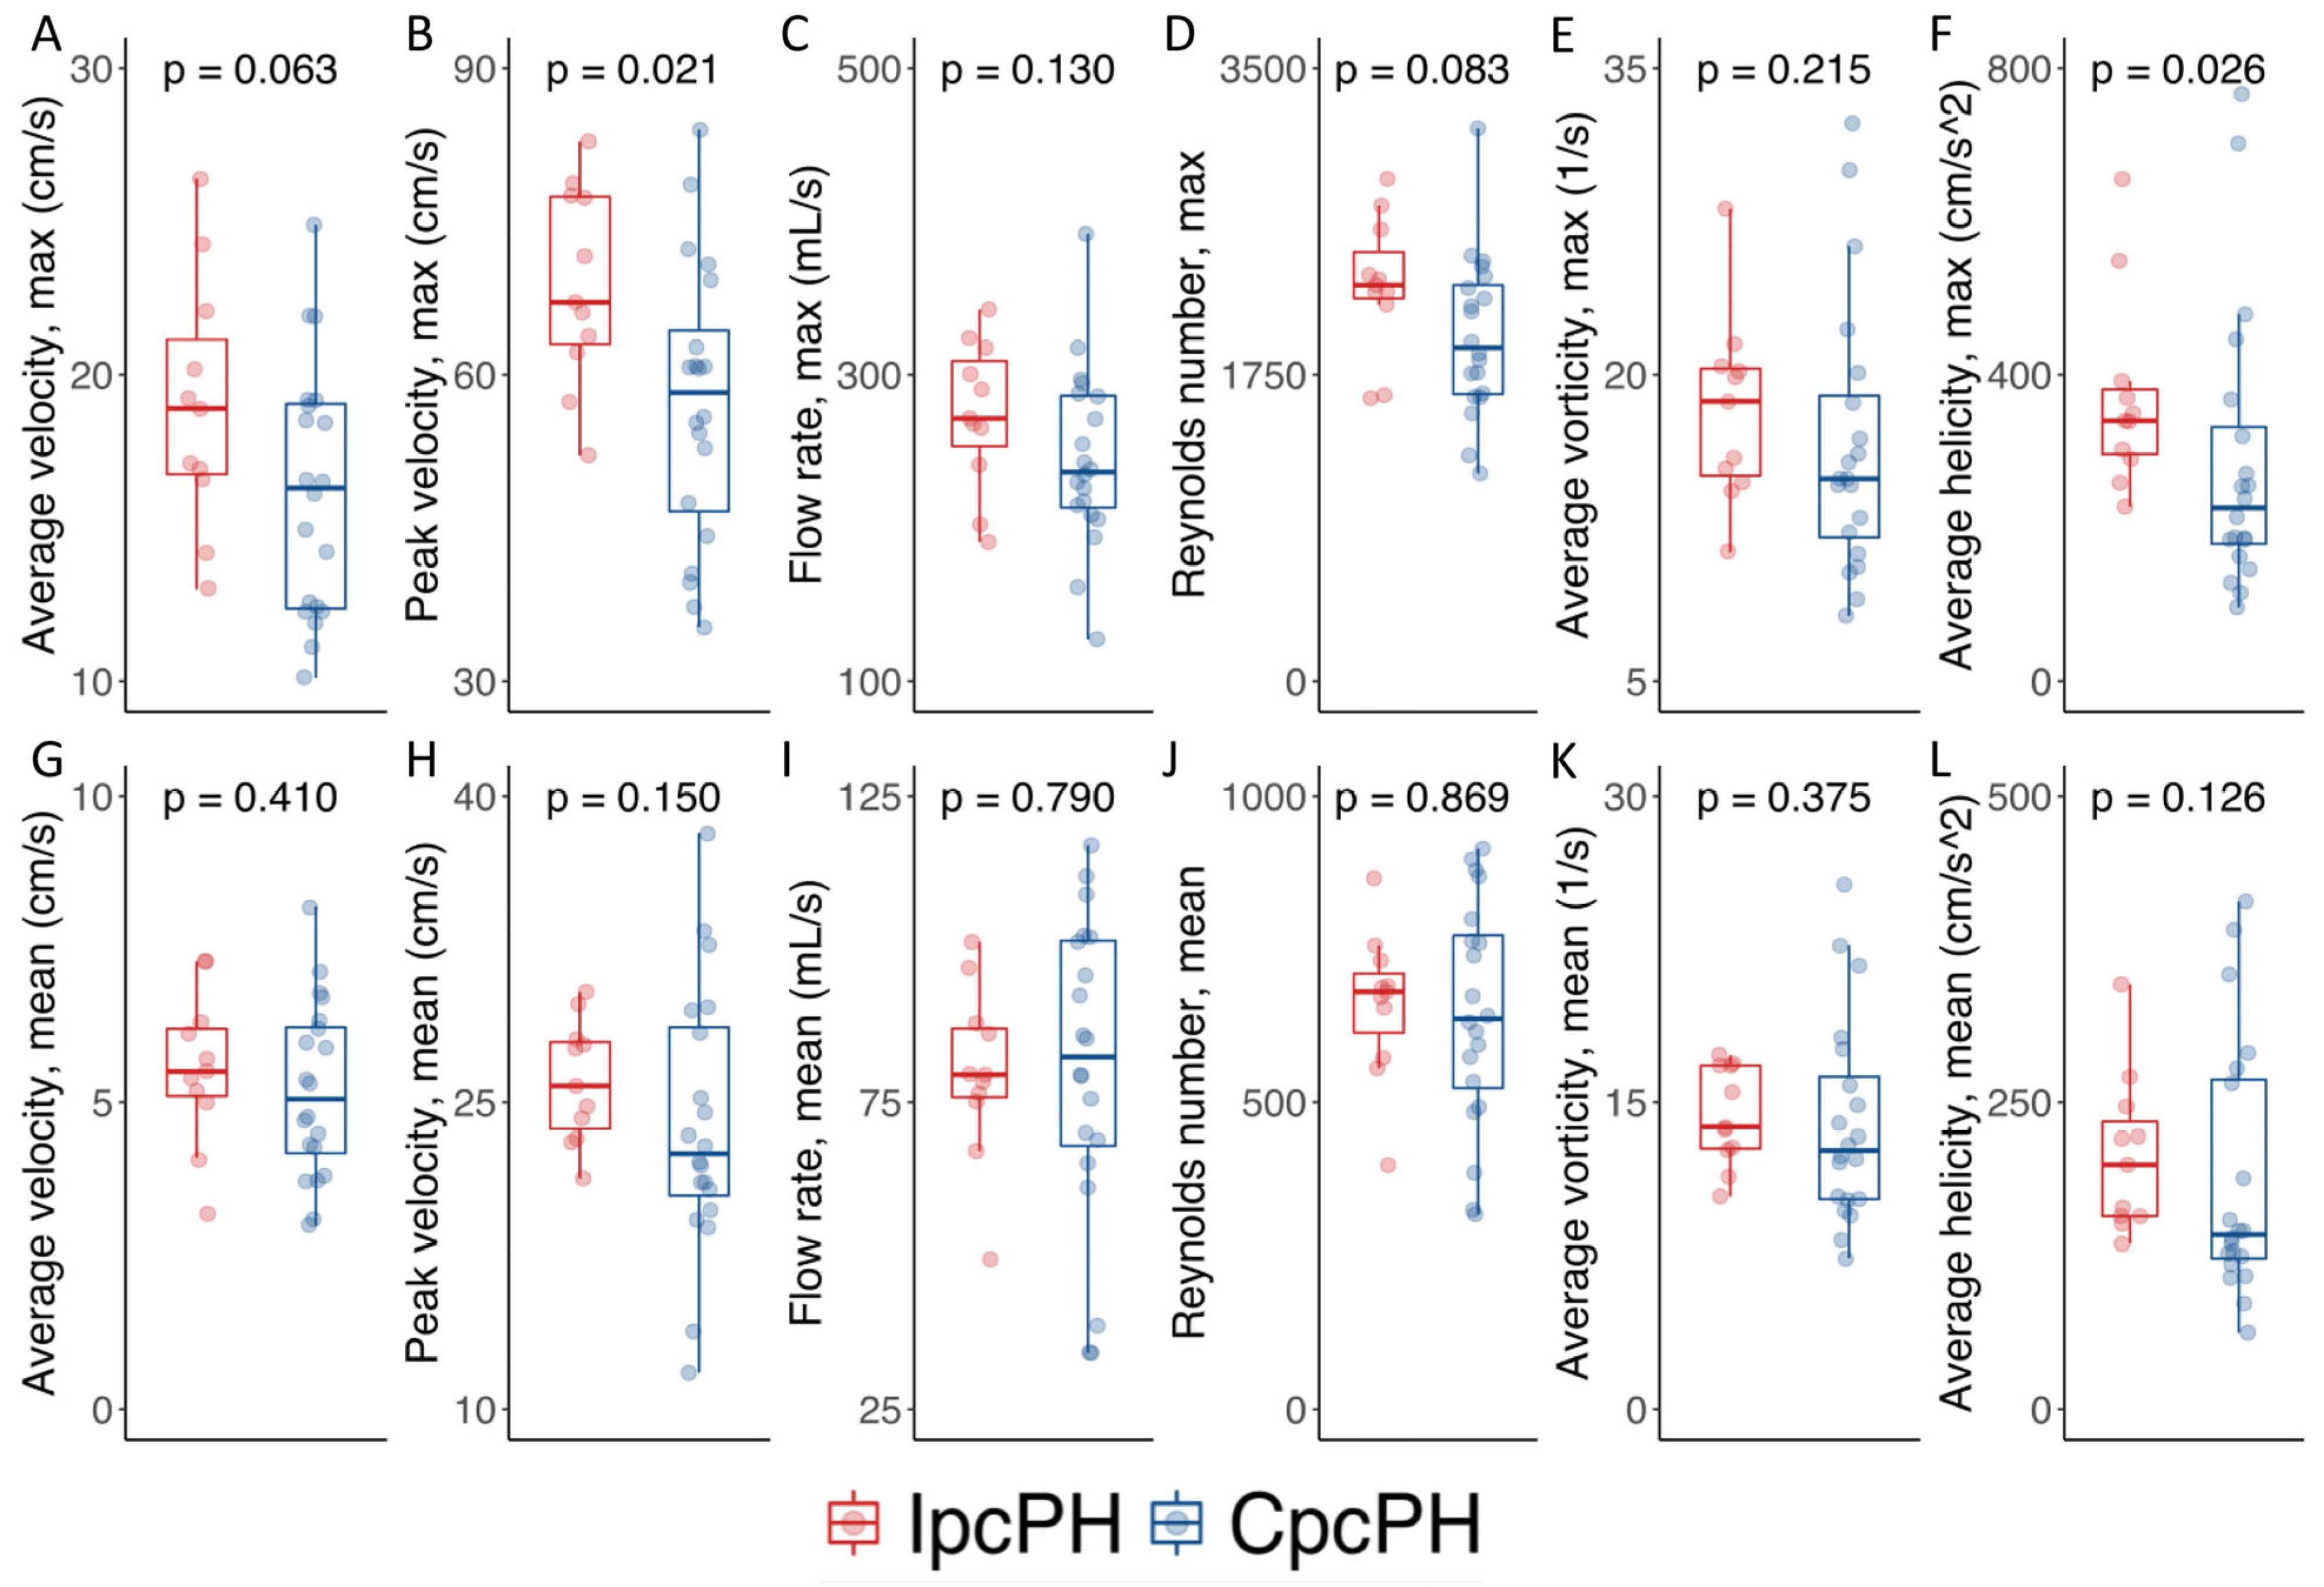
| Average velocity (max), cm/s | 16.9 (13.0–19.2) | 18.9 (16.6–22.1) | 16.3 (12.4–19.1) | 0.063 |
| Average velocity (mean), cm/s | 5.4 (4.3–6.3) | 5.5 (5.0–6.3) | 5.1 (4.1–6.2) | 0.410 |
| Peak velocity (max), cm/s | 60.9 (52.8–71.6) | 67.1 (62.2–77.5) | 58.2 (45.8–66.0) | 0.021 |
| Peak velocity (mean), cm/s | 24.2 (21.1–28.4) | 25.8 (23.2–28.1) | 22.5 (20.2–29.0) | 0.150 |
| Flow rate (max), mL/s | 254.8 (214.8–294.7) | 271.4 (241.2–317.5) | 236.4 (211.6–286.7) | 0.130 |
| Flow rate (mean), mL/s | 79.5 (68.9–96.9) | 79.5 (75.1–87.9) | 82.4 (67.0–101.6) | 0.790 |
| Reynolds number (max) | 2151.0 (1643.6–2323.2) | 2262.2 (2151.0–2580.7) | 1905.0 (1634.8–2279.4) | 0.083 |
| Reynolds number (mean) | 672.0 (533.6–759.9) | 680.4 (572.7–731.0) | 636.3 (512.6–781.4) | 0.869 |
| Average vorticity (max), L/s | 15.7 (13.0–20.2) | 18.7 (14.7–20.4) | 14.9 (11.8–19.4) | 0.215 |
| Average vorticity (mean), L/s | 13.3 (10.4–16.8) | 13.8 (12.7–16.8) | 12.6 (10.2–16.7) | 0.375 |
| Average helicity (max), cm/s2 | 270.7 (186.4–369.8) | 339.9 (290.0–391.8) | 226.0 (173.5–343.7) | 0.026 |
| Average helicity (mean), cm/s2 | 157.2 (128.0–265.4) | 199.2 (157.2–246.5) | 142.3 (121.5–271.5) | 0.126 |
| Variable | OR (95%—CI) | p-Value |
|---|---|---|
| Maximal average velocity, cm/s | 0.84 (0.69–1.03) | 0.090 |
| Mean average velocity, cm/s | 0.82 (0.46–1.43) | 0.469 |
| Maximal peak velocity, cm/s | 0.92 (0.86–0.99) | 0.032 |
| Mean peak velocity, cm/s | 0.93 (0.81–1.07) | 0.316 |
| Maximal flow rate, cm/s | 0.99 (0.98–1.00) | 0.176 |
| Mean flow rate, cm/s | 1.00 (0.97–1.04) | 0.934 |
| Maximal Reynolds number | 0.99 (0.99–1.00) | 0.096 |
| Mean Reynolds number | 1.00 (1.00–1.00) | 0.792 |
| Maximal average vorticity, L/s | 0.95 (0.84–1.08) | 0.466 |
| Mean average vorticity, L/s | 0.98 (0.82–1.16) | 0.794 |
| Maximal average helicity, cm/s2 | 1.00 (0.99–1.00) | 0.190 |
| Mean average helicity, cm/s2 | 1.00 (0.99–1.01) | 0.593 |
Disclaimer/Publisher’s Note: The statements, opinions and data contained in all publications are solely those of the individual author(s) and contributor(s) and not of MDPI and/or the editor(s). MDPI and/or the editor(s) disclaim responsibility for any injury to people or property resulting from any ideas, methods, instructions or products referred to in the content. |
© 2025 by the authors. Licensee MDPI, Basel, Switzerland. This article is an open access article distributed under the terms and conditions of the Creative Commons Attribution (CC BY) license (https://creativecommons.org/licenses/by/4.0/).
Share and Cite
Nuche, J.; Ponz, I.; Sánchez Sánchez, V.; Bóbeda, J.; Gaitán, Á.; López-Linares, K.; García-Cosío, M.D.; Sarnago Cebada, F.; González, J.S.; Arribas Ynsaurriaga, F.; et al. Four-Dimensional Magnetic Resonance Pulmonary Flow Imaging for Assessing Pulmonary Vasculopathy in Patients with Postcapillary Pulmonary Hypertension. J. Clin. Med. 2025, 14, 929. https://doi.org/10.3390/jcm14030929
Nuche J, Ponz I, Sánchez Sánchez V, Bóbeda J, Gaitán Á, López-Linares K, García-Cosío MD, Sarnago Cebada F, González JS, Arribas Ynsaurriaga F, et al. Four-Dimensional Magnetic Resonance Pulmonary Flow Imaging for Assessing Pulmonary Vasculopathy in Patients with Postcapillary Pulmonary Hypertension. Journal of Clinical Medicine. 2025; 14(3):929. https://doi.org/10.3390/jcm14030929
Chicago/Turabian StyleNuche, Jorge, Inés Ponz, Violeta Sánchez Sánchez, Javier Bóbeda, Ángel Gaitán, Karen López-Linares, María Dolores García-Cosío, Fernando Sarnago Cebada, Javier Sánchez González, Fernando Arribas Ynsaurriaga, and et al. 2025. "Four-Dimensional Magnetic Resonance Pulmonary Flow Imaging for Assessing Pulmonary Vasculopathy in Patients with Postcapillary Pulmonary Hypertension" Journal of Clinical Medicine 14, no. 3: 929. https://doi.org/10.3390/jcm14030929
APA StyleNuche, J., Ponz, I., Sánchez Sánchez, V., Bóbeda, J., Gaitán, Á., López-Linares, K., García-Cosío, M. D., Sarnago Cebada, F., González, J. S., Arribas Ynsaurriaga, F., Ruíz-Cabello, J., Ibáñez, B., & Delgado, J. F. (2025). Four-Dimensional Magnetic Resonance Pulmonary Flow Imaging for Assessing Pulmonary Vasculopathy in Patients with Postcapillary Pulmonary Hypertension. Journal of Clinical Medicine, 14(3), 929. https://doi.org/10.3390/jcm14030929