
Resting Body Temperature and Long-Term Survival in Older Adults at a Mental Health Center: Cross-Sectional and Longitudinal Data

 , , , , and
Abstract
1. Introduction
2. Materials and Methods
2.1. Study Design and Participants
2.2. Measurements
2.3. Statistical Methods
3. Results
4. Discussion
5. Conclusions
Author Contributions
Funding
Institutional Review Board Statement
Informed Consent Statement
Data Availability Statement
Conflicts of Interest
References
- Cesari, M.; Kritchevsky, S.B.; Newman, A.B.; Simonsick, E.M.; Harris, T.B.; Penninx, B.W.; Brach, J.S.; Tylavsky, F.A.; Satterfield, S.; Bauer, D.C.; et al. Added value of physical performance measures in predicting adverse health-related events: Results from the Health, Aging and Body Composition Study. J. Am. Geriatr. Soc. 2009, 57, 251–259. [Google Scholar] [CrossRef] [PubMed]
- Arai, Y.; Martin-Ruiz, C.M.; Takayama, M.; Abe, Y.; Takebayashi, T.; Koyasu, S.; Suematsu, M.; Hirose, N.; von Zglinicki, T. Inflammation, but not telomere length, predicts successful ageing at extreme old age: A longitudinal study of semi-supercentenarians. EBioMedicine 2015, 2, 1549–1558. [Google Scholar] [CrossRef] [PubMed]
- Ferrucci, L.; Levine, M.E.; Kuo, P.L.; Simonsick, E.M. Time and the Metrics of Aging. Circ. Res. 2018, 123, 740–744. [Google Scholar] [CrossRef]
- Lee, H.J.; Alirzayeva, H.; Koyuncu, S.; Rueber, A.; Noormohammadi, A.; Vilchez, D. Cold temperature extends longevity and prevents disease-related protein aggregation through PA28γ-induced proteasomes. Nat. Aging 2023, 3, 546–566. [Google Scholar] [CrossRef]
- Geneva, I.I.; Cuzzo, B.; Fazili, T.; Javaid, W. Normal body temperature: A systematic review. Open Forum Infect. Dis. 2019, 6, ofz032. [Google Scholar] [CrossRef] [PubMed]
- Waalen, J.; Buxbaum, J.N. Is older colder or colder older? The association of age with body temperature in 18,630 individuals. J. Gerontol. A Boil. Sci. Med. Sci. 2011, 66, 487–492. [Google Scholar] [CrossRef] [PubMed]
- Simonsick, E.M.; Meier, H.C.S.; Shaffer, N.C.; Studenski, S.A.; Ferrucci, L. Basal body temperature as a biomarker of healthy aging. Age 2016, 38, 445–454. [Google Scholar] [CrossRef] [PubMed]
- Carrillo, A.E.; Flouris, A.D. Caloric restriction and longevity: Effects of reduced body temperature. Ageing Res. Rev. 2011, 10, 153–162. [Google Scholar] [CrossRef]
- Soare, A.; Cangemi, R.; Omodei, D.; Holloszy, J.O.; Fontana, L. Long-term calorie restriction, but not endurance exercise, lowers core body temperature in humans. Aging 2011, 3, 374–379. [Google Scholar] [CrossRef]
- Keil, G.; Cummings, E.; de Magalhães, J.P. Being cool: How body temperature influences ageing and longevity. Biogerontology 2015, 16, 383–397. [Google Scholar] [CrossRef] [PubMed]
- Dijk, D.J.; Duffy, J.F.; Riel, E.; Shanahan, T.L.; Czeisler, C.A. Ageing and the circadian and homeostatic regulation of human sleep during forced desynchrony of rest, melatonin and temperature rhythms. J. Physiol. 1999, 516, 611–627. [Google Scholar] [CrossRef]
- Obermeyer, Z.; Samra, J.K.; Mullainathan, S. Individual differences in normal body temperature: Longitudinal big data analysis of patient records. BMJ 2017, 359, j5468. [Google Scholar] [CrossRef] [PubMed]
- Bindu, B.; Bindra, A.; Rath, G. Temperature management under general anesthesia: Compulsion or option. J. Anaesthesiol. Clin. Pharmacol. 2017, 33, 306–316. [Google Scholar] [PubMed]
- Evans, S.S.; Repasky, E.A.; Fisher, D.T. Fever and the thermal regulation of immunity: The immune system feels the heat. Nat. Rev. Immunol. 2015, 15, 335–349. [Google Scholar] [CrossRef] [PubMed]
- Dinarello, C.A. Infection, fever, and exogenous and endogenous pyrogens: Some concepts have changed. J. Endotoxin Res. 2004, 10, 201–222. [Google Scholar] [PubMed]
- Ogoina, D. Fever, fever patterns and diseases called ‘fever’—A review. J. Infect. Public Health 2011, 4, 108–124. [Google Scholar] [CrossRef] [PubMed]
- Gomolin, I.H.; Aung, M.M.; Wolf-Klein, G.; Auerbach, C. Older is colder: Temperature range and variation in older people. J. Am. Geriatr. Soc. 2005, 53, 2170–2172. [Google Scholar] [CrossRef] [PubMed]
- Güneş, U.Y.; Zaybak, A. Does the body temperature change in older people? J. Clin. Nurs. 2008, 17, 2284–2287. [Google Scholar] [CrossRef] [PubMed]
- Falk, B.; Bar-Or, O.; Smolander, J.; Frost, O. Response to rest and exercise in the cold: Effects of age and aerobic fitness. J. Appl. Physiol. 1994, 76, 72–78. [Google Scholar] [CrossRef]
- Thompson, C.S.; Kenney, W.L. Altered neurotransmitter control of reflex vasoconstriction in aged human skin. J. Physiol. 2004, 558, 697–704. [Google Scholar] [CrossRef]
- Franceschi, C.; Garagnani, P.; Parini, P.; Giuliani, C.; Santoro, A. Inflammaging: A new immune-metabolic viewpoint for age-related diseases. Nat. Rev. Endocrinol. 2018, 14, 576–590. [Google Scholar] [CrossRef]
- López-Otín, C.; Blasco, M.A.; Partridge, L.; Serrano, M.; Kroemer, G. Hallmarks of aging: An expanding universe. Cell 2023, 186, 243–278. [Google Scholar] [CrossRef] [PubMed]
- de Luca, C.; Olefsky, J.M. Inflammation and insulin resistance. FEBS Lett. 2008, 582, 97–105. [Google Scholar] [CrossRef]
- Fairweather, D.; Rose, N.R. Women and autoimmune diseases. Emerg. Infect. Dis. 2004, 10, 2005–2011. [Google Scholar] [CrossRef] [PubMed]
- Dolgin, E. Why autoimmune disease is more common in women: X chromosome holds clues. Nature 2024, 626, 466. [Google Scholar] [CrossRef] [PubMed]
- Chmielewski, P.; Borysławski, K.; Chmielowiec, K.; Chmielowiec, J. Longitudinal and cross-sectional changes with age in selected anthropometric and physiological traits in hospitalized adults: An insight from the Polish Longitudinal Study of Aging (PLSA). Anthr. Rev. 2015, 78, 317–336. [Google Scholar] [CrossRef]
- Chmielewski, P.P.; Borysławski, K.; Chmielowiec, K.; Chmielowiec, J.; Strzelec, B. The association between total leukocyte count and longevity: Evidence from longitudinal and cross-sectional data. Ann. Anat. 2016, 204, 1–10. [Google Scholar] [CrossRef] [PubMed]
- Bhaskaran, K.; Dos-Santos-Silva, I.; Leon, D.A.; Douglas, I.J.; Smeeth, L. Association of BMI with overall and cause-specific mortality: A population-based cohort study of 3·6 million adults in the UK. Lancet Diabetes Endocrinol. 2018, 6, 944–953. [Google Scholar] [CrossRef] [PubMed]
- Horsburgh, C.R., Jr.; Rubin, E.J. Clinical practice. Latent tuberculosis infection in the United States. N. Engl. J. Med. 2011, 364, 1441–1448. [Google Scholar] [CrossRef] [PubMed]
- Tian, X.; Chen, J.; Wang, X.; Xiet, Y.; Zhalng, X.; Han, D.; Fu, H.; Yin, W.; Wu, N. Global, regional, and national HIV/AIDS disease burden levels and trends in 1990-2019: A systematic analysis for the global burden of disease 2019 study. Front. Public Health 2023, 11, 1068664. [Google Scholar] [CrossRef] [PubMed]
- El-Serag, H.B. Epidemiology of viral hepatitis and hepatocellular carcinoma. Gastroenterology 2012, 142, 1264–1273. [Google Scholar] [CrossRef]
- Conti, B. Considerations on temperature, longevity and aging. Cell. Mol. Life Sci. 2008, 65, 1626–1630. [Google Scholar] [CrossRef]
- Lee, I.M.; Shiroma, E.J.; Lobelo, F.; Puska, P.; Blair, S.N.; Katzmarzyk, P.T. Effect of physical inactivity on major non-communicable diseases worldwide: An analysis of burden of disease and life expectancy. Lancet 2012, 380, 219–229. [Google Scholar] [CrossRef]
- Cappuccio, F.P.; Cooper, D.; D’Elia, L.; Strazzullo, P.; Miller, M.A. Sleep duration predicts cardiovascular outcomes: A systematic review and meta-analysis of prospective studies. Eur. Heart J. 2011, 32, 1484–1492. [Google Scholar] [CrossRef] [PubMed]
- Speakman, J.R.; Mitchell, S.E. Caloric restriction. Mol. Asp. Med. 2011, 32, 159–221. [Google Scholar] [CrossRef] [PubMed]
- Whitlock, G.; Lewington, S.; Sherliker, P.; Clarke, R.; Emberson, J.; Halsey, J.; Qizilbash, N.; Collins, R.; Peto, R. Body-mass index and cause-specific mortality in 900,000 adults: Collaborative analyses of 57 prospective studies. Lancet 2009, 373, 1083–1096. [Google Scholar] [PubMed]
- Åström, D.O.; Forsberg, B.; Rocklöv, J. Heat wave impact on morbidity and mortality in the elderly population: A review of recent studies. Maturitas 2011, 69, 99–105. [Google Scholar] [CrossRef] [PubMed]
- Kowald, A.; Palmer, D.; Secci, R.; Fuellen, G. Healthy aging in times of extreme temperatures: Biomedical approaches. Aging Dis. 2024, 15, 601–611. [Google Scholar] [CrossRef] [PubMed]
- Landrigan, P.J.; Fuller, R.; Acosta, N.J.R.; Adeyi, O.; Arnold, R.; Basu, N.N.; Baldé, A.B.; Bertollini, R.; Bose-O’Reilly, S.; Boufford, J.I.; et al. The Lancet Commission on pollution and health. Lancet 2018, 391, 462–512. [Google Scholar] [CrossRef] [PubMed]
- Dixit, V.D.; Schaffer, E.M.; Pyle, R.S.; Collins, G.D.; Sakthivel, S.K.; Palaniappan, R.; Lillard, J.W.; Taub, D.D. Ghrelin inhibits leptin- and activation-induced proinflammatory cytokine expression by human monocytes and T cells. J. Clin. Investig. 2004, 114, 57–66. [Google Scholar] [CrossRef] [PubMed]
- Higami, Y.; Pugh, T.D.; Page, G.D.; Allison, D.B.; Prolla, T.A.; Weindruch, R. Adipose tissue energy metabolism: Altered gene expression profile of mice subjected to long-term caloric restriction. FASEB J. 2004, 18, 415–417. [Google Scholar] [CrossRef] [PubMed]
- Higami, Y.; Barger, J.L.; Page, G.P.; Allison, D.B.; Smith, S.R.; Prolla, T.A.; Weindruch, R. Energy restriction lowers the expression of genes linked to inflammation, the cytoskeleton, the extracellular matrix, and angiogenesis in mouse adipose tissue. J. Nutr. 2006, 136, 343–352. [Google Scholar] [CrossRef]
- Fontana, L.; Klein, S.; Holloszy, J.O.; Premachandra, B.N. Effect of long-term calorie restriction with adequate protein and micronutrients on thyroid hormones. J. Clin. Endocrinol. Metab. 2006, 91, 3232–3235. [Google Scholar] [CrossRef]
- Cangemi, R.; Friedmann, A.J.; Holloszy, J.O.; Fontana, L. Long-term effects of calorie restriction on serum sex-hormone concentrations in men. Aging Cell 2010, 9, 236–242. [Google Scholar] [CrossRef] [PubMed]
- Roth, G.S.; Lane, M.A.; Ingram, D.K.; Mattison, J.A.; Elahi, D.; Tobin, J.D. Biomarkers of caloric restriction may predict longevity in humans. Science 2002, 297, 811. [Google Scholar] [CrossRef] [PubMed]
- Demetrius, L. Caloric restriction, metabolic rate, and entropy. J. Gerontol. A Biol. Sci. Med. Sci. 2004, 59, B902–B915. [Google Scholar] [CrossRef] [PubMed]
- Chmielewski, P. Rethinking modern theories of ageing and their classification: The proximate mechanisms and the ultimate explanations. Anthropol. Rev. 2017, 80, 259–272. [Google Scholar] [CrossRef]
- Finkel, T.; Holbrook, N.J. Oxidants, oxidative stress and the biology of ageing. Nature 2000, 408, 239–247. [Google Scholar] [CrossRef]
- Busuttil, R.A.; Rubio, M.; Dollé, M.E.; Campisi, J.; Vijg, J. Oxygen accelerates the accumulation of mutations during the senescence and immortalization of murine cells in culture. Aging Cell 2003, 2, 287–294. [Google Scholar] [CrossRef]
- Passos, J.F.; von Zglinicki, T. Oxygen free radicals in cell senescence: Are they signal transducers? Free Radic. Res. 2006, 40, 1277–1283. [Google Scholar] [CrossRef]
- Lu, T.; Finkel, T. Free radicals and senescence. Exp. Cell Res. 2008, 314, 1918–1922. [Google Scholar] [CrossRef] [PubMed]
- Santos, A.L.; Sinha, S.; Lindner, A.B. The good, the bad, and the ugly of ROS: New insights on aging and aging-related diseases from eukaryotic and prokaryotic model organisms. Oxid. Med. Cell. Longev. 2018, 2018, 1941285. [Google Scholar] [CrossRef] [PubMed]
- Clement, M.V.; Luo, L. Organismal aging and oxidants beyond macromolecules damage. Proteomics 2020, 20, e1800400. [Google Scholar] [CrossRef]
- Juan, C.A.; Pérez de la Lastra, J.M.; Plou, F.J.; Pérez-Lebeña, E. The chemistry of reactive oxygen species (ROS) revisited: Outlining their role in biological macromolecules (DNA, lipids and proteins) and induced pathologies. Int. J. Mol. Sci. 2021, 22, 4642. [Google Scholar] [CrossRef]
- Shields, H.J.; Traa, A.; van Raamsdonk, J.M. Beneficial and detrimental effects of reactive oxygen species on lifespan: A comprehensive review of comparative and experimental studies. Front. Cell Dev. Biol. 2021, 9, 628157. [Google Scholar] [CrossRef] [PubMed]
- Speakman, J.R.; Król, E. Maximal heat dissipation capacity and hyperthermia risk: Neglected key factors in the ecology of endotherms. J. Anim. Ecol. 2010, 79, 726–746. [Google Scholar] [CrossRef]
- Aubert, G.; Lansdorp, P.M. Telomeres and aging. Physiol. Rev. 2008, 88, 557–579. [Google Scholar] [CrossRef] [PubMed]
- López-Otín, C.; Blasco, M.A.; Partridge, L.; Serrano, M.; Kroemer, G. The hallmarks of aging. Cell 2013, 153, 1194–1217. [Google Scholar] [CrossRef]
- Borghesan, M.; Hoogaars, W.M.H.; Varela-Eirin, M.; Talma, N.; Demaria, M. A senescence-centric view of aging: Implications for longevity and disease. Trends Cell Biol. 2020, 30, 777–791. [Google Scholar] [CrossRef] [PubMed]
- Mattson, M.P. Hormesis defined. Ageing Res. Rev. 2008, 7, 1–7. [Google Scholar] [CrossRef] [PubMed]
- Radak, Z.; Chung, H.Y.; Goto, S. Systemic adaptation to oxidative challenge induced by regular exercise. Free Radic. Biol. Med. 2008, 44, 153–159. [Google Scholar] [CrossRef] [PubMed]
- Maeda, M.; Mimori, K.; Suzuki, S.; Horiuchi, T.; Makino, N. Preventive and promotive effects of habitual hot spa-bathing on the elderly in Japan. Sci. Rep. 2018, 8, 33. [Google Scholar] [CrossRef]
- Takeda, M.; Nakamura, H.; Otsu, H.; Mimori, K.; Maeda, T.; Managi, S. Hot spring bathing practices have a positive effect on mental health in Japan. Heliyon 2023, 9, e19631. [Google Scholar] [CrossRef]
- Westerterp-Plantenga, M.S.; van Marken Lichtenbelt, W.D.; Strobbe, H.; Schrauwen, P. Energy metabolism in humans at a lowered ambient temperature. Eur. J. Clin. Nutr. 2002, 56, 288–296. [Google Scholar] [CrossRef] [PubMed]
- Cannon, B.; Nedergaard, J. Nonshivering thermogenesis and its adequate measurement in metabolic studies. J. Exp. Biol. 2011, 214, 242–253. [Google Scholar] [CrossRef]
- Jura, M.; Kozak, L.P. Obesity and related consequences to ageing. Age 2016, 38, 23. [Google Scholar] [CrossRef] [PubMed]
- De Lorenzo, A.; Martinoli, R.; Vaia, F.; Di Renzo, L. Normal weight obese (NWO) women: An evaluation of a candidate new syndrome. Nutr. Metab. Cardiovasc. Dis. 2006, 16, 513–523. [Google Scholar] [CrossRef] [PubMed]
- Clegg, A.; Young, J.; Iliffe, S.; Rikkert, M.O.; Rockwood, K. Frailty in elderly people. Lancet 2013, 381, 752–762. [Google Scholar] [CrossRef] [PubMed]
- Fried, L.P.; Xue, Q.L.; Cappola, A.R.; Ferrucci, L.; Chaves, P.; Varadhan, R.; Guralnik, J.M.; Leng, S.X.; Semba, R.D.; Walston, J.D.; et al. Nonlinear multisystem physiological dysregulation associated with frailty in older women: Implications for etiology and treatment. J. Gerontol. A Biol. Sci. Med. Sci. 2009, 64, 1049–1057. [Google Scholar] [CrossRef] [PubMed]
- Ruggiero, C.; Metter, E.J.; Melenovsky, V.; Cherubini, A.; Najjar, S.S.; Ble, A.; Senin, U.; Longo, D.L.; Ferrucci, L. High basal metabolic rate is a risk factor for mortality: The Baltimore Longitudinal Study of Aging. J. Gerontol. A Biol. Sci. Med. Sci. 2008, 63, 698–706. [Google Scholar] [CrossRef] [PubMed]
- Franceschi, C.; Garagnani, P.; Vitale, G.; Capri, M.; Salvioli, S. Inflammaging and ‘garb-aging’. Trends Endocrinol. Metab. 2017, 28, 199–212. [Google Scholar] [CrossRef] [PubMed]
- Taneja, S.; Mitnitski, A.B.; Rockwood, K.; Rutenberg, A.D. Dynamical network model for age-related health deficits and mortality. Phys. Rev. E 2016, 93, 022309. [Google Scholar] [CrossRef]
- Mitnitski, A.B.; Rutenberg, A.D.; Farrell, S.; Rockwood, K. Aging, frailty and complex networks. Biogerontology 2017, 18, 433–446. [Google Scholar] [CrossRef] [PubMed]
- Rutenberg, A.D.; Mitnitski, A.B.; Farrell, S.G.; Rockwood, K. Unifying aging and frailty through complex dynamical networks. Exp. Gerontol. 2018, 107, 126–129. [Google Scholar] [CrossRef]
- Howlett, S.E.; Rutenberg, A.D.; Rockwood, K. The degree of frailty as a translational measure of health in aging. Nat. Aging 2021, 1, 651–665. [Google Scholar] [CrossRef] [PubMed]


| Variable | Men (n = 68) | Women (n = 74) | t-Test | p-Value | ||
|---|---|---|---|---|---|---|
| Mean | SD | Mean | SD | |||
| Body height, cm | 169.7 | 6.7 | 157.1 | 7.2 | 11.1 | <0.001 |
| Body weight, kg | 66.4 | 8.9 | 61.7 | 11.6 | 2.7 | 0.009 |
| BMI | 23.0 | 2.7 | 25.0 | 4.4 | −3.3 | 0.001 |
| HR, bpm | 82.7 | 8.1 | 82.1 | 9.2 | 0.4 | 0.718 |
| Systolic BP, mmHg | 121.2 | 10.8 | 119.8 | 12.3 | 0.7 | 0.470 |
| Diastolic BP, mmHg | 76.3 | 6.8 | 75.8 | 8.0 | 0.4 | 0.702 |
| Leukocyte count, 103/μL | 6.8 | 1.5 | 6.3 | 2.0 | 1.5 | 0.135 |
| Monocytes, % | 2.0 | 1.7 | 2.3 | 2.4 | 0.7 | 0.500 |
| Granulocytes, % | 68.0 | 8.1 | 66.5 | 7.0 | 1.2 | 0.228 |
| Eosinophils, % | 3.3 | 2.5 | 3.3 | 2.5 | 0.1 | 0.953 |
| Lymphocytes, % | 30.6 | 8.1 | 31.8 | 6.8 | 1.0 | 0.317 |
| NLR | 2.3 | 1.2 | 2.0 | 0.7 | 1.6 | 0.110 |
| Body temperature, °C | 36.6 | 0.2 | 36.5 | 0.3 | 2.3 | 0.024 |
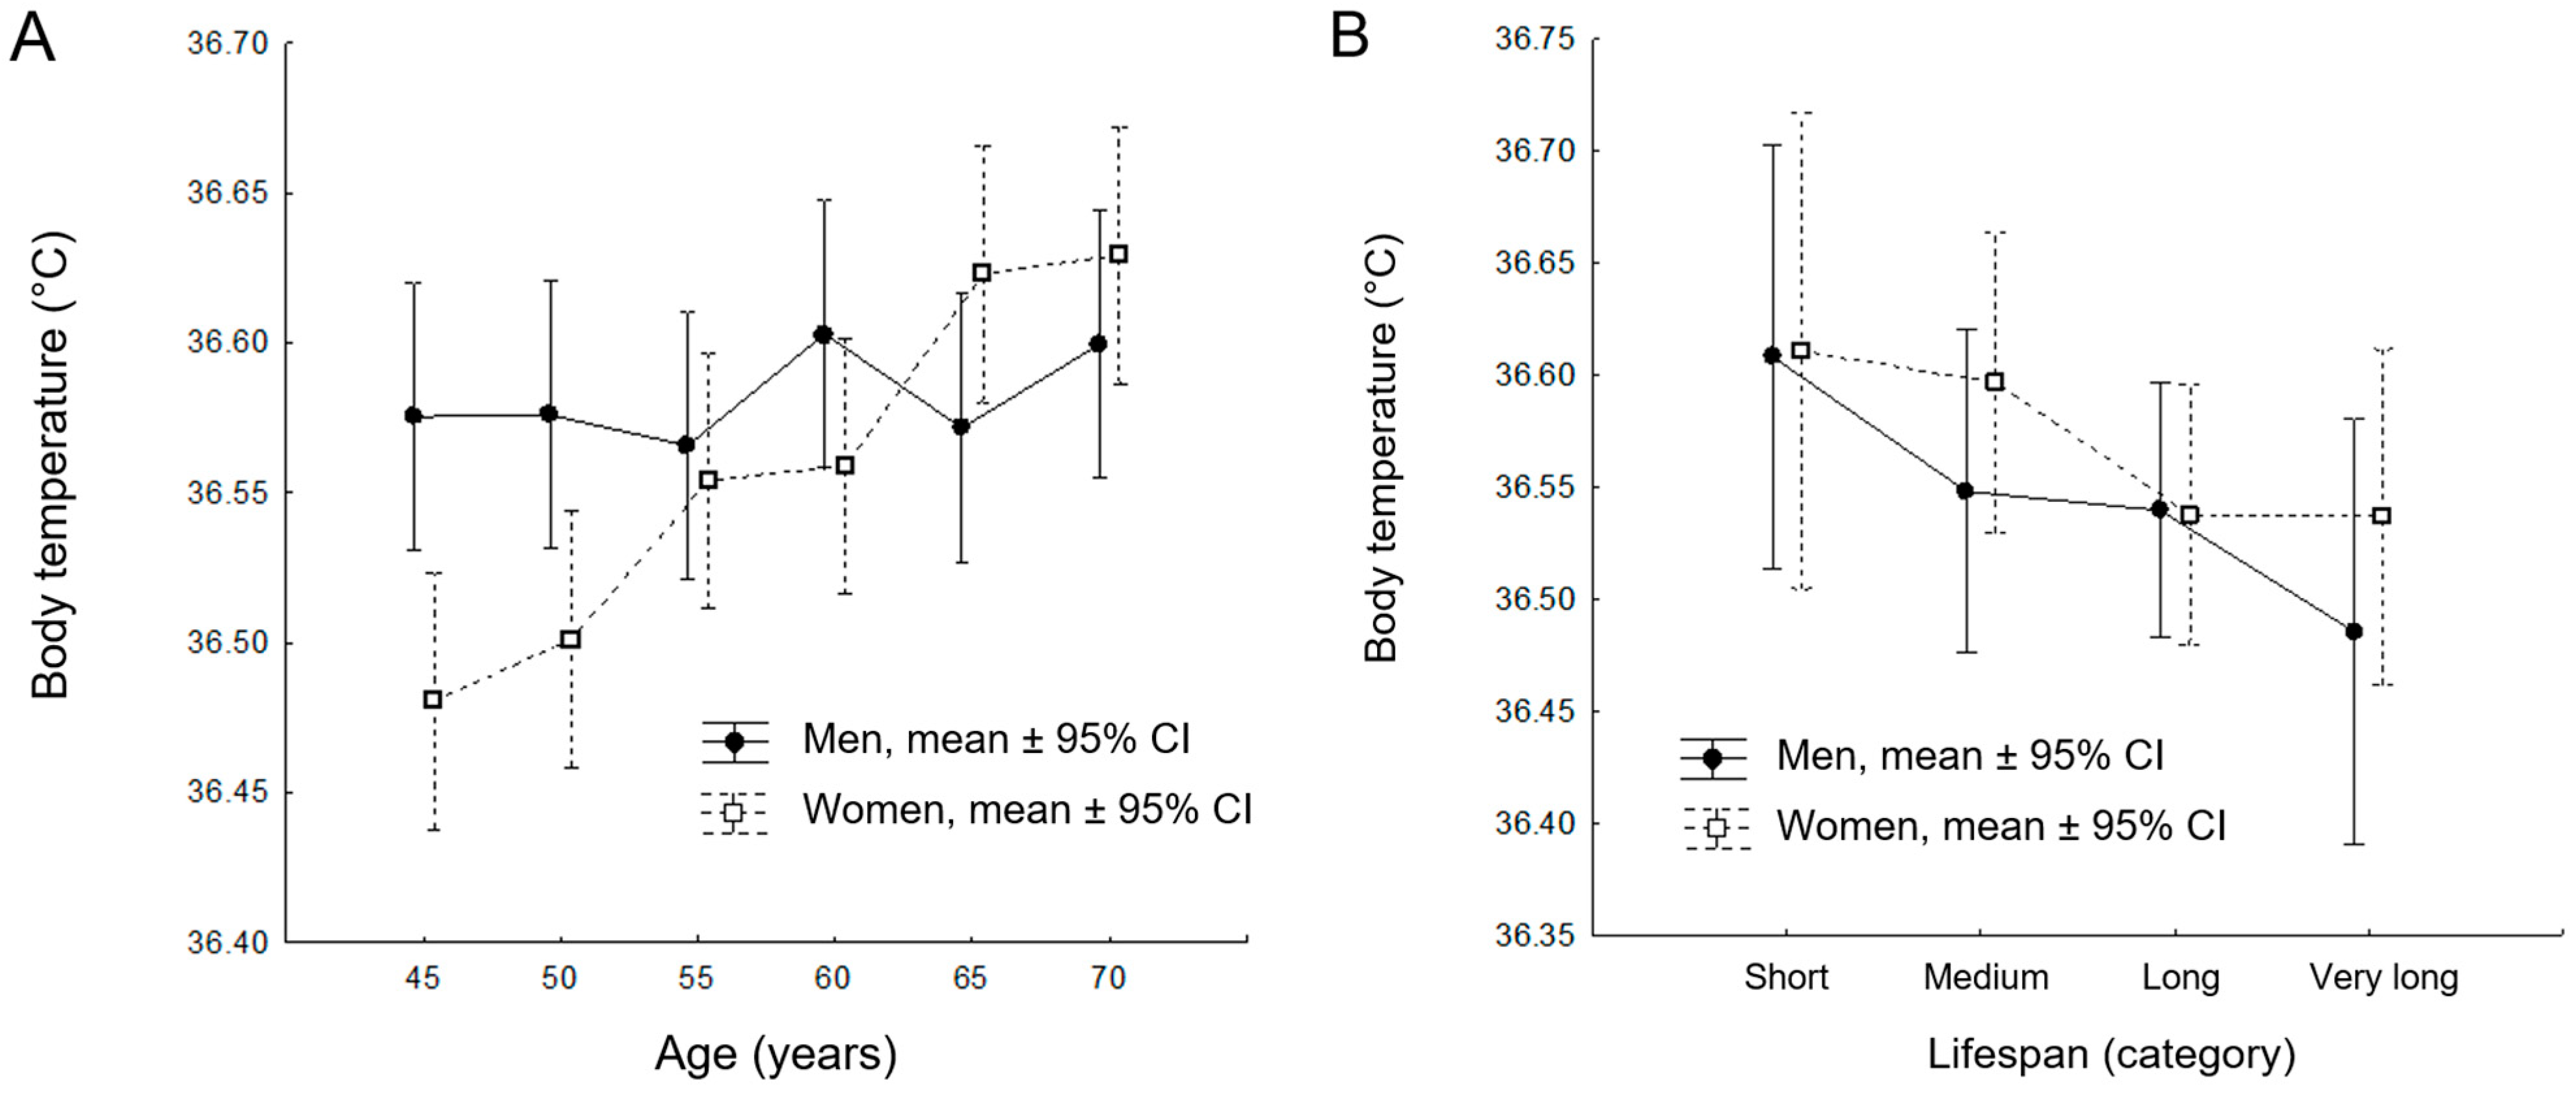
| Age | Men (n = 68) | Women (n = 74) | t-Test | p-Value | ||
|---|---|---|---|---|---|---|
| Mean | SD | Mean | SD | |||
| 45 | 36.58 | 0.21 | 36.48 | 0.27 | 2.29 | 0.024 |
| 50 | 36.58 | 0.17 | 36.50 | 0.19 | 2.49 | 0.014 |
| 55 | 36.57 | 0.18 | 36.55 | 0.17 | 0.40 | 0.687 |
| 60 | 36.60 | 0.16 | 36.56 | 0.15 | 1.71 | 0.090 |
| 65 | 36.57 | 0.15 | 36.62 | 0.17 | −1.91 | 0.058 |
| 70 | 36.60 | 0.19 | 36.63 | 0.20 | −0.90 | 0.367 |
| Category of Survival | Men (n = 113) | Women (n = 112) | t-Test | p-Value | ||||
|---|---|---|---|---|---|---|---|---|
| Mean | SD | n | Mean | SD | n | |||
| Short | 36.61 | 0.20 | 22 | 36.61 | 0.23 | 12 | 0.00 | 0.975 |
| Medium | 36.55 | 0.18 | 27 | 36.60 | 0.16 | 30 | 0.05 | 0.286 |
| Long | 36.54 | 0.17 | 49 | 36.54 | 0.20 | 40 | 0.00 | 0.961 |
| Very long | 36.49 | 0.21 | 15 | 36.54 | 0.19 | 30 | 0.05 | 0.437 |
| df | F | p | η2 | Power α = 0.05 | |
|---|---|---|---|---|---|
| Intercept | 1 | 324 × 105 | <0.001 | 0.999 | 1.000 |
| Age | 5 | 4.598 | <0.001 | 0.027 | 0.975 |
| Sex | 1 | 3.523 | 0.061 | 0.004 | 0.466 |
| Age × Sex | 5 | 3.381 | 0.005 | 0.020 | 0.906 |
| Error | 840 |
| Age/Sex | {1} 36.57 | {2} 36.48 | {3} 36.58 | {4} 36.50 | {5} 36.57 | {6} 36.55 | {7} 36.60 | {8} 36.56 | {9} 36.57 | {10} 36.62 | {11} 36.60 | {12} 36.63 |
|---|---|---|---|---|---|---|---|---|---|---|---|---|
| {1} 45/M | 0.003 | 0.987 | 0.018 | 0.763 | 0.496 | 0.391 | 0.598 | 0.906 | 0.131 | 0.455 | 0.088 | |
| {2} 45/F | 0.003 | 0.506 | 0.007 | 0.017 | 0.000 | 0.011 | 0.004 | 0.000 | 0.000 | 0.000 | ||
| {3} 50/M | 0.017 | 0.751 | 0.486 | 0.400 | 0.587 | 0.894 | 0.135 | 0.464 | 0.091 | |||
| {4} 50/F | 0.040 | 0.086 | 0.001 | 0.061 | 0.025 | 0.000 | 0.002 | 0.000 | ||||
| {5) 55/M | 0.709 | 0.246 | 0.826 | 0.854 | 0.069 | 0.294 | 0.044 | |||||
| {6} 55/F | 0.120 | 0.875 | 0.575 | 0.025 | 0.149 | 0.015 | ||||||
| {7} 60/M | 0.161 | 0.329 | 0.525 | 0.912 | 0.406 | |||||||
| {8} 60/F | 0.684 | 0.038 | 0.197 | 0.023 | ||||||||
| {9} 65/M | 0.103 | 0.387 | 0.068 | |||||||||
| {10} 65/F | 0.454 | 0.842 | ||||||||||
| {11} 70/M | 0.345 | |||||||||||
| {12} 70/F |
| df | F | p | η2 | Power α = 0.05 | |
|---|---|---|---|---|---|
| Intercept | 1 | 651 × 104 | <0.001 | 0.999 | 1.000 |
| Age | 3 | 1.804 | 0.148 | 0.027 | 0.465 |
| Sex | 1 | 0.768 | 0.382 | 0.004 | 0.141 |
| Age × Sex | 3 | 0.307 | 0.820 | 0.005 | 0.109 |
| Error | 196 |
| Age/Sex | {1} 36.61 | {2} 36.61 | {3} 36.55 | {4} 36.60 | {5} 36.54 | {6} 36.54 | {7} 36.49 | {8} 36.54 |
|---|---|---|---|---|---|---|---|---|
| {1} 53/M | 0.971 | 0.320 | 0.844 | 0.223 | 0.213 | 0.073 | 0.245 | |
| {2} 53/F | 0.335 | 0.823 | 0.244 | 0.234 | 0.084 | 0.261 | ||
| {3} 63/M | 0.331 | 0.857 | 0.826 | 0.301 | 0.829 | |||
| {4} 63/F | 0.202 | 0.192 | 0.061 | 0.241 | ||||
| {5} 68/M | 0.962 | 0.334 | 0.949 | |||||
| {6} 68/F | 0.355 | 0.983 | ||||||
| {7} >76/M | 0.405 | |||||||
| {8} >76/F |
Disclaimer/Publisher’s Note: The statements, opinions and data contained in all publications are solely those of the individual author(s) and contributor(s) and not of MDPI and/or the editor(s). MDPI and/or the editor(s) disclaim responsibility for any injury to people or property resulting from any ideas, methods, instructions or products referred to in the content. |
© 2025 by the authors. Licensee MDPI, Basel, Switzerland. This article is an open access article distributed under the terms and conditions of the Creative Commons Attribution (CC BY) license (https://creativecommons.org/licenses/by/4.0/).
Share and Cite
Chmielewski, P.P.; Strzelec, B.; Data, K.; Chmielowiec, K.; Mozdziak, P.; Kempisty, B. Resting Body Temperature and Long-Term Survival in Older Adults at a Mental Health Center: Cross-Sectional and Longitudinal Data. J. Clin. Med. 2025, 14, 713. https://doi.org/10.3390/jcm14030713
Chmielewski PP, Strzelec B, Data K, Chmielowiec K, Mozdziak P, Kempisty B. Resting Body Temperature and Long-Term Survival in Older Adults at a Mental Health Center: Cross-Sectional and Longitudinal Data. Journal of Clinical Medicine. 2025; 14(3):713. https://doi.org/10.3390/jcm14030713
Chicago/Turabian StyleChmielewski, Piotr Paweł, Bartłomiej Strzelec, Krzysztof Data, Krzysztof Chmielowiec, Paul Mozdziak, and Bartosz Kempisty. 2025. "Resting Body Temperature and Long-Term Survival in Older Adults at a Mental Health Center: Cross-Sectional and Longitudinal Data" Journal of Clinical Medicine 14, no. 3: 713. https://doi.org/10.3390/jcm14030713
APA StyleChmielewski, P. P., Strzelec, B., Data, K., Chmielowiec, K., Mozdziak, P., & Kempisty, B. (2025). Resting Body Temperature and Long-Term Survival in Older Adults at a Mental Health Center: Cross-Sectional and Longitudinal Data. Journal of Clinical Medicine, 14(3), 713. https://doi.org/10.3390/jcm14030713