Author Contributions
Conceptualization, K.A. and D.P.; Methodology, K.A., J.A. and D.P.; Software, J.A. and A.V.; Validation, K.A., J.A. and A.V.; Formal Analysis, J.A. and A.V.; Investigation, K.A. and J.A.; Resources, K.A. and A.V.; Data curation, J.A. and A.V.; Writing—original draft preparation, J.A.; Writing—review and editing, K.A., A.V., J.A. and D.P.; Visualization, A.V., Supervision, K.A. and D.P.; Project administration, K.A.; Funding acquisition, K.A. All authors have read and agreed to the published version of the manuscript.
Figure 1.
PPR formula used in analysis.
Figure 1.
PPR formula used in analysis.
Figure 2.
PRISMA flow diagram demonstrating number of clinical trials included and excluded.
Figure 2.
PRISMA flow diagram demonstrating number of clinical trials included and excluded.
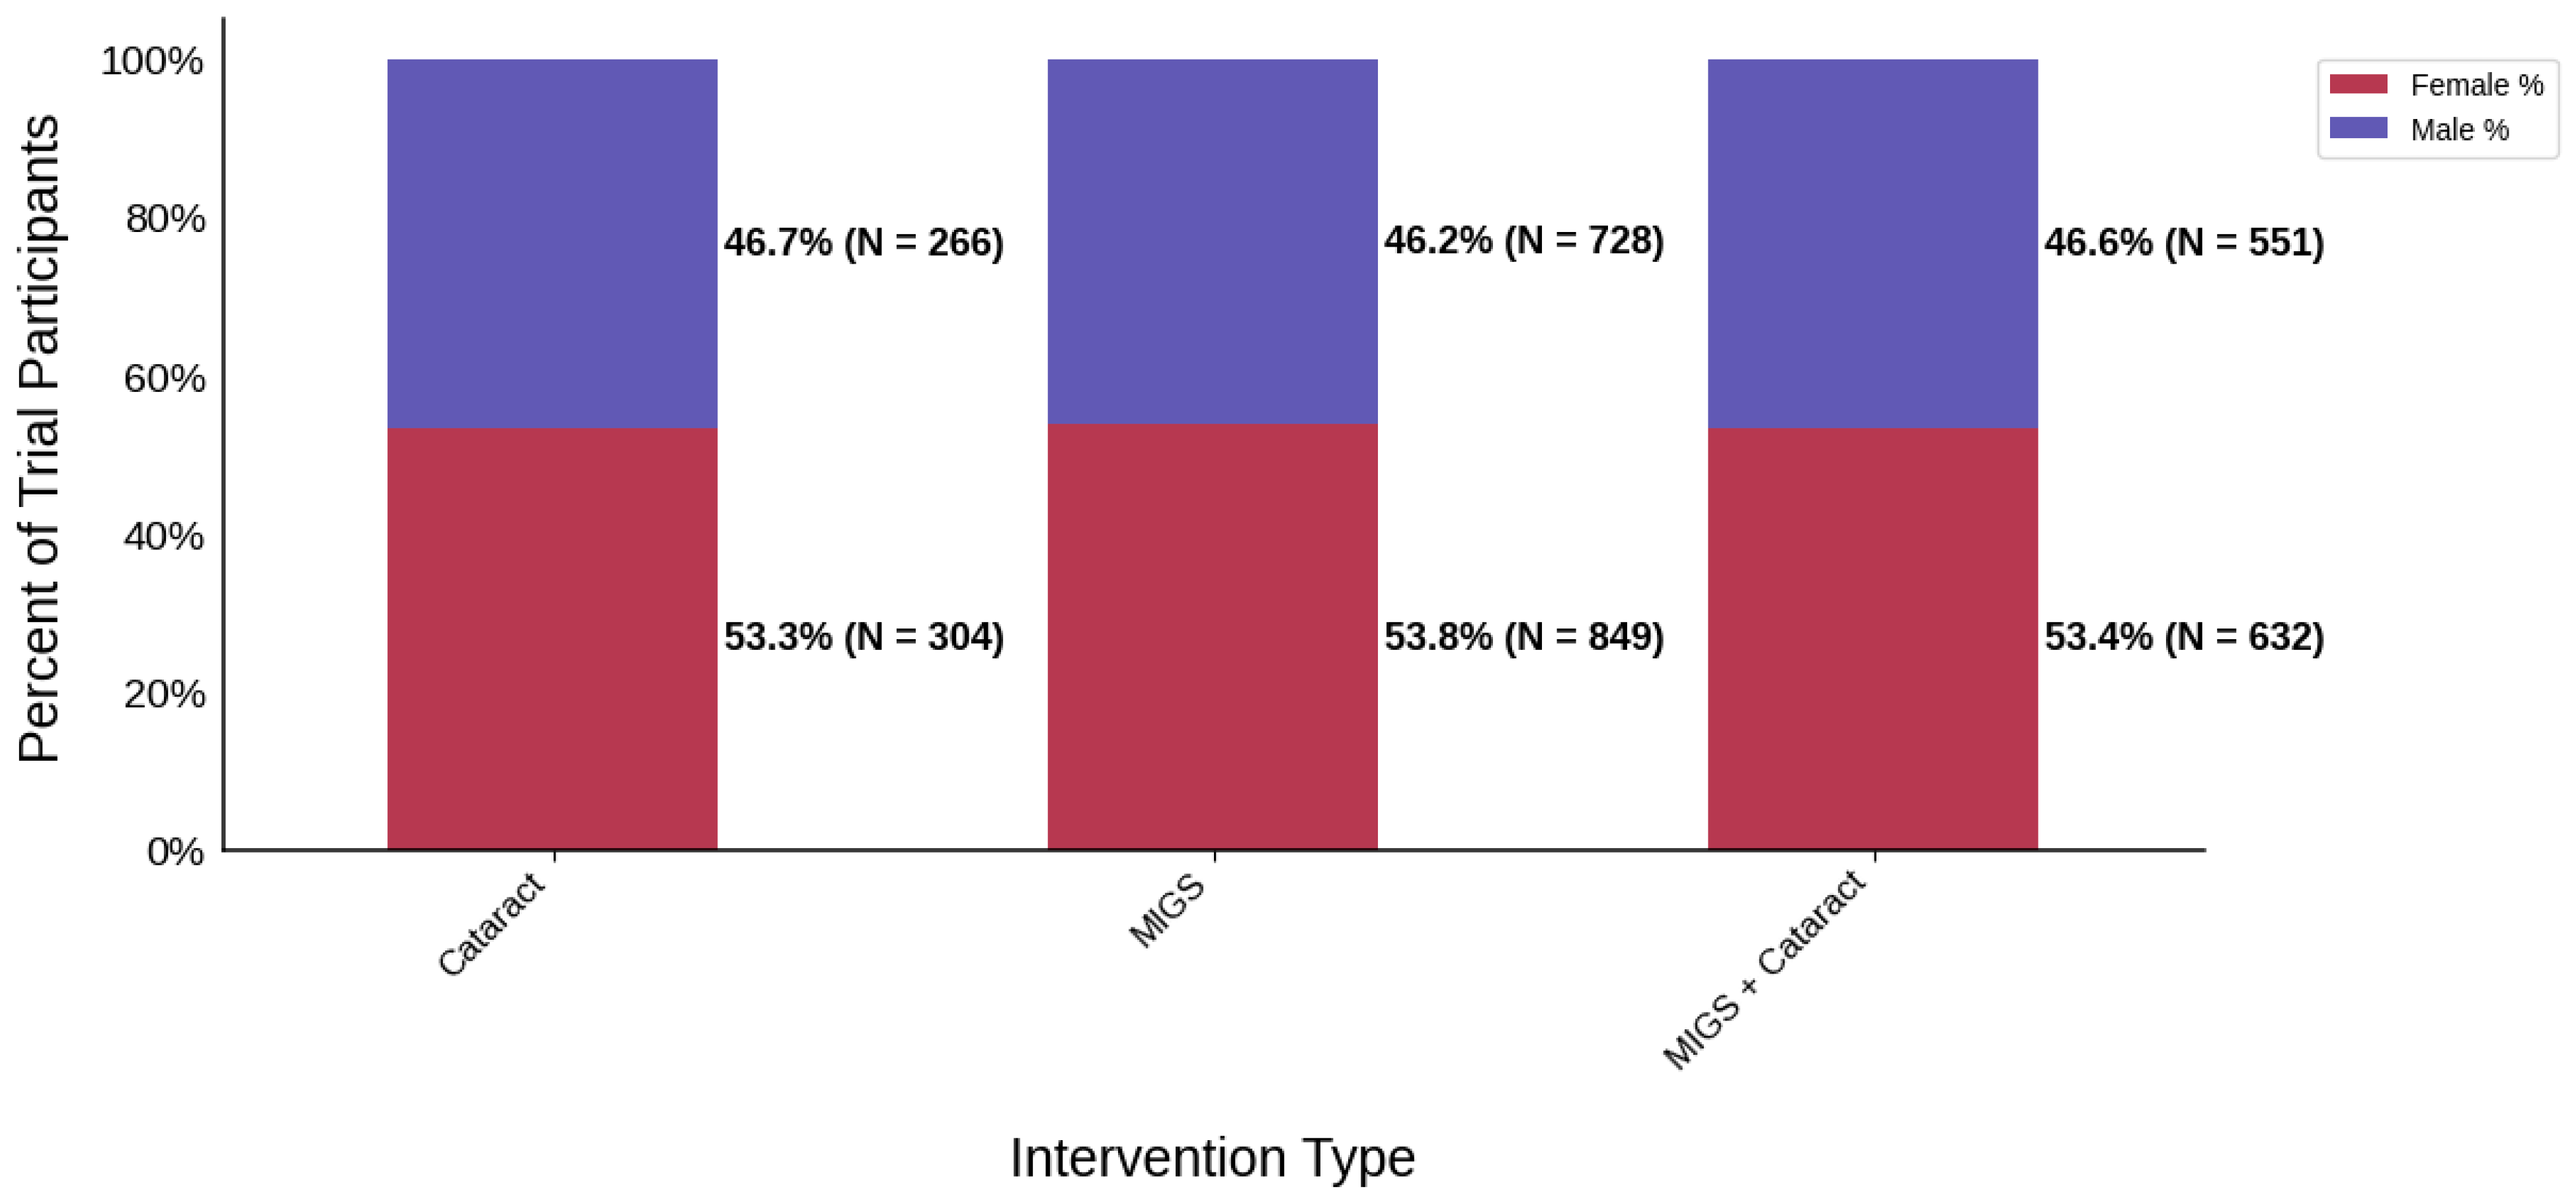
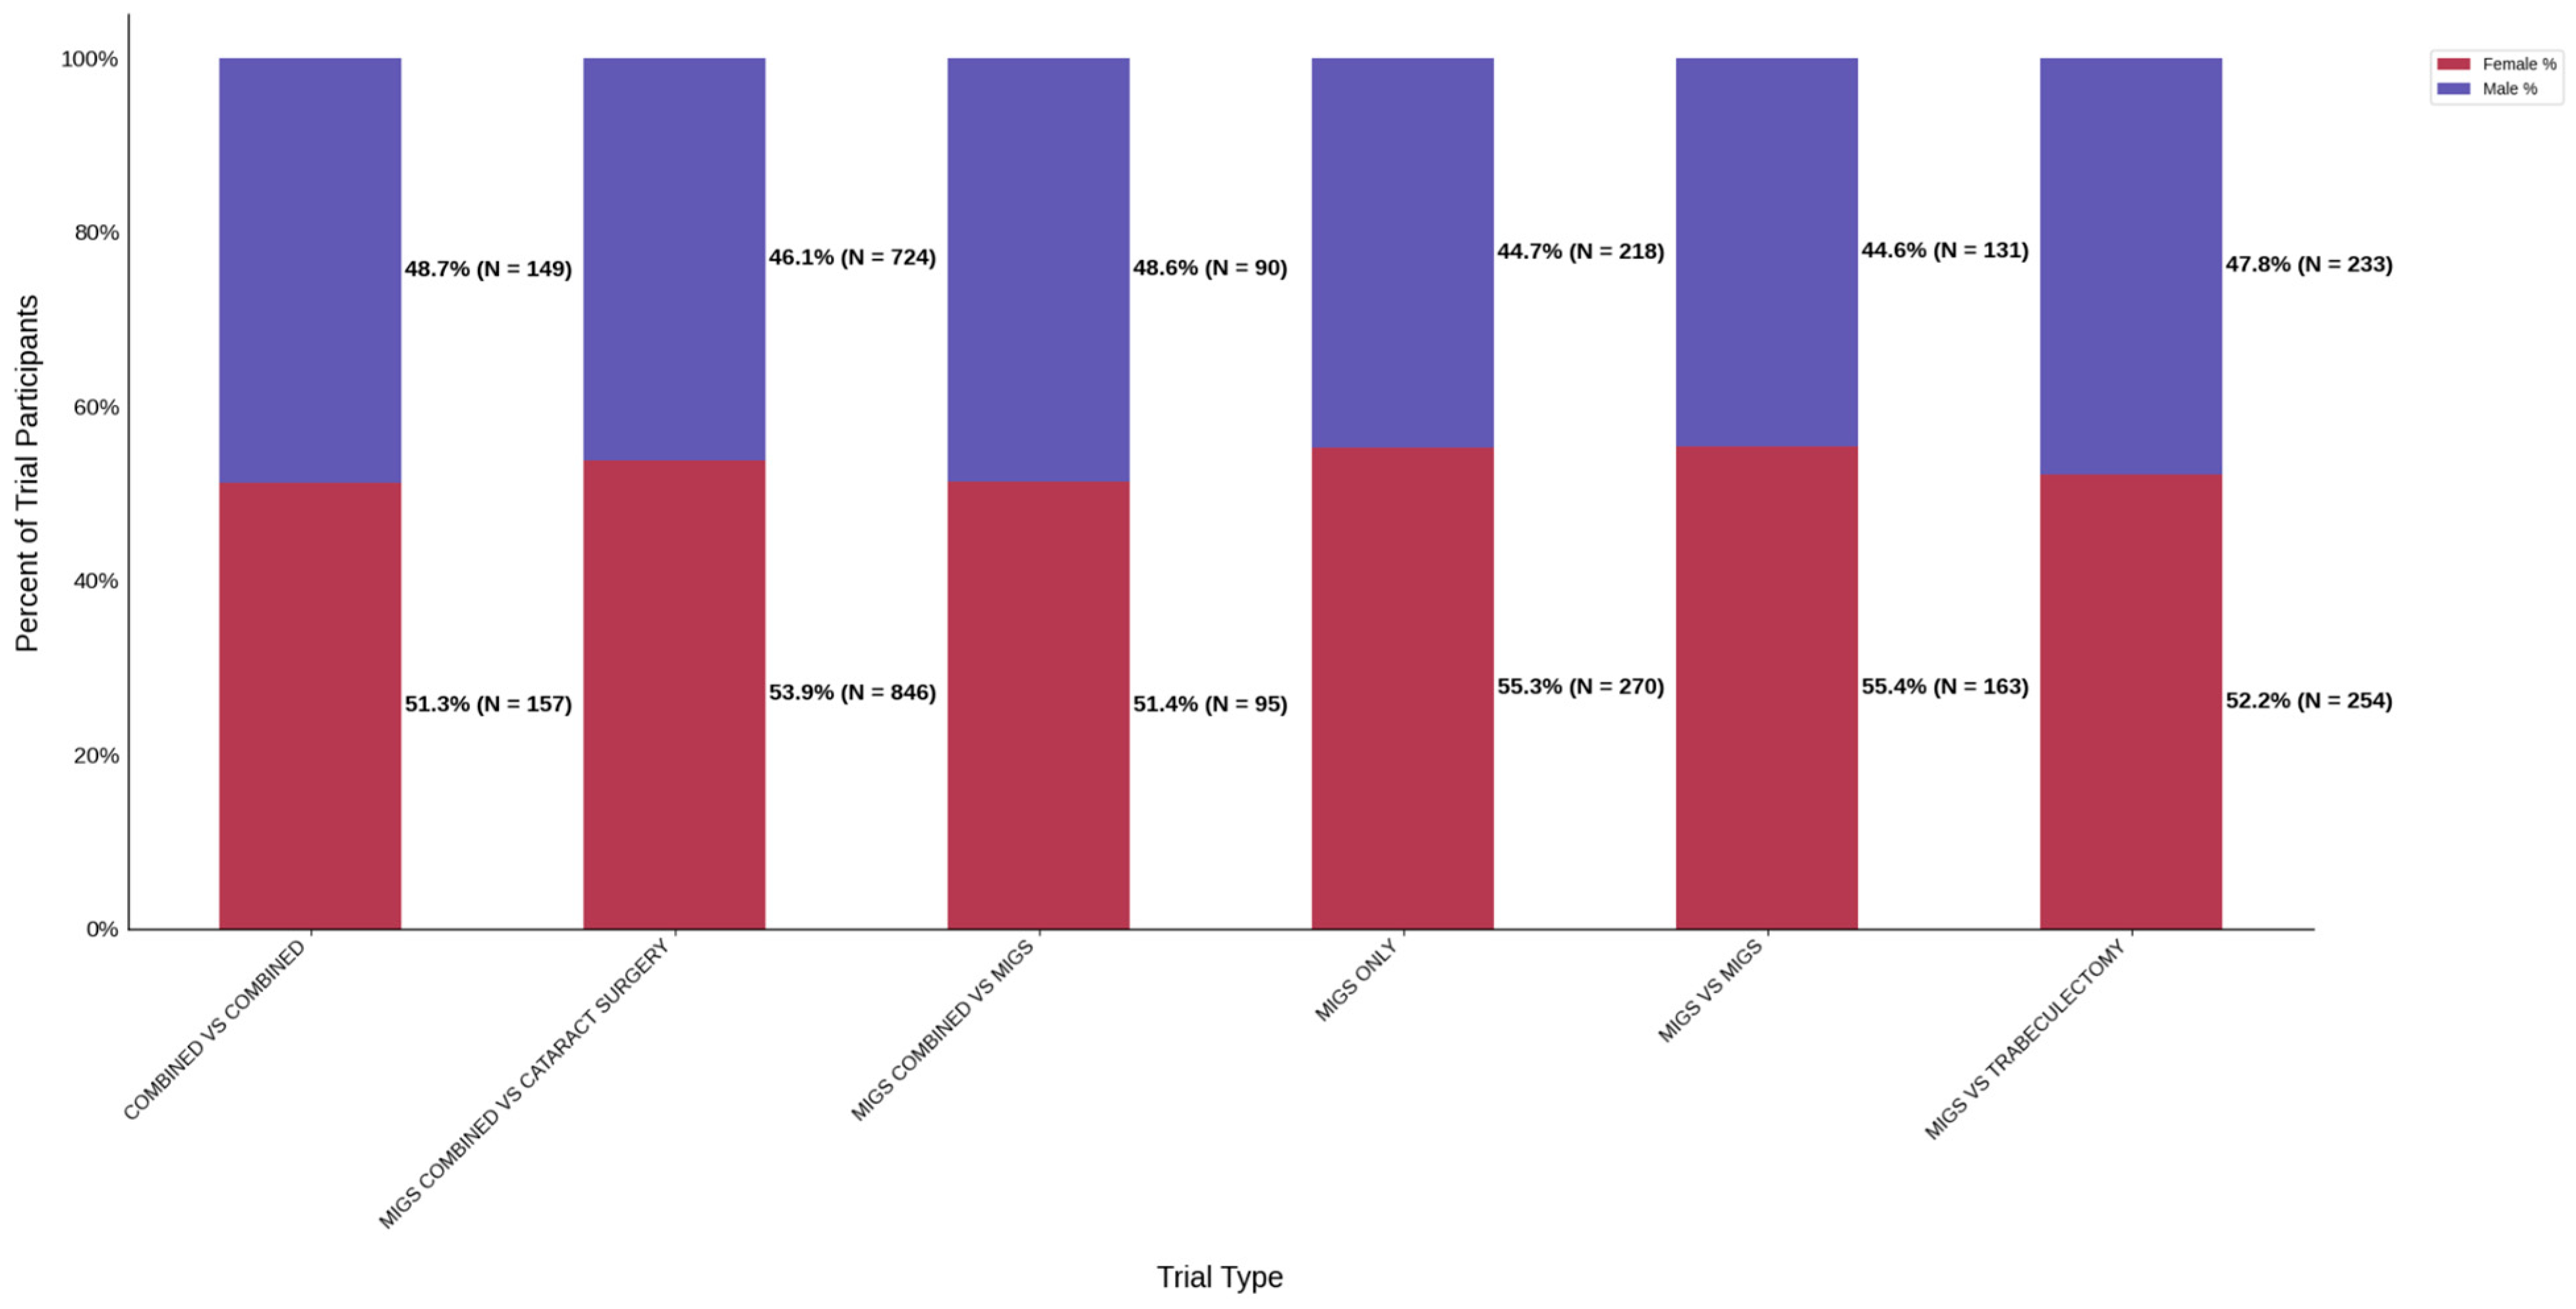
Figure 3.
Distribution of trial participants by sex. The stacked bar chart displays the percentage of male and female participants within each intervention group.
Figure 3.
Distribution of trial participants by sex. The stacked bar chart displays the percentage of male and female participants within each intervention group.
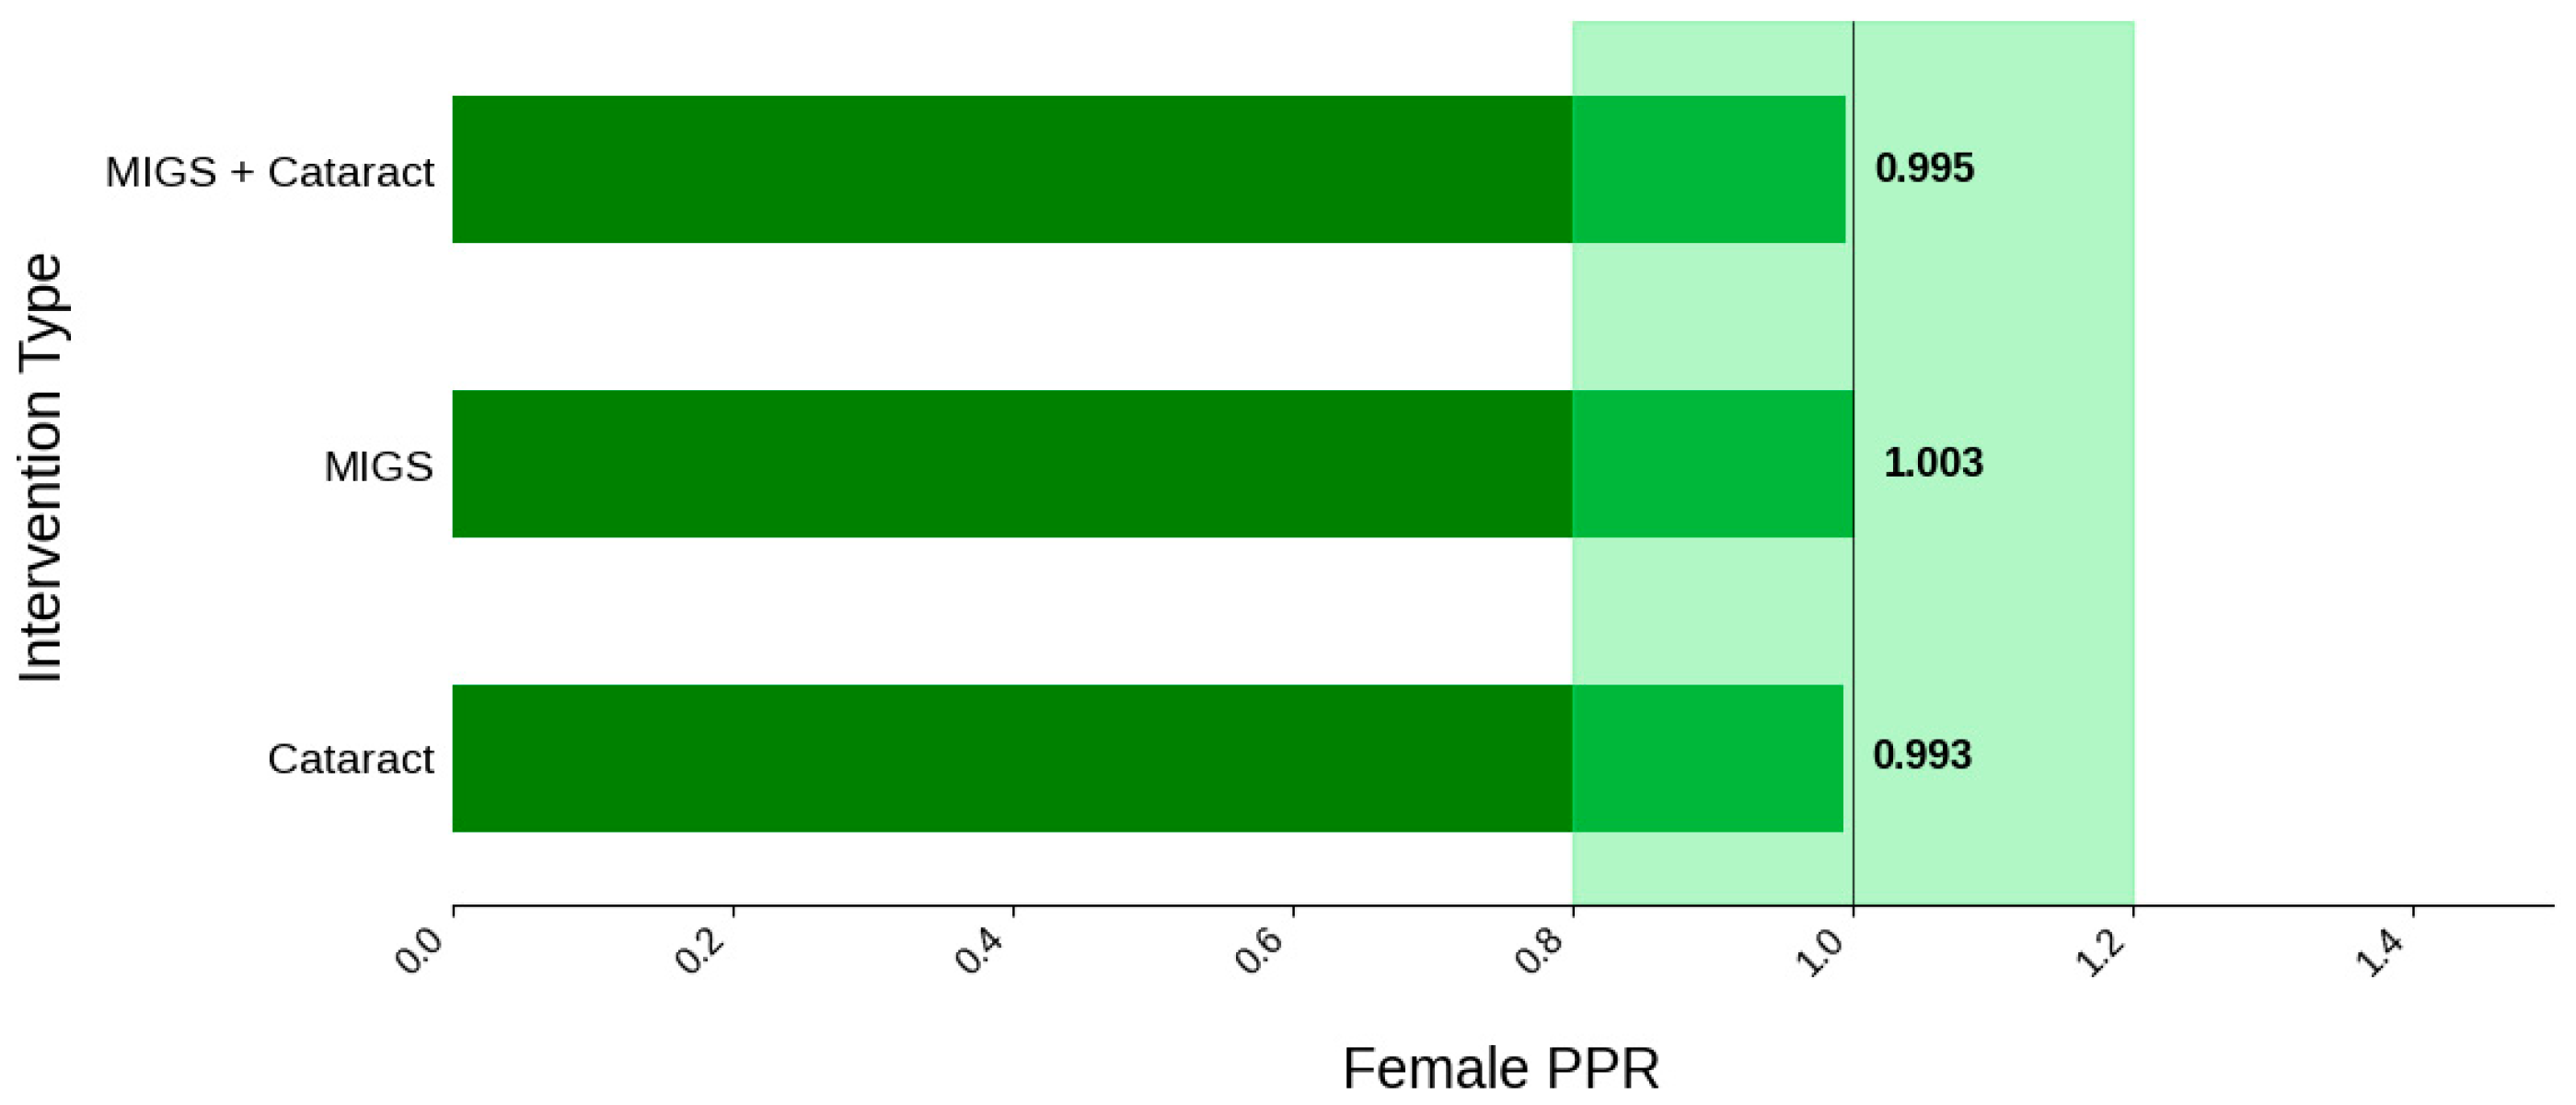
Figure 4.
Female PPR. The Figure displays the ratio of female participation compared to the estimated prevalence by intervention group. The shaded area corresponds to a ratio of 0.8 to 1.2, which is considered an adequate representation. A ratio that is lower or higher than this range indicates an under-representation or over-representation, respectively. The green bars correspond to a PPR value that is adequately represented.
Figure 5.
Racial distribution of trial participants. The stacked bar chart illustrates the percentage of participants by racial category within each intervention group.
Figure 5.
Racial distribution of trial participants. The stacked bar chart illustrates the percentage of participants by racial category within each intervention group.
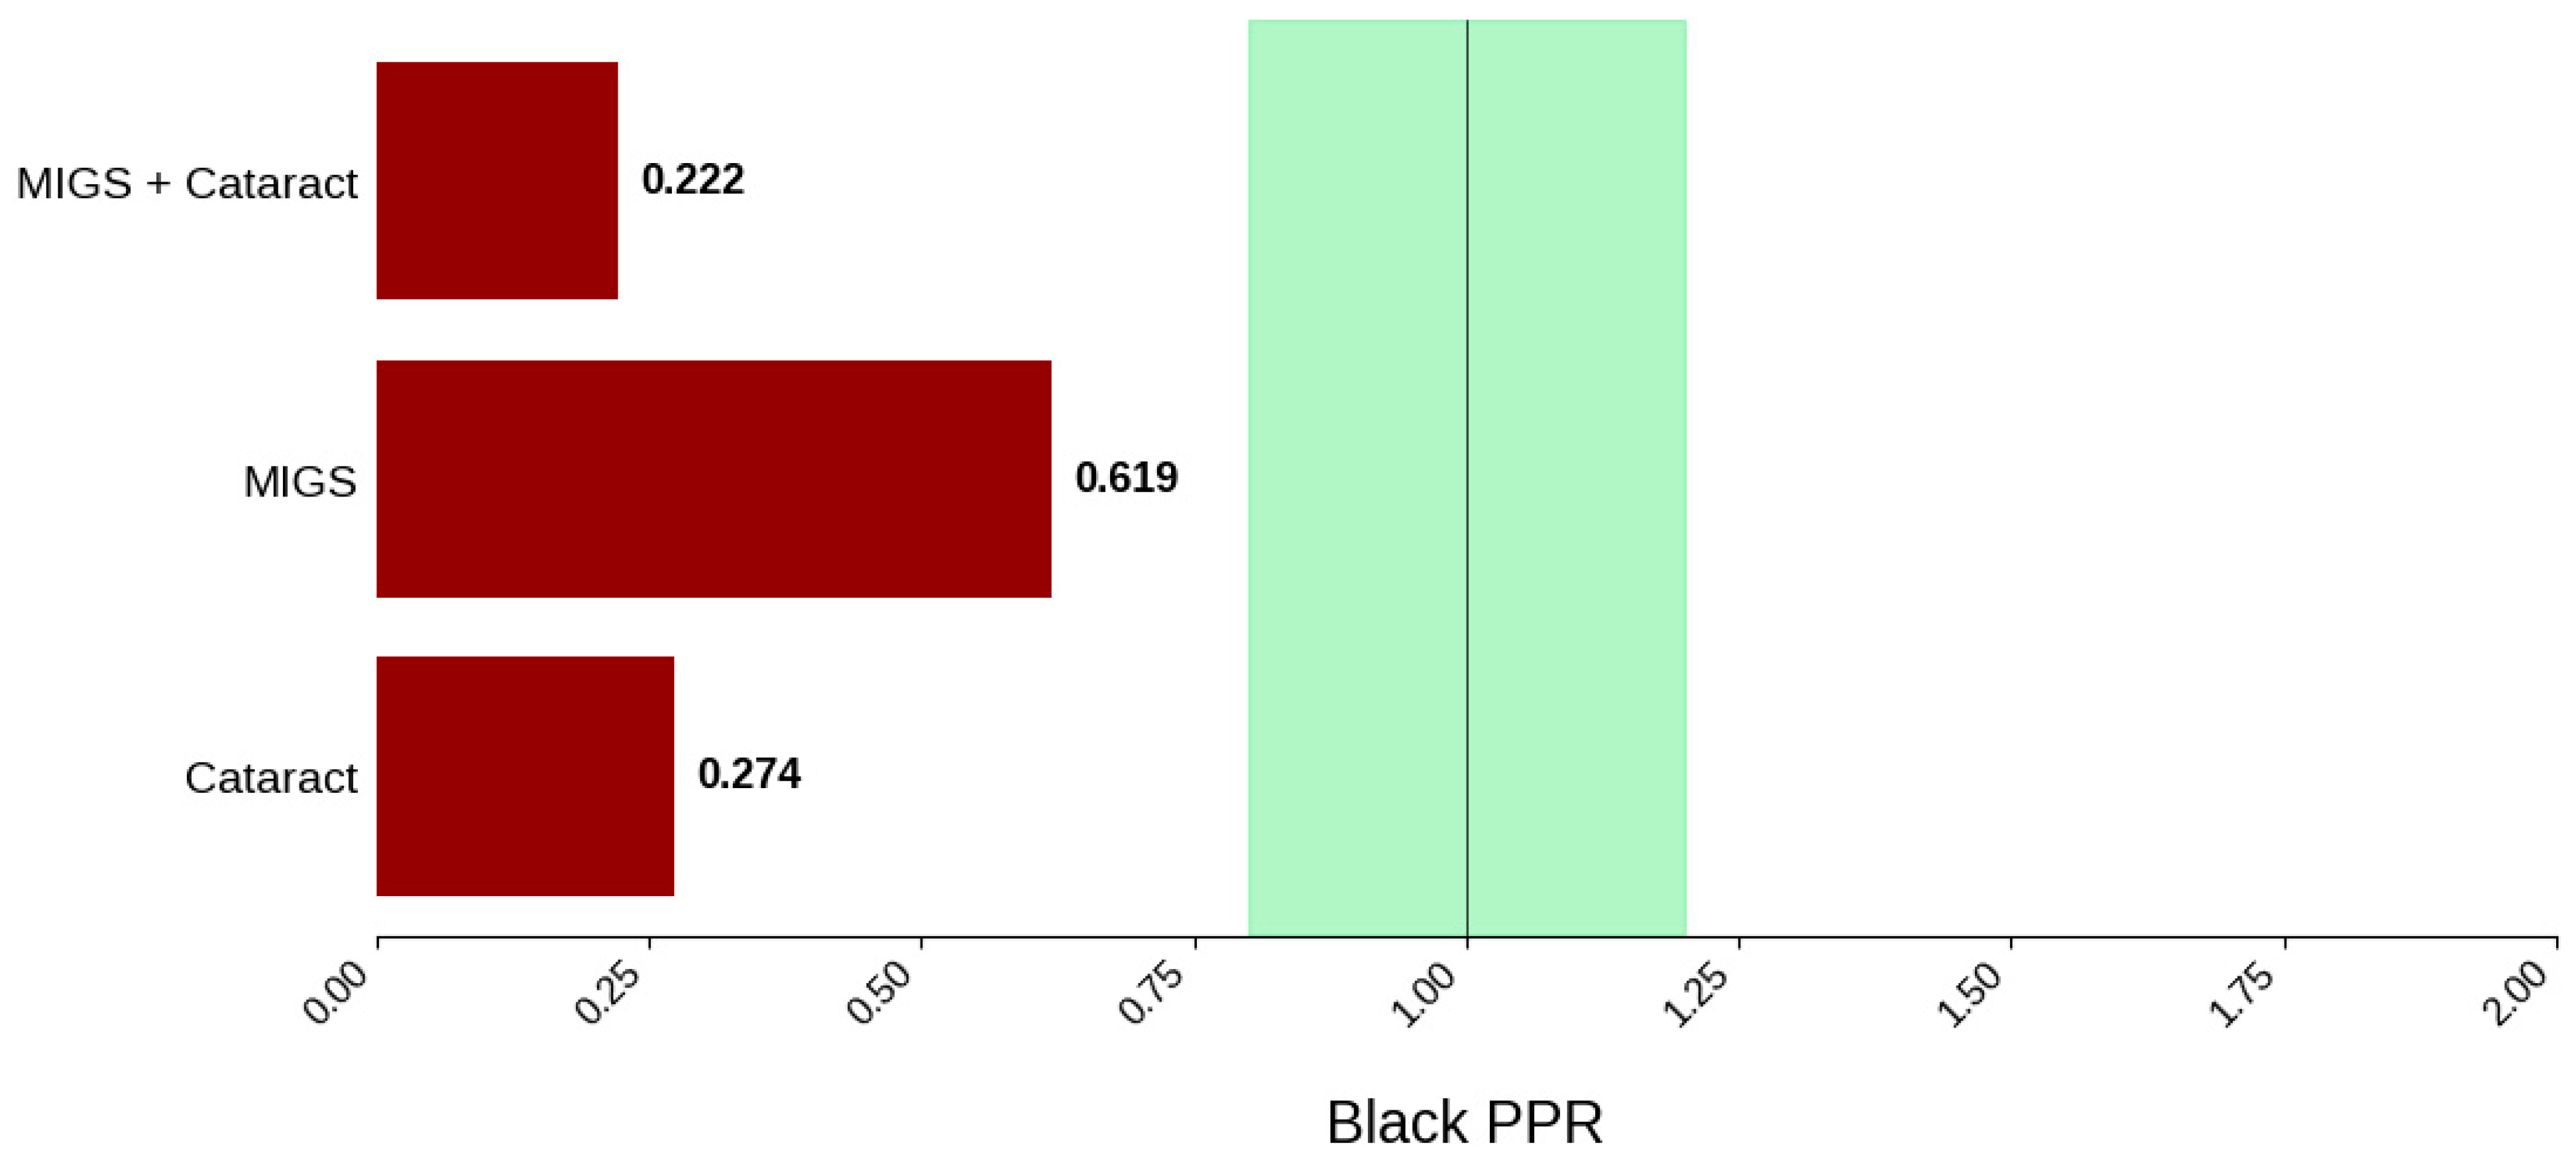
Figure 6.
Black PPR. The Figure displays the ratio of Black participation compared to the estimated prevalence by intervention group. The shaded area corresponds to a ratio of 0.8 to 1.2, which is considered adequate representation. A ratio that is lower or higher than this range indicates an under-representation or over-representation, respectively. A red bar corresponds to a PPR value that is under or over-represented.
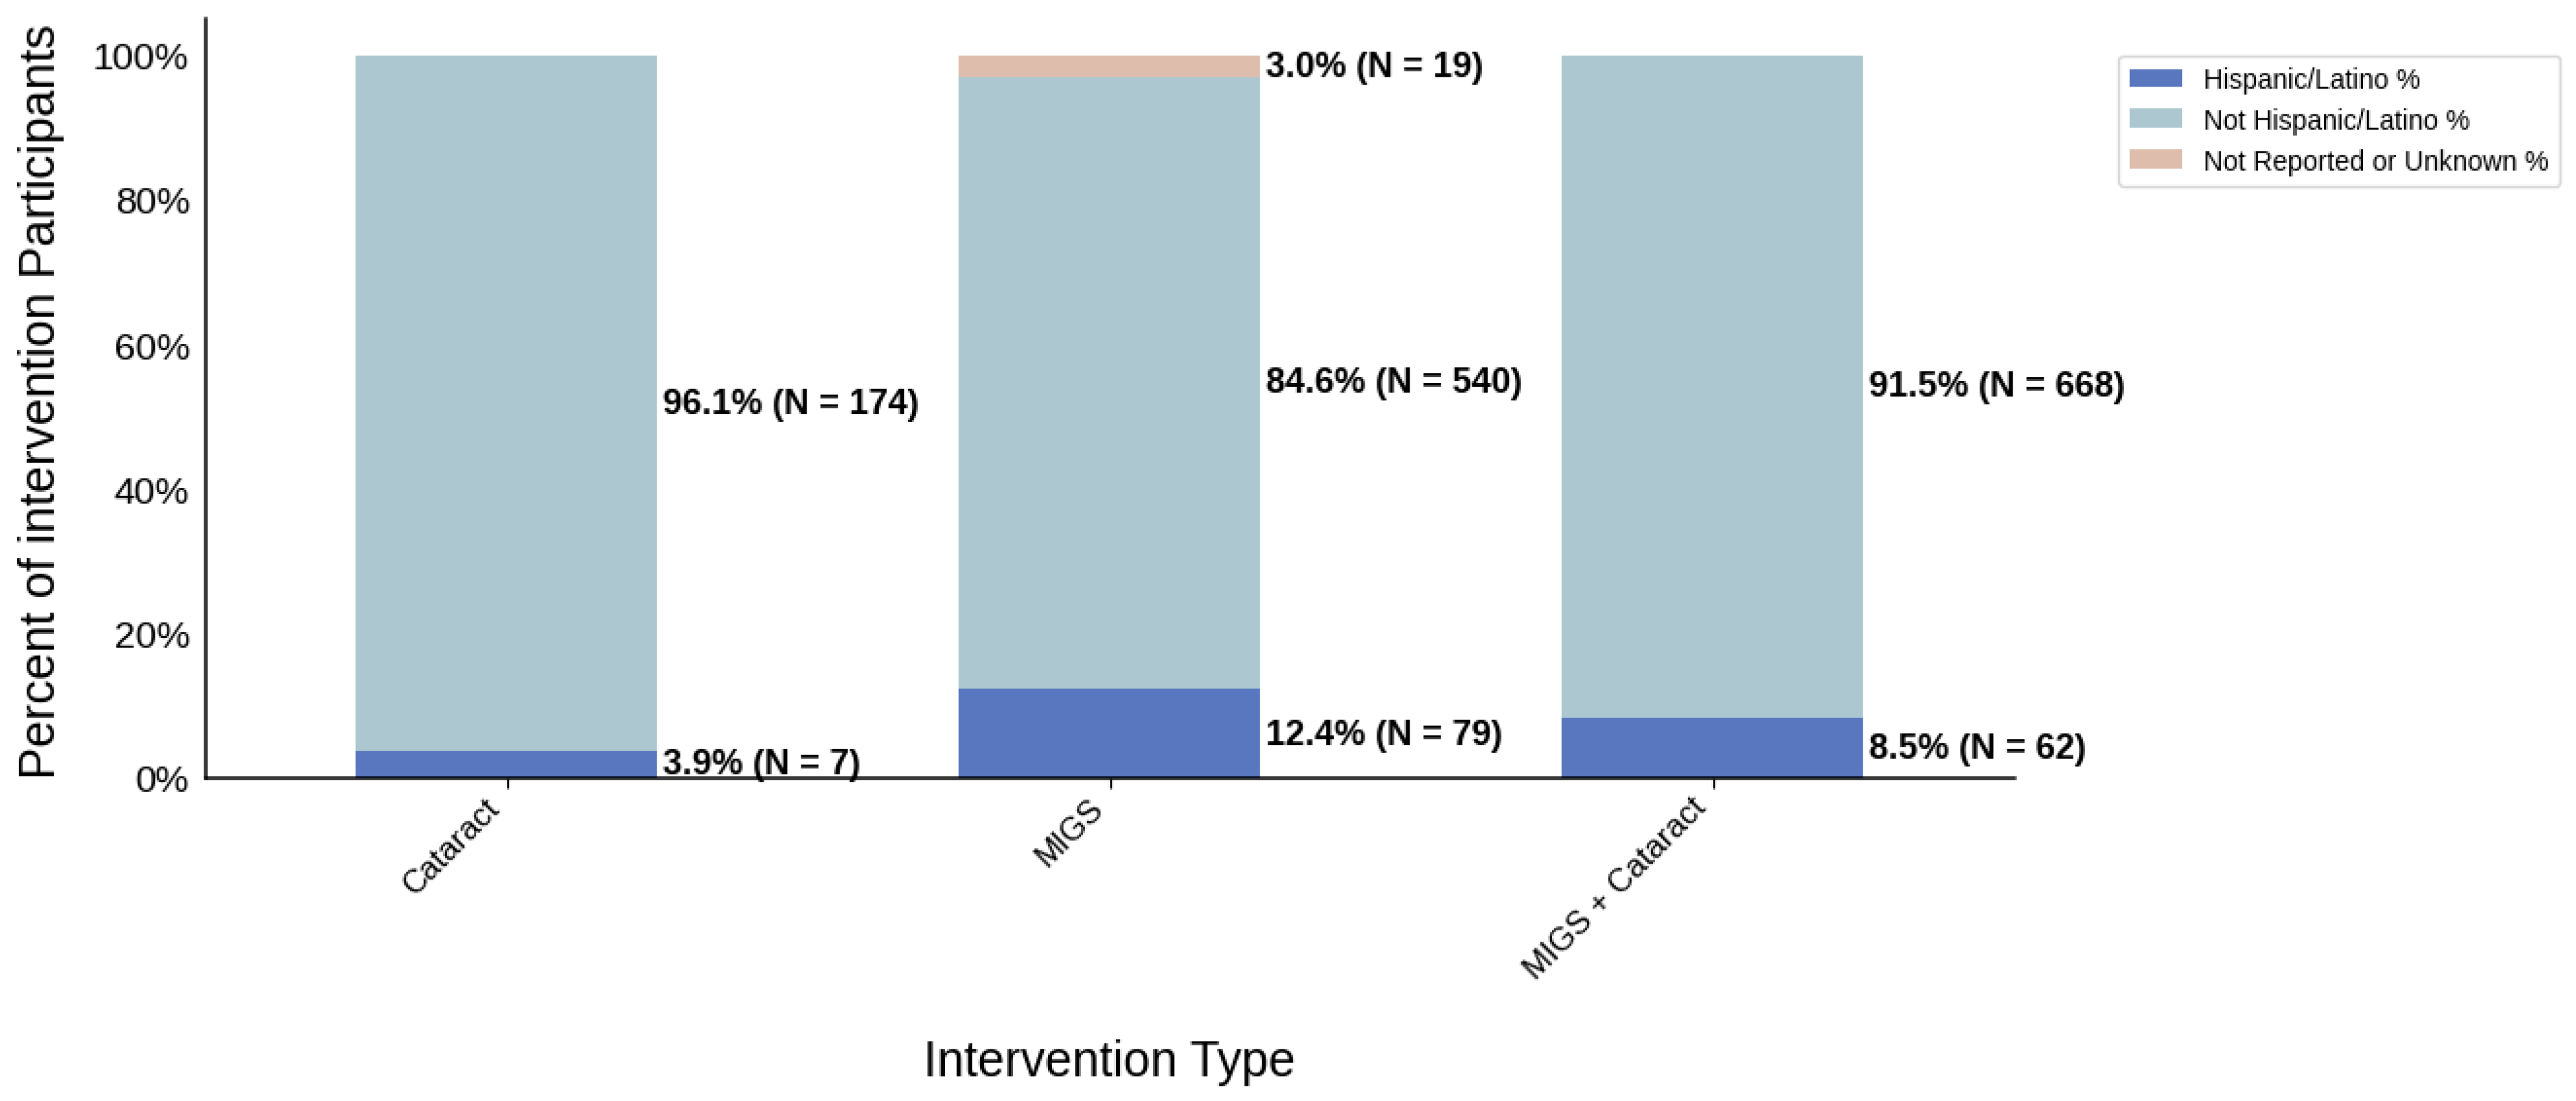
Figure 7.
Ethnic distribution of participants. The stacked bar chart shows the percentage of participants by each ethnic category by intervention type.
Figure 7.
Ethnic distribution of participants. The stacked bar chart shows the percentage of participants by each ethnic category by intervention type.
Figure 8.
Distribution of trial participants by sex. The stacked bar chart displays the percentage of male and female participants within each trial group.
Figure 8.
Distribution of trial participants by sex. The stacked bar chart displays the percentage of male and female participants within each trial group.
Figure 9.
Female PPR. The Figure displays the ratio of female participation compared to the estimated prevalence by intervention group. The shaded area corresponds to a ratio of 0.8 to 1.2, which is considered adequate representation. A ratio that is lower or higher than this range indicates an under-representation or over-representation, respectively. The green bars correspond to a PPR value that is adequately represented.
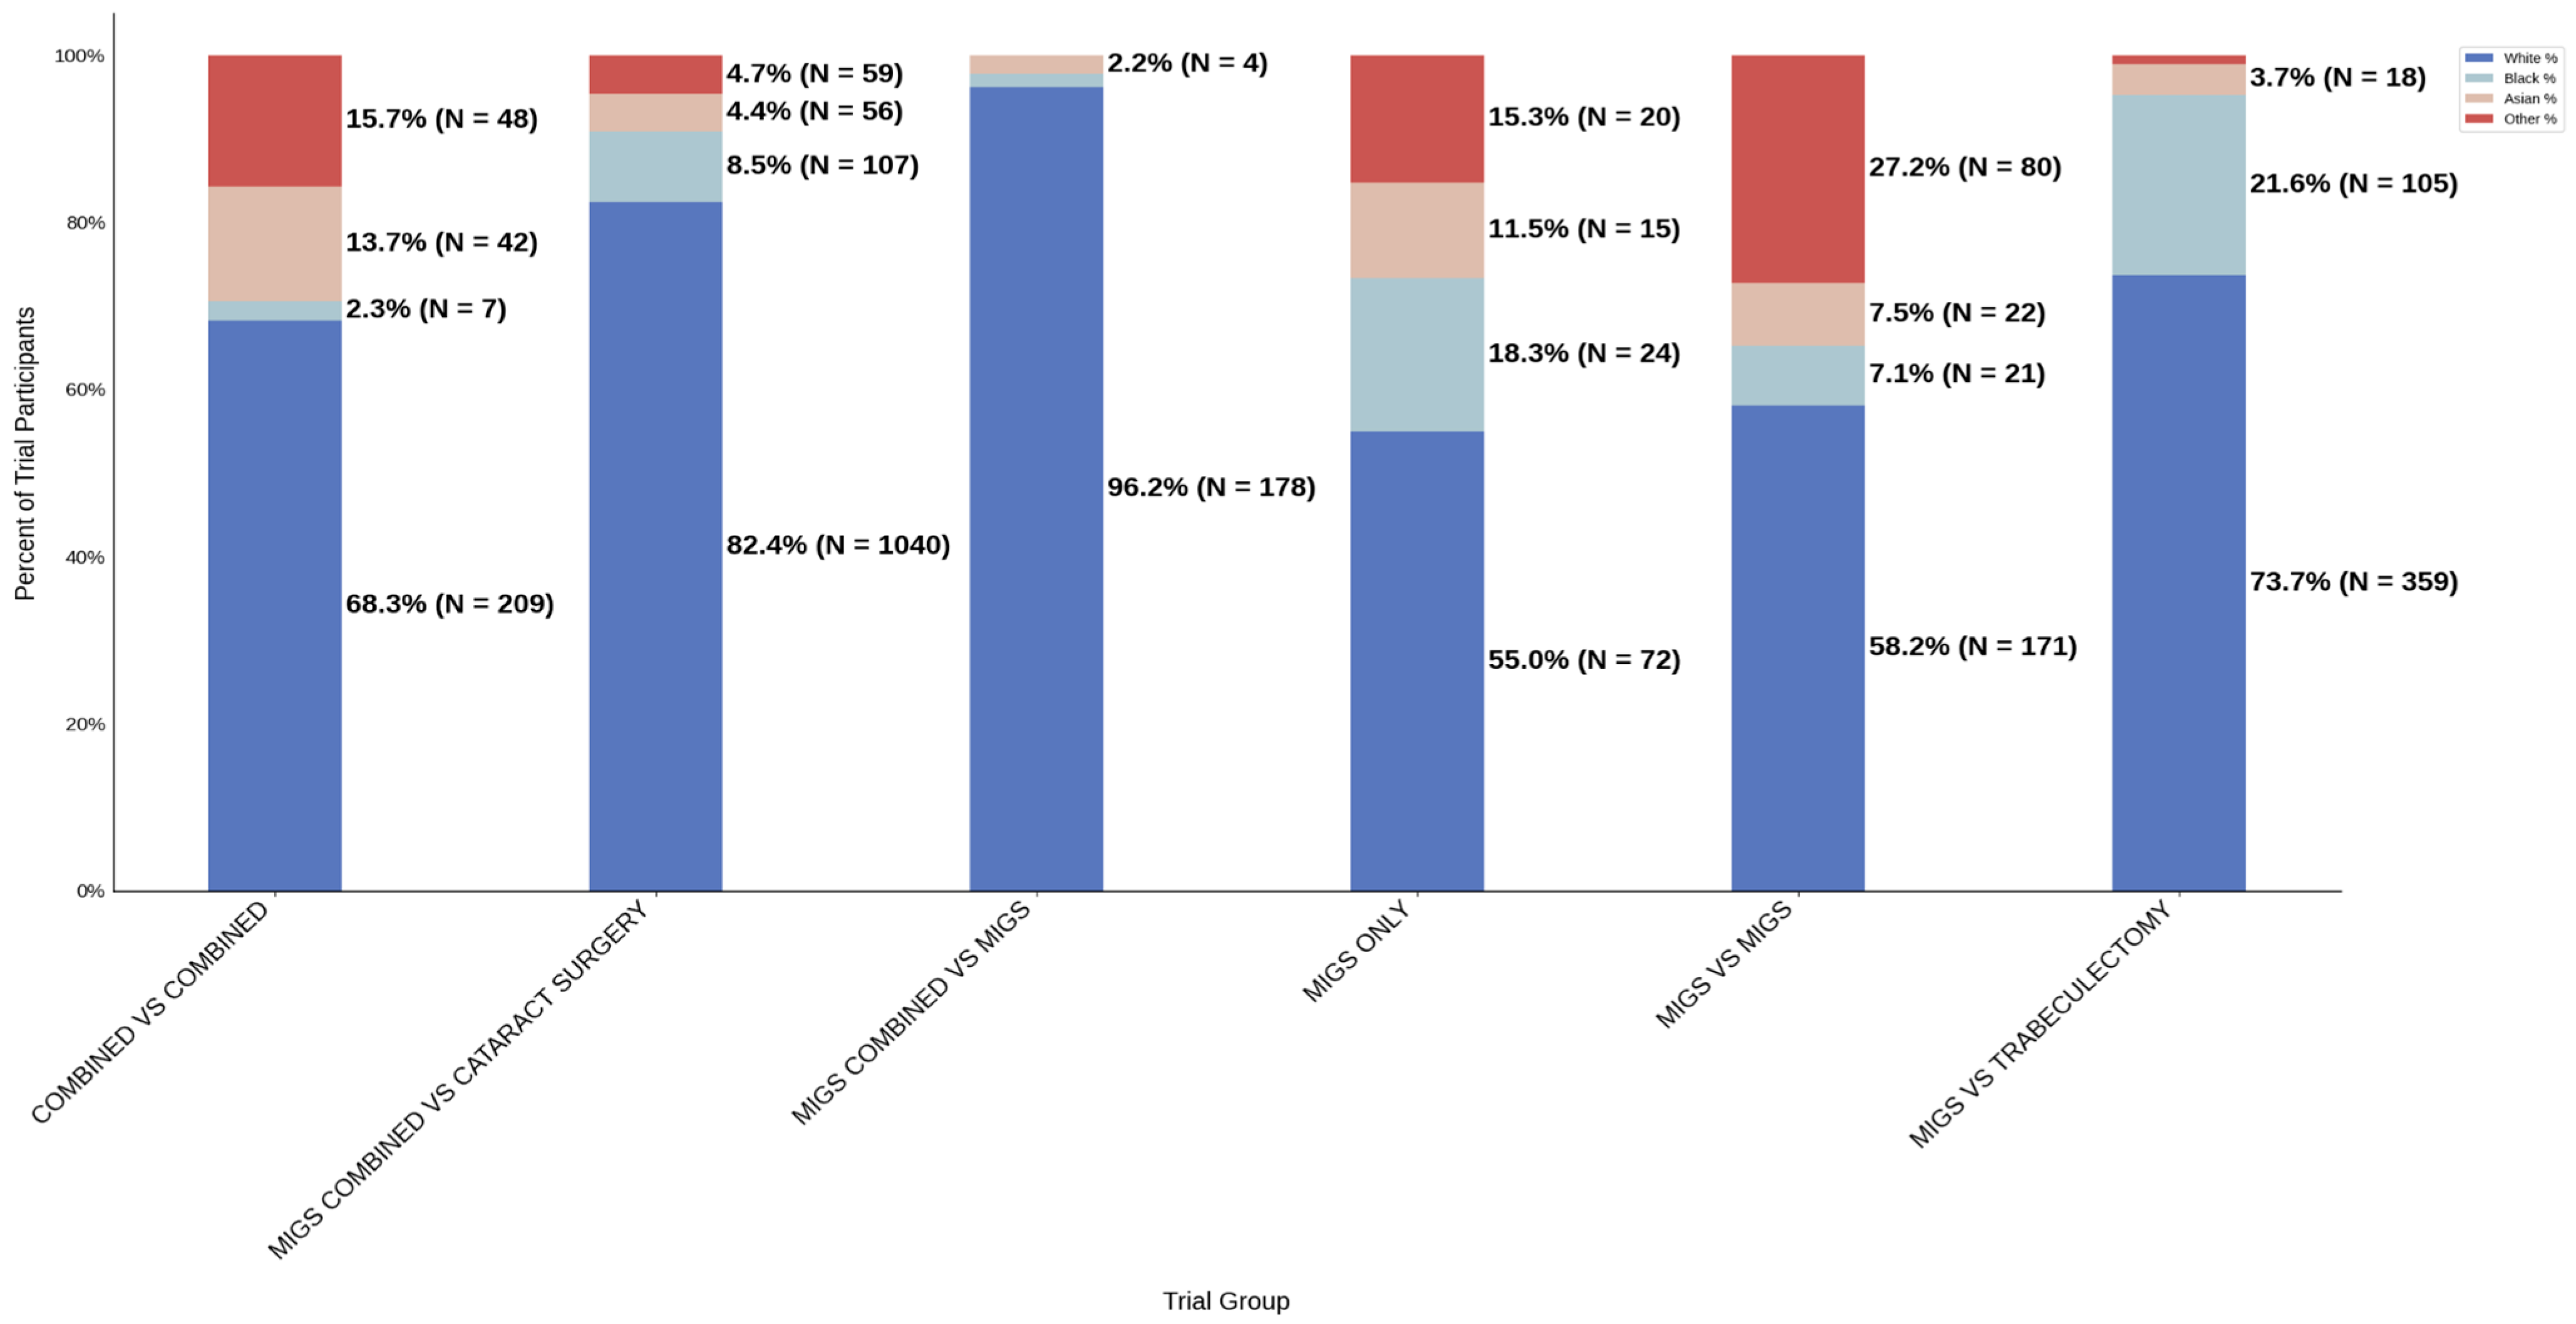
Figure 10.
Racial distribution of trial participants. The stacked bar chart illustrates the percentage of participants by racial category for each trial group.
Figure 10.
Racial distribution of trial participants. The stacked bar chart illustrates the percentage of participants by racial category for each trial group.
Figure 11.
Black PPR. The Figure displays the ratio of Black participation compared to the estimated prevalence by intervention group. The shaded area corresponds to a ratio of 0.8 to 1.2, which is considered adequate representation. A ratio that is lower or higher than this range indicates an under-representation or over-representation, respectively. The green bars correspond to a PPR value that is adequately represented and a red bar corresponds to a PPR value that is under or over-represented.
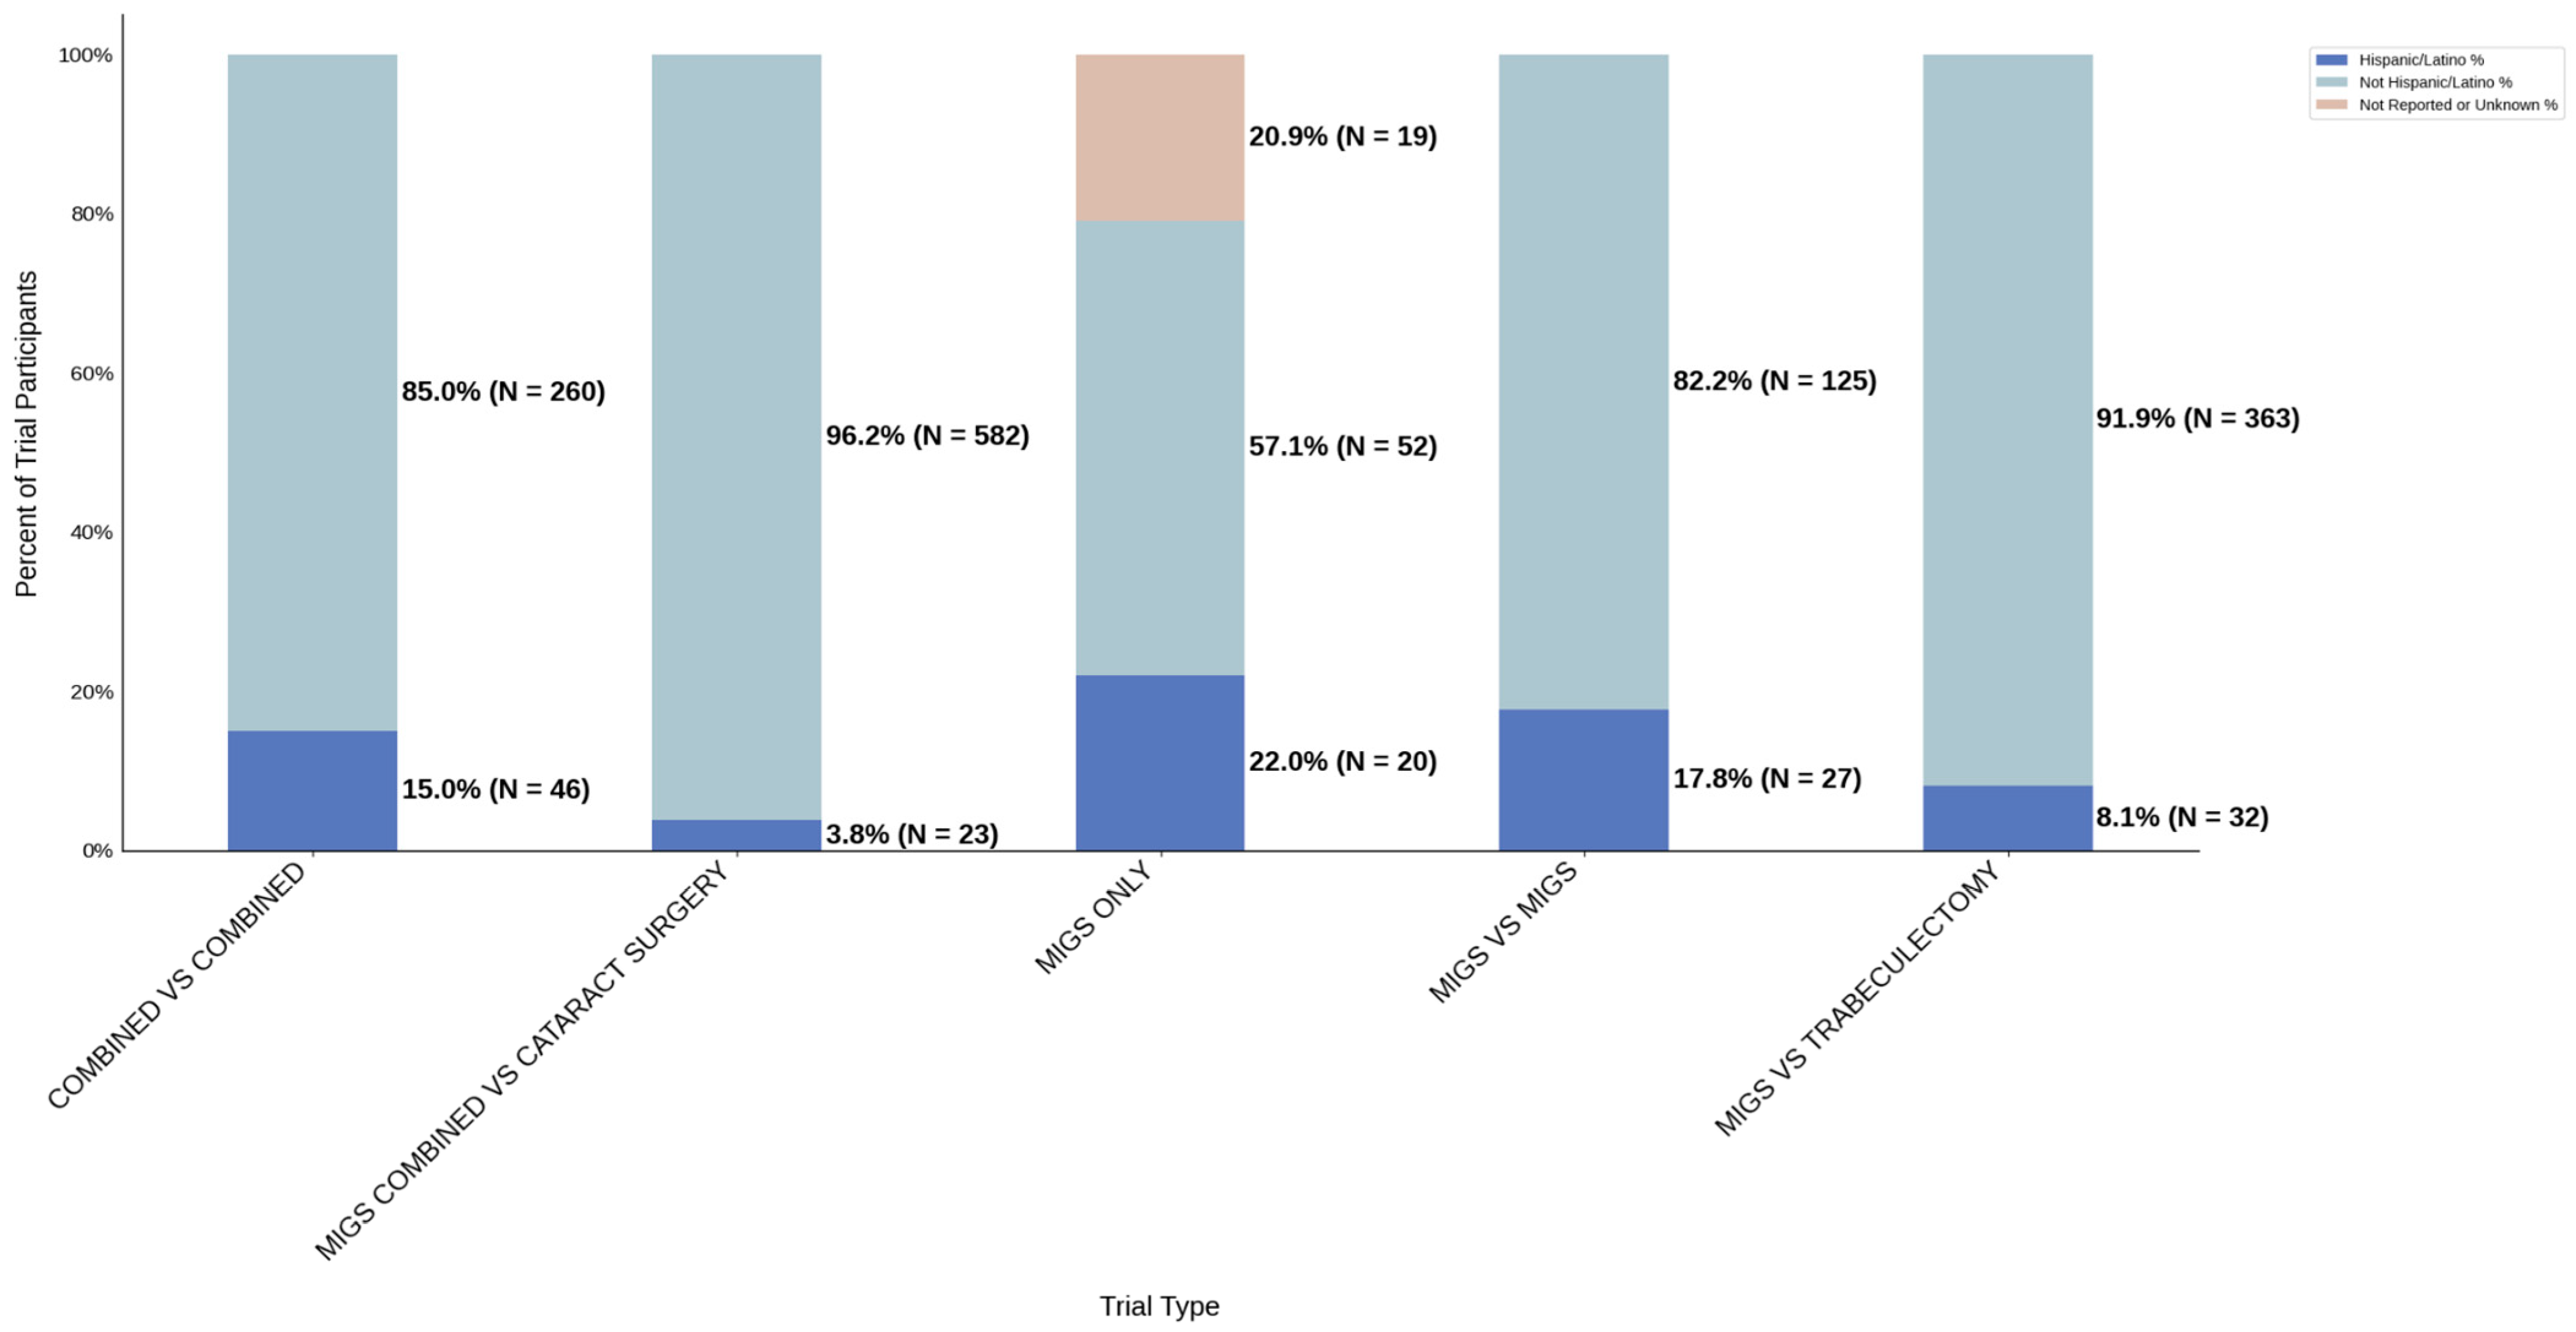
Figure 12.
Ethnic distribution of participants. The stacked bar chart shows the percentage of participants by each ethnic category within each trial group.
Figure 12.
Ethnic distribution of participants. The stacked bar chart shows the percentage of participants by each ethnic category within each trial group.
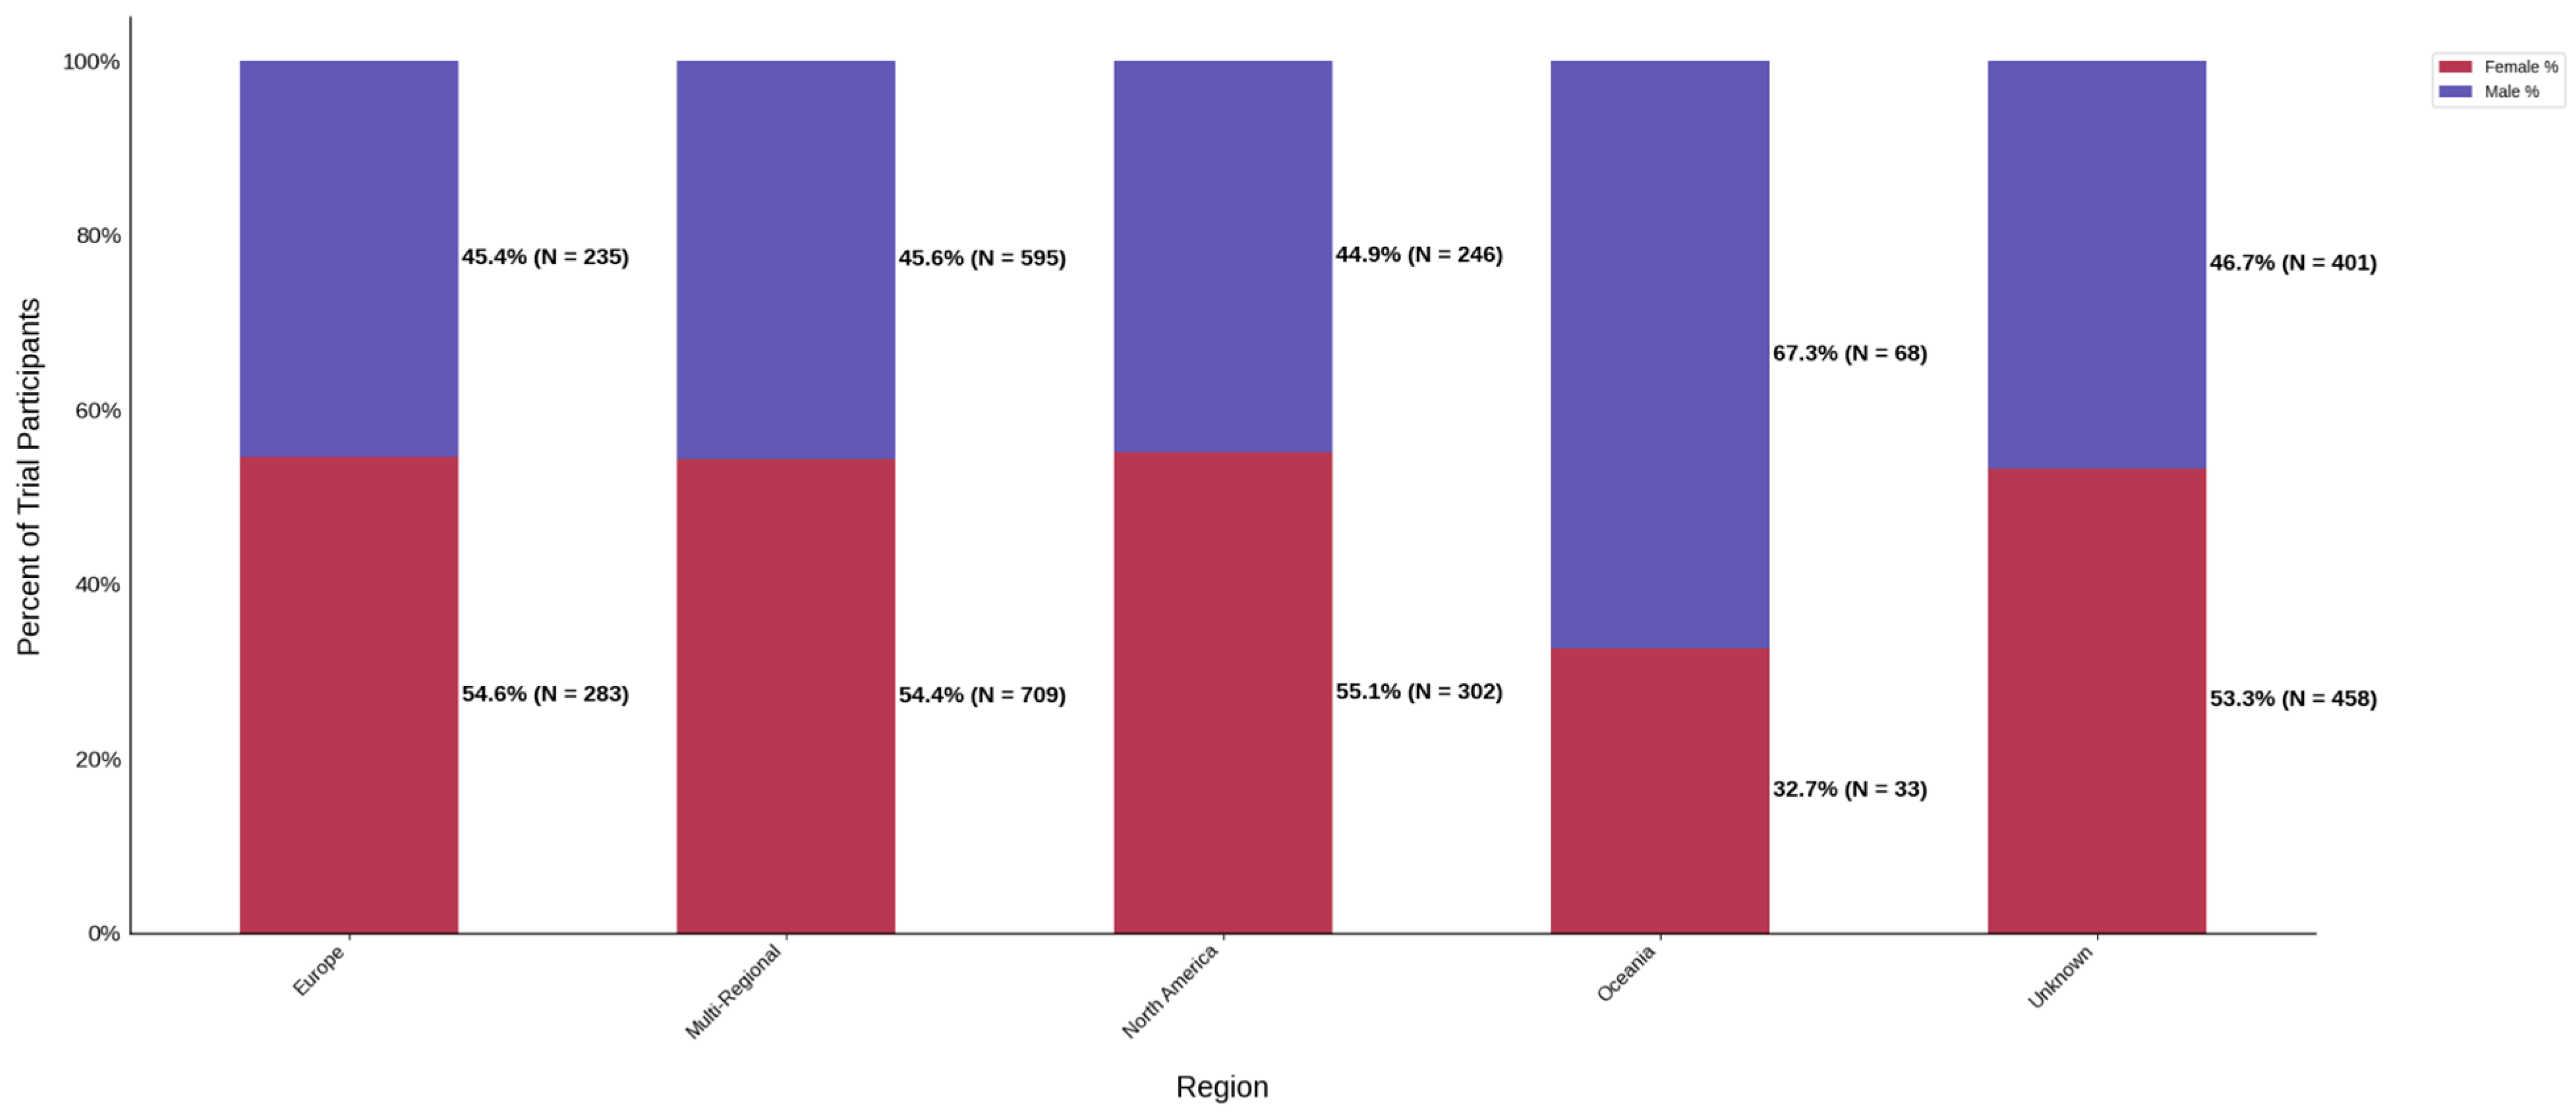
Figure 13.
Distribution of trial participants by sex. The stacked bar chart displays the percentage of male and female participants within each region.
Figure 13.
Distribution of trial participants by sex. The stacked bar chart displays the percentage of male and female participants within each region.
Figure 14.
Female PPR. The Figure displays the ratio of female participation compared to the estimated prevalence by intervention group. The shaded area corresponds to a ratio of 0.8 to 1.2, which is considered adequate representation. A ratio that is lower or higher than this range indicates an under-representation or over-representation, respectively. The green bars correspond to a PPR value that is adequately represented and a red bar corresponds to a PPR value that is under or over-represented.
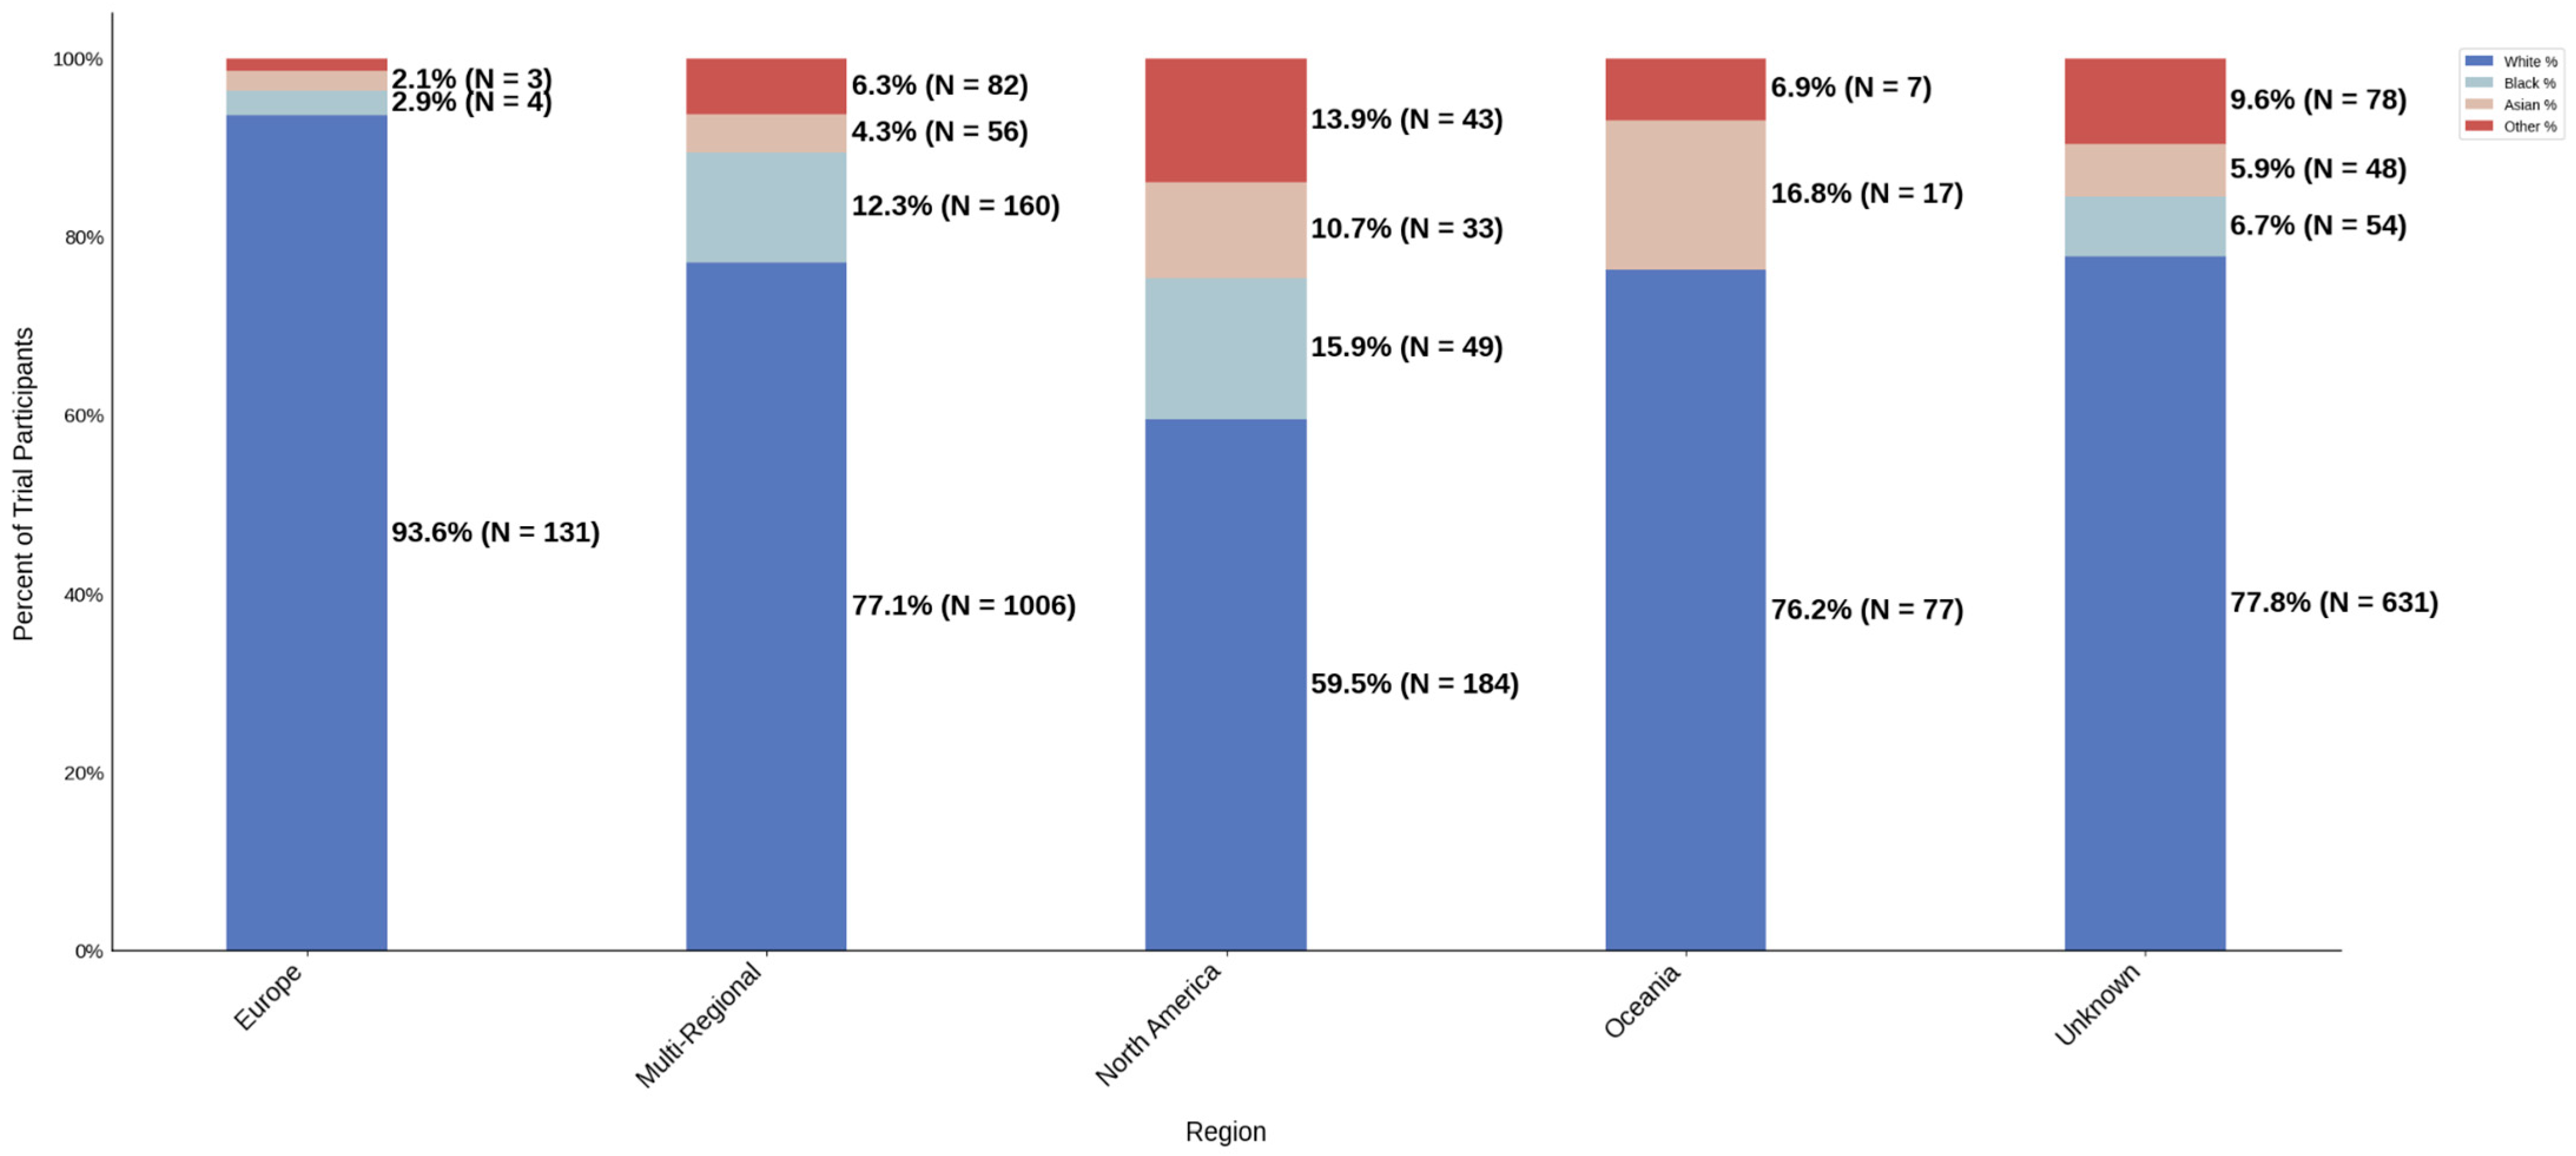
Figure 15.
Racial distribution of trial participants. The stacked bar chart illustrates the percentage of participants by racial category within each region.
Figure 15.
Racial distribution of trial participants. The stacked bar chart illustrates the percentage of participants by racial category within each region.
Figure 16.
Black PPR. The Figure displays the ratio of Black participation compared to the estimated prevalence by intervention group. The shaded area corresponds to a ratio of 0.8 to 1.2, which is considered adequate representation. A ratio that is lower or higher than this range indicates an under-representation or over-representation, respectively. A red bar corresponds to a PPR value that is under or over-represented.
Figure 17.
Ethnic distribution of participants. The stacked bar chart shows the percentage of participants by each ethnic category within each region.
Figure 17.
Ethnic distribution of participants. The stacked bar chart shows the percentage of participants by each ethnic category within each region.
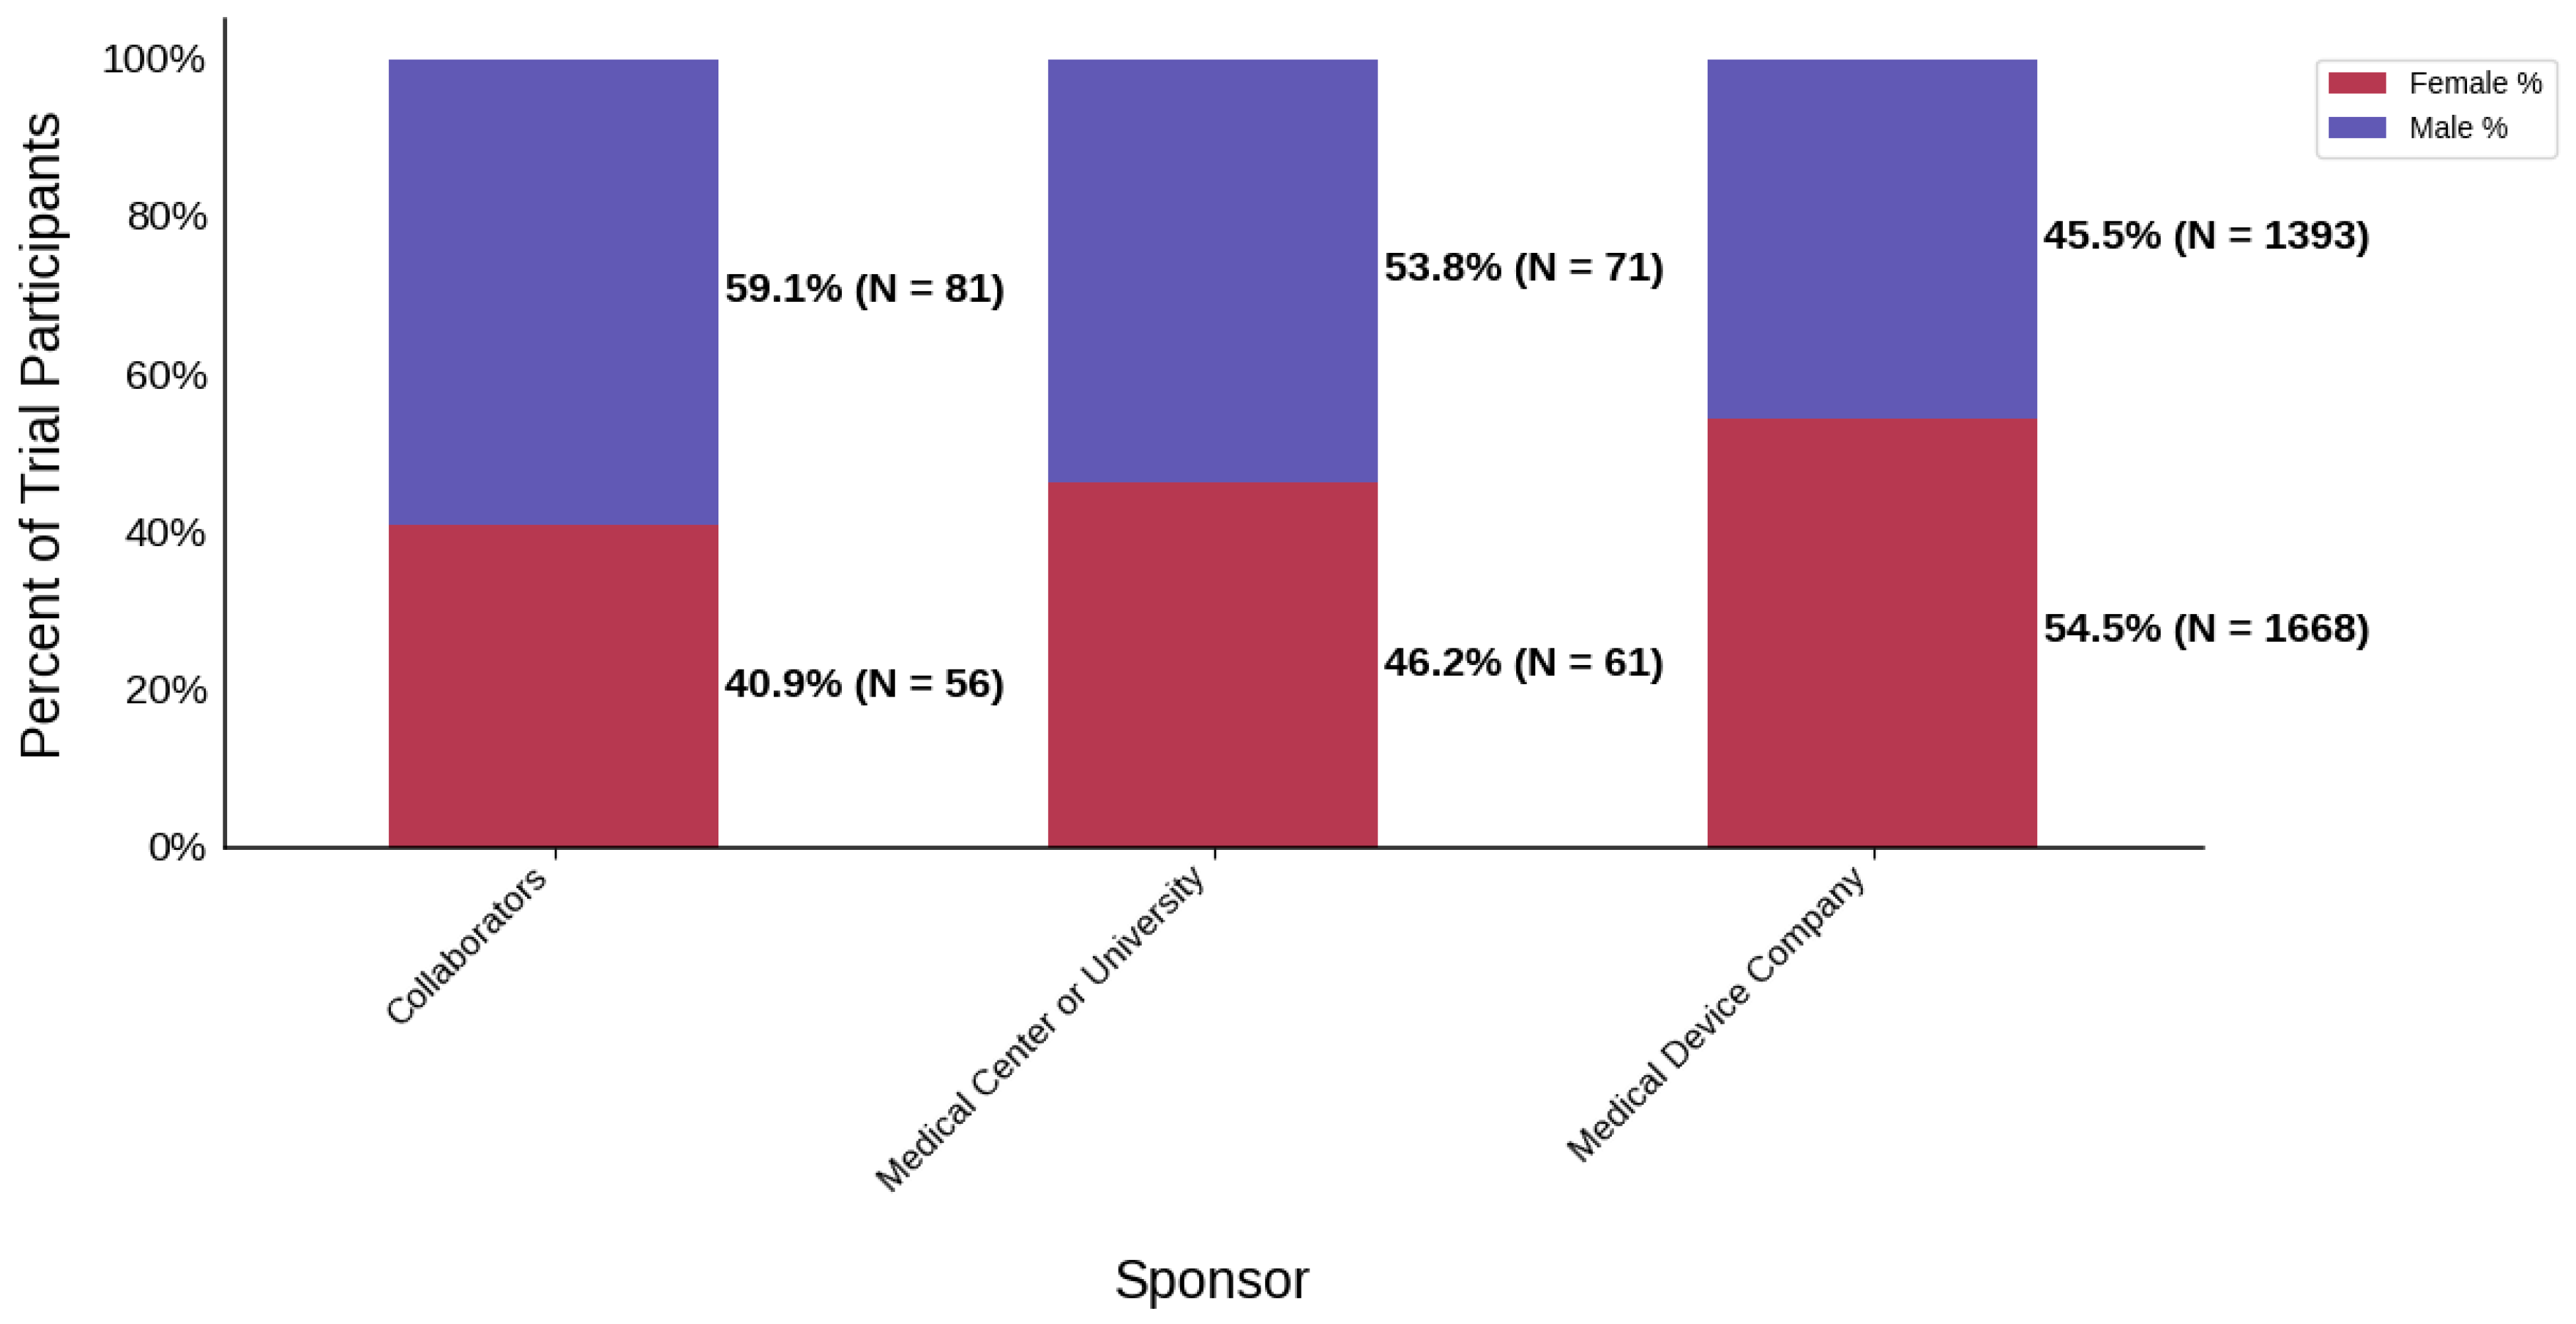
Figure 18.
Distribution of trial participants by sex. The stacked bar chart displays the percentage of male and female participants within each sponsor group.
Figure 18.
Distribution of trial participants by sex. The stacked bar chart displays the percentage of male and female participants within each sponsor group.
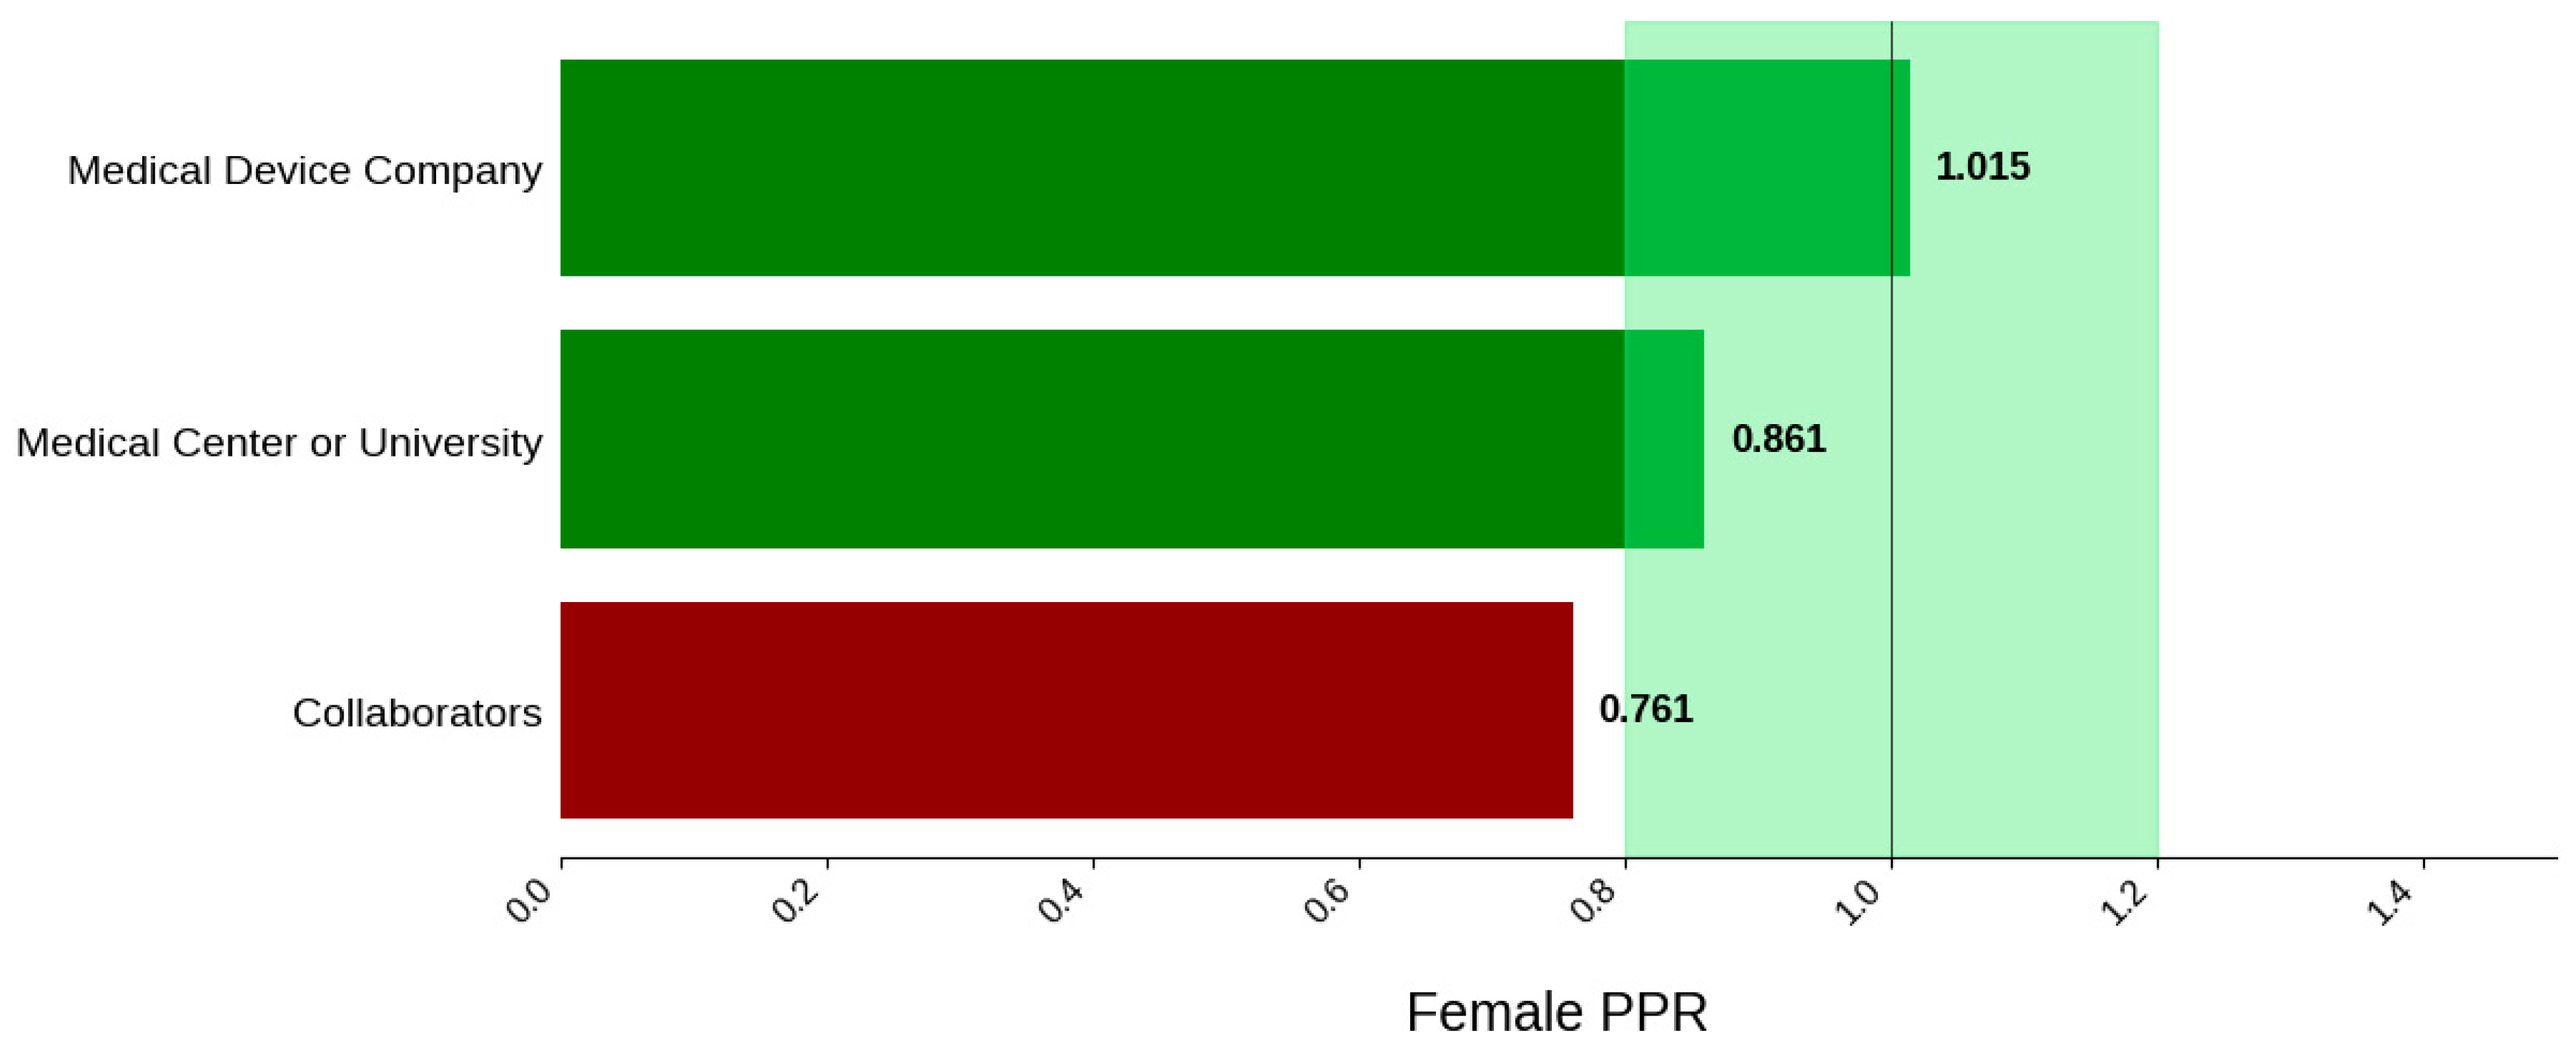
Figure 19.
Female PPR. The Figure displays the ratio of female participation compared to the estimated prevalence by intervention group. The shaded area corresponds to a ratio of 0.8 to 1.2, which is considered adequate representation. A ratio that is lower or higher than this range indicates an under-representation or over-representation, respectively. The green bars correspond to a PPR value that is adequately represented and a red bar corresponds to a PPR value that is under or over-represented.
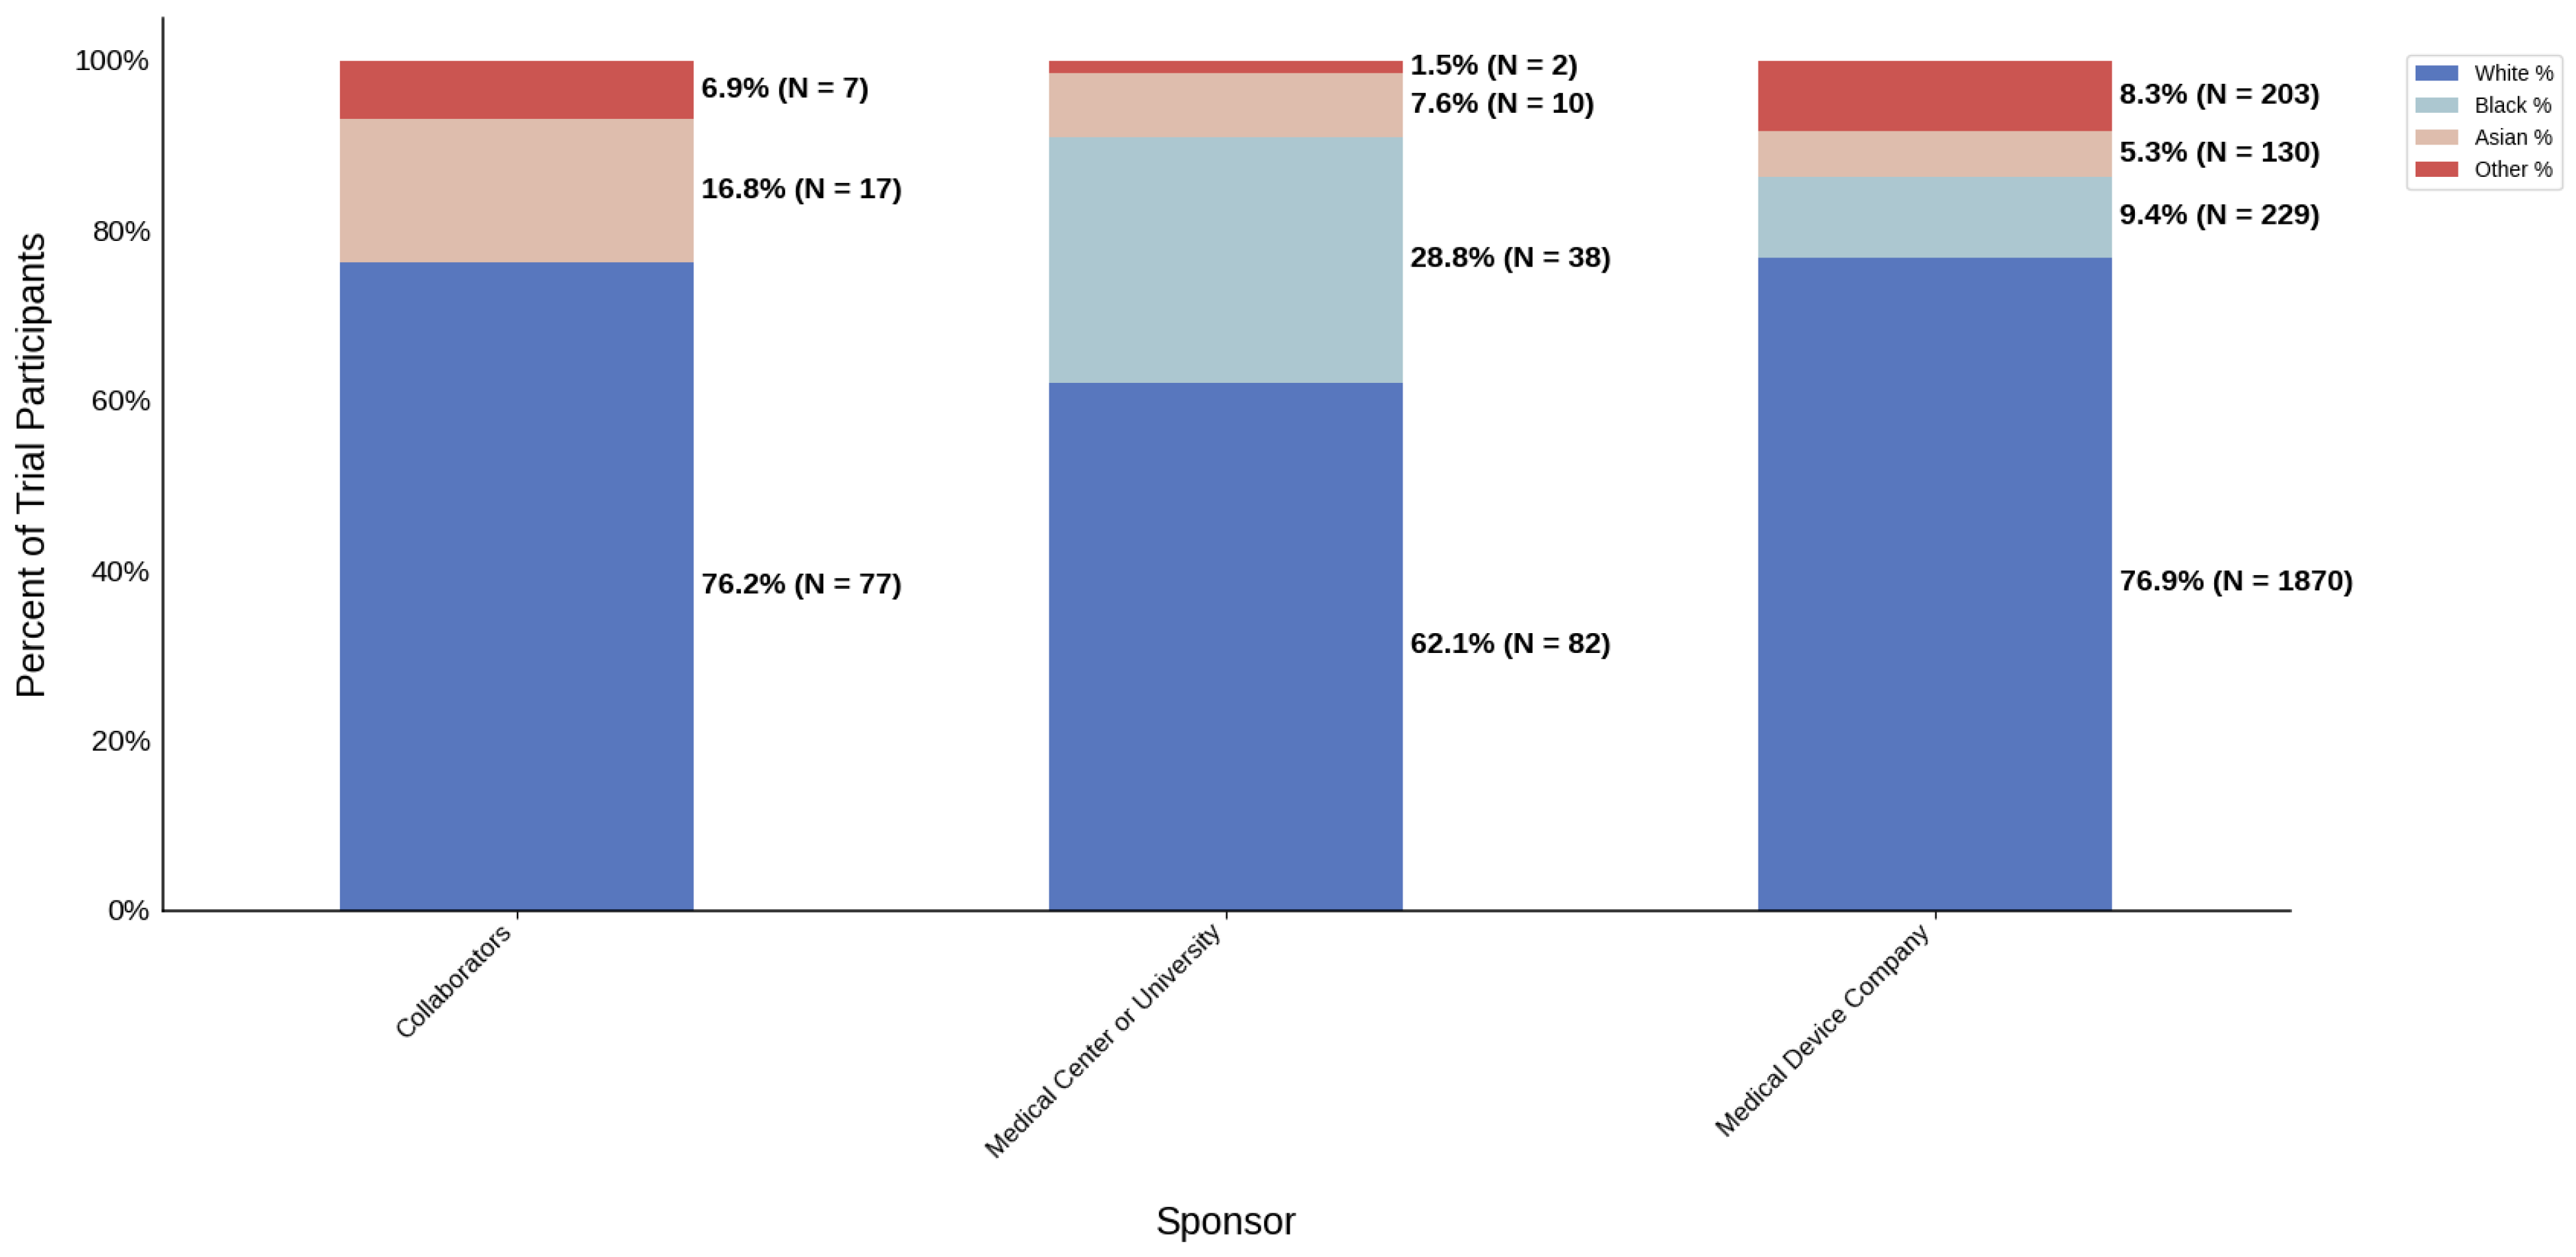
Figure 20.
Racial distribution of trial participants. The stacked bar chart illustrates the percentage of participants by racial category within each sponsor group.
Figure 20.
Racial distribution of trial participants. The stacked bar chart illustrates the percentage of participants by racial category within each sponsor group.
Figure 21.
Black PPR. The Figure displays the ratio of Black participation compared to the estimated prevalence by intervention group. The shaded area corresponds to a ratio of 0.8 to 1.2, which is considered adequate representation. A ratio that is lower or higher than this range indicates an under-representation or overrepresentation, respectively. A red bar corresponds to a PPR value that is under or over-represented.
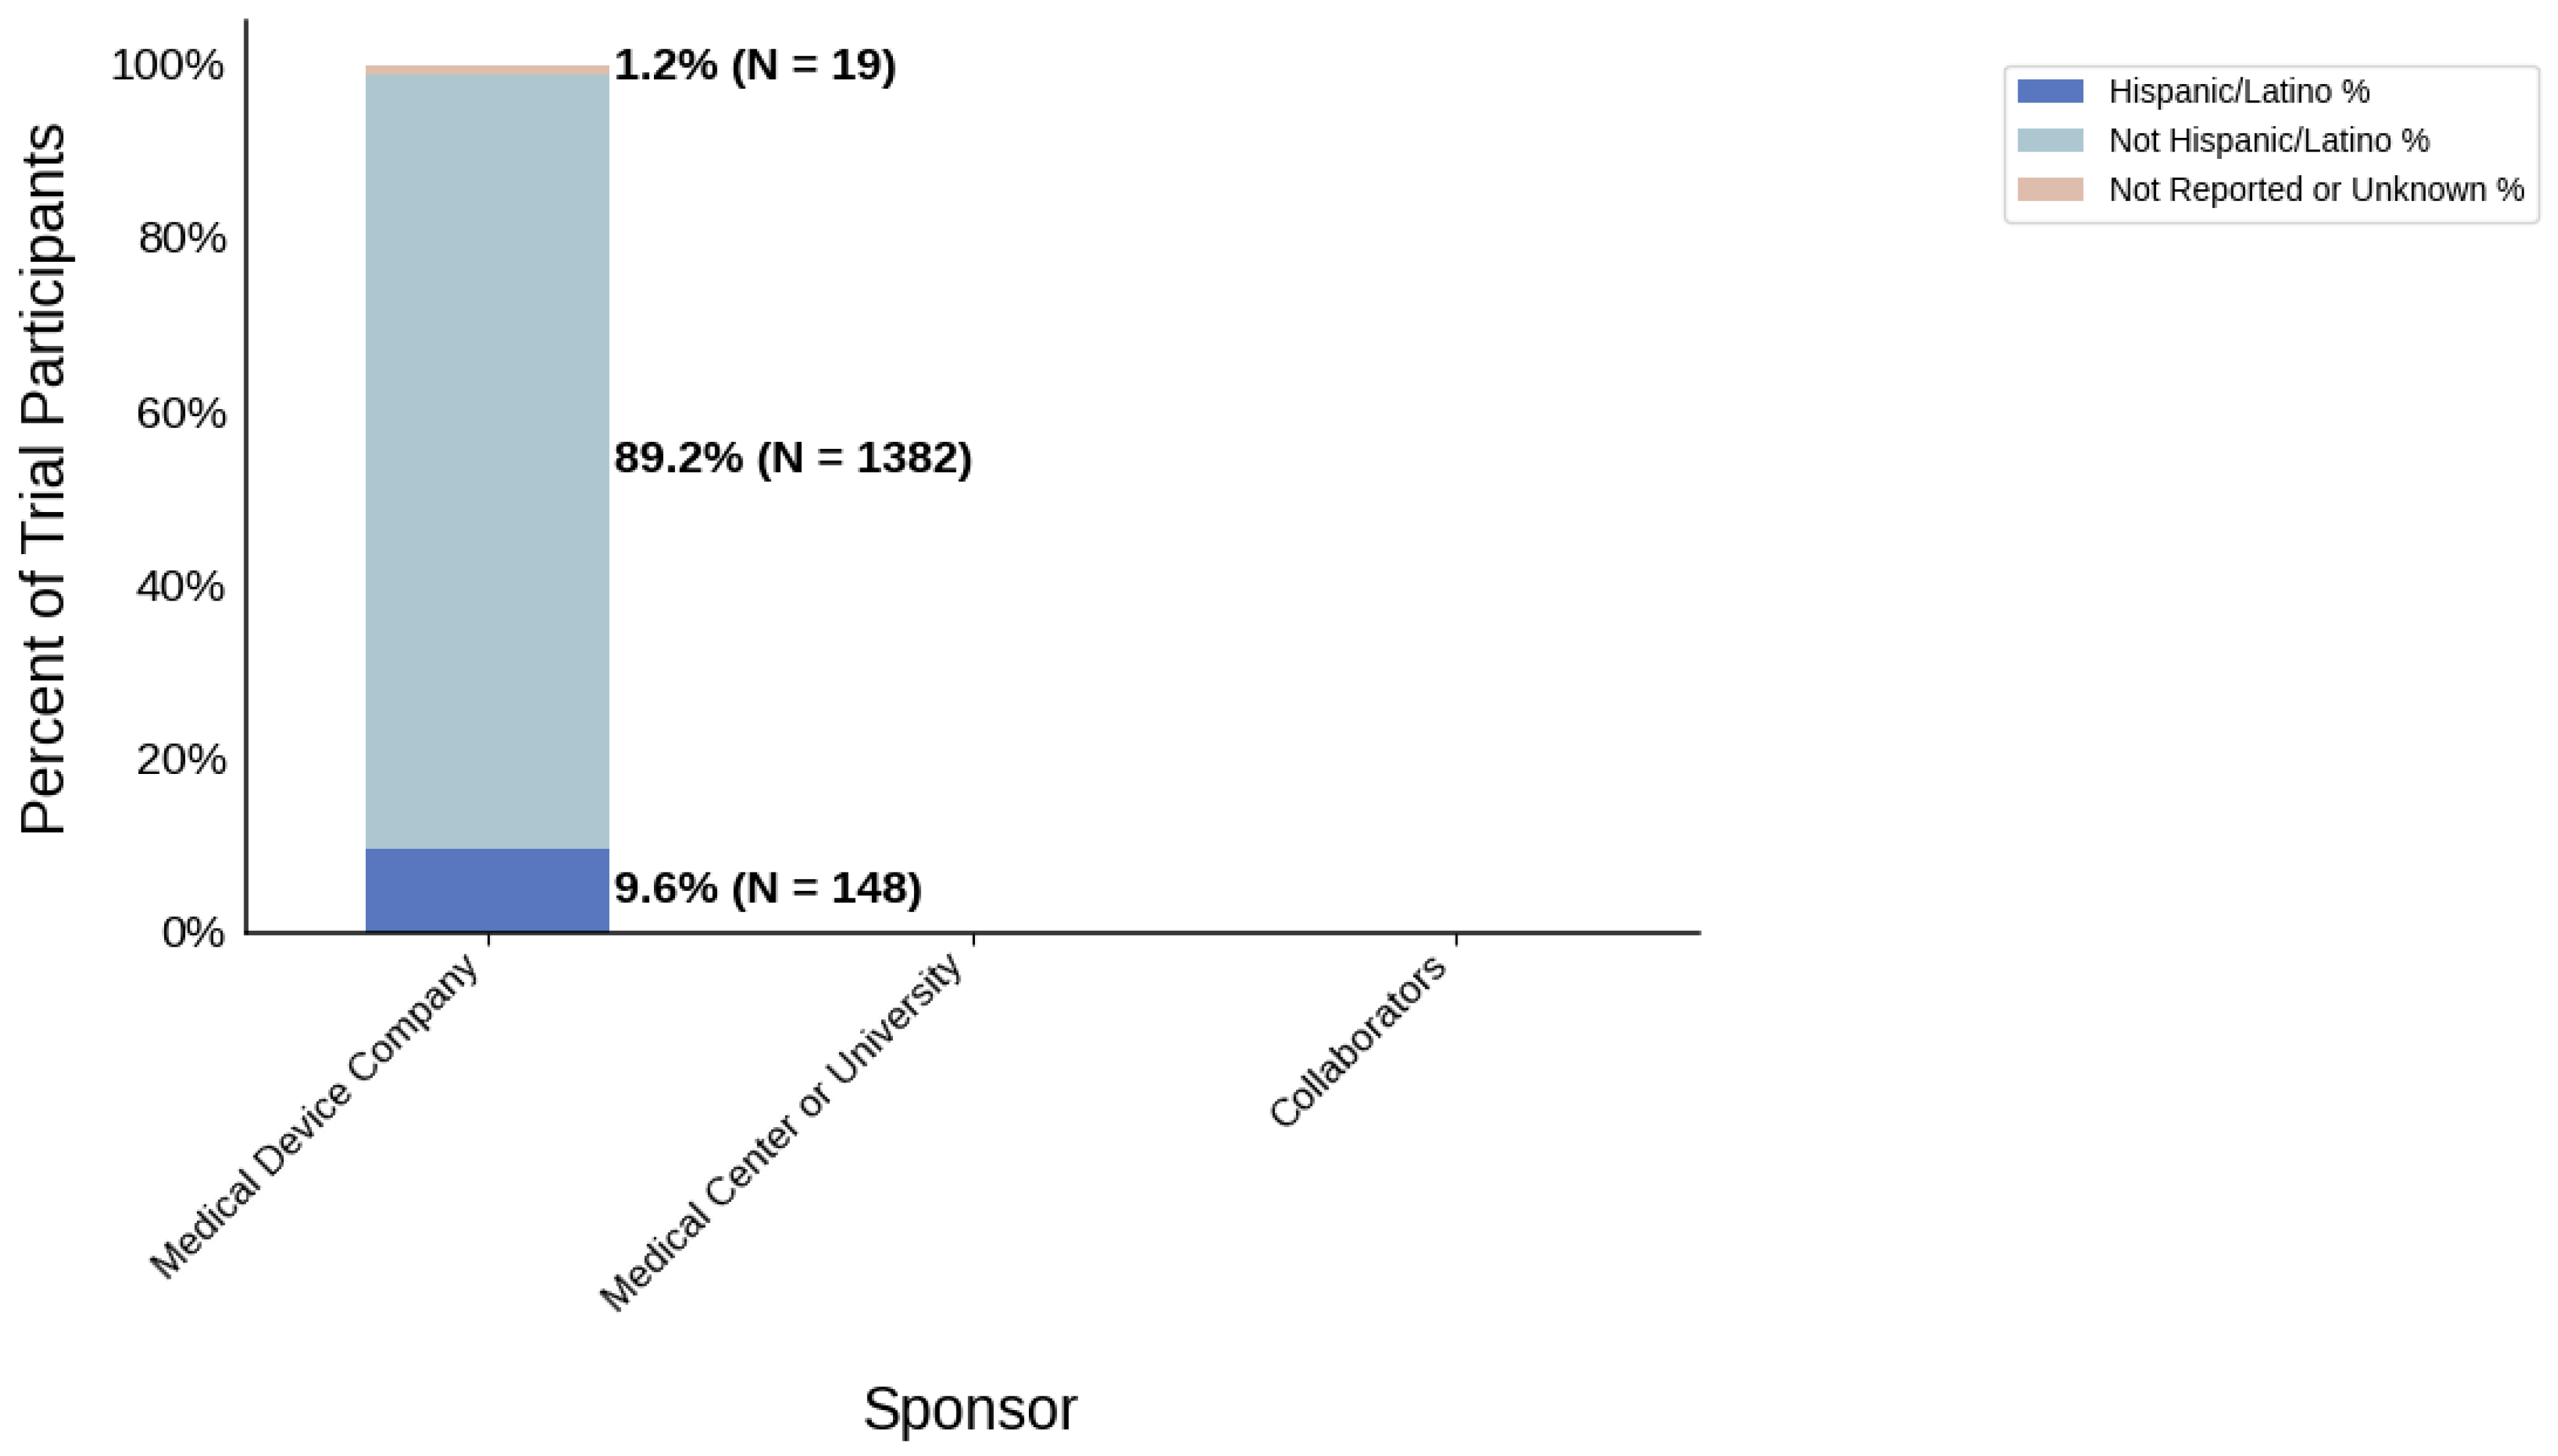
Figure 22.
Ethnic distribution of participants. The stacked bar chart shows the percentage of participants by each ethnic category by sponsor group.
Figure 22.
Ethnic distribution of participants. The stacked bar chart shows the percentage of participants by each ethnic category by sponsor group.
Table 1.
Baseline trial characteristics.
Table 1.
Baseline trial characteristics.
| Trial Type | Author, Year | Sponsor | Region | Follow-Up (Months) |
|---|
| COMBINED vs. COMBINED | Unavailable, 2011 (NCT02024464) | Ivantis, Inc., Irvine, CA, USA | Unknown | 12, 24 |
| MIGS COMBINED vs. CATARACT SURGERY | Fan Gaskin, 2018 (NCT03106181) | Glaukos Corporation, Aliso Viejo, CA, USA; Centre for Eye Research Australia, East Melbourne, Australia | Oceania | 24 |
| MIGS COMBINED vs. CATARACT SURGERY | Fea, 2008 (NCTABC) | Glaukos Corporation; Ricerca Finalizzata della Regione Piemonte 2007 | Europe | 12, 15 |
| MIGS COMBINED vs. CATARACT SURGERY | Fernandez-Barrientos, 2005 (NCT00326066) | Glaukos Corporation | Europe | 6, 12 |
| MIGS COMBINED vs. CATARACT SURGERY | Pfeiffer, 2011 (NCT01818115) | Ivantis, Inc. | Europe | 12, 24 |
| MIGS COMBINED vs. CATARACT SURGERY | Samuelson, 2005 (NCT00323284) | Glaukos Corporation | North America | 12, 24 |
| MIGS COMBINED vs. CATARACT SURGERY | Samuelson, 2012 (NCT01539239) | Ivantis, Inc. | Multi-Regional | 12, 24 |
| MIGS COMBINED vs. CATARACT SURGERY | Vold, 2009 (NCT01085357, COMPASS) | Transcend Medical, Inc., Menlo Park, CA, USA | Unknown | 12, 24 |
| MIGS COMBINED vs. MIGS | Reitsamer, 2013 (NCT02006693) | AqueSys, Inc., Aliso Viejo, CA, USA | Multi-Regional | 12, 24 |
| MIGS ONLY | Beckers, 2014 (NCT02177123) | InnFocus Inc., Three Lakes, FL, USA | Europe | 12, 24 |
| MIGS ONLY | De Jong, 2003 (NCTXYZ) | Amsterdam University Medical Center, Amsterdam, The Netherlands | Europe | 12, 24 |
| MIGS ONLY | Denis, 2017 (NCT03193736, STAR-I) | iSTAR Medical, Wavre, Belgium | Multi-Regional | 6, 12, 24 |
| MIGS ONLY | Garcia-Feijoo, 2010 (NCT01166659, DUETTE) | Transcend Medical, Inc. | Unknown | 12, 24 |
| MIGS ONLY | Grover, 2013 (NCT02036541) | AqueSys, Inc. | North America | 6, 12 |
| MIGS ONLY | Hoeh, 2009 (NCT01097174) | Transcend Medical, Inc. | Europe | 6, 12 |
| MIGS ONLY | Riss, 2011 (NCT01563237) | InnFocus Inc. | Europe | 12, 24 |
| MIGS vs. MIGS | Ahmed, 2012 (NCT02023242, COMPARE) | Ivantis, Inc. | North America | 12 |
| MIGS vs. MIGS | Unavailable, 2013 (NCT02448875, ViscoPass) | Transcend Medical, Inc. | Multi-Regional | 12 |
| MIGS vs. TRABECULECTOMY | Baker, 2015 (NCT01881425, IMS) | InnFocus Inc. | Multi-Regional | 12, 24 |
| MIGS vs. TRABECULECTOMY | Netland, 2006 (NCT00444080) | University of Virginia, Charlottesville, VA, USA | North America | 6, 24 |
| MIGS vs. TRABECULECTOMY | Wagschal, 2013 (NCT01263561) | University of Toronto, Toronto, ON, Canada | North America | 12, 24 |
Table 2.
Overall clinical trial demographics and PPR. Values for race and ethnicity are based on trials that reported that data.
Table 2.
Overall clinical trial demographics and PPR. Values for race and ethnicity are based on trials that reported that data.
| Participants N | 3330 |
| Female N (%) | 1785 (53.6) |
| Male N (%) | 1545 (46.4) |
| White N (%) | 2029 (76.1) |
| Black N (%) | 267 (10.0) |
| Asian N (%) | 157 (5.9) |
| Other N (%) | 212 (8.0) |
| Hispanic/Latino N (%) | 148 (9.6) |
| Not Hispanic/Latino N (%) | 1382 (89.2) |
| Not Reported or Unknown N (%) | 19 (1.2) |
| Female PPR | 1 |
| Black PPR | 0.44 |
Table 3.
Demographic details and PPR by clinical trial. Trials that did not report race or ethnicity statistics are left blank.
Table 3.
Demographic details and PPR by clinical trial. Trials that did not report race or ethnicity statistics are left blank.
| Trial Type | Author, Year | Participants N | Female N (%) | Male N (%) | White N (%) | Black N (%) | Asian N (%) | Other N (%) | Hispanic/Latino N (%) | Not Hispanic/Latino N (%) | Not Reported or Unknown N (%) | Female PPR | Black PPR |
|---|
| COMBINED vs. COMBINED | Unavailable, 2011 (NCT02024464) | 306 | 157 (51.3) | 149 (48.7) | 209 (68.3) | 7 (2.3) | 42 (13.7) | 48 (15.7) | 46 (15.0) | 260 (85.0) | 0 (0.0) | 0.96 | 0.1 |
| MIGS COMBINED vs. CATARACT SURGERY | Fan Gaskin, 2018 (NCT03106181) | 101 | 33 (32.7) | 68 (67.3) | 77 (76.2) | 0 (0.0) | 17 (16.8) | 7 (6.9) | | | | 0.61 | 0 |
| MIGS COMBINED vs. CATARACT SURGERY | Fea, 2008 (NCTABC) | 36 | 23 (63.9) | 13 (36.1) | | | | | | | | 1.19 | |
| MIGS COMBINED vs. CATARACT SURGERY | Fernandez-Barrientos, 2005 (NCT00326066) | 33 | 18 (54.5) | 15 (45.5) | | | | | | | | 1.02 | |
| MIGS COMBINED vs. CATARACT SURGERY | Pfeiffer, 2011 (NCT01818115) | 100 | 51 (51.0) | 49 (49.0) | 97 (97.0) | 0 (0.0) | 1 (1.0) | 2 (2.0) | 1 (1.0) | 99 (99.0) | 0 (0.0) | 0.95 | 0 |
| MIGS COMBINED vs. CATARACT SURGERY | Samuelson, 2005 (NCT00323284) | 239 | 141 (59.0) | 98 (41.0) | | | | | | | | 1.1 | |
| MIGS COMBINED vs. CATARACT SURGERY | Samuelson, 2012 (NCT01539239) | 556 | 311 (55.9) | 245 (44.1) | 444 (79.9) | 60 (10.8) | 32 (5.8) | 20 (3.6) | | | | 1.04 | 0.47 |
| MIGS COMBINED vs. CATARACT SURGERY | Vold, 2009 (NCT01085357) | 505 | 269 (53.3) | 236 (46.7) | 422 (83.6) | 47 (9.3) | 6 (1.2) | 30 (5.9) | 22 (4.4) | 483 (95.6) | 0 (0.0) | 0.99 | 0.41 |
| MIGS COMBINED vs. MIGS | Reitsamer, 2013 (NCT02006693) | 185 | 95 (51.4) | 90 (48.6) | 178 (96.2) | 3 (1.6) | 4 (2.2) | 0 (0.0) | | | | 0.96 | 0.07 |
| MIGS ONLY | Beckers, 2014 (NCT02177123) | 81 | 45 (55.6) | 36 (44.4) | | | | | | | | 1.03 | |
| MIGS ONLY | De Jong, 2003 (NCTXYZ) | 40 | 21 (52.5) | 19 (47.5) | 34 (85.0) | 4 (10.0) | 2 (5.0) | 0 (0.0) | | | | 0.98 | 0.44 |
| MIGS ONLY | Denis, 2017 (NCT03193736) | 26 | 12 (46.2) | 14 (53.8) | 0 (0.0) | 9 (34.6) | 10 (38.5) | 7 (26.9) | 7 (26.9) | 0 (0.0) | 19 (73.1) | 0.86 | 1.51 |
| MIGS ONLY | Garcia-Feijoo, 2010 (NCT01166659) | 48 | 32 (66.7) | 16 (33.3) | | | | | | | | 1.24 | |
| MIGS ONLY | Grover, 2013 (NCT02036541) | 65 | 35 (53.8) | 30 (46.2) | 38 (58.5) | 11 (16.9) | 3 (4.6) | 13 (20.0) | 13 (20.0) | 52 (80.0) | 0 (0.0) | 1 | 0.74 |
| MIGS ONLY | Hoeh, 2009 (NCT01097174) | 167 | 99 (59.3) | 68 (40.7) | | | | | | | | 1.1 | |
| MIGS ONLY | Riss, 2011 (NCT01563237) | 61 | 26 (42.6) | 35 (57.4) | | | | | | | | 0.79 | |
| MIGS vs. MIGS | Ahmed, 2012 (NCT02023242) | 152 | 86 (56.6) | 66 (43.4) | 98 (64.5) | 4 (2.6) | 22 (14.5) | 28 (18.4) | 27 (17.8) | 125 (82.2) | 0 (0.0) | 1.05 | 0.11 |
| MIGS vs. MIGS | Unavailable, 2013 (NCT02448875) | 142 | 77 (54.2) | 65 (45.8) | 73 (51.4) | 17 (12.0) | 0 (0.0) | 52 (36.6) | | | | 1.01 | 0.52 |
| MIGS vs. TRABECULECTOMY | Baker, 2015 (NCT01881425) | 395 | 214 (54.2) | 181 (45.8) | 311 (78.7) | 71 (18.0) | 10 (2.5) | 3 (0.8) | 32 (8.1) | 363 (91.9) | 0 (0.0) | 1.01 | 0.78 |
| MIGS vs. TRABECULECTOMY | Netland, 2006 (NCT00444080) | 59 | 27 (45.8) | 32 (54.2) | 25 (42.4) | 30 (50.8) | 2 (3.4) | 2 (3.4) | | | | 0.85 | 2.22 |
| MIGS vs. TRABECULECTOMY | Wagschal, 2013 (NCT01263561) | 33 | 13 (39.4) | 20 (60.6) | 23 (69.7) | 4 (12.1) | 6 (18.2) | 0 (0.0) | | | | 0.73 | 0.53 |
Table 4.
Sex, racial, and ethnic distribution as well as female and Black PPR by intervention type.
Table 4.
Sex, racial, and ethnic distribution as well as female and Black PPR by intervention type.
| Intervention Type | Cataract Surgery | MIGS | MIGS + Cataract |
|---|
| Female N (%) | 304 (53.3) | 849 (53.8) | 632 (53.4) |
| Male N (%) | 266 (46.7) | 728 (46.2) | 551 (46.6) |
| White N (%) | 343 (82.9) | 996 (71.8) | 690 (79.9) |
| Black N (%) | 26 (6.3) | 197 (14.2) | 44 (5.1) |
| Asian N (%) | 21 (5.1) | 77 (5.6) | 59 (6.8) |
| Other N (%) | 24 (5.8) | 117 (8.4) | 71 (8.2) |
| Hispanic/Latino N (%) | 7 (3.9) | 79 (12.4) | 62 (8.5) |
| Not Hispanic/Latino N (%) | 174 (96.1) | 540 (84.6) | 668 (91.5) |
| Not Reported or Unknown N (%) | 0 (0.0) | 19 (3.0) | 0 (0.0) |
| Female PPR | 0.99 | 1 | 1 |
| Black PPR | 0.27 | 0.62 | 0.22 |
Table 5.
Sex, racial, and ethnic distribution as well as female and Black PPR by trial type.
Table 5.
Sex, racial, and ethnic distribution as well as female and Black PPR by trial type.
| Trial Type | COMBINED vs. COMBINED | COMBINED vs. CS | COMBINED vs. MIGS | MIGS ONLY | MIGS vs. MIGS | MIGS vs. TRABECULECTOMY |
|---|
| Female N (%) | 157 (51.3) | 846 (53.9) | 95 (51.4) | 270 (55.3) | 163 (55.4) | 254 (52.2) |
| Male N (%) | 149 (48.7) | 724 (46.1) | 90 (48.6) | 218 (44.7) | 131 (44.6) | 233 (47.8) |
| White N (%) | 209 (68.3) | 1040 (82.4) | 178 (96.2) | 72 (55.0) | 171 (58.2) | 359 (73.7) |
| Black N (%) | 7 (2.3) | 107 (8.5) | 3 (1.6) | 24 (18.3) | 21 (7.1) | 105 (21.6) |
| Asian N (%) | 42 (13.7) | 56 (4.4) | 4 (2.2) | 15 (11.5) | 22 (7.5) | 18 (3.7) |
| Other N (%) | 48 (15.7) | 59 (4.7) | 0 (0.0) | 20 (15.3) | 80 (27.2) | 5 (1.0) |
| Hispanic/Latino N (%) | 46 (15.0) | 23 (3.8) | N/A | 20 (22.0) | 27 (17.8) | 32 (8.1) |
| Not Hispanic/Latino N (%) | 260 (85.0) | 582 (96.2) | N/A | 52 (57.1) | 125 (82.2) | 363 (91.9) |
| Not Reported or Unknown N (%) | 0 (0.0) | 0 (0.0) | N/A | 19 (20.9) | 0 (0.0) | 0 (0.0) |
| Female PPR | 0.96 | 1 | 0.96 | 1.03 | 1.03 | 0.97 |
| Black PPR | 0.1 | 0.37 | 0.07 | 0.8 | 0.31 | 0.94 |
Table 6.
Sex, racial, and ethnic distribution, as well as female and Black PPR by region.
Table 6.
Sex, racial, and ethnic distribution, as well as female and Black PPR by region.
| Region | Europe | Multi-Regional | North America | Oceania | Unknown |
|---|
| Female N (%) | 283 (54.6) | 709 (54.4) | 302 (55.1) | 33 (32.7) | 458 (53.3) |
| Male N (%) | 235 (45.4) | 595 (45.6) | 246 (44.9) | 68 (67.3) | 401 (46.7) |
| White N (%) | 131 (93.6) | 1006 (77.1) | 184 (59.5) | 77 (76.2) | 631 (77.8) |
| Black N (%) | 4 (2.9) | 160 (12.3) | 49 (15.9) | 0 (0.0) | 54 (6.7) |
| Asian N (%) | 3 (2.1) | 56 (4.3) | 33 (10.7) | 17 (16.8) | 48 (5.9) |
| Other N (%) | 2 (1.4) | 82 (6.3) | 43 (13.9) | 7 (6.9) | 78 (9.6) |
| Hispanic/Latino N (%) | 1 (1.0) | 39 (9.3) | 40 (18.4) | N/A | 68 (8.4) |
| Not Hispanic/Latino N (%) | 99 (99.0) | 363 (86.2) | 177 (81.6) | N/A | 743 (91.6) |
| Not Reported or Unknown N (%) | 0 (0.0) | 19 (4.5) | 0 (0.0) | N/A | 0 (0.0) |
| Female PPR | 1.02 | 1.01 | 1.03 | 0.61 | 0.99 |
| Black PPR | 0.12 | 0.53 | 0.69 | 0 | 0.29 |
Table 7.
Sex, racial, and ethnic distribution, as well as female and Black PPR by sponsor type.
Table 7.
Sex, racial, and ethnic distribution, as well as female and Black PPR by sponsor type.
| Sponsor Type | Collaborators | Medical Center or University | Medical Device Company |
|---|
| Female N (%) | 56 (40.9) | 61 (46.2) | 1668 (54.5) |
| Male N (%) | 81 (59.1) | 71 (53.8) | 1393 (45.5) |
| White N (%) | 77 (76.2) | 82 (62.1) | 1870 (76.9) |
| Black N (%) | 0 (0.0) | 38 (28.8) | 229 (9.4) |
| Asian N (%) | 17 (16.8) | 10 (7.6) | 130 (5.3) |
| Other N (%) | 7 (6.9) | 2 (1.5) | 203 (8.3) |
| Hispanic/Latino N (%) | N/A | N/A | 148 (9.6) |
| Not Hispanic/Latino N (%) | N/A | N/A | 1382 (89.2) |
| Not Reported or Unknown N (%) | N/A | N/A | 19 (1.2) |
| Female PPR | 0.76 | 0.86 | 1.01 |
| Black PPR | 0 | 1.25 | 0.41 |


