Figure 1.
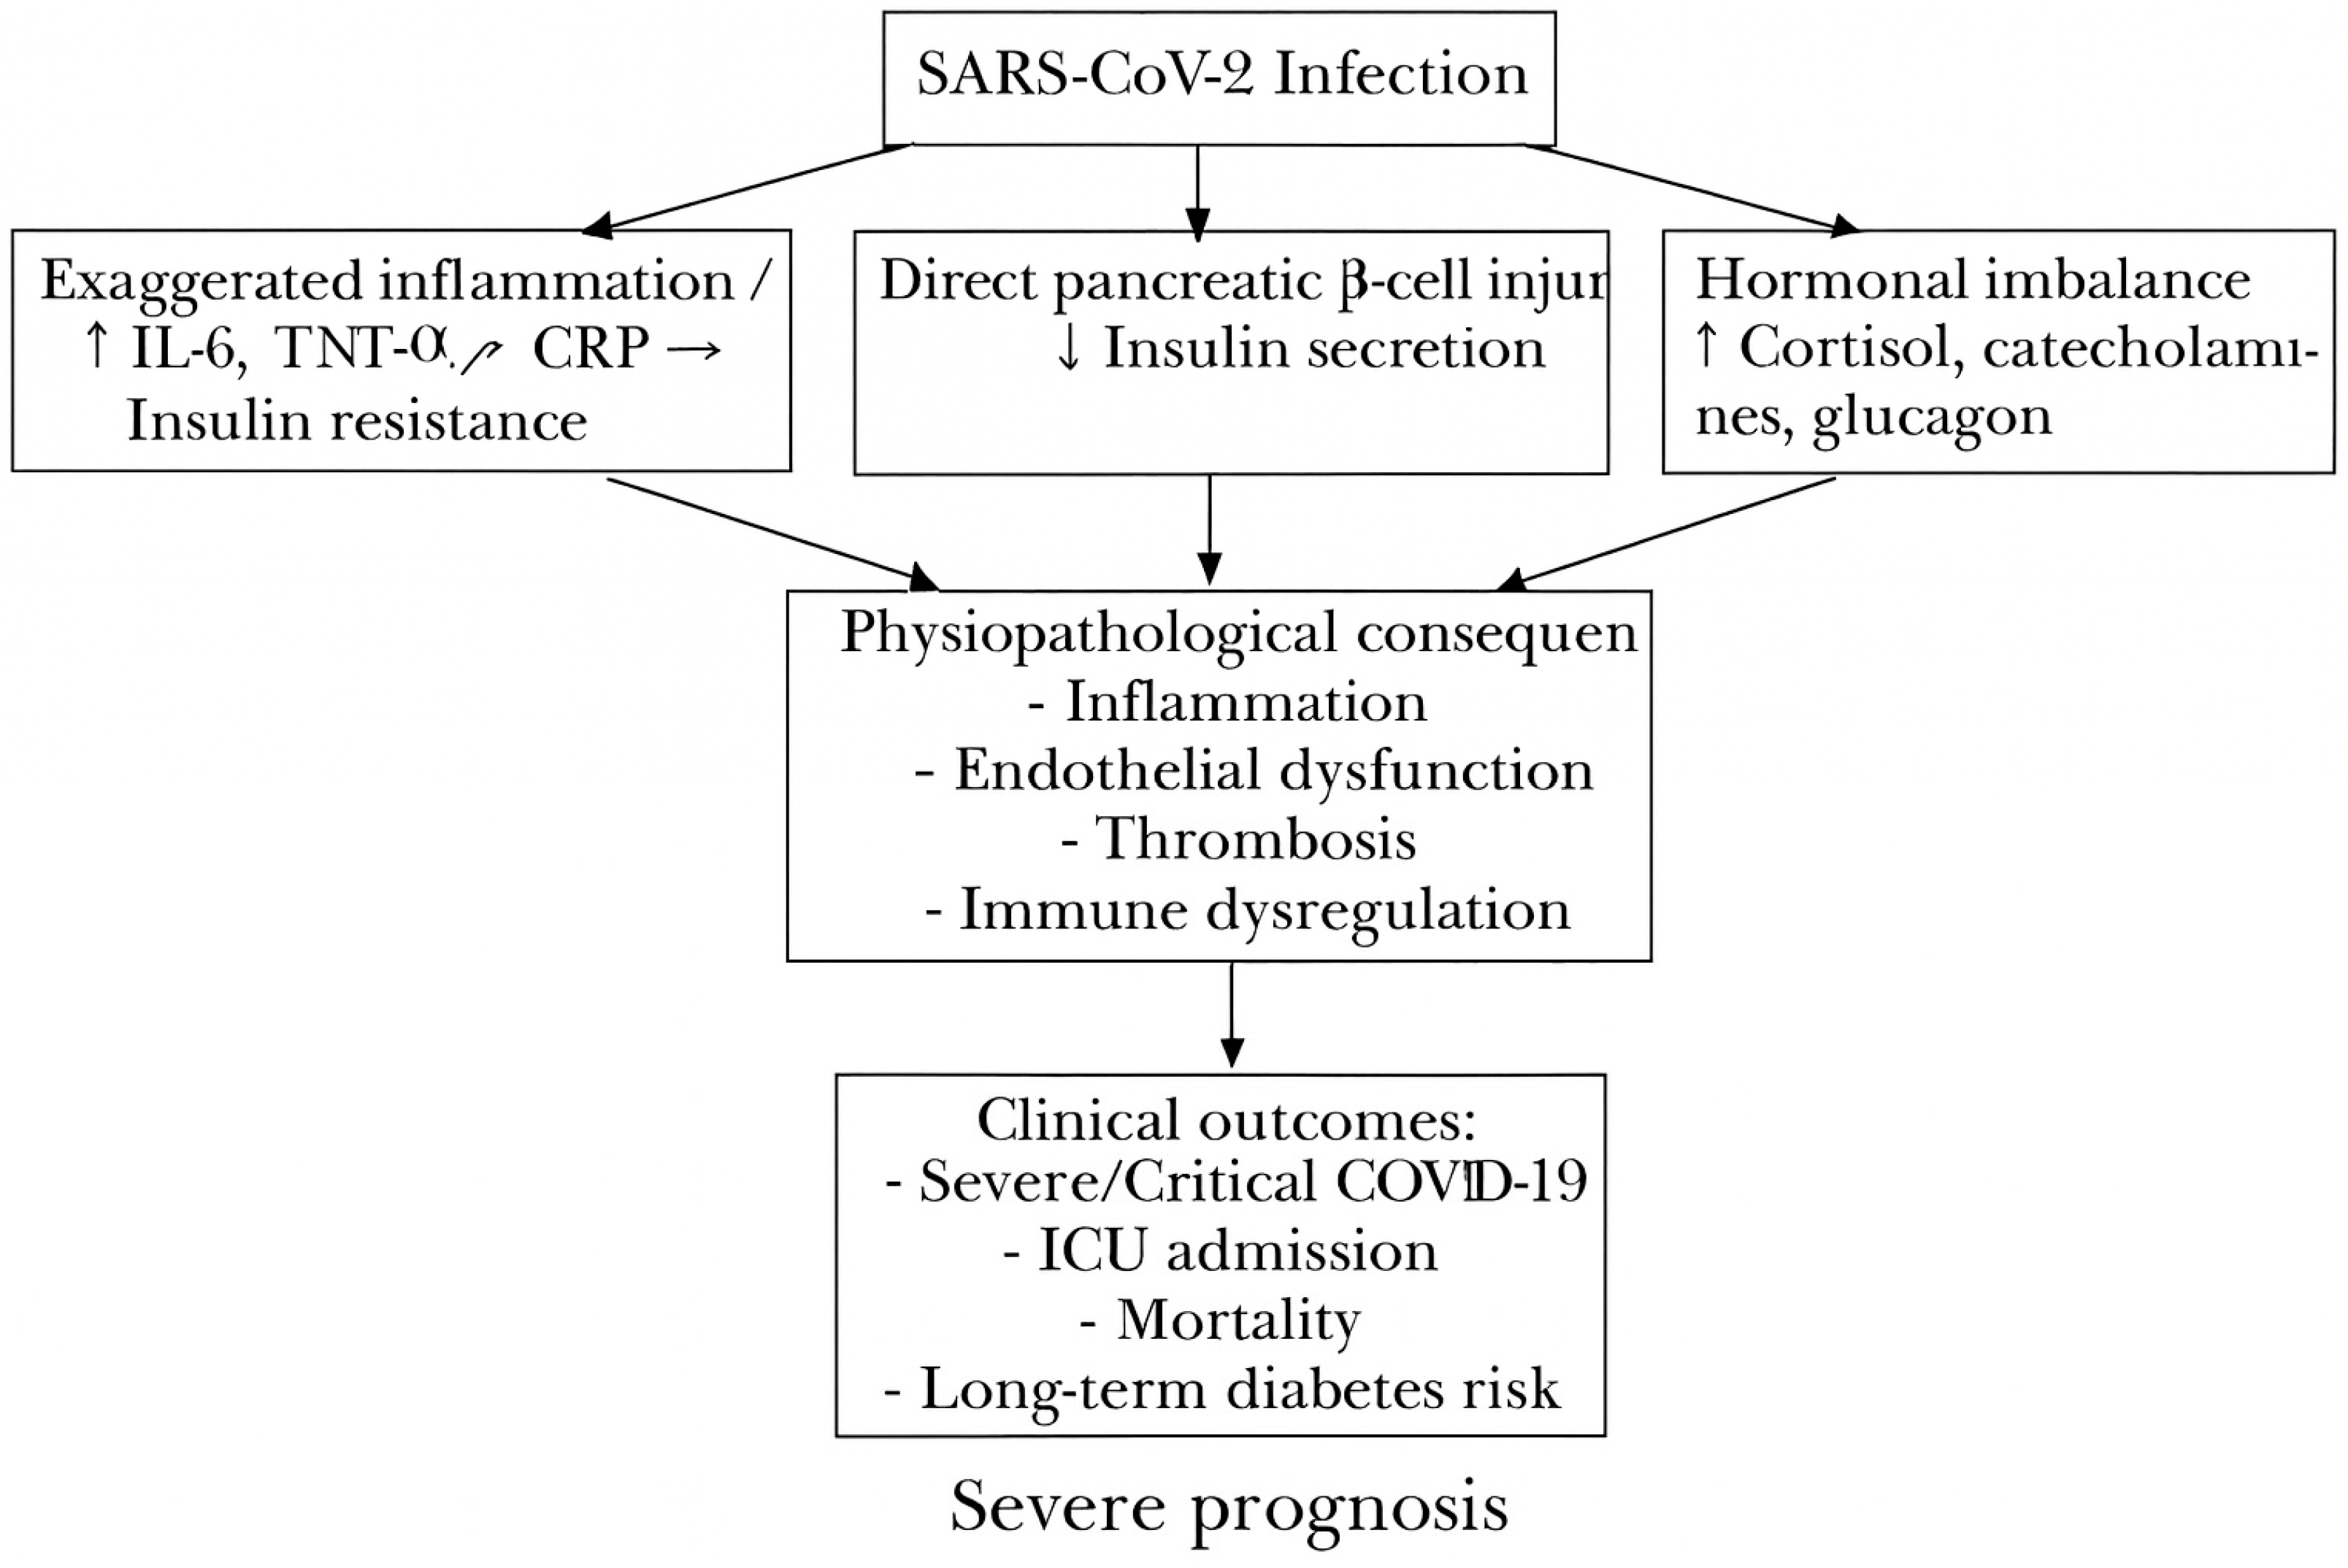
Proposed pathophysiological mechanisms linking SARS-CoV-2 infection to admission hyperglycemia, its systemic consequences (inflammation, endothelial dysfunction, thrombosis, immune dysregulation), and adverse clinical outcomes (severe COVID-19, ICU admission, mortality, long-term diabetes risk). Exaggerated inflammation (↑ IL-6, TNF-α, CRP) → Increased insulin resistance.
Figure 2.
Changes in glycemic status from admission to discharge among patients with COVID19. Legend: Flowchart illustrating the evolution of glycemic status from admission to discharge among 1009 patients with COVID-19.
Figure 2.
Changes in glycemic status from admission to discharge among patients with COVID19. Legend: Flowchart illustrating the evolution of glycemic status from admission to discharge among 1009 patients with COVID-19.
Figure 3.
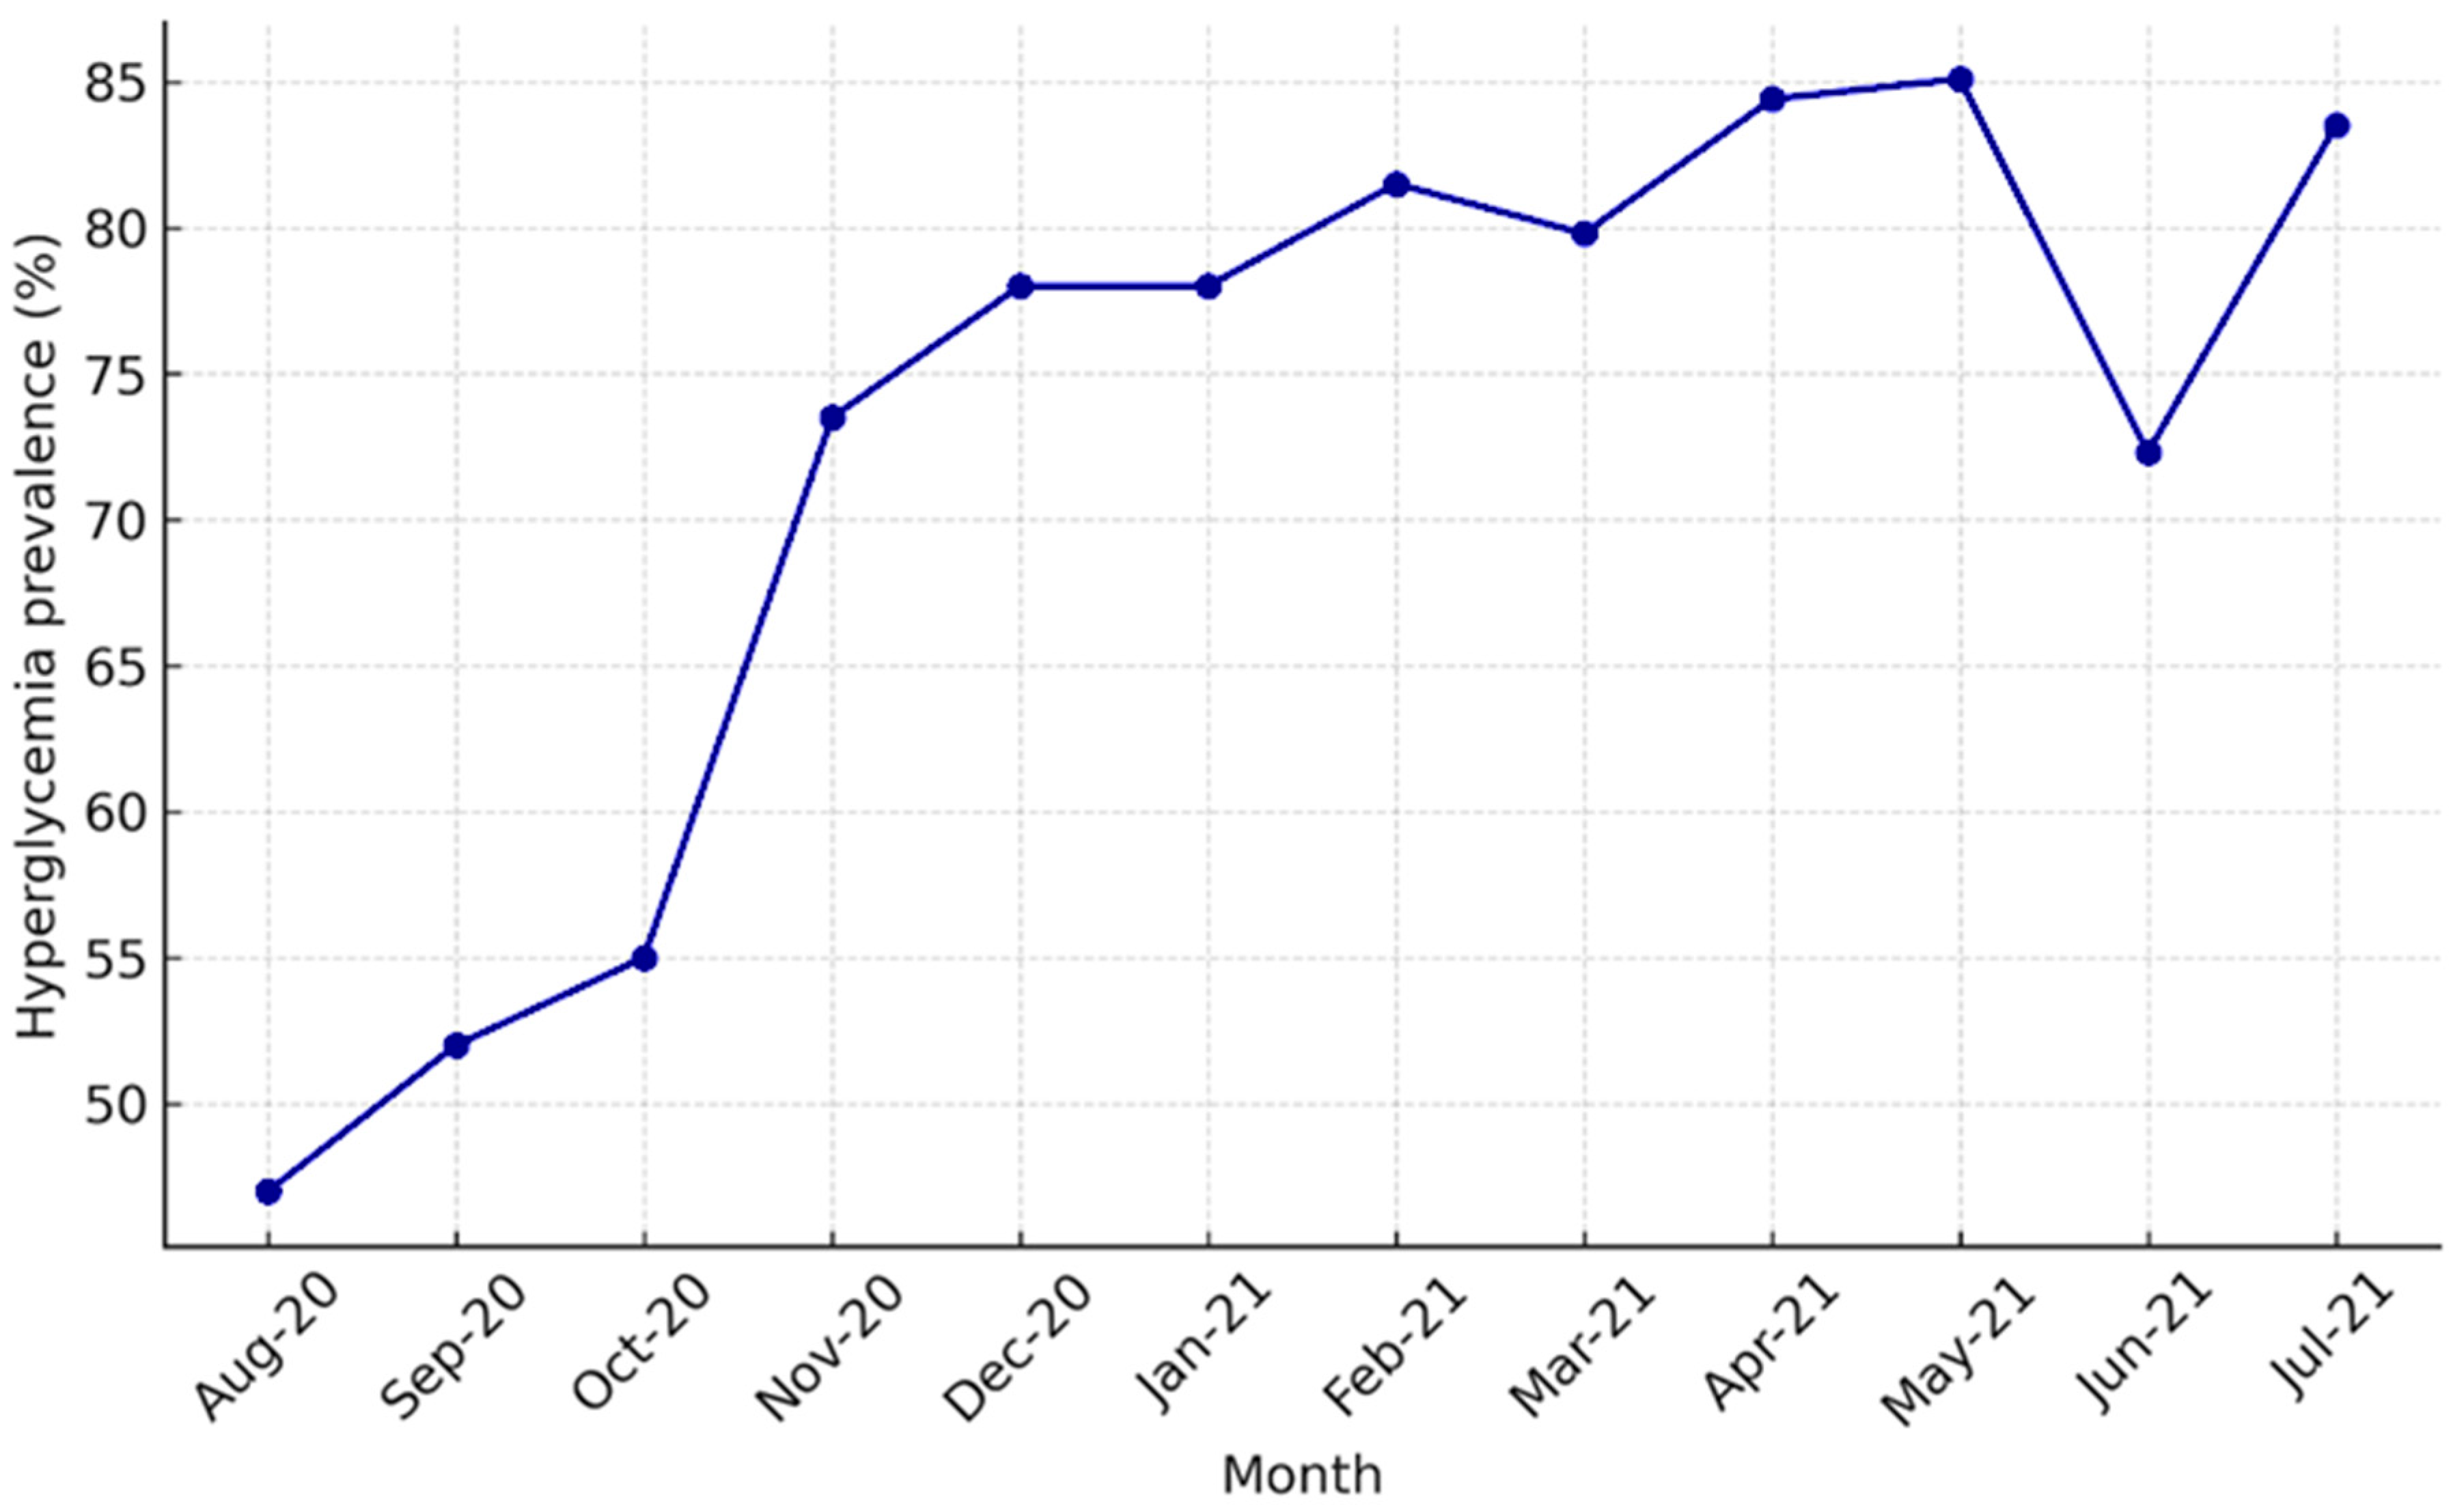
Monthly prevalence of admission hyperglycemia among hospitalized COVID-19 patients. Legend: Monthly prevalence of admission hyperglycemia among hospitalized COVID-19 patients between August 2020 and July 2021. A marked increase was observed in November 2020 (second pandemic wave) and between February–May 2021 (Alpha wave).
Figure 4.
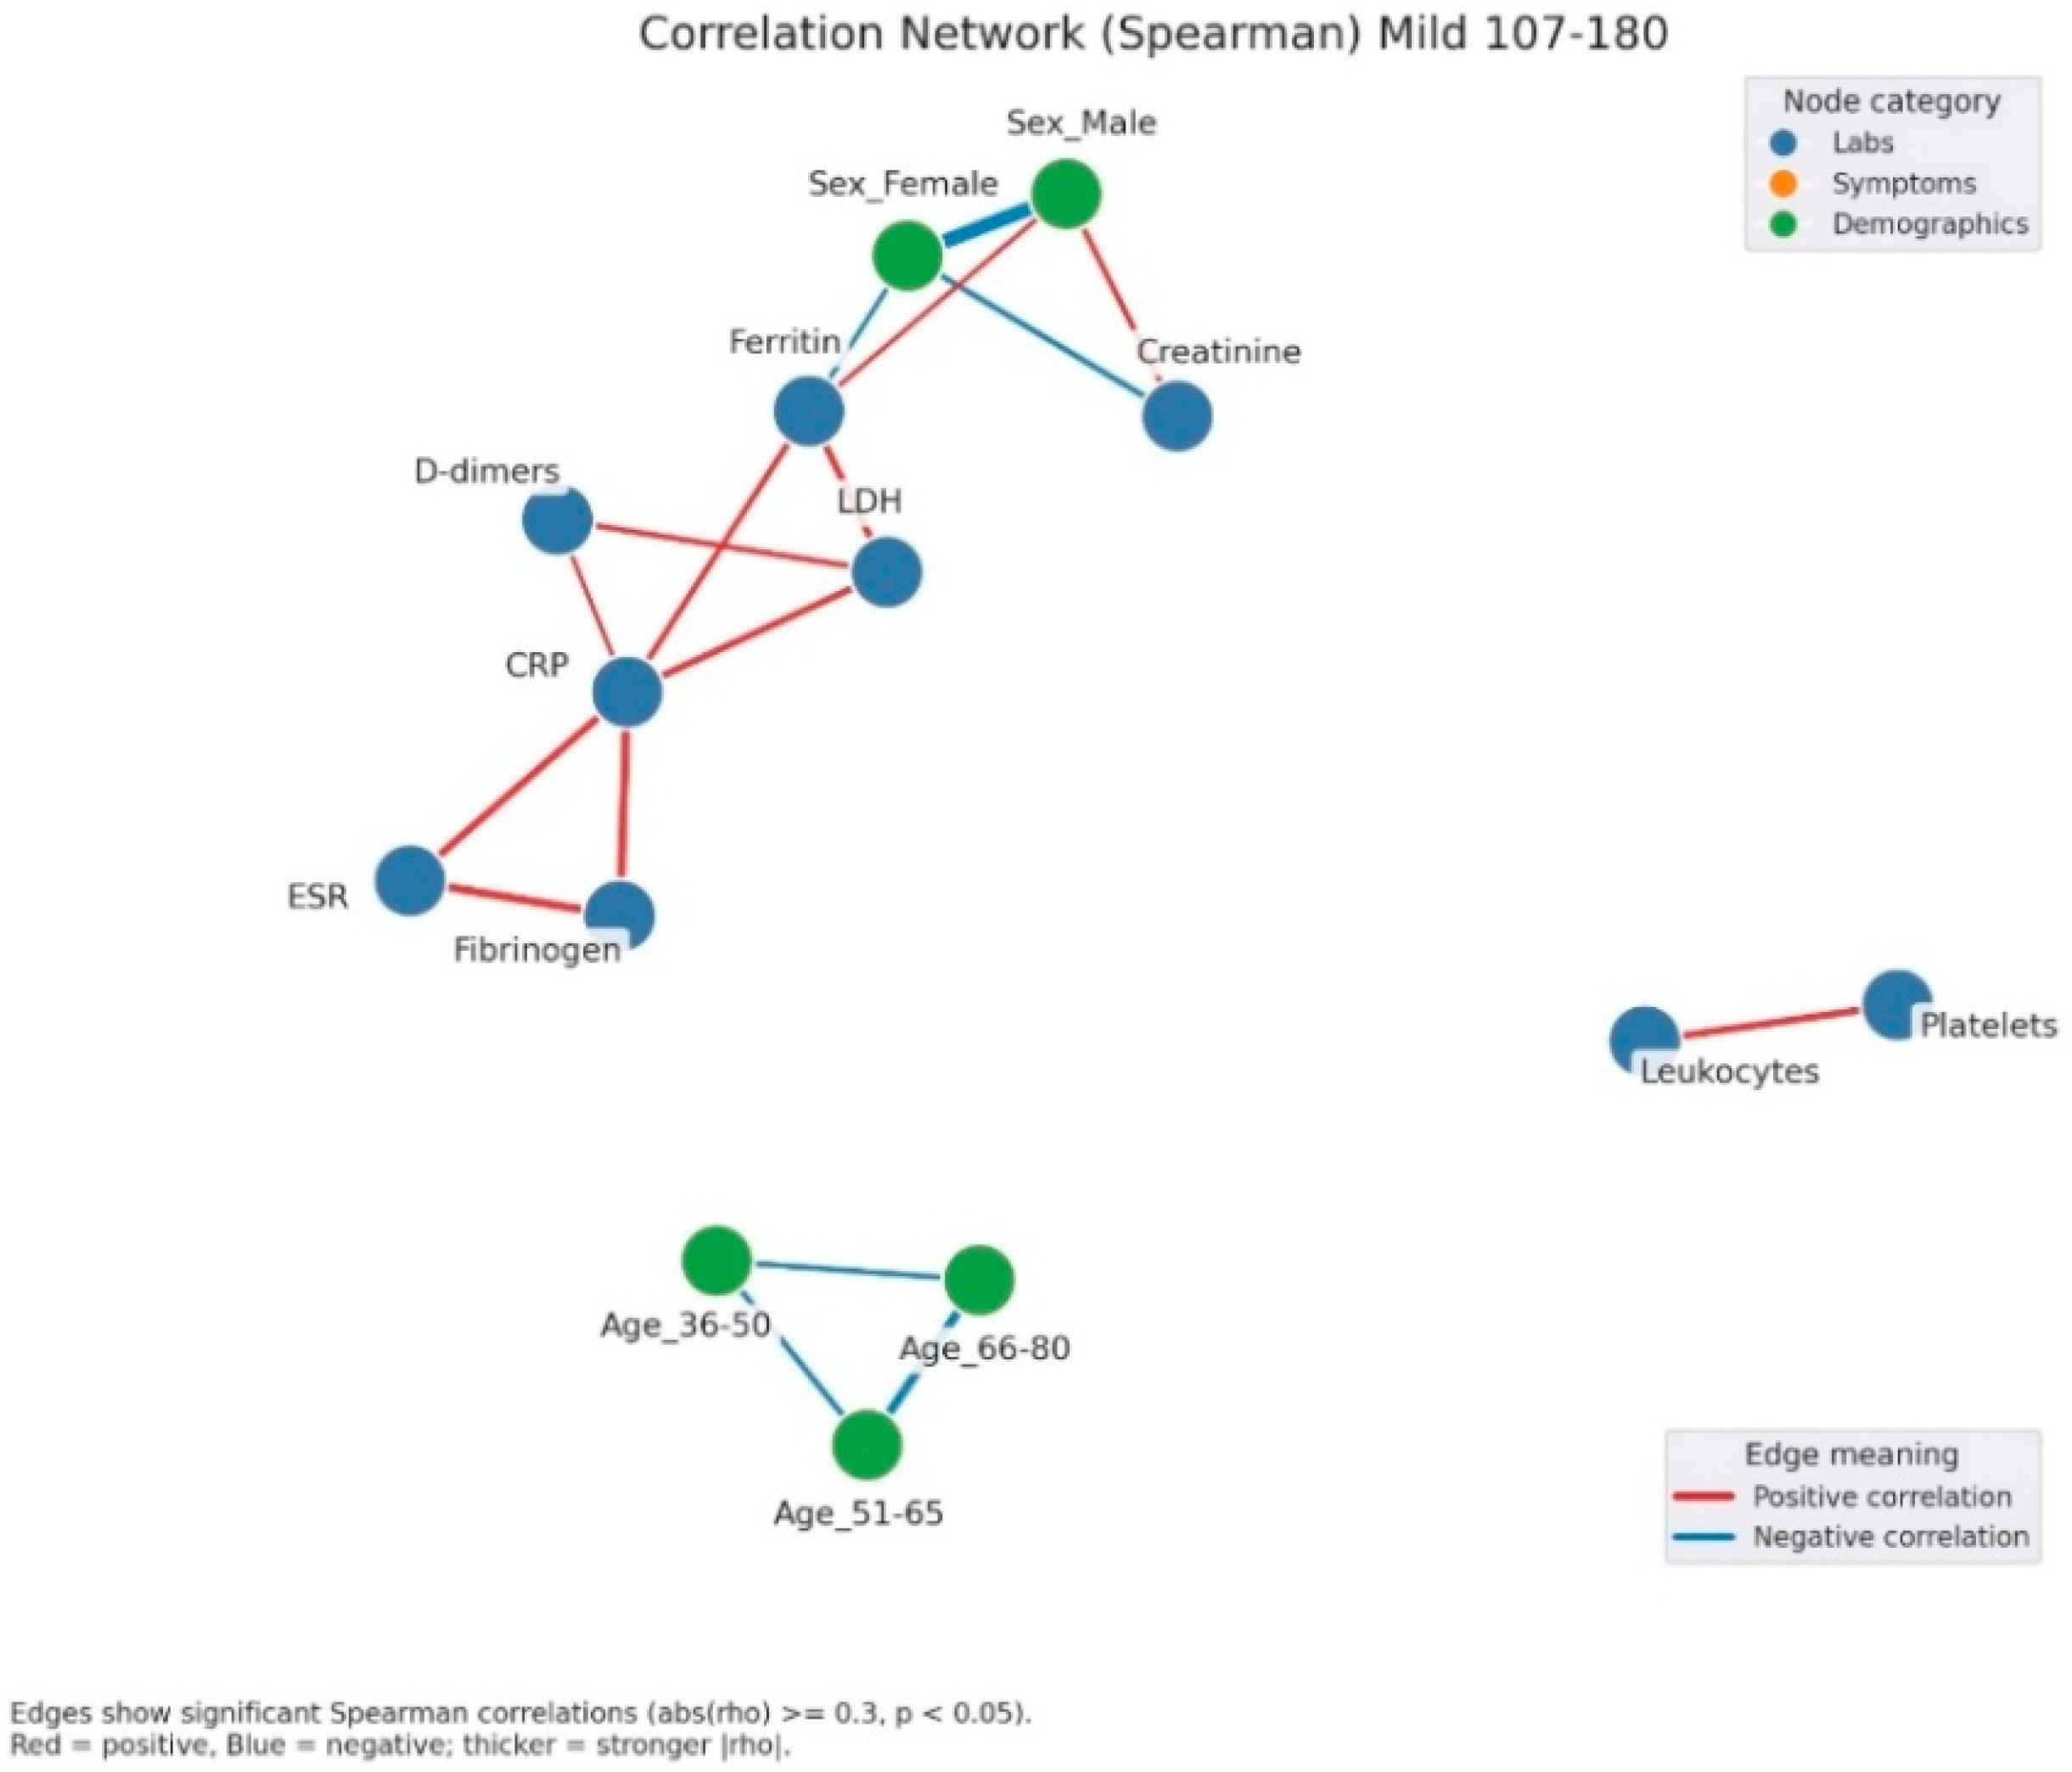
Correlation network of clinical, laboratory, and demographic parameters in patients with mild admission hyperglycemia (107–180 mg/dL). Legend: The network illustrates significant correlations (|ρ| ≥ 0.3, p < 0.05) between laboratory parameters (blue nodes) and demographic factors (green nodes). Red edges = positive correlations, blue edges = negative correlations. Edge thickness reflects correlation strength. A well-defined inflammatory cluster can be observed, linking CRP, fibrinogen, D-dimers, LDH, ferritin, and ESR, with strong positive interconnections among these markers. Male sex shows a negative correlation with ferritin and a positive one with creatinine, suggesting sex-related differences in the biological response to infection. In the lower part, age-related variables form a small group of negative correlations, reflecting the distinct distribution of age subgroups.
Figure 5.
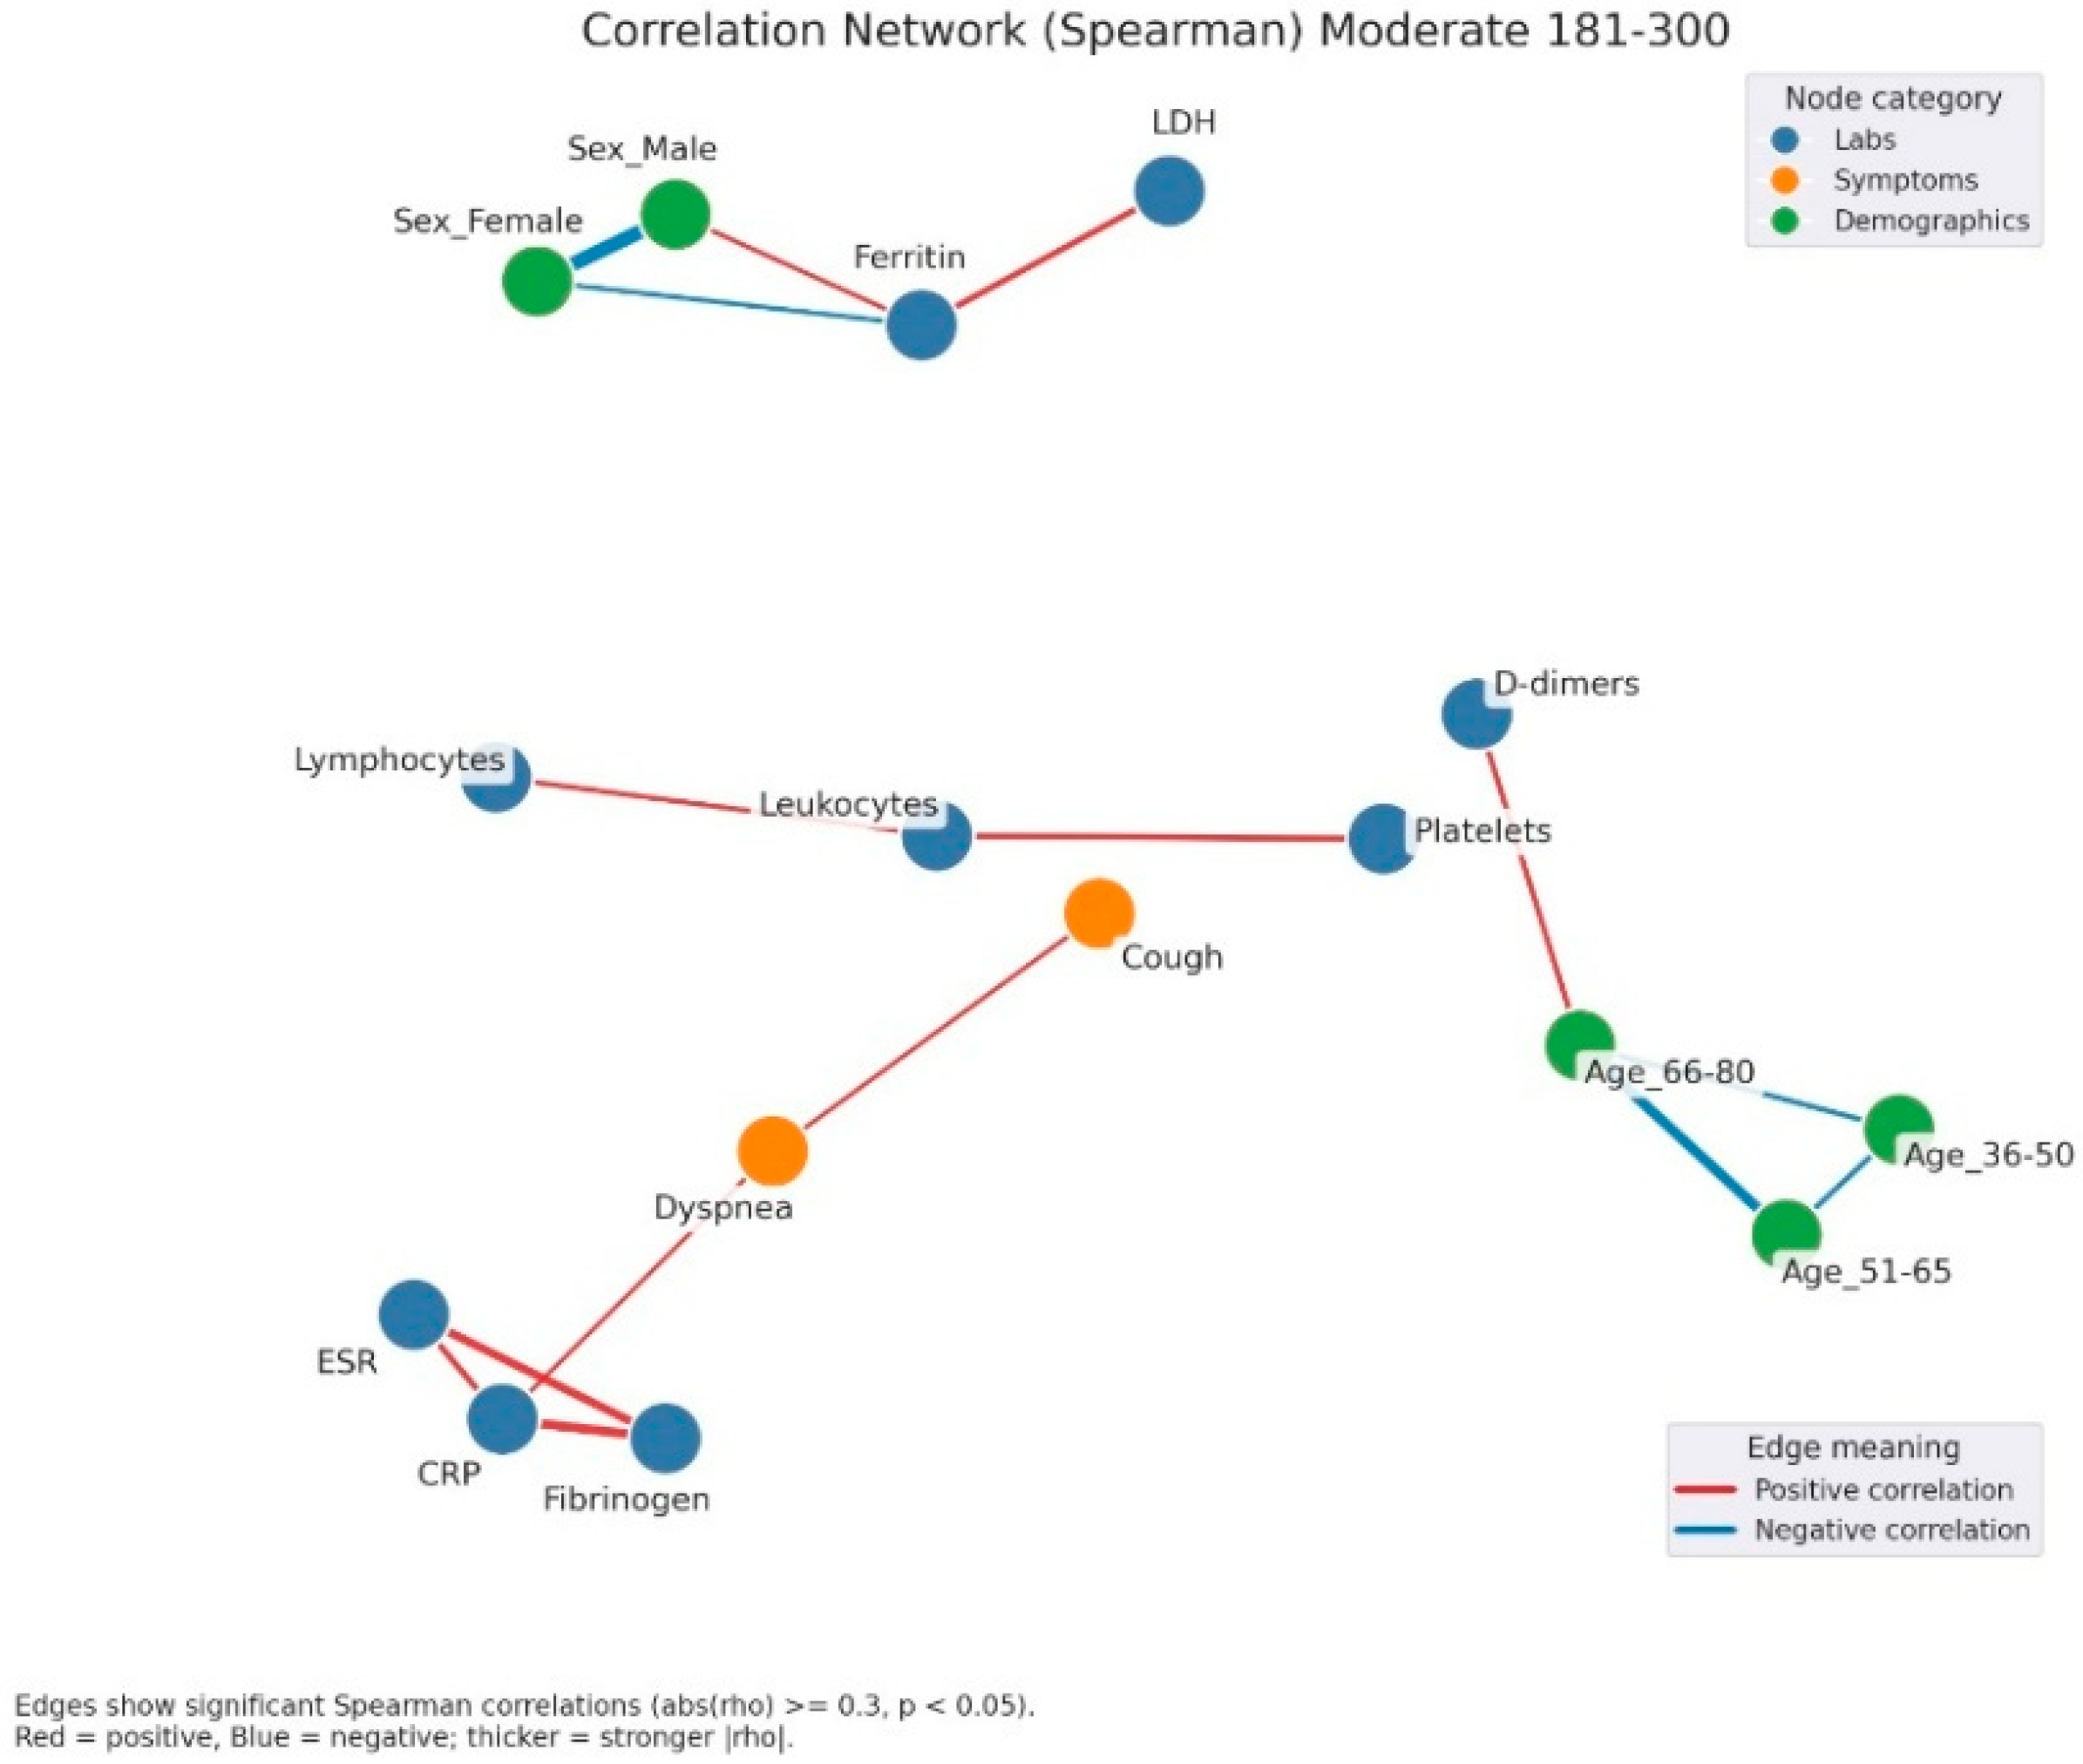
Correlation network of clinical, laboratory, and demographic parameters in patients with moderate admission hyperglycemia (181–300 mg/dL). Legend: Correlation network in patients with moderate hyperglycemia (181–300 mg/dL). Nodes represent laboratory parameters (blue), symptoms (orange), and demographic factors (green). Edges indicate significant Spearman correlations (|rho| ≥ 0.3, p < 0.05). Red edges = positive correlations; blue edges = negative correlations. Edge thickness reflects correlation strength. The network here shows a stronger integration between inflammation and clinical manifestations. A dense cluster connects CRP, fibrinogen, and ESR, all positively correlated, and extending toward symptoms such as dyspnea and cough, suggesting the link between systemic inflammation and respiratory impairment. Leukocytes and lymphocytes are interconnected, with further links to cough and platelet count, reflecting immune activation. Ferritin shows positive correlations with LDH and male sex, again pointing to sex-related variations in inflammatory response.
![Jcm 14 07289 g005 Jcm 14 07289 g005]()
Figure 6.
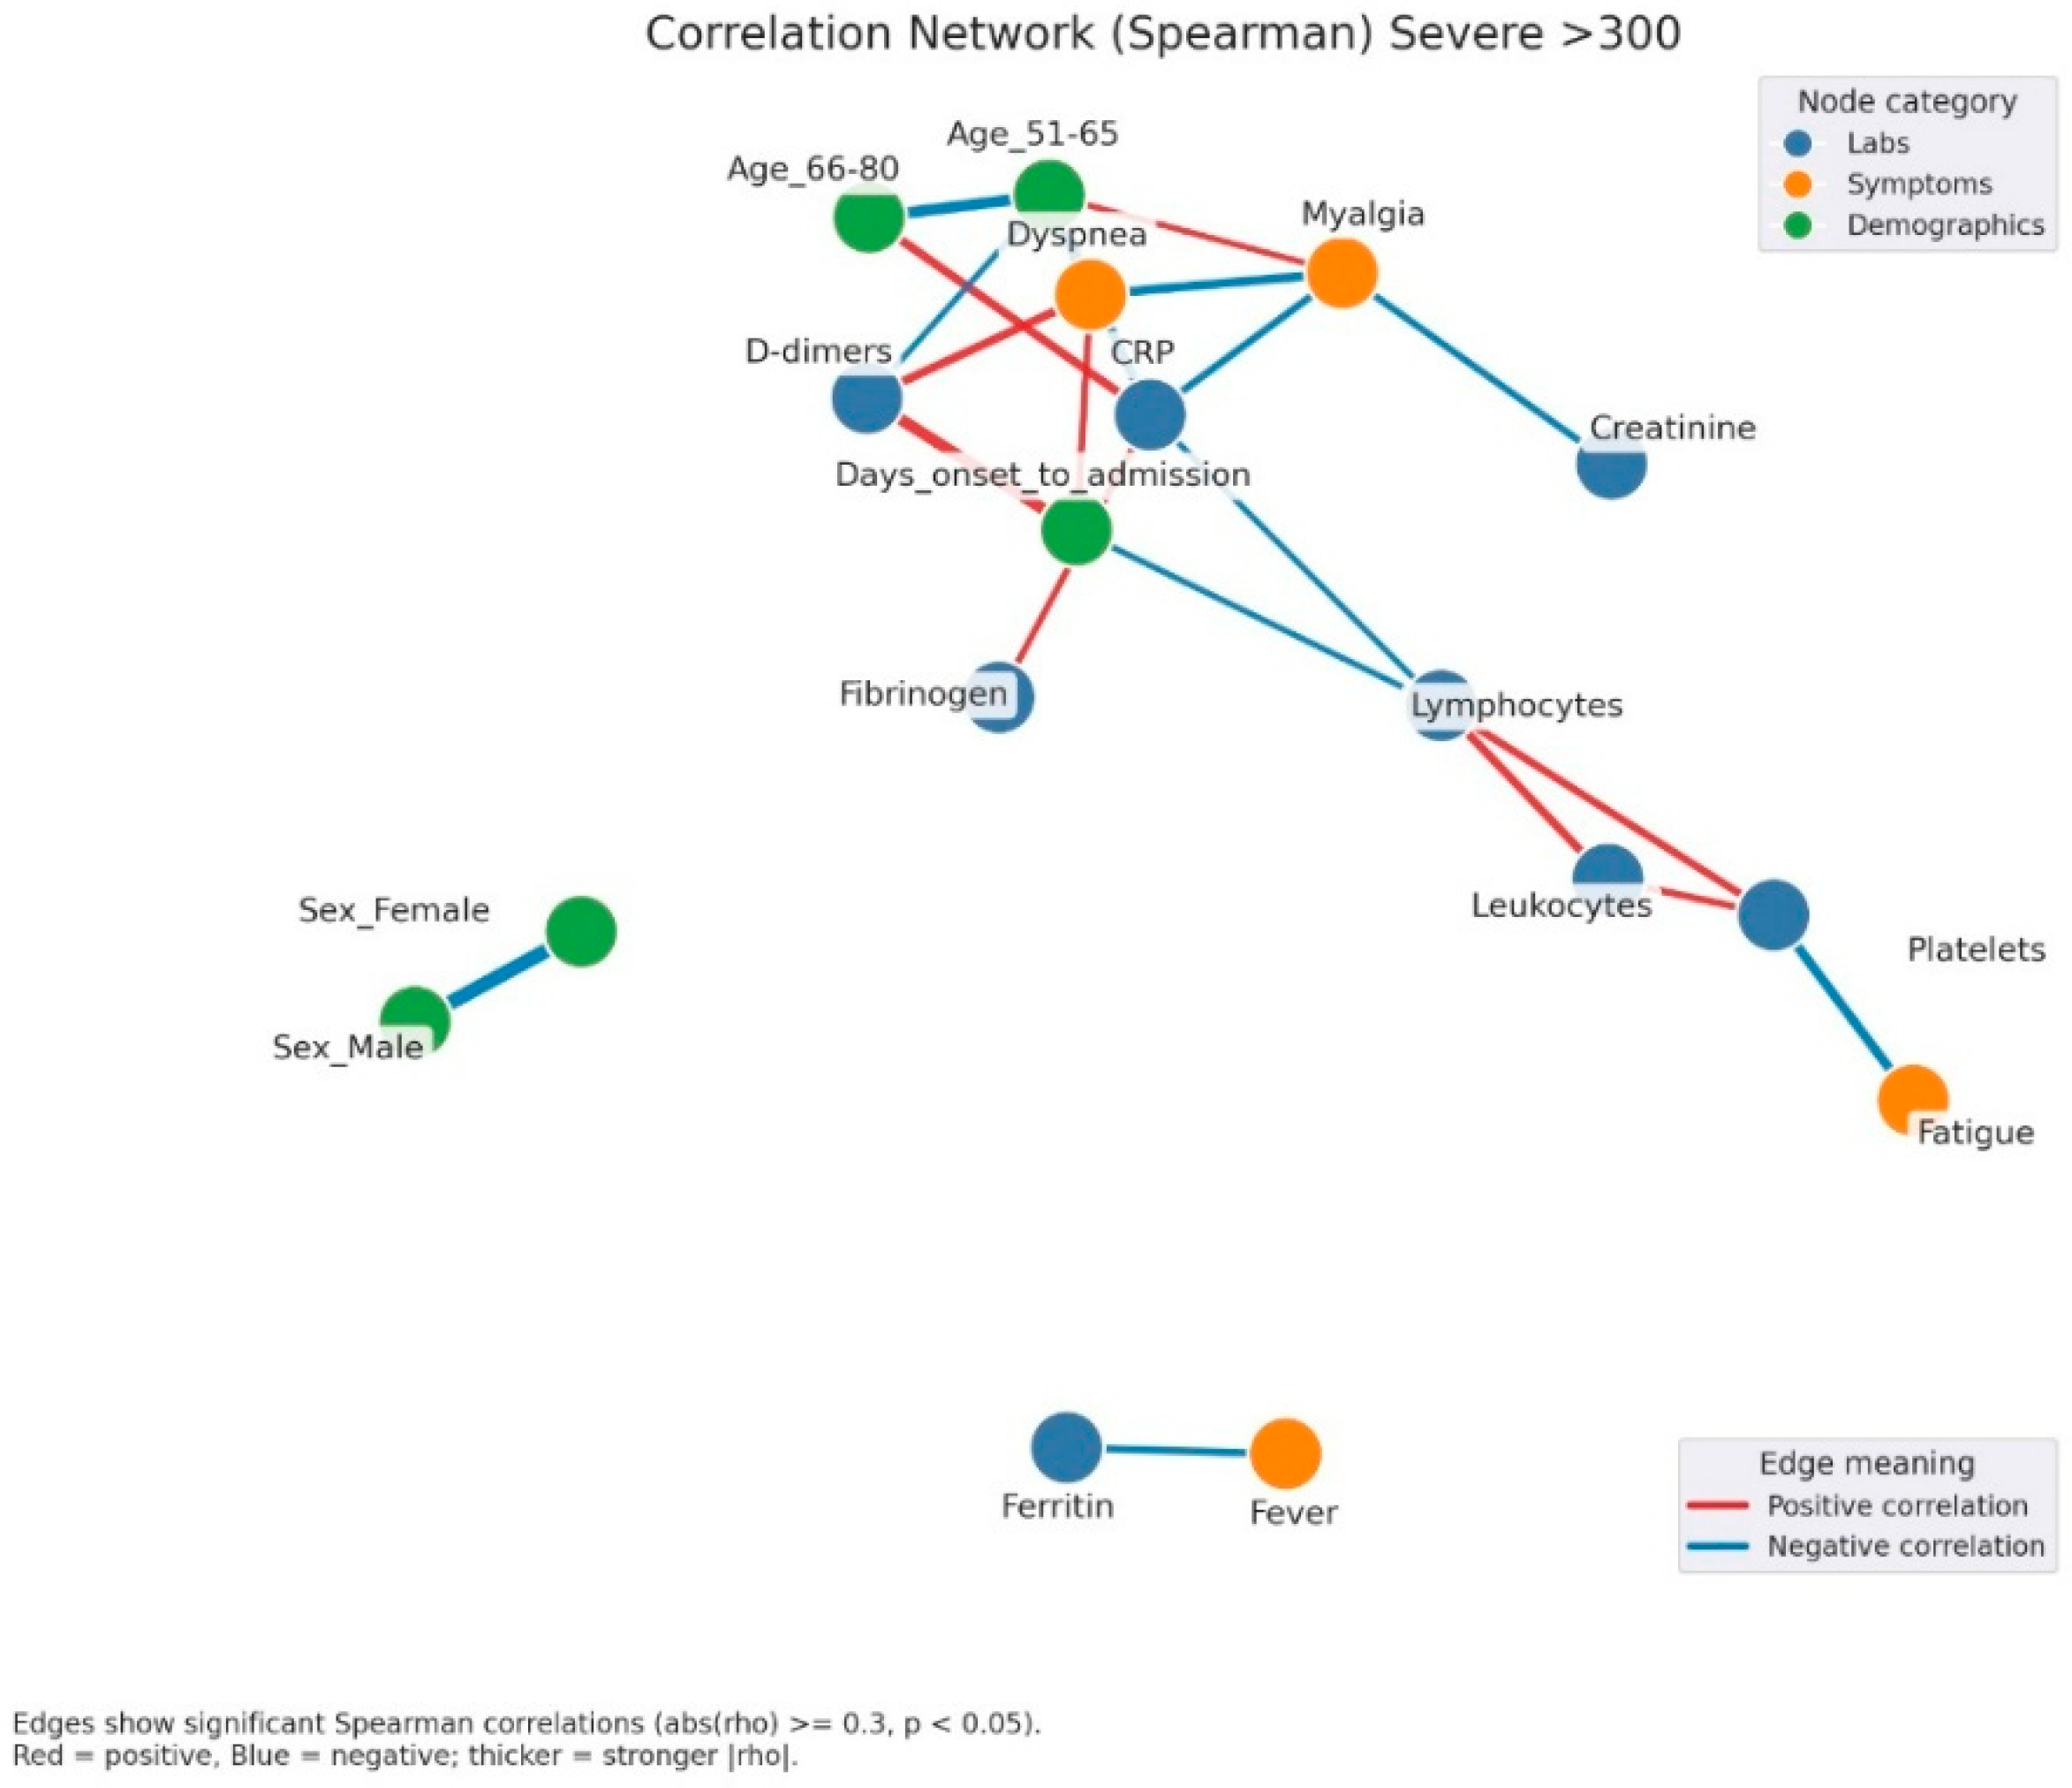
Correlation network of clinical, laboratory, and demographic parameters in patients with severe admission hyperglycemia (>300 mg/dL). Legend: Correlation network in patients with severe hyperglycemia (glucose > 300 mg/dL). Nodes represent clinical variables, categorized as laboratory parameters (blue), symptoms (orange), or demographic factors (green). Edges indicate significant Spearman correlations (|rho| ≥ 0.3, p < 0.05). Red edges = positive correlations; blue edges = negative correlations. Thicker edges = stronger correlation strength. A complex and highly interconnected cluster is evident, linking CRP, fibrinogen, D-dimers, and dyspnea, which also correlate with myalgia and the duration from symptom onset to hospital admission. This pattern suggests that the inflammatory burden and delayed presentation are key contributors to disease severity. Lymphocyte and leukocyte counts show opposite trends, with negative correlations to inflammatory markers, reflecting immune exhaustion and dysregulation typical of severe infection. Additionally, fatigue and platelet count form another small cluster, possibly associated with endothelial dysfunction and systemic inflammation. The separation of ferritin and fever into an isolated subnetwork may reflect late-phase inflammatory activity.
![Jcm 14 07289 g006 Jcm 14 07289 g006]()
Figure 7.
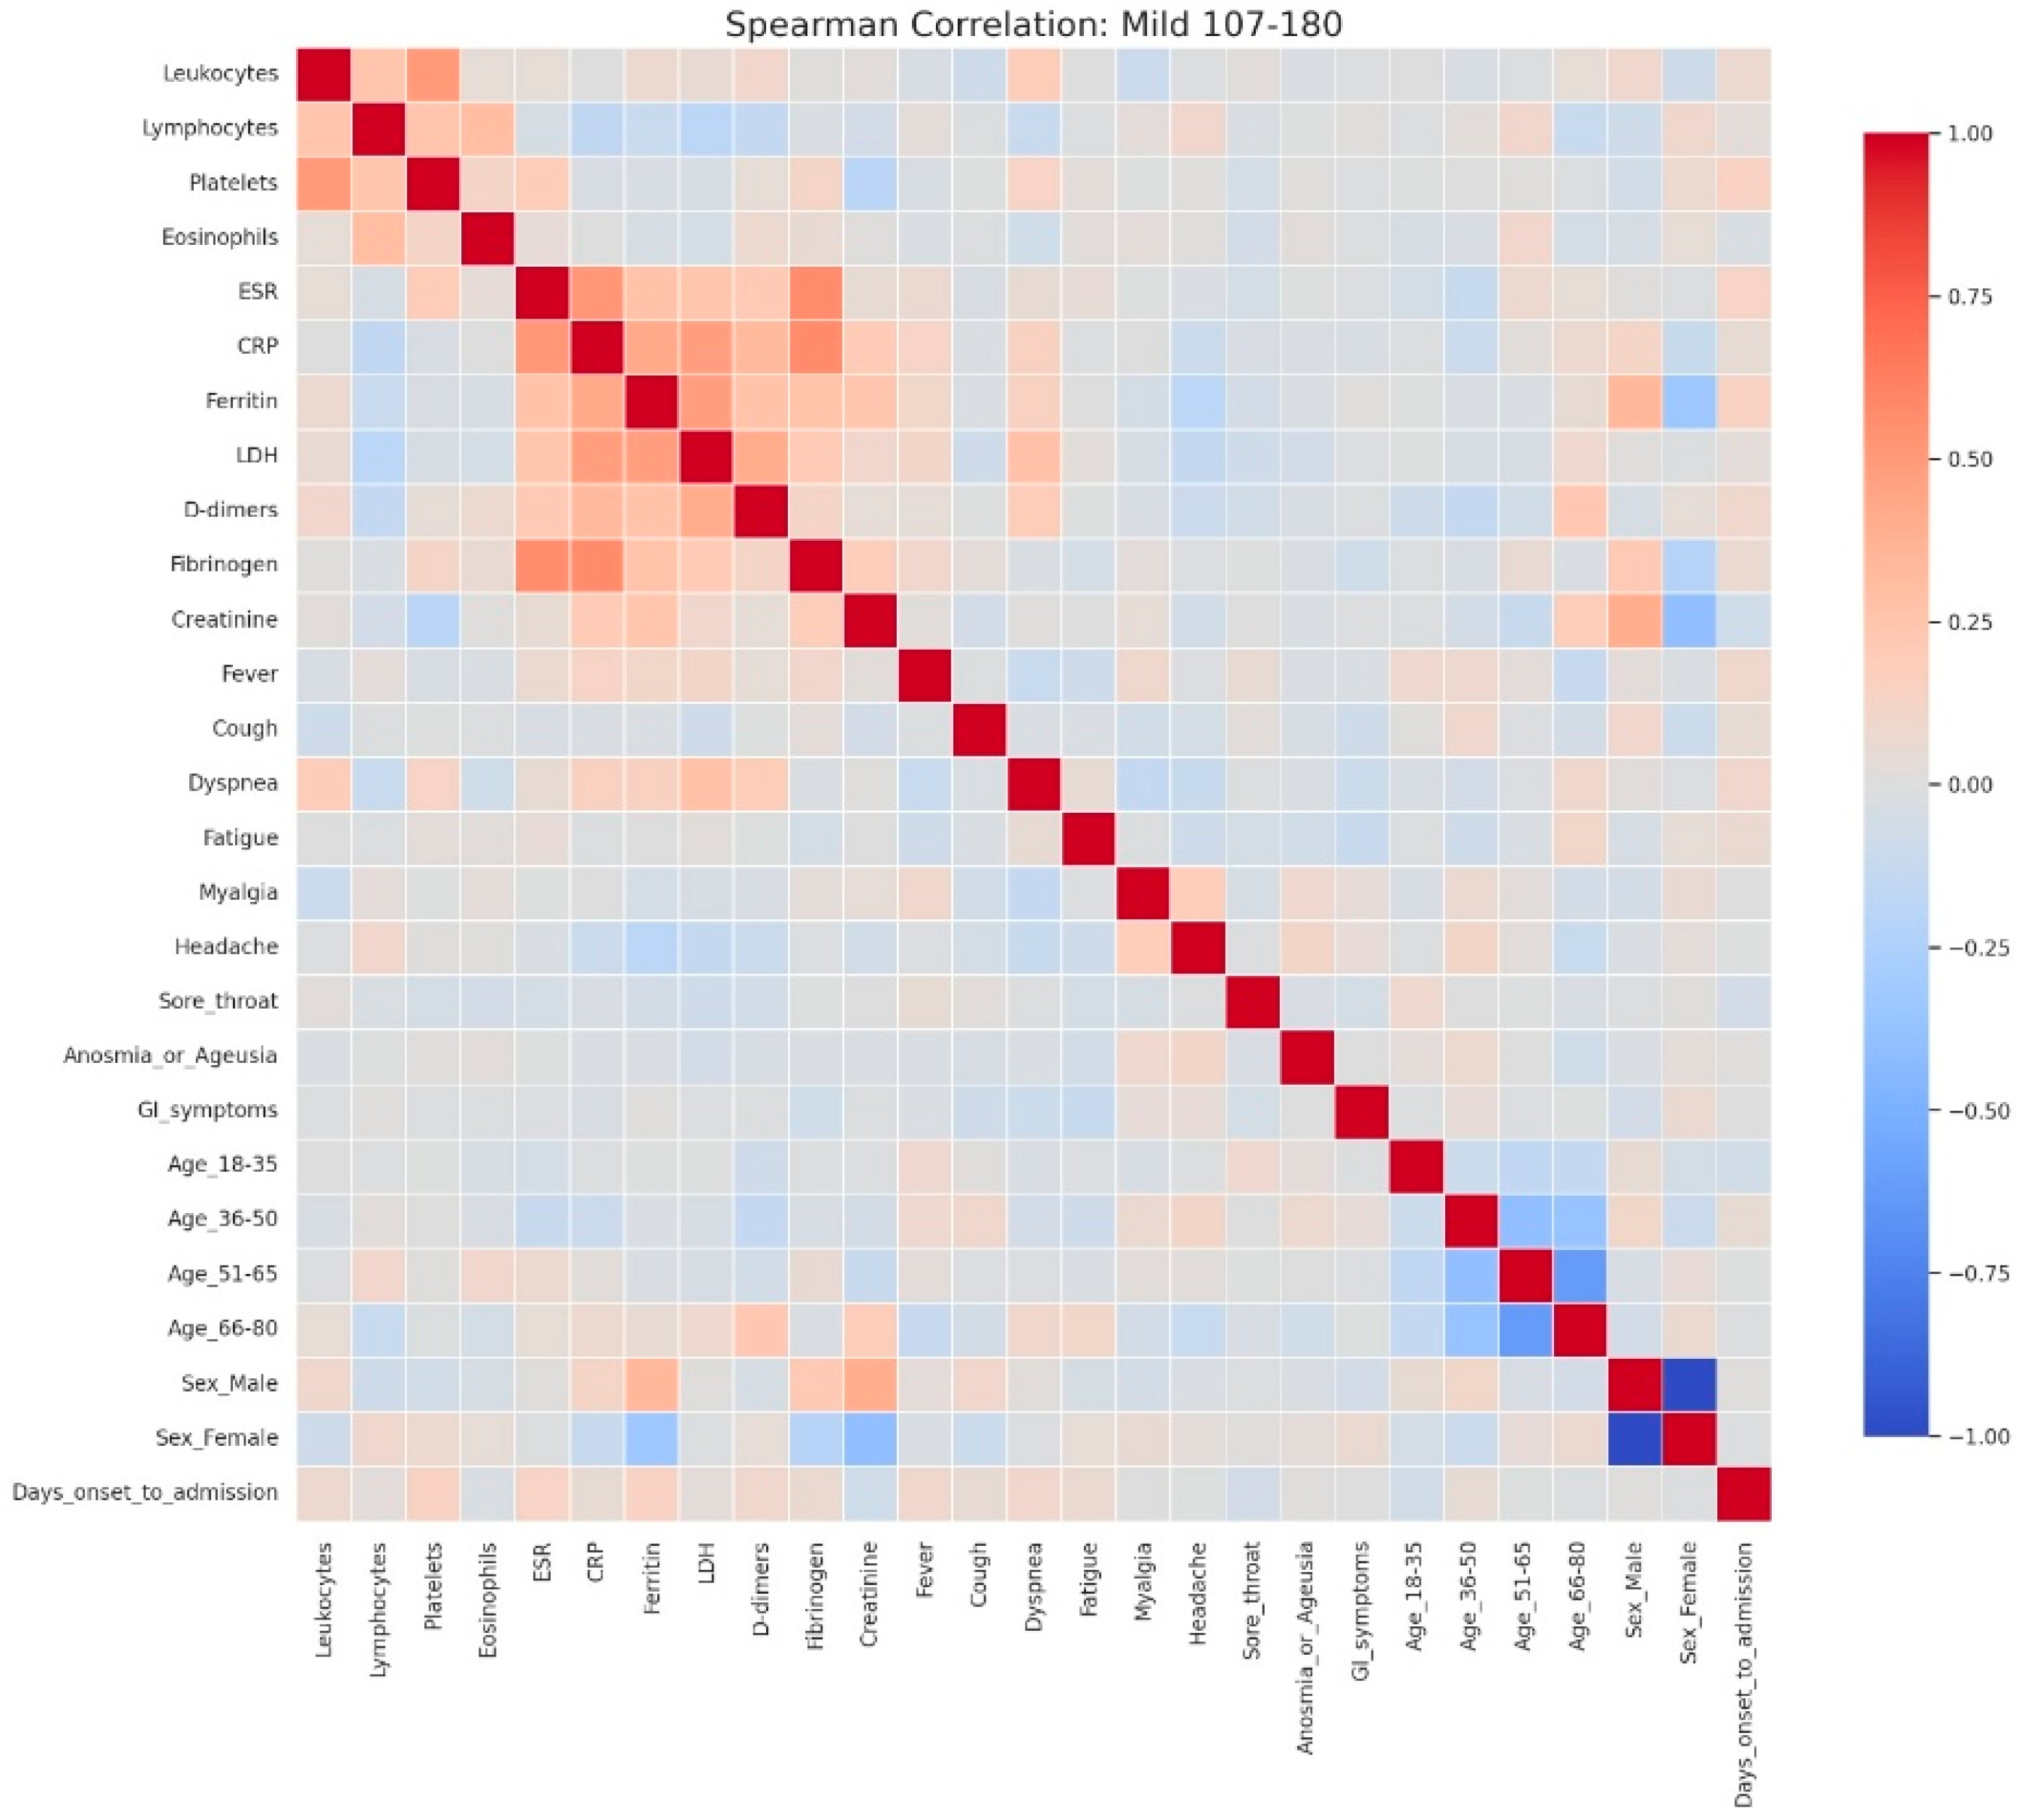
Spearman correlation heatmap of clinical, laboratory, and demographic parameters in patients with mild admission hyperglycemia (107–180 mg/dL). Legend: Clinical, demographic, and laboratory variables are displayed along both axes. Color intensity reflects correlation strength and direction (red = positive, blue = negative, neutral associations shown in light gray). The heatmap shows moderate positive correlations among inflammatory markers, including CRP, ESR, fibrinogen, LDH, ferritin, and D-dimers, reflecting the low-grade but coordinated inflammatory response even in mild disease. A weak positive relationship between leukocyte count and platelets is also observed, consistent with mild systemic activation.Demographic variables show limited correlation with laboratory parameters, though male sex is weakly associated with higher ferritin levels, while female sex and younger age groups show slight inverse correlations. The age subgroups display mutual negative correlations, as expected due to categorical separation.No strong links are seen between inflammatory markers and clinical symptoms in mild cases, suggesting that symptom burden (e.g., cough, fatigue, sore throat) may not directly mirror measurable systemic inflammation at this disease stage.
![Jcm 14 07289 g007 Jcm 14 07289 g007]()
Figure 8.
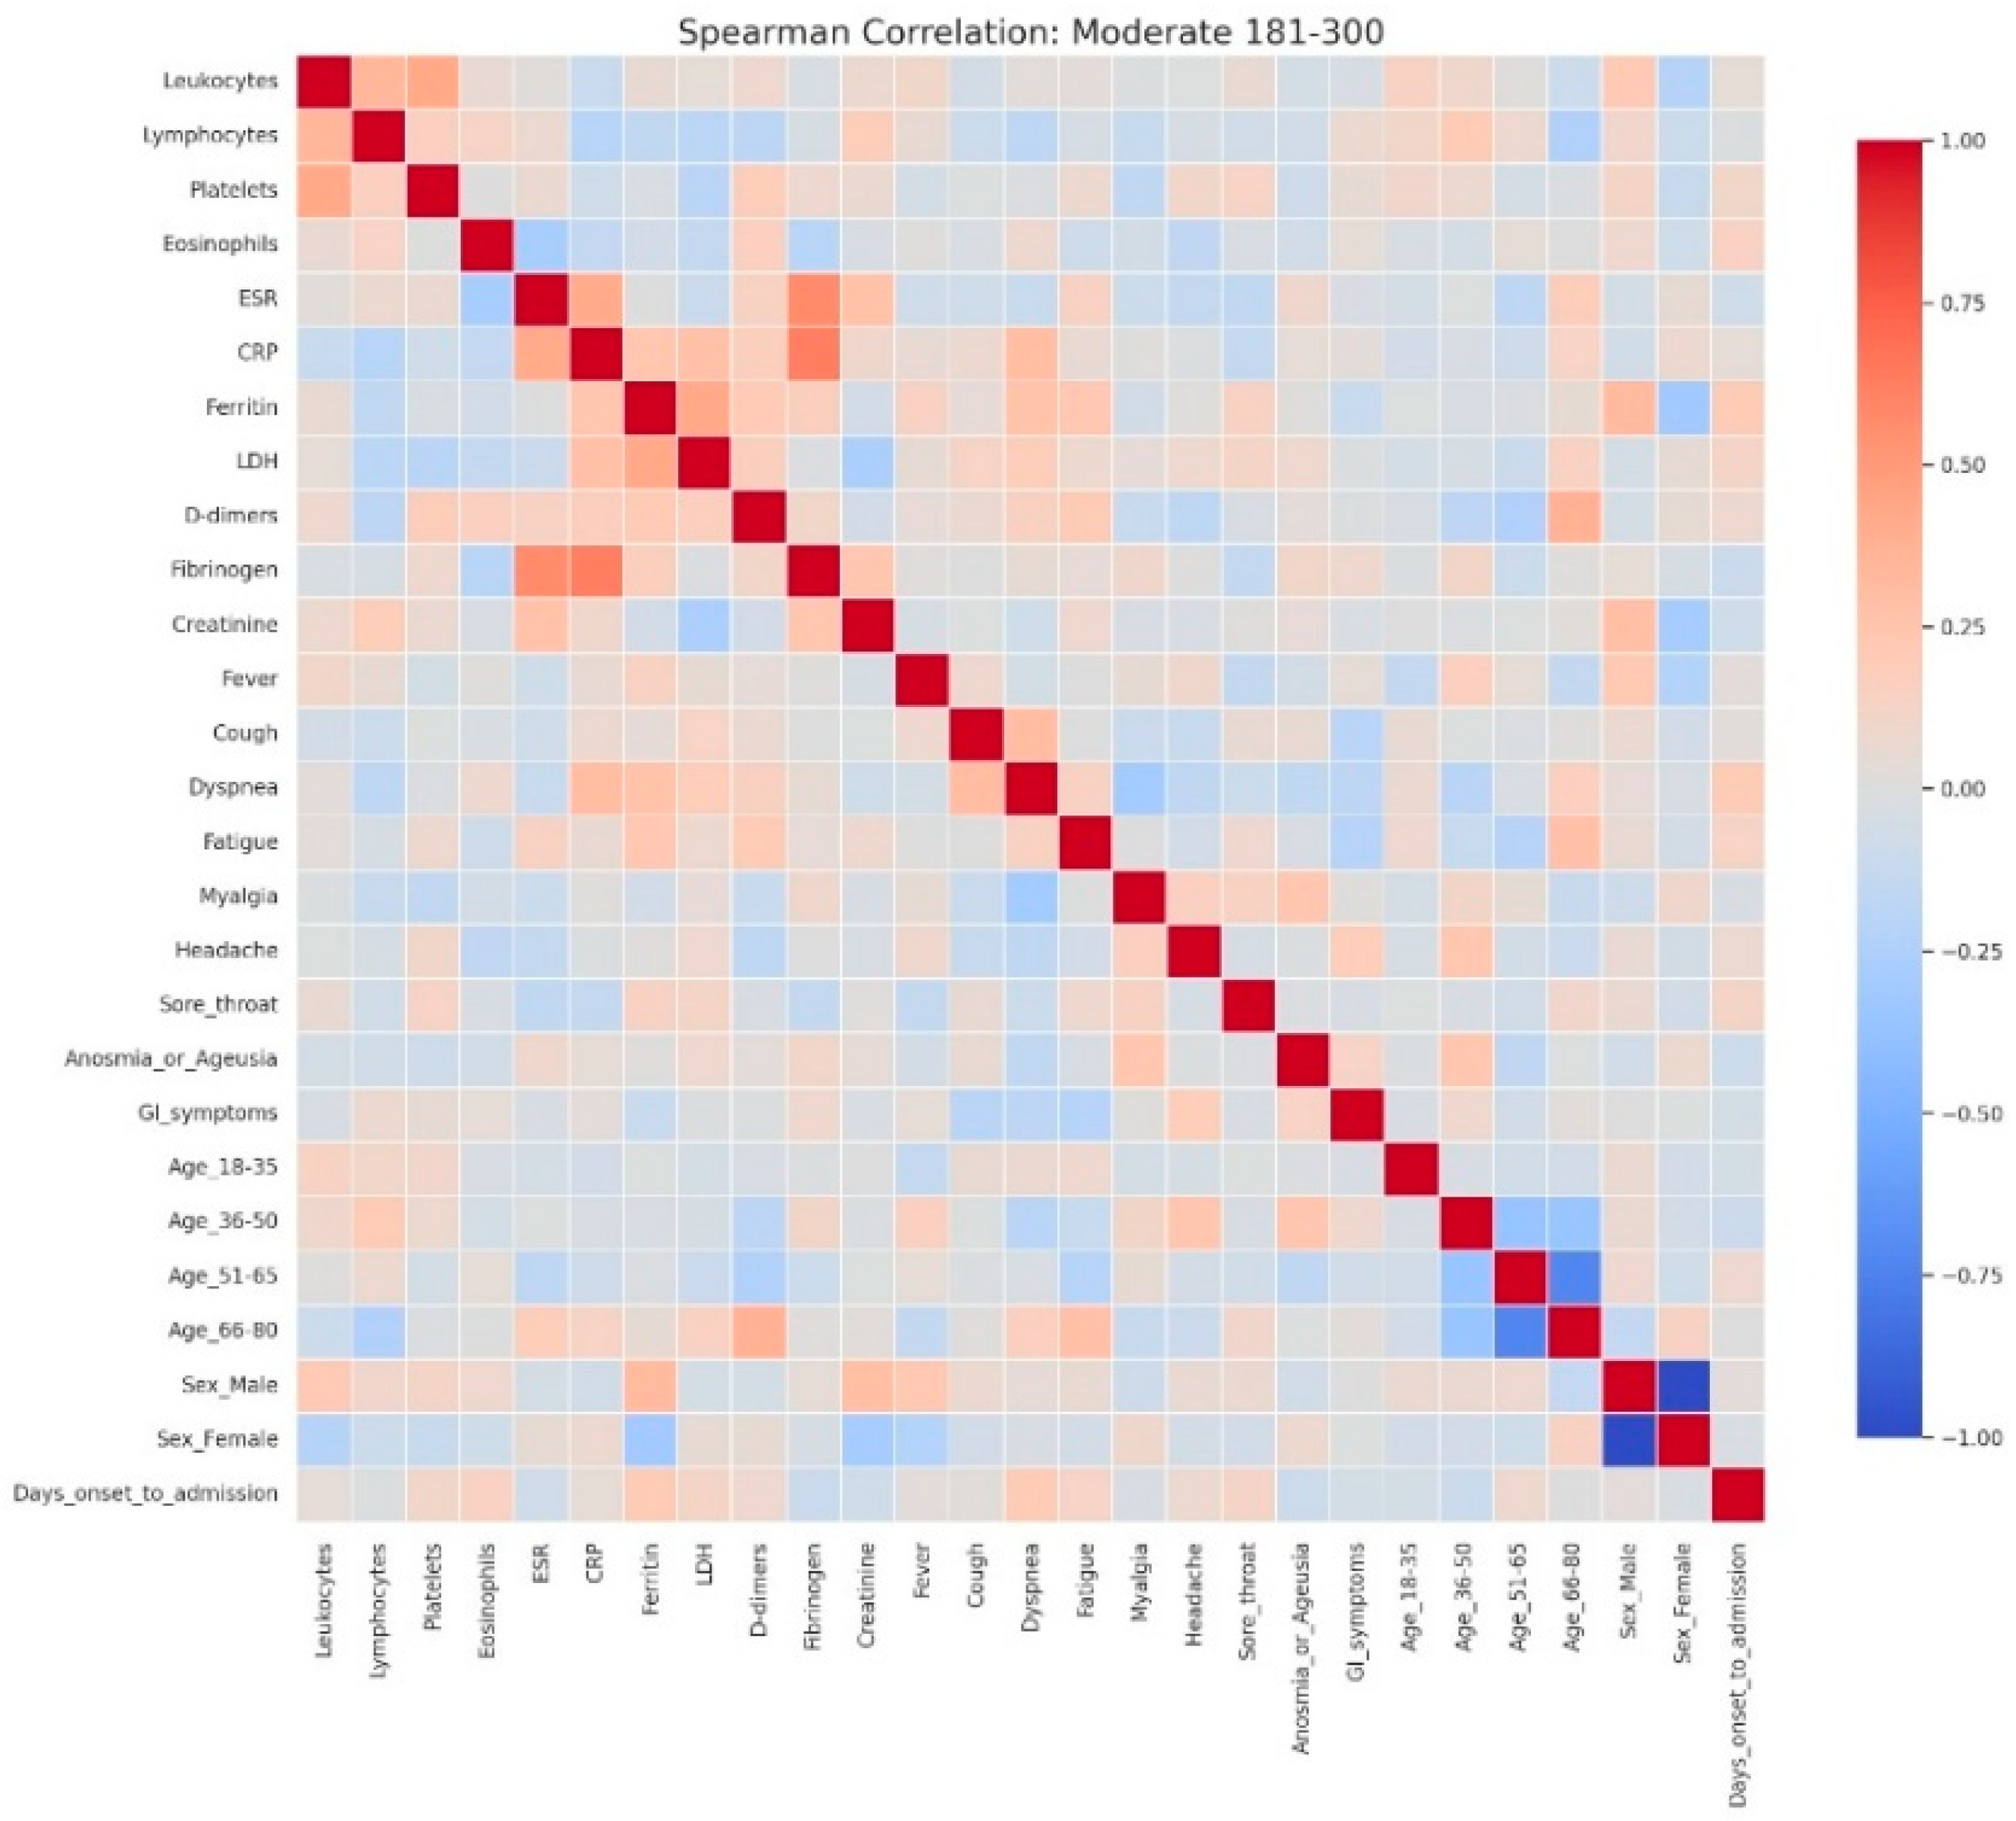
Spearman correlation heatmap of clinical, laboratory, and demographic parameters in patients with moderate admission hyperglycemia (181–300 mg/dL). Legend: Matrix of correlations across variables. Positive correlations are shown in red and negative correlations in blue, with darker colors indicating stronger associations, and neutral associations in light gray. The moderate cohort exhibits a clearer clustering of inflammatory markers, including CRP, ESR, fibrinogen, D-dimers, LDH, and ferritin, showing moderate-to-strong positive correlations—consistent with a heightened systemic inflammatory response. Weak inverse associations appear between inflammatory parameters and lymphocyte counts, reflecting early immune suppression.Slight positive correlations between CRP and symptoms such as dyspnea and cough indicate that clinical manifestations begin to parallel biochemical inflammation as disease severity increases. Demographic variables such as male sex and older age (51–80 years) show mild positive correlations with inflammatory markers, consistent with known risk profiles for more severe COVID-19.
![Jcm 14 07289 g008 Jcm 14 07289 g008]()
Figure 9.
Spearman correlation heatmap of clinical, laboratory, and demographic parameters in patients with severe admission hyperglycemia (>300 mg/dL). Legend: Comprehensive visualization of correlations between clinical, demographic, and laboratory parameters. Strong positive correlations appear in dark red, while strong negative correlations appear in dark blue. In this group, inflammatory and biochemical markers (CRP, ESR, ferritin, LDH, D-dimers, and fibrinogen) show intense positive correlations, reflecting the pronounced systemic inflammatory response characteristic of severe disease. These markers also exhibit negative correlations with lymphocyte counts, consistent with immune exhaustion and lymphopenia observed in critical COVID-19 cases. Correlations extend beyond laboratory variables: dyspnea, fatigue, and myalgia display moderate positive associations with inflammation-related markers, suggesting that symptom severity parallels biochemical hyperinflammation. Additionally, older age groups (≥51 years) and male sex show weak-to-moderate positive correlations with inflammatory and coagulation parameters, supporting their role as demographic risk factors for severe outcomes. Overall, this heatmap demonstrates a densely interconnected inflammatory network in severe COVID-19, where immune dysregulation, hyperinflammation, and demographic vulnerability converge to amplify disease severity and clinical burden.
![Jcm 14 07289 g009 Jcm 14 07289 g009]()
Figure 10.
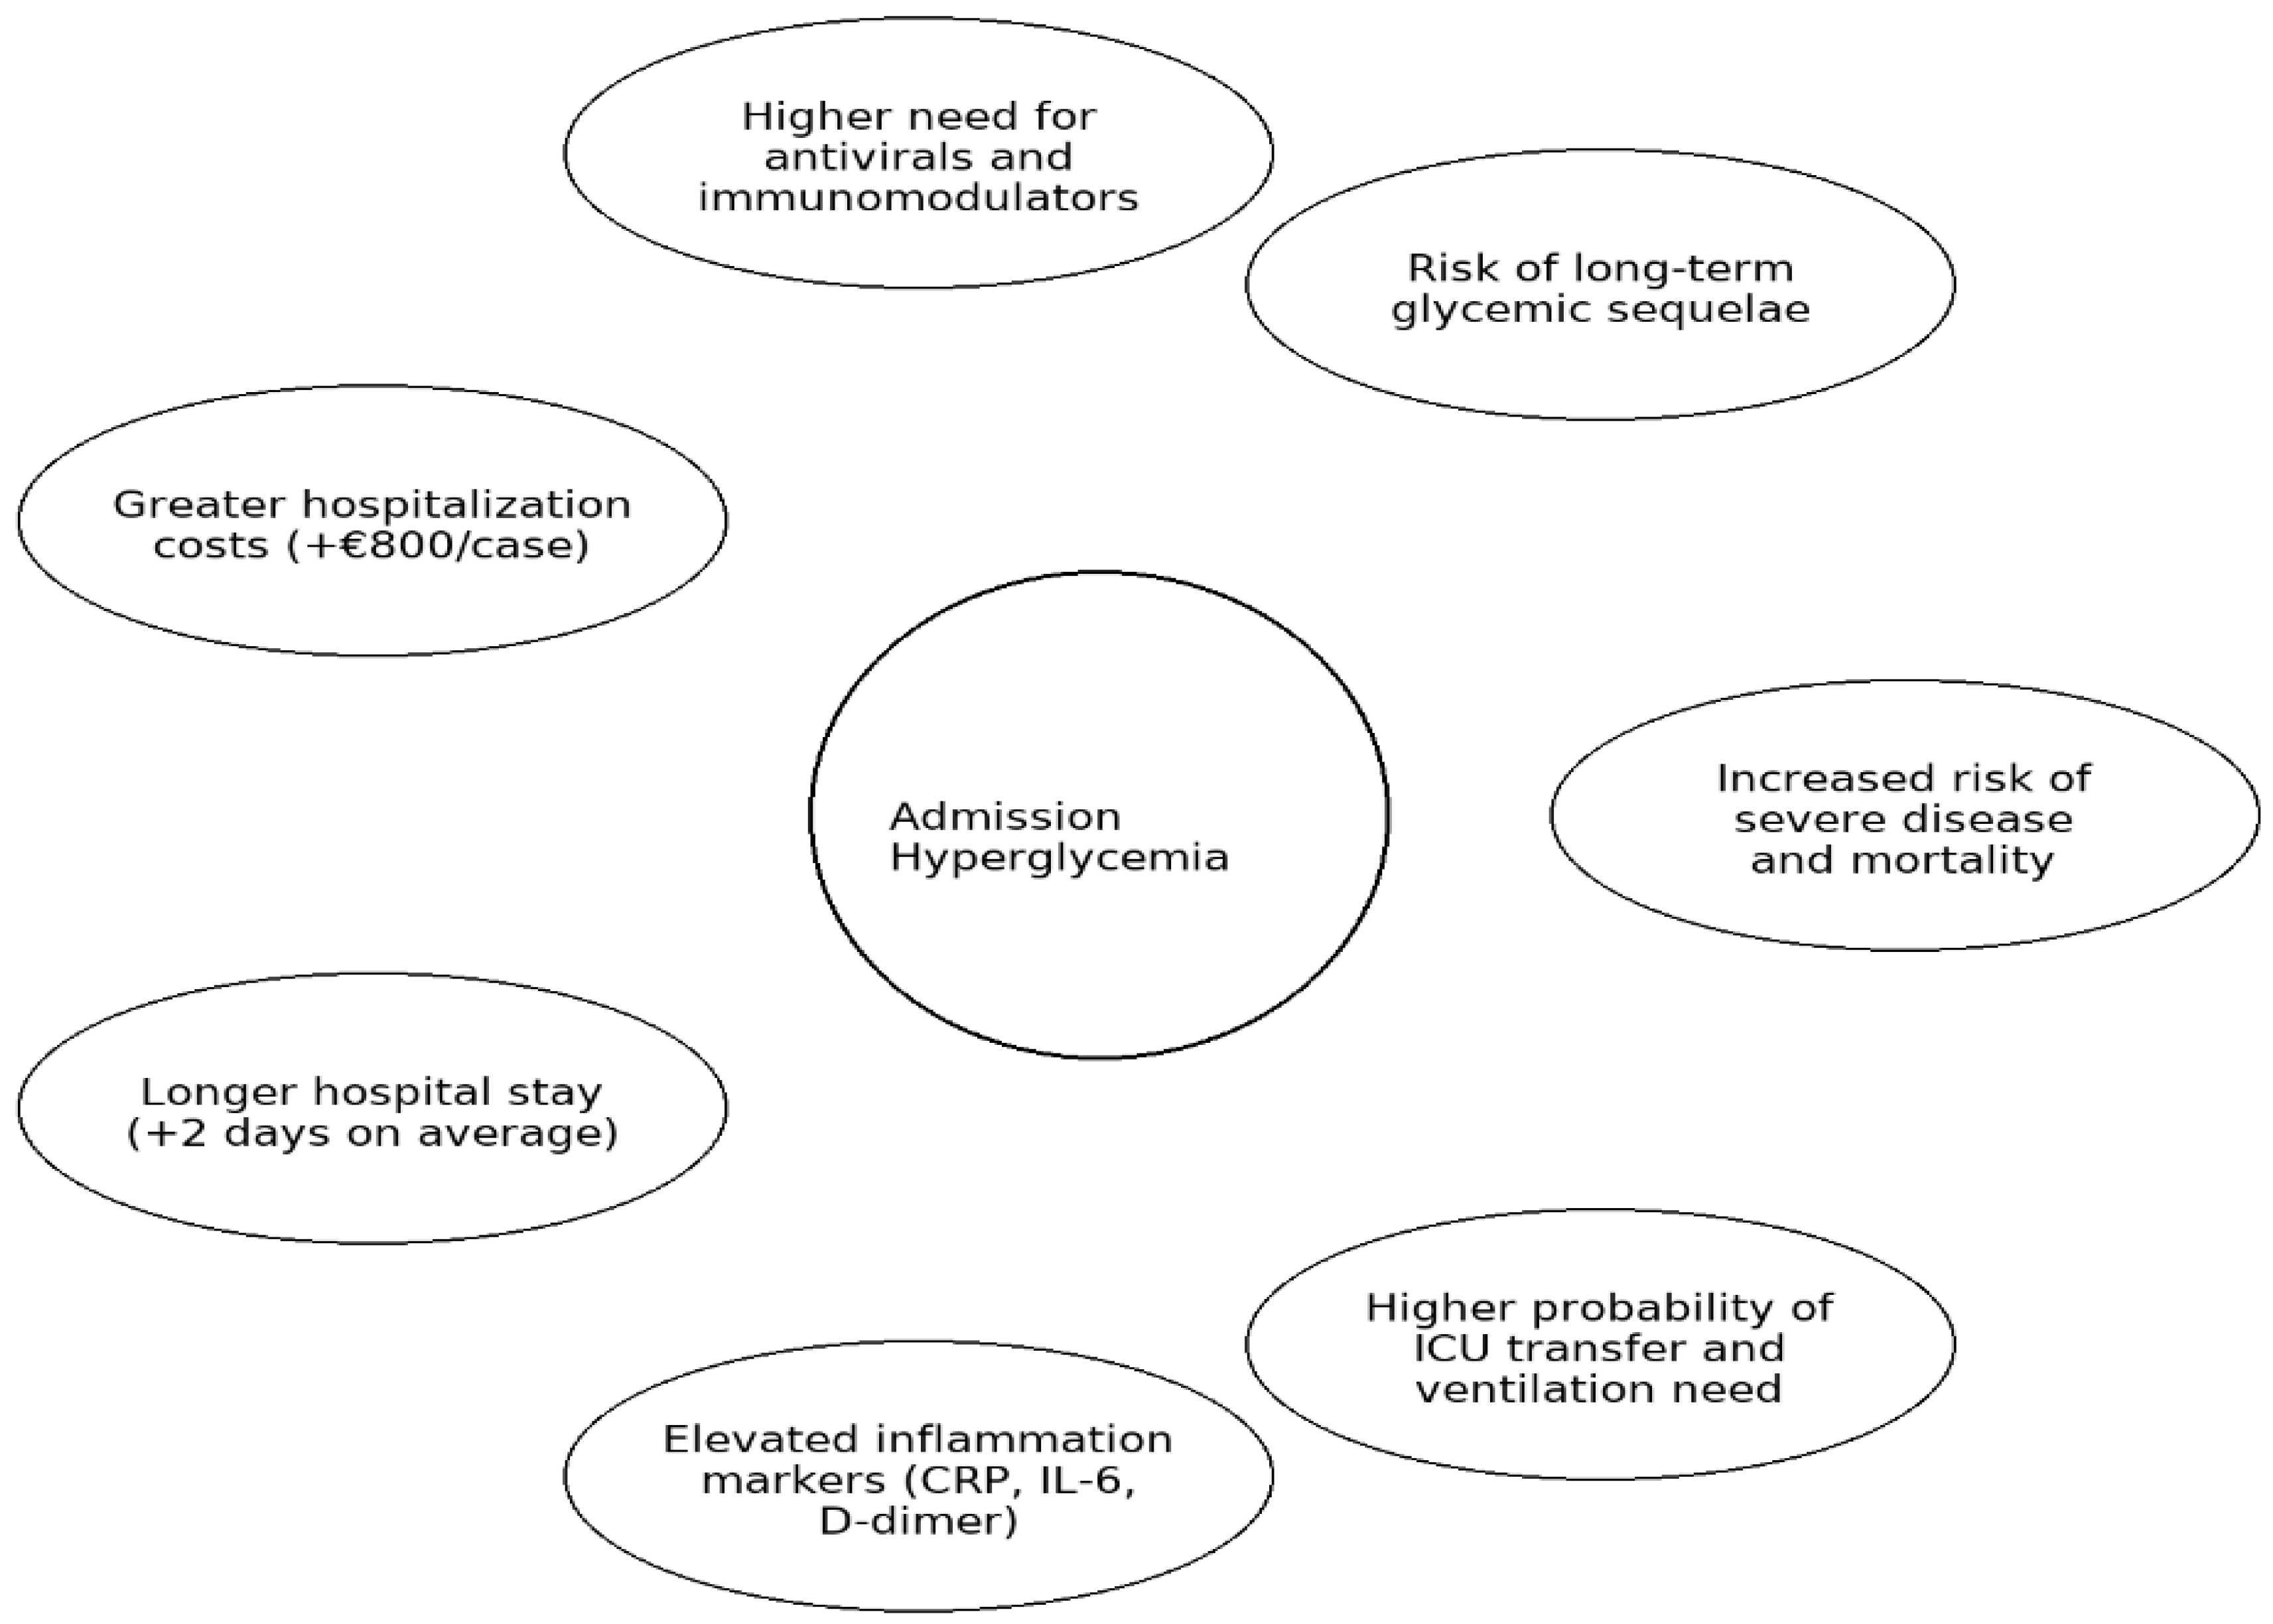
Graphical summary of the main clinical and economic implications of admission hyperglycemia in COVID-19. Legend: Graphical summary of the main clinical and prognostic implications of admission hyperglycemia in hospitalized COVID-19 patients, including disease severity, treatment needs, inflammatory profile, hospitalization outcomes, and long-term metabolic risks.
Table 1.
Epidemiological and clinical variables assessed and rationale for inclusion.
Table 1.
Epidemiological and clinical variables assessed and rationale for inclusion.
| Variable | Category | Rationale |
|---|
| Age, sex | Demographic | Established determinants of COVID-19 severity [14,15] |
| Cardiovascular disease (hypertension, myocardial infarction with stent) | Medical history | Common comorbidities linked with worse outcomes [41,42] |
| Pulmonary disease (asthma, COPD) | Medical history | Associated with respiratory compromise [38] |
| Obesity, hepatic steatosis | Metabolic history | Known risk factors for severe COVID-19 [17,43] |
| Chronic kidney disease | Medical history | Associated with poor prognosis [43] |
| Clinical form of COVID-19, initial symptoms, time from symptom onset to admission | Clinical | Indicators of disease onset and progression [44] |
| Oxygen therapy, CPAP requirement, antiviral and immunomodulatory treatments (remdesivir, tocilizumab, anakinra), insulin therapy | Clinical management | Reflect severity and treatment intensity [45,46,47] |
| Hematological and biochemical parameters (leukocytes, lymphocytes, platelets, CRP, ferritin, ESR, fibrinogen, D-dimer, IL-6, AST, ALT, LDH, creatinine) | Laboratory | Reflect systemic inflammation, tissue injury, coagulation status, and organ dysfunction [26,48] |
| Chest radiography/CT findings | Imaging | Quantifies pulmonary involvement [49] |
| Length of stay, ICU transfer, hospitalization costs | Outcomes | Indicators of healthcare burden and prognosis [50] |
Table 2.
Demographic characteristics and comorbidities in patients with hyperglycemia versus normoglycemia at hospital admission.
Table 2.
Demographic characteristics and comorbidities in patients with hyperglycemia versus normoglycemia at hospital admission.
| Parameter | Hyperglycemia (n = 734) | Normoglycemia (n = 275) | p-Value |
|---|
| Sex | | | 0.0003 * |
| Male (%) | 428 (58.3%) | 125 (45.5%) | |
| Female (%) | 306 (41.7%) | 150 (54.5%) | |
| Comorbidities | | | |
| Arterial hypertension | 376 (51.2%) | 114 (41.5%) | 0.0070 |
| Myocardial infarction/stent | 21 (2.9%) | 4 (1.5%) | 0.2926 |
| COPD | 14 (1.9%) | 4 (0.4%) | 0.8283 |
| Bronchial asthma | 17 (2.3%) | 9 (3.3%) | 0.5281 |
| Malignant neoplasms | 8 (1.1%) | 2 (0.7%) | 0.8721 |
| Obesity | 79 (10.8%) | 10 (3.6%) | 0.0006 |
| Hepatic steatosis | 22 (3.0%) | 5 (1.8%) | 0.4154 |
Table 3.
Age distribution by admission glycemic status.
Table 3.
Age distribution by admission glycemic status.
| Age Group (Years) | Hyperglycemia (n = 734) | Normoglycemia (n = 275) |
|---|
| 18–35 | 20 (2.7%) | 21 (7.6%) |
| 36–50 | 129 (17.6%) | 68 (24.7%) |
| 51–65 | 307 (41.8%) | 113 (41.1%) |
| 66–80 | 278 (37.9%) | 73 (26.5%) |
Table 4.
Comparison of symptom prevalence between hyperglycemic and normoglycemic COVID-19 patients.
Table 4.
Comparison of symptom prevalence between hyperglycemic and normoglycemic COVID-19 patients.
| Symptom | Hyperglycemia (n = 734) | Normoglycemia (n = 275) | p-Value |
|---|
| Fever | 534 (52.9%) | 196 (19.4%) | 0.697453 |
| Cough | 491 (48.7%) | 164 (16.3%) | 0.037819 |
| Dyspnea | 347 (34.4%) | 76 (7.5%) | <0.001 |
| Fatigue | 339 (33.6%) | 118 (11.7%) | 0.389855 |
| Myalgia | 191 (18.9%) | 69 (6.8%) | 0.825703 |
| Headache | 173 (17.1%) | 81 (8.0%) | 0.066295 |
| Sore throat | 16 (1.6%) | 11 (1.1%) | 0.168757 |
| Anosmia/Ageusia | 37 (3.7%) | 23 (2.3%) | 0.066097 |
| GI symptoms | 137 (13.6%) | 66 (6.5%) | 0.072793 |
Table 5.
Age-stratified CPAP requirement in COVID-19 patients according to glycemic status at admission.
Table 5.
Age-stratified CPAP requirement in COVID-19 patients according to glycemic status at admission.
| Age Group (Years) | Hyperglycemic CPAP | Normoglycemic CPAP | p-Value |
|---|
| 18–35 | 0/20 (0.0%) | 0/21 (0.0%) | - |
| 36–50 | 8/129 (6.2%) | 1/68 (1.5%) | 0.2488 |
| 51–65 | 24/307 (7.8%) | 1/113 (0.9%) | 0.0150 |
| 66–80 | 37/278 (13.3%) | 2/73 (2.7%) | 0.0188 |
Table 6.
Comparison of clinical characteristics between hyperglycemic and normoglycemic patients.
Table 6.
Comparison of clinical characteristics between hyperglycemic and normoglycemic patients.
| Clinical Parameter | Hyperglycemia (n = 734) | Normoglycemia (n = 275) | p-Value |
|---|
| Acute respiratory failure | 497 (67.7%) | 105 (38.2%) | <0.001 |
| CPAP therapy | 69 (9.4%) | 4 (1.5%) | <0.001 |
| Mild clinical form | 106 (14.4%) | 111 (40.4%) | <0.001 |
| Moderate clinical form | 282 (38.4%) | 94 (34.2%) | 0.2151 |
| Severe clinical form | 295 (40.2%) | 66 (24.0%) | <0.001 |
| Critical clinical form | 50 (6.8%) | 3 (1.1%) | 0.0003 |
| Transfer to ICU | 48 (6.5%) | 4 (1.5%) | 0.0011 |
| Death | 28 (3.8%) | 3 (1.1%) | 0.0256 |
Table 7.
Comparison of hospital stay duration and hospitalization costs between patients with hyperglycemia and normoglycemia at admission.
Table 7.
Comparison of hospital stay duration and hospitalization costs between patients with hyperglycemia and normoglycemia at admission.
| Variable | Hyperglycemia (n = 734) | Normoglycemia (n = 275) | p-Value |
|---|
| Mean hospital stay duration | 12.14 days | 10.1 days | <0.001 |
| Mean hospitalization cost per case | €1846 | €1043 | <0.001 |
Table 8.
Laboratory abnormalities in patients with hyperglycemia versus normoglycemia at hospital admission.
Table 8.
Laboratory abnormalities in patients with hyperglycemia versus normoglycemia at hospital admission.
| Parameter | Hyperglycemia (n = 734) | Normoglycemia (n = 275) | p-Value (Chi2 Test) |
|---|
| Leukocytes < 4000/μL | 146 (18.5%) | 66 (19.8%) | 0.619 |
| Lymphocytes < 1000/μL | 470 (59.6%) | 77 (23.1%) | <0.001 |
| Platelets < 150,000/μL | 112 (14.2%) | 46 (13.8%) | 0.878 |
| Eosinophils = 0/μL | 664 (84.2%) | 139 (41.7%) | <0.001 |
| ESR > 10 mm/h | 647 (82.1%) | 224 (67.2%) | <0.001 |
| CRP > 10 mg/L | 604 (76.6%) | 200 (60.6%) | <0.001 |
| Ferritin > 250 ng/mL | 644 (81.7%) | 188 (56.4%) | <0.001 |
| LDH > 245 U/L | 705 (89.4%) | 260 (78.1%) | <0.001 |
| D-dimers > 243 ng/mL | 494 (62.6%) | 164 (49.2%) | <0.001 |
| Fibrinogen > 450 mg/dL | 465 (59.0%) | 151 (45.3%) | <0.001 |
| ALT (GPT) > 45 U/L | 383 (48.6%) | 101 (30.3%) | <0.001 |
| AST (GOT) > 45 U/L | 304 (38.5%) | 85 (25.5%) | <0.001 |
| Creatinine > 1.2 mg/dL | 155 (19.6%) | 55 (16.5%) | 0.250 |
Table 9.
Comparison of antiviral treatments used in COVID-19 between hyperglycemic and normoglycemic patients.
Table 9.
Comparison of antiviral treatments used in COVID-19 between hyperglycemic and normoglycemic patients.
| Antiviral Treatment | Hyperglycemia (n = 734) | Normoglycemia (n = 275) | p-Value |
|---|
| Remdesivir | 233 (31.7%) | 42 (15.3%) | <0.001 |
| Kaletra | 208 (28.3%) | 119 (43.3%) | <0.001 |
| Plaquenil | 152 (20.7%) | 71 (25.8%) | 0.0976 |
| Favipiravir | 258 (35.1%) | 75 (27.3%) | 0.0217 |
| No antiviral treatment | 20 (2.7%) | 23 (8.4%) | <0.001 |
Table 10.
Administration of immunomodulatory treatment depending on glycemic status upon admission.
Table 10.
Administration of immunomodulatory treatment depending on glycemic status upon admission.
| Immunomodulator Treatment | Hyperglycemic (n = 734) | Normoglycemic (n = 275) | p-Value (χ2 Test) |
|---|
| Tocilizumab (IL-6 inhibitor) | 121 (16.48%) | 18 (6.54%) | <0.001 |
| Kineret (IL-1 inhibitor) | 192 (26.15%) | 34 (12.36%) | <0.001 |
Table 11.
Steroid use and new-onset hyperglycemia among normoglycemic patients at admission.
Table 11.
Steroid use and new-onset hyperglycemia among normoglycemic patients at admission.
| Variable | Normoglycemics Who Developed Hyperglycemia (n, %) |
|---|
| Developed hyperglycemia during hospitalization | 110 (40.0%) |
| Received corticosteroids | 104 (94.5%) |
| Progressed to severe/critical disease | 18 (16.2%) |
| Required non-invasive ventilation/ICU transfer | 1 (0.9%) |
| Glucose > 140 mg/dL at discharge | 29.3% |
Table 12.
Comparative analysis of Spearman correlations across glycemic groups.
Table 12.
Comparative analysis of Spearman correlations across glycemic groups.
| No. | Domain/Observation | Blood Glucose ≥ 300 mg/dL | Blood Glucose 181–300 mg/dL | Blood Glucose 107–180 mg/dL | Significant Correlation (Spearman) |
|---|
| 1 | Symptomatology | Dyspnea-myalgia, fever-ferritin | Dry cough | Dry cough | Yes |
| 2 | Chest X-ray (CXR) | CXR with ferritin, CRP, D-dimer | CXR with saturation | CXR with LDH, saturation | Yes |
| 3 | Oxygen saturation | Sat. with CXR, LDH, CRP | Sat. with CXR, LDH | Sat. with CXR, LDH | Yes |
| 4 | Systemic inflammation (CRP, ESR, fibrinogen) | CRP with O2 sat., CXR, D-dimer | CRP-ESR, CRP-fibrinogen | CRP-ESR, CRP-fibrinogen | Yes |
| 5 | Inflammation/Ferritin | Ferritin with CXR, fever | Ferritin with AST, ALT, LDH | Ferritin with LDH, CRP, AST | Yes |
| 6 | CRP and LDH | Not observed | Not observed | Strong positive correlation | Yes |
| 7 | Ferritin and LDH | Not observed | Correlation present | Correlation present | Yes |
| 8 | D-dimer | D-dimer with symptom onset days, CXR | D-dimer with age | D-dimer with LDH | Yes |
| 9 | LDH (tissue injury) | LDH with O2 sat., dyspnea | LDH with AST | LDH with AST, CRP, CXR, ferritin | Yes |
| 10 | Liver involvement (AST/ALT) | Not observed | ALT-AST | ALT-AST, AST-ferritin, AST-LDH | Yes |
