
The Impact of Anxiety and Depression on Health-Related Quality of Life in Hyperlipidemic Adults in the United States


Abstract
1. Introduction
2. Methods
2.1. Study Design and Data
2.2. Inclusion and Exclusion Criteria
2.3. Measures
2.3.1. Outcome: Health-Related Quality of Life (HRQoL)
2.3.2. Independent Variables
2.4. Statistical Analyses
3. Results
3.1. Characteristics of the Study Sample
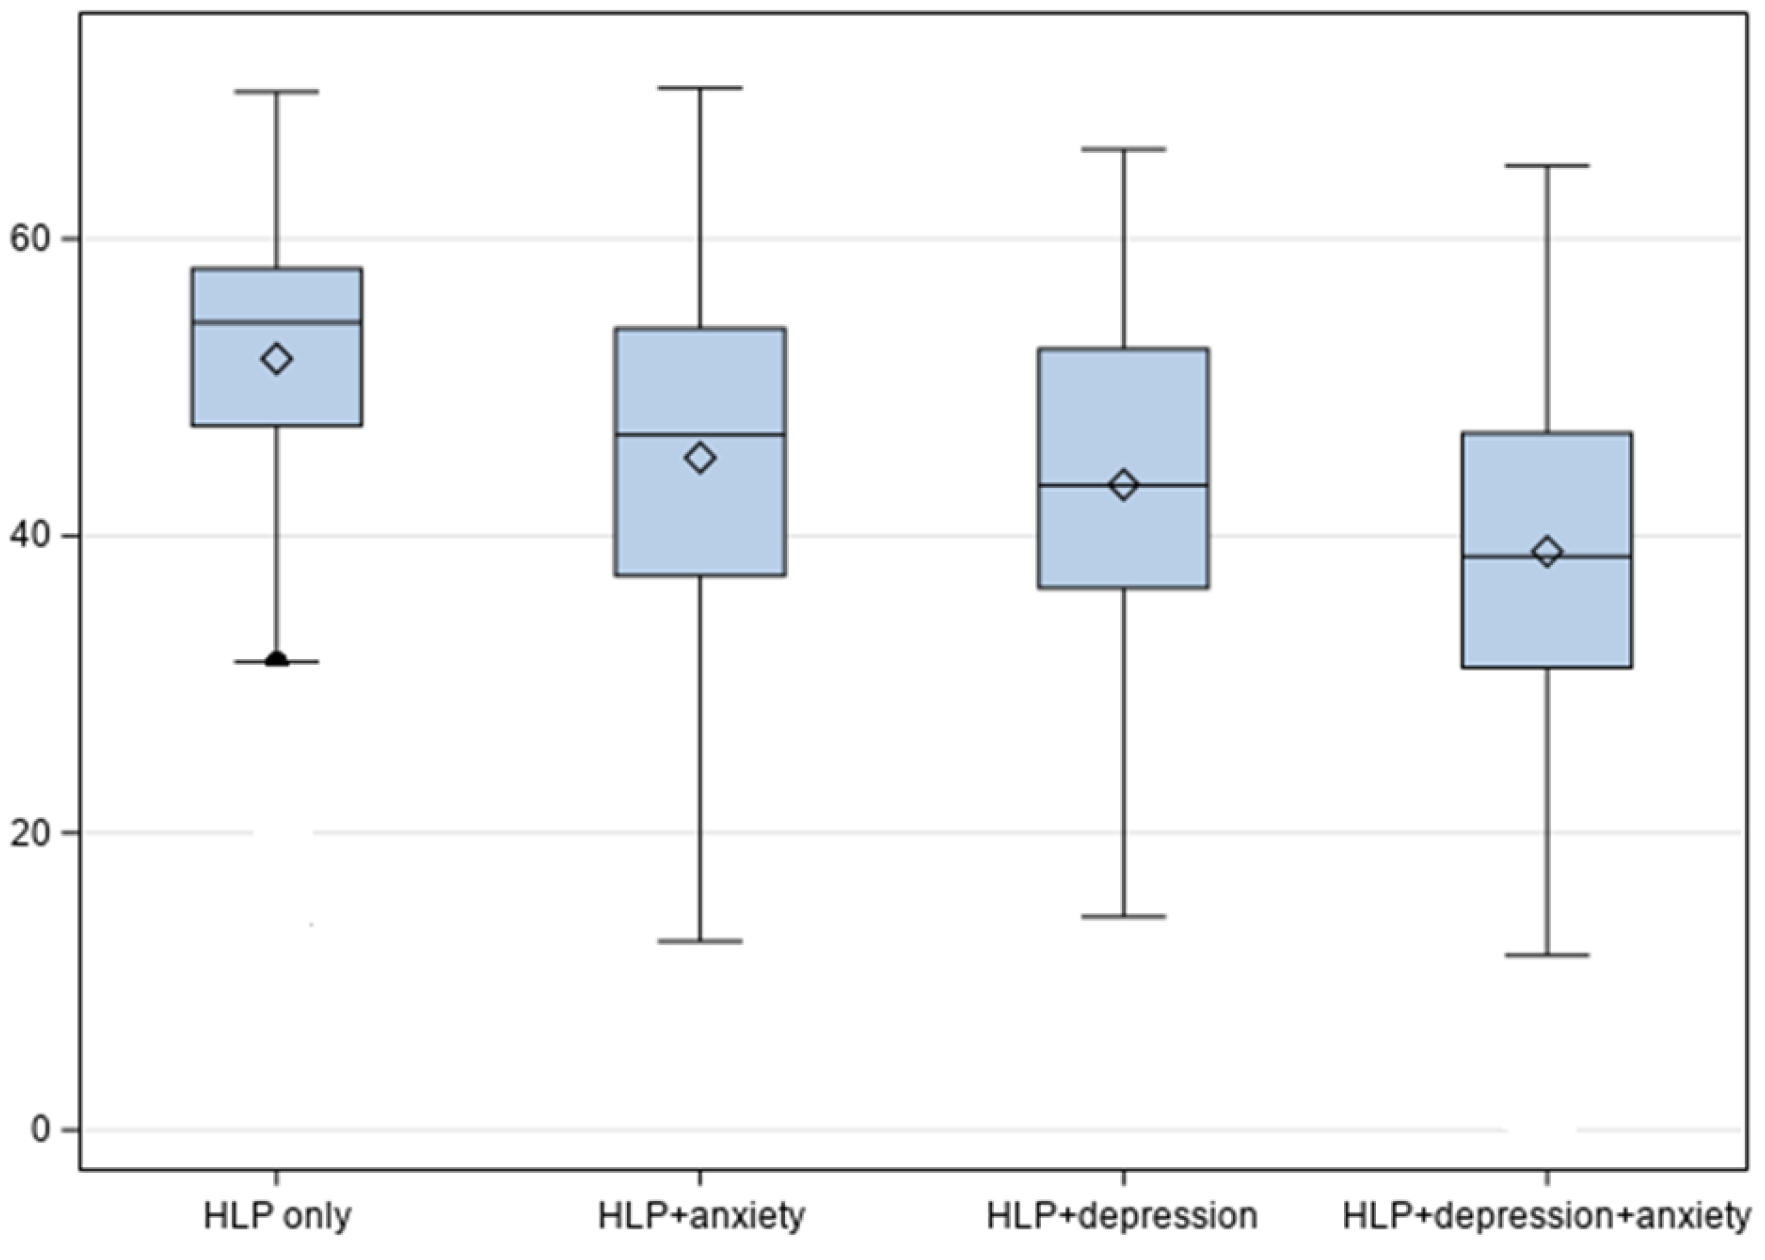
3.2. Health-Related Quality of Life by Hyperlipidemia Groups
3.3. Adjusted Linear Regression Analysis for Health-Related Quality of Life
4. Discussion
4.1. Study Strengths and Limitations
4.2. Clinical Practice, Policy, Research, and Public Health Implications
5. Conclusions
Funding
Institutional Review Board Statement
Informed Consent Statement
Data Availability Statement
Conflicts of Interest
List of Abbreviations
References
- Karimi, M.; Brazier, J. Health, Health-Related Quality of Life, and Quality of Life: What is the Difference? Pharmacoeconomics 2016, 34, 645–649. [Google Scholar] [CrossRef] [PubMed]
- Hill, M.F.; Bordoni, B. Hyperlipidemia. In StatPearls [Internet]; StatPearls Publishing: Treasure Island, FL, USA, 2022. [Google Scholar]
- Naser, I.H.; Alkareem, Z.A.; Mosa, A.U. Hyperlipidemia: Pathophysiology, causes, complications, and treatment. A review. Karbala J. Pharm. Sci. 2021, 1, 118. [Google Scholar]
- Li, Z.; Zhu, G.; Chen, G.; Luo, M.; Liu, X.; Chen, Z.; Qian, J. Distribution of lipid levels and prevalence of hyperlipidemia: Data from the NHANES 2007–2018. Lipids Health Dis. 2022, 21, 111. [Google Scholar] [CrossRef] [PubMed]
- Fox, K.M.; Wang, L.; Gandra, S.R.; Quek, R.G.W.; Li, L.; Baser, O. Clinical and economic burden associated with cardiovascular events among patients with hyperlipidemia: A retrospective cohort study. BMC Cardiovasc. Disord. 2016, 16, 13. [Google Scholar] [CrossRef] [PubMed]
- Zhang, D.; Wang, G.; Fang, J.; Mercado, C. Hyperlipidemia and Medical Expenditures by Cardiovascular Disease Status in US Adults. Med. Care 2017, 55, 4–11. [Google Scholar] [CrossRef]
- Soni, A. Top 10 Most Costly Conditions Among Men and Women, 2008: Estimates for the U.S. Civilian Noninstitutionalized Adult Population, Age 18 and Older. Statistical Brief No. 331, 2011. Agency for Healthcare Research and Quality. Available online: https://meps.ahrq.gov/data_files/publications/st331/stat331.shtml (accessed on 23 December 2024).
- Yazdani, Z.; Jabalameli, S.; Ebrahimi, A.; Raeisi, Z. Relationship between Metabolic Diseases (Diabetes and Hyperlipidemia) with Depression in the Elderly. J. Isfahan Med. Sch. 2022, 40, 647–653. [Google Scholar]
- Chuang, C.-S.; Yang, T.-Y.; Muo, C.-H.; Su, H.-L.; Sung, F.-C.; Kao, C.-H. Hyperlipidemia, statin use and the risk of developing depression: A nationwide retrospective cohort study. Gen. Hosp. Psychiatry 2014, 36, 497–501. [Google Scholar] [CrossRef]
- Chien, I.C.; Lin, C.-H.; Chou, Y.-J.; Chou, P. Increased risk of hyperlipidemia in patients with major depressive disorder: A population-based study. J. Psychosom. Res. 2013, 75, 270–274. [Google Scholar] [CrossRef]
- Jarab, A.S.; Alefishat, E.A.; Al-Qerem, W.; Mukattash, T.L.; Abu-Zaytoun, L. Variables associated with poor health-related quality of life among patients with dyslipidemia in Jordan. Qual. Life Res. 2021, 30, 1417–1424. [Google Scholar] [CrossRef]
- Yan, R.; Gu, H.-Q.; Wang, W.; Ma, L.; Li, W.; on behalf of the CHIEF Research Group. Health-related quality of life in blood pressure control and blood lipid-lowering therapies: Results from the CHIEF randomized controlled trial. Hypertens. Res. 2019, 42, 1561–1571. [Google Scholar] [CrossRef]
- Chantzaras, A.; Yfantopoulos, J. Association between medication adherence and health-related quality of life of patients with hypertension and dyslipidemia. Hormones 2023, 22, 665–676. [Google Scholar] [CrossRef] [PubMed]
- Babu, R.H.; Nagaraju, R.; Prasad, K.; Reddy, S. Assessment of medication adherence and quality of life in hyperlipidemia patients. Int. J. Pharma Bio. Sci. 2012, 1, 388–393. [Google Scholar]
- Wu, H.; Li, H.; Li, H.; Ding, Y.; Wang, C.; Zhang, G.; Tang, N.; Wu, W. Evaluation of health-related quality of life in adults with and without dyslipidaemia in rural areas of central China. Qual. Life Res. 2020, 29, 925–939. [Google Scholar] [CrossRef] [PubMed]
- Agency for Healthcare Research and Quality. Medical Expenditure Panel Survey HC-231: 2021 Medical Conditions File. [23 November 2024]. Available online: https://meps.ahrq.gov/data_stats/download_data/pufs/h231/h231doc.pdf (accessed on 23 December 2024).
- Kazis, L.E.; Selim, A.J.; Rogers, W.; Qian, S.X.; Brazier, J. Monitoring Outcomes for the Medicare Advantage Program: Methods and Application of the VR-12 for Evaluation of Plans. J. Ambul. Care Manag. 2012, 35, 263–276. [Google Scholar] [CrossRef] [PubMed]
- Agency for Healthcare Research and Quality. Medical Expenditure Panel Survey MEPS HC-233. 2021 Full Year. Consolidated Data File. Available online: https://meps.ahrq.gov/data_stats/download_data/pufs/h233/h233doc.shtml (accessed on 23 December 2024).
- Maslak, J.P.; Jenkins, T.J.; Weiner, J.A.; Kannan, A.S.; Patoli, D.M.; McCarthy, M.H.; Hsu, W.K.; Patel, A.A. Burden of Sciatica on US Medicare Recipients. JAAOS—J. Am. Acad. Orthop. Surg. 2020, 28, e433–e439. [Google Scholar] [CrossRef]
- Selim, A.J.; Rothendler, J.A.; Qian, S.X.; Bailey, H.M.; Kazis, L.E. The History and Applications of the Veterans RAND 12-Item Health Survey (VR-12). J. Ambul. Care Manag. 2022, 45, 161–170. [Google Scholar] [CrossRef]
- Kazis, L.E.; Rogers, W.H.; Rothendler, J.; Qian, S.; Selim, A.; Edelen, M.O.; Stucky, B.; Rose, A.; Butcher, E. Outcome Performance Measure Development for Persons with Multiple Chronic Conditions; RAND Corporation: Santa Monica, CA, USA, 2017. [Google Scholar]
- McLean, C.P.; Asnaani, A.; Litz, B.T.; Hofmann, S.G. Gender differences in anxiety disorders: Prevalence, course of illness, comorbidity and burden of illness. J. Psychiatr. Res. 2011, 45, 1027–1035. [Google Scholar] [CrossRef]
- Regitz-Zagrosek, V. Sex and gender differences in health. Science & Society Series on Sex and Science. EMBO Rep 2012, 13, 596–603. [Google Scholar]
- Bharti, V.; Bhardwaj, A.; Hood, K.; Elias, D.A.; Metcalfe, A.W.S.; Kim, J.S. A systematic review and meta-analysis of lipid metabolomic signatures of Major Depressive Disorder. J. Psychiatr. Res. 2021, 139, 197–205. [Google Scholar] [CrossRef]
- Zhou, X.; Tao, X.-L.; Zhang, L.; Yang, Q.-K.; Li, Z.-J.; Dai, L.; Lei, Y.; Zhu, G.; Wu, Z.-F.; Yang, H.; et al. Association between cardiometabolic index and depression: National Health and Nutrition Examination Survey (NHANES) 2011–2014. J. Affect. Disord. 2024, 351, 939–947. [Google Scholar] [CrossRef]
- Kim, S.-W.; Kang, H.-J.; Bae, K.-Y.; Shin, I.-S.; Hong, Y.J.; Ahn, Y.-K.; Jeong, M.H.; Berk, M.; Yoon, J.-S.; Kim, J.-M. Interactions between pro-inflammatory cytokines and statins on depression in patients with acute coronary syndrome. Prog. Neuro-Psychopharmacol. Biol. Psychiatry 2018, 80, 250–254. [Google Scholar] [CrossRef] [PubMed]
- Kivimäki, M.; Shipley, M.J.; Allan, C.L.; Sexton, C.E.; Jokela, M.; Virtanen, M.; Tiemeier, H.; Ebmeier, K.P.; Singh-Manoux, A. Vascular Risk Status as a Predictor of Later-Life Depressive Symptoms: A Cohort Study. Biol. Psychiatry 2012, 72, 324–330. [Google Scholar] [CrossRef] [PubMed]
- Hu, P.; Zheng, M.; Duan, X.; Zhou, H.; Huang, J.; Lao, L.; Zhao, Y.; Li, Y.; Xue, M.; Zhao, W.; et al. Association of healthy lifestyles on the risk of hypertension, type 2 diabetes mellitus, and their comorbidity among subjects with dyslipidemia. Front. Nutr. 2022, 9, 1006379. [Google Scholar] [CrossRef] [PubMed]
- Noh, J.-W.; Kim, J.; Park, J.; Kim, H.-J.; Kwon, Y.D. Gender Difference in Relationship between Health-Related Quality of Life and Work Status. PLoS ONE 2015, 10, e0143579. [Google Scholar] [CrossRef] [PubMed]
- Sharma, A.; Madaan, V.; Petty, F.D. Exercise for mental health: Prim Care Companion. J. Clin. Psychiatry 2006, 8, 106. [Google Scholar] [CrossRef]
- Kontoangelos, K.; Soulis, D.; Soulaidopoulos, S.; Antoniou, C.K.; Tsiori, S.; Papageorgiou, C.; Katsi, V. Health Related Quality of Life and Cardiovascular Risk Factors. Behav. Med. 2024, 50, 186–194. [Google Scholar] [CrossRef]
- Skou, S.T.; Mair, F.S.; Fortin, M.; Guthrie, B.; Nunes, B.P.; Miranda, J.J.; Boyd, C.M.; Pati, S.; Mtenga, S.; Smith, S.M. Multimorbidity. Nat. Rev. Dis. Primers 2022, 8, 48. [Google Scholar] [CrossRef]
- Xu, R.H.; Keetharuth, A.D.; Wang, L.-L.; Cheung, A.W.-L.; Wong, E.L.-Y. Measuring health-related quality of life and well-being: A head-to-head psychometric comparison of the EQ-5D-5L, ReQoL-UI and ICECAP-A. Eur. J. Health Econ. 2022, 23, 165–176. [Google Scholar] [CrossRef]


| Total Sample | HLD Only | HLD and Depression | HLD and Anxiety | HLD and Depression and Anxiety | |||||||||
|---|---|---|---|---|---|---|---|---|---|---|---|---|---|
| N | Wt.% | N | Wt.% | N | Wt.% | N | Wt.% | N | Wt.% | p-Value | Sig. | ||
| All | 7984 | 100.0 | 5800 | 73.8 | 787 | 9.3 | 787 | 10.2 | 610 | 6.8 | |||
| Age in years | |||||||||||||
| 18–39 | 522 | 7.1 | 354 | 67.7 | 37 | 7.4 | 74 | 15.0 | 57 | 9.9 | 0.008 | ** | |
| 40–49 | 1308 | 17.7 | 948 | 71.9 | 114 | 8.2 | 136 | 11.5 | 110 | 8.4 | |||
| 50–64 | 6154 | 75.2 | 4498 | 74.8 | 636 | 9.7 | 577 | 9.4 | 443 | 6.1 | |||
| Gender | |||||||||||||
| Women | 3925 | 44.4 | 2504 | 63.0 | 509 | 13.4 | 490 | 13.9 | 422 | 9.7 | <0.0001 | *** | |
| Men | 4059 | 55.6 | 3296 | 82.4 | 278 | 6.0 | 297 | 7.3 | 188 | 4.4 | |||
| Race/ethnicity | |||||||||||||
| White | 4651 | 68.4 | 3119 | 69.6 | 554 | 10.8 | 557 | 11.8 | 421 | 7.9 | <0.0001 | *** | |
| African American | 1238 | 10.7 | 983 | 81.6 | 94 | 6.6 | 85 | 6.1 | 76 | 5.7 | |||
| Latino | 1472 | 12.8 | 1180 | 82.6 | 91 | 5.5 | 107 | 7.6 | 94 | 4.3 | |||
| Others | 623 | 8.1 | 518 | 85.0 | 48 | 6.3 | 38 | 6.2 | 19 | 2.5 | |||
| Marital status | |||||||||||||
| Married | 4497 | 62.2 | 3511 | 78.2 | 336 | 7.7 | 423 | 9.5 | 227 | 4.6 | <0.0001 | *** | |
| Widow/Sep/Div. | 2220 | 23.8 | 1417 | 66.0 | 331 | 13.2 | 228 | 10.4 | 244 | 10.4 | |||
| Never married | 1267 | 14.0 | 872 | 67.3 | 120 | 9.6 | 136 | 13.2 | 139 | 9.9 | |||
| Education level | |||||||||||||
| < HS | 523 | 4.0 | 400 | 77.5 | 43 | 9.2 | 48 | 7.7 | 32 | 5.5 | 0.257 | ||
| HS | 812 | 7.5 | 570 | 70.2 | 87 | 9.8 | 81 | 10.1 | 74 | 9.9 | |||
| > HS | 6584 | 87.9 | 4780 | 73.9 | 651 | 9.2 | 652 | 10.3 | 501 | 6.6 | |||
| Region | |||||||||||||
| Northeast | 1291 | 16.7 | 949 | 76.8 | 106 | 7.5 | 110 | 7.8 | 126 | 7.8 | 0.003 | ** | |
| Mid-west | 1841 | 23.3 | 1250 | 70.2 | 230 | 11.0 | 199 | 10.5 | 162 | 8.3 | |||
| South | 3150 | 39.6 | 2302 | 73.0 | 282 | 8.9 | 340 | 12.0 | 226 | 6.1 | |||
| West | 1702 | 20.4 | 1299 | 76.9 | 169 | 9.5 | 138 | 8.2 | 96 | 5.5 | |||
| Employment | |||||||||||||
| Employed | 4916 | 68.1 | 3909 | 79.3 | 344 | 6.9 | 421 | 9.3 | 242 | 4.4 | <0.0001 | *** | |
| Not employed | 3067 | 31.9 | 1890 | 61.9 | 443 | 14.3 | 366 | 12.1 | 368 | 11.7 | |||
| Poverty status | |||||||||||||
| Poor | 1342 | 11.4 | 793 | 56.3 | 194 | 15.3 | 167 | 13.0 | 188 | 15.3 | <0.0001 | *** | |
| Near Poor | 1403 | 13.8 | 975 | 70.7 | 161 | 11.1 | 121 | 8.3 | 146 | 10.0 | |||
| Middle Income | 2098 | 25.0 | 1546 | 72.8 | 189 | 8.8 | 231 | 12.2 | 132 | 6.1 | |||
| High Income | 3141 | 49.7 | 2486 | 79.1 | 243 | 7.6 | 268 | 9.0 | 144 | 4.2 | |||
| Health Insurance | |||||||||||||
| Private | 5254 | 74.4 | 4079 | 77.5 | 433 | 8.0 | 475 | 9.6 | 267 | 4.8 | <0.0001 | *** | |
| Public | 2401 | 22.4 | 1443 | 60.0 | 337 | 13.9 | 295 | 12.4 | 326 | 13.7 | |||
| Uninsured | 329 | 3.2 | 278 | 83.4 | 17 | 5.6 | 17 | 8.1 | 17 | 3.0 | |||
| Rx Insurance | |||||||||||||
| Rx insurance | 4692 | 67.6 | 3661 | 77.6 | 371 | 7.8 | 429 | 9.8 | 231 | 4.7 | <0.0001 | *** | |
| No Rx insurance | 3292 | 32.4 | 2139 | 65.7 | 416 | 12.3 | 358 | 10.9 | 379 | 11.1 | |||
| General health | |||||||||||||
| Excellent/Very good | 2801 | 39.9 | 2266 | 80.9 | 199 | 6.6 | 222 | 8.9 | 114 | 3.6 | <0.0001 | *** | |
| Good | 2941 | 36.2 | 2198 | 74.1 | 271 | 9.4 | 289 | 10.1 | 183 | 6.5 | |||
| Fair/poor | 2242 | 23.9 | 1336 | 61.5 | 317 | 13.5 | 276 | 12.6 | 313 | 12.4 | |||
| Physical activity | |||||||||||||
| 3 times/week | 3389 | 44.1 | 2653 | 79.1 | 270 | 7.0 | 284 | 8.7 | 182 | 5.2 | <0.0001 | *** | |
| No exercise | 4576 | 55.6 | 3134 | 69.6 | 517 | 11.1 | 499 | 11.3 | 426 | 7.9 | |||
| Heart | |||||||||||||
| Yes | 1134 | 13.5 | 744 | 68.4 | 156 | 12.1 | 128 | 11.5 | 106 | 8.1 | 0.013 | * | |
| No | 6850 | 86.5 | 5056 | 74.6 | 631 | 8.8 | 659 | 10.0 | 504 | 6.5 | |||
| Hypertension | |||||||||||||
| Yes | 4938 | 58.9 | 3544 | 73.1 | 521 | 10.0 | 502 | 10.2 | 371 | 6.7 | 0.409 | ||
| No | 3046 | 41.1 | 2256 | 74.7 | 266 | 8.3 | 285 | 10.2 | 239 | 6.8 | |||
| Diabetes | |||||||||||||
| Yes | 2759 | 30.9 | 1925 | 70.7 | 322 | 11.5 | 245 | 9.2 | 267 | 8.6 | <0.0001 | *** | |
| No | 5225 | 69.1 | 3875 | 75.1 | 465 | 8.3 | 542 | 10.7 | 343 | 5.9 | |||
| Asthma | |||||||||||||
| Yes | 991 | 11.2 | 561 | 58.5 | 128 | 12.8 | 160 | 16.4 | 142 | 12.3 | <0.0001 | *** | |
| No | 6993 | 88.8 | 5239 | 75.7 | 659 | 8.8 | 627 | 9.4 | 468 | 6.1 | |||
| COPD | |||||||||||||
| Yes | 609 | 6.7 | 310 | 49.8 | 97 | 17.6 | 107 | 17.9 | 95 | 14.7 | <0.0001 | *** | |
| No | 7375 | 93.3 | 5490 | 75.5 | 690 | 8.7 | 680 | 9.6 | 515 | 6.2 | |||
| Arthritis | |||||||||||||
| Yes | 1359 | 15.5 | 788 | 60.0 | 208 | 14.3 | 185 | 14.1 | 178 | 11.5 | <0.0001 | *** | |
| No | 6625 | 84.5 | 5012 | 76.3 | 579 | 8.3 | 602 | 9.5 | 432 | 5.9 | |||
| GERD | |||||||||||||
| Yes | 1264 | 15.0 | 728 | 58.7 | 190 | 14.4 | 177 | 15.4 | 169 | 11.5 | <0.0001 | *** | |
| No | 6720 | 85.0 | 5072 | 76.4 | 597 | 8.4 | 610 | 9.3 | 441 | 5.9 | |||
| Total Sample | Hyperlipidemia Only | Hyperlipidemia and Anxiety | Hyperlipidemia and Depression | Hyperlipidemia and Depression and Anxiety | ||||||||
|---|---|---|---|---|---|---|---|---|---|---|---|---|
| Mean | SD | Mean | SE | Mean | SE | Mean | SE | Mean | SE | p-Value | ||
| HRQoL | ||||||||||||
| PCS | 44.63 | 12.01 | 47.42 | 0.24 | 44.40 | 0.70 | 41.25 | 0.63 | 40.19 | 0.63 | <0.0001 | |
| MCS | 49.44 | 10.15 | 52.34 | 0.15 | 46.44 | 0.52 | 44.59 | 0.54 | 40.13 | 0.62 | <0.0001 | |
| Physical Component Summary | Mental Component Summary | ||||||||
|---|---|---|---|---|---|---|---|---|---|
| HLP Group | Comparison Group | Mean Difference | Confidence Interval | Sig | Mean Difference | Confidence Interval | Sig | ||
| HLP only | HLP + ANX | 3.70 | 2.56 | 4.85 | *** | 6.66 | 5.76 | 7.56 | *** |
| HLP only | HLP + Dep | 6.42 | 5.27 | 7.56 | *** | 8.48 | 7.58 | 9.38 | *** |
| HLP only | HLP + DEP + ANX | 7.63 | 6.35 | 8.91 | *** | 12.98 | 11.97 | 13.99 | *** |
| HLP + ANX | HLP only | −3.70 | −4.85 | −2.56 | *** | −6.66 | −7.56 | −5.76 | *** |
| HLP + ANX | HLP + DEP | 2.71 | 1.20 | 4.23 | *** | 1.82 | 0.62 | 3.01 | *** |
| HLP + ANX | HLP + DEP + ANX | 3.92 | 2.30 | 5.55 | *** | 6.31 | 5.04 | 7.59 | *** |
| HLP + DEP | HLP only | −6.42 | −7.56 | −5.27 | *** | −8.48 | −9.38 | −7.58 | *** |
| HLP + DEP | HLP + ANX | −2.71 | −4.23 | −1.20 | *** | −1.82 | −3.01 | −0.62 | *** |
| HLP + DEP | HLP + DEP + ANX | 1.21 | −0.41 | 2.83 | 4.49 | 3.22 | 5.77 | *** | |
| HLP + DEP + ANX | HLP only | −7.63 | −8.91 | −6.35 | *** | −12.98 | −13.99 | −11.97 | *** |
| HLP + DEP + ANX | HLP + ANX | −3.92 | −5.55 | −2.30 | *** | −6.31 | −7.59 | −5.04 | *** |
| HLP + DEP + ANX | HLP + DEP | −1.21 | −2.83 | 0.41 | −4.49 | −5.77 | −3.22 | *** | |
| Health-Related Quality of Life | |||||||||
|---|---|---|---|---|---|---|---|---|---|
| Physical Component Summary | Mental Component Summary | ||||||||
| β | SE | 95% CI | Sig. | β | SE | 95% CI | Sig. | ||
| Hyperlipidemia (HLP) groups | |||||||||
| HLP and depression | −1.23 | 0.045 | −1.19–−1.26 | *** | −5.53 | 0.019 | −5.50–−5.57 | *** | |
| HLP and anxiety | −0.05 | 0.022 | −0.49–−0.06 | ** | −4.40 | 0.031 | −4.38–−4.42 | *** | |
| HLP and depression and anxiety | −0.73 | 0.075 | −0.69–−0.75 | *** | −8.73 | 0.133 | −8.71–−8.74 | *** | |
| HLP only (Ref.) | |||||||||
| Age in years | |||||||||
| 18–39 | 2.64 | 0.017 | 2.45–2.68 | *** | −1.96 | 0.030 | −1.94–−1.99 | *** | |
| 40–49 | 1.50 | 0.025 | 1.48–1.52 | *** | −1.33 | 0.033 | −1.31–−1.38 | *** | |
| 50–64 (Ref.) | |||||||||
| Gender | |||||||||
| Women | 0.55 | 0.022 | 0.54–0.58 | *** | 0.49 | 0.020 | 0.42–0.51 | *** | |
| Men (Ref.) | |||||||||
| Race/ethnicity | |||||||||
| African Am | 0.21 | 0.048 | 0.20–0.25 | *** | 0.42 | 0.031 | 0.39–0.47 | *** | |
| Latino | 1.64 | 0.026 | 1.62–1.66 | *** | 0.38 | 0.031 | 0.34–0.39 | *** | |
| Others | 0.18 | 0.021 | 0.15–0.21 | *** | −0.29 | 0.046 | −0.22–−0.31 | *** | |
| White (Ref.) | |||||||||
| Marital status | |||||||||
| Married | −0.32 | 0.022 | −0.29–−0.35 | *** | 1.11 | 0.03 | 1.10–1.14 | *** | |
| Widow/Sep/Div. | 0.03 | 0.028 | 0.01–0.06 | 1.19 | 0.05 | 1.15–1.23 | *** | ||
| Never married (Ref.) | |||||||||
| Education level | |||||||||
| >HS | −0.96 | 0.030 | −0.94–−0.99 | *** | 1.12 | 0.024 | 1.10–1.16 | *** | |
| HS | −0.93 | 0.045 | −0.93–−0.98 | *** | 1.35 | 0.035 | 1.30–1.38 | *** | |
| <HS (Ref.) | |||||||||
| Region | |||||||||
| Northeast | 1.09 | 0.011 | 1.05–1.12 | *** | −0.12 | 0.019 | −0.10–−0.15 | *** | |
| Mid-west | 0.37 | 0.008 | 0.33–0.39 | *** | 0.13 | 0.016 | 0.11–0.17 | *** | |
| South | −0.34 | 0.026 | −0.32–−0.37 | *** | 0.09 | 0.038 | 0.05–0.12 | * | |
| West (Ref.) | |||||||||
| Employment | |||||||||
| Employed | 3.71 | 0.050 | 3.47–3.79 | *** | 1.52 | 0.031 | 1.50–1.57 | *** | |
| Not employed (Ref.) | |||||||||
| Poverty status | |||||||||
| Poor | −1.72 | 0.033 | −1.70–−1.75 | *** | −1.62 | 0.029 | −1.59–−1.67 | *** | |
| Near Poor | −1.49 | 0.023 | −1.46–−1.51 | *** | −0.80 | 0.044 | −0.78–−0.84 | *** | |
| Middle Income | −0.76 | 0.021 | −0.73–−0.79 | *** | 0.28 | 0.022 | 0.25–0.31 | *** | |
| High Income (Ref.) | |||||||||
| Health Insurance | |||||||||
| Private | −0.16 | 0.071 | −0.13–−0.18 | * | −0.66 | 0.099 | −0.61–−0.73 | *** | |
| Public | −3.35 | 0.061 | −3.30–−3.39 | *** | −1.73 | 0.105 | −1.70–−1.77 | *** | |
| Uninsured (Ref.) | |||||||||
| Rx Insurance | |||||||||
| Rx insurance | −0.33 | 0.022 | −0.31–−0.38 | *** | −0.82 | 0.046 | −0.79–−0.86 | *** | |
| No Rx insurance (Ref.) | |||||||||
| General health | |||||||||
| Excellent/very good | 11.70 | 0.039 | 10.95–11.8 | *** | 6.29 | 0.034 | 6.10–6.32 | *** | |
| Good | 7.26 | 0.020 | 7.10–7.32 | *** | 4.42 | 0.035 | 4.39–4.47 | *** | |
| Fair/poor (Ref.) | |||||||||
| Physical activity | |||||||||
| 3/week | 1.60 | 0.015 | 1.57–1.66 | *** | 0.96 | 0.027 | 0.93–0.98 | *** | |
| No exercise (Ref.) | |||||||||
| Heart | |||||||||
| Yes | −2.78 | 0.040 | −2.56–−2.90 | *** | −0.22 | 0.084 | −0.20–−0.19 | ** | |
| Hypertension | |||||||||
| Yes | −1.20 | 0.017 | −1.18–−1.28 | *** | 0.16 | 0.030 | 0.13–0.18 | *** | |
| Diabetes | |||||||||
| Yes | −1.37 | 0.029 | −1.33–−1.33 | *** | 0.48 | 0.024 | 0.44–0.53 | *** | |
| Asthma | |||||||||
| Yes | −1.81 | 0.031 | −1.78–−1.85 | *** | −1.03 | 0.023 | −1.00–−1.09 | *** | |
| COPD | |||||||||
| Yes | −1.71 | 0.036 | −1.65–−1.76 | *** | 0.74 | 0.047 | 0.56–0.79 | *** | |
| Arthritis | |||||||||
| Yes | −3.32 | 0.051 | −3.30–−3.41 | *** | −0.25 | 0.024 | −0.21–−0.29 | *** | |
| GERD | |||||||||
| Yes | −1.08 | 0.034 | −1.06–−1.10 | *** | −0.56 | 0.057 | −0.50–−0.60 | *** | |
Disclaimer/Publisher’s Note: The statements, opinions and data contained in all publications are solely those of the individual author(s) and contributor(s) and not of MDPI and/or the editor(s). MDPI and/or the editor(s) disclaim responsibility for any injury to people or property resulting from any ideas, methods, instructions or products referred to in the content. |
© 2025 by the author. Licensee MDPI, Basel, Switzerland. This article is an open access article distributed under the terms and conditions of the Creative Commons Attribution (CC BY) license (https://creativecommons.org/licenses/by/4.0/).
Share and Cite
Alwhaibi, M. The Impact of Anxiety and Depression on Health-Related Quality of Life in Hyperlipidemic Adults in the United States. J. Clin. Med. 2025, 14, 370. https://doi.org/10.3390/jcm14020370
Alwhaibi M. The Impact of Anxiety and Depression on Health-Related Quality of Life in Hyperlipidemic Adults in the United States. Journal of Clinical Medicine. 2025; 14(2):370. https://doi.org/10.3390/jcm14020370
Chicago/Turabian StyleAlwhaibi, Monira. 2025. "The Impact of Anxiety and Depression on Health-Related Quality of Life in Hyperlipidemic Adults in the United States" Journal of Clinical Medicine 14, no. 2: 370. https://doi.org/10.3390/jcm14020370
APA StyleAlwhaibi, M. (2025). The Impact of Anxiety and Depression on Health-Related Quality of Life in Hyperlipidemic Adults in the United States. Journal of Clinical Medicine, 14(2), 370. https://doi.org/10.3390/jcm14020370