
Machine Learning Models for the Early Real-Time Prediction of Deterioration in Intensive Care Units—A Novel Approach to the Early Identification of High-Risk Patients

 , , ,
, , ,
Abstract
1. Introduction
2. Methods
2.1. Patients
2.2. Data Preprocessing
2.3. Machine Learning Methods
3. Results
4. Discussion
5. Conclusions
Author Contributions
Funding
Institutional Review Board Statement
Informed Consent Statement
Data Availability Statement
Conflicts of Interest
References
- Biccard, B.M.; Rodseth, R.N. Rodseth Utility of clinical risk predictors for preoperative cardiovascular risk prediction. Br. J. Anaesth. 2011, 107, 133–143. [Google Scholar] [CrossRef]
- Doyle, D.J. Clinical Early Warning Scores: New Clinical Tools in Evolution. Open Anesth. J. 2018, 12. [Google Scholar] [CrossRef]
- Blackwell, J.N.; Keim-Malpass, J.; Clark, M.T.; Kowalski, R.L.; Najjar, S.N.; Bourque, J.M.; Lake, D.E.; Moorman, J.R. Early Detection of In-Patient Deterioration: One Prediction Model Does Not Fit All. Crit. Care Explor. 2020, 2, e0116. [Google Scholar] [CrossRef] [PubMed]
- Rapsang, A.; Shyam, D.C.; Ag, R. Scoring systems in the intensive care unit: A compendium. Indian J. Crit. Care Med. 2014, 18, 220–228. [Google Scholar] [CrossRef] [PubMed]
- Flenady, T.; Dwyer, T.; Signal, T.; Murray-Boyle, C.; Le Lagadec, D.; Kahl, J.; Browne, M. Queensland Adult Deterioration Detection System observation chart diagnostic accuracy in detecting patient deterioration: A retrospective case–control study. Collegian 2023, 30, 779–785. [Google Scholar] [CrossRef]
- Rodseth, R.N.; Biccard, B.M.; Le Manach, Y.; Sessler, D.I.; Buse, G.A.L.; Thabane, L.; Schutt, R.C.; Bolliger, D.; Cagini, L.; Cardinale, D.; et al. The Prognostic Value of Pre-Operative and Post-Operative B-Type Natriuretic Peptides in Patients Undergoing Noncardiac Surgery. J. Am. Coll. Cardiol. 2014, 63, 170–180. [Google Scholar] [CrossRef] [PubMed]
- Pérez-Fernández, J.; Raimondi, N.A.; Murillo Cabezas, F. Digital Transformation: The Smart ICU. In Critical Care Administration; Springer: Cham, Switzerland, 2020; pp. 111–125. [Google Scholar] [CrossRef]
- Islam, M.; Nasrin, T.; Walther, B.A.; Wu, C.-C.; Yang, H.-C.; Li, Y.-C. Prediction of sepsis patients using machine learning approach: A meta-analysis. Comput. Methods Programs Biomed. 2019, 170, 1–9. [Google Scholar] [CrossRef]
- Barboi, C.; Tzavelis, A.; Muhammad, L.N. Comparison of Severity of Illness Scores and Artificial Intelligence Models That Are Predictive of Intensive Care Unit Mortality: Meta-analysis and Review of the Literature. JMIR Med. Inform. 2022, 10, e35293. [Google Scholar] [CrossRef]
- Choi, M.H.; Kim, D.; Choi, E.J.; Jung, Y.J.; Choi, Y.J.; Cho, J.H.; Jeong, S.H. Mortality prediction of patients in intensive care units using machine learning algorithms based on electronic health records. Sci. Rep. 2022, 12, 7180. [Google Scholar] [CrossRef] [PubMed]
- Collins, G.S.; Reitsma, J.B.; Altman, D.G.; Moons, K.G. Transparent reporting of a multivariable prediction model for individual prognosis or diagnosis (TRIPOD): The TRIPOD statement. BMJ 2015, 350, g7594. [Google Scholar] [CrossRef] [PubMed]
- Ghalati, P.F.; Samal, S.S.; Bhat, J.S.; Deisz, R.; Marx, G.; Schuppert, A. Critical Transitions in Intensive Care Units: A Sepsis Case Study. Sci. Rep. 2019, 9, 12888. [Google Scholar] [CrossRef]
- Moor, M.; Rieck, B.; Horn, M.; Jutzeler, C.R.; Borgwardt, K. Early Prediction of Sepsis in the ICU Using Machine Learning: A Systematic Review. Front. Med. 2021, 8, 607952. [Google Scholar] [CrossRef]
- Fleuren, L.M.; Klausch, T.L.T.; Zwager, C.L.; Schoonmade, L.J.; Guo, T.; Roggeveen, L.F.; Swart, E.L.; Girbes, A.R.J.; Thoral, P.; Ercole, A.; et al. Machine learning for the prediction of sepsis: A systematic review and meta-analysis of diagnostic test accuracy. Intensiv. Care Med. 2020, 46, 383–400. [Google Scholar] [CrossRef] [PubMed]
- Harrel, F.E., Jr. Regression Modeling Strategies—With Applications to Linear Models, Logistic and Ordinal Regression, and Survival Analysis; R Software; Springer: New York, NY, USA, 2015; Volume 70. [Google Scholar]
- R Core Team. A Language and Environment for Statistical Computing; R Foundation for Statistical Computing: Vienna, Austria, 2020; Available online: https://www.R-project.org/ (accessed on 18 December 2024).
- Fritsch, S.; Guenther, F.; Wright, M. Neuralnet: Training of Neural Networks. R Package Version 1.44.2. 2019. Available online: https://CRANR-project.org/package=neuralnet (accessed on 18 December 2024).
- Meyer, D.; Dimitriadou, E.; Hornik, K.; Weingessel, A.; Leisch, F.; Chang, C.C.; Lin, C.C. e1071: Misc Functions of the Department of Statistics, Probability Theory Group (Formerly: E1071), R package version 1.7-12; TU Wien: Vienna, Austria, 2022. [Google Scholar]
- Wright, M.N.; Ziegler, A. Ranger: A fast implementation of random forests for high dimensional data in C++ and R. J. Stat. Softw. 2017, 77, 1–17. [Google Scholar] [CrossRef]
- Venables, W.N.; Ripley, B.D. Modern Applied Statistics with S, 4th ed.; Springer: Berlin/Heidelberg, Germany, 2002. [Google Scholar]
- Nemati, S.; Holder, A.M.; Razmi, F.; Stanley, M.D.; Clifford, G.D.; Buchman, T.G. An Interpretable Machine Learning Model for Accurate Prediction of Sepsis in the ICU. Crit. Care Med. 2018, 46, 547–553. [Google Scholar] [CrossRef] [PubMed]
- Kaji, D.A.; Zech, J.R.; Kim, J.S.; Cho, S.K.; Dangayach, N.S.; Costa, A.B.; Oermann, E.K. An attention based deep learning model of clinical events in the intensive care unit. PLoS ONE 2019, 14, e0211057. [Google Scholar] [CrossRef] [PubMed]
- Dahn, C.M.; Manasco, A.T.; Breaud, A.H.; Kim, S.; Rumas, N.; Moin, O.; Mitchell, P.M.; Nelson, K.P.; Baker, W.; Feldman, J.A. A critical analysis of unplanned ICU transfer within 48 hours from ED admission as a quality measure. Am. J. Emerg. Med. 2016, 34, 1505–1510. [Google Scholar] [CrossRef] [PubMed]
- Le Guen, M.P.; Tobin, A.E.; Reid, D. Intensive care unit admission in patients following rapid response team activation: Call factors, patient characteristics and hospital outcomes. Anaesth Intensive Care 2015, 43, 211–215. [Google Scholar] [CrossRef]
- Moss, T.J.; Clark, M.T.; Calland, J.F.; Enfield, K.B.; Voss, J.D.; Lake, D.E.; Moorman, J.R. Cardiorespiratory dynamics measured from continuous ECG monitoring improves detection of deterioration in acute care patients: A retrospective cohort study. PLoS ONE 2017, 12, e0181448. [Google Scholar] [CrossRef]
- Moss, T.J.; Lake, D.E.; Calland, J.F.; Enfield, K.B.; Delos, J.B.; Fairchild, K.D.; Moorman, J.R. Signatures of Subacute Potentially Catastrophic Illness in the ICU: Model Development and Validation*. Crit. Care Med. 2016, 44, 1639–1648. [Google Scholar] [CrossRef]
- Hillman, K.M.; Bristow, P.J.; Chey, T.; Daffurn, K.; Jacques, T.; Norman, S.L.; Bishop, G.F.; Simmons, G. Duration of life-threatening antecedents prior to intensive care admission. Intensive Care Med. 2002, 28, 1629–1634. [Google Scholar] [CrossRef] [PubMed]
- Cohen, R.I.; Eichorn, A.; Motschwiller, C.; Laktikova, V.; La Torre, G.; Ginsberg, N.; Steinberg, H. Medical intensive care unit consults occurring within 48 hours of admission: A prospective study. J. Crit. Care 2015, 30, 363–368. [Google Scholar] [CrossRef] [PubMed]
- Bapoje, S.R.; Gaudiani, J.L.; Narayanan, V.; Albert, R.K. Unplanned transfers to a medical intensive care unit: Causes and relationship to preventable errors in care. J. Hosp. Med. 2011, 6, 68–72. [Google Scholar] [CrossRef] [PubMed]
- Keim-Malpass, J.; Kitzmiller, R.R.; Skeeles-Worley, A.; Lindberg, C.; Clark, M.T.; Tai, R.; Calland, J.F.; Sullivan, K.; Moorman, J.R.; Anderson, R.A. Advancing Continuous Predictive Analytics Monitoring: Moving from Implementation to Clinical Action in a Learning Health System. Crit. Care Nurs. Clin. N. Am. 2018, 30, 273–287. [Google Scholar] [CrossRef] [PubMed]
- Ferrer, R.; Martin-Loeches, I.; Phillips, G.; Osborn, T.M.; Townsend, S.; Dellinger, R.P.; Artigas, A.; Schorr, C.; Levy, M.M. Empiric antibiotic treatment reduces mortality in severe sepsis and septic shock from the first hour: Results from a guideline-based performance improvement program. Crit. Care Med. 2014, 42, 1749–1755. [Google Scholar] [CrossRef] [PubMed]
- Kumar, A.; Roberts, D.; Wood, K.E.; Light, B.; Parrillo, J.E.; Sharma, S.; Suppes, R.; Feinstein, D.; Zanotti, S.; Taiberg, L.; et al. Duration of hypotension before initiation of effective antimicrobial therapy is the critical determinant of survival in human septic shock. Crit. Care Med. 2006, 34, 1589–1596. [Google Scholar] [CrossRef] [PubMed]
- Kipnis, P.; Turk, B.J.; Wulf, D.A.; LaGuardia, J.C.; Liu, V.; Churpek, M.M.; Romero-Brufau, S.; Escobar, G.J. Development and validation of an electronic medical record-based alert score for detection of inpatient deterioration outside the ICU. J. Biomed. Inform. 2016, 64, 10–19. [Google Scholar] [CrossRef]
- Escobar, G.J.; Turk, B.J.; Ragins, A.; Ha, J.; Hoberman, B.; LeVine, S.M.; Ballesca, M.A.; Liu, V.; Kipnis, P. Piloting electronic medical record–based early detection of inpatient deterioration in community hospitals. J. Hosp. Med. 2016, 11, S18–S24. [Google Scholar] [CrossRef]
- Shimabukuro, D.W.; Barton, C.W.; Feldman, M.D.; Mataraso, S.J.; Das, R. Effect of a machine learning-based severe sepsis prediction algorithm on patient survival and hospital length of stay: A randomised clinical trial. BMJ Open Respir. Res. 2017, 4, e000234. [Google Scholar] [CrossRef]
- Mao, Q.; Jay, M.; Hoffman, J.L.; Calvert, J.; Barton, C.; Shimabukuro, D.; Shieh, L.; Chettipally, U.; Fletcher, G.; Kerem, Y.; et al. Multicentre validation of a sepsis prediction algorithm using only vital sign data in the emergency department, general ward and ICU. BMJ Open 2018, 8, e017833. [Google Scholar] [CrossRef] [PubMed]
- Horng, S.; Sontag, D.A.; Halpern, Y.; Jernite, Y.; Shapiro, N.I.; Nathanson, L.A. Creating an automated trigger for sepsis clinical decision support at emergency department triage using machine learning. PLoS ONE 2017, 12, e0174708. [Google Scholar] [CrossRef] [PubMed]
- Giannini, H.M.; Ginestra, J.C.; Chivers, C.; Draugelis, M.B.; Hanish, A.; Schweickert, W.D.; Fuchs, B.D.; Meadows, L.R.; Lynch, M.R.; Donnelly, P.J.R.; et al. A Machine Learning Algorithm to Predict Severe Sepsis and Septic Shock. Crit. Care Med. 2019, 47, 1485–1492. [Google Scholar] [CrossRef]
- Ginestra, J.C.; Giannini, H.M.; Schweickert, W.D.; Meadows, L.R.; Lynch, M.J.R.; Pavan, K.M.; Chivers, C.J.; Draugelis, M.B.; Donnelly, P.J.R.; Fuchs, B.D.; et al. Clinician Perception of a Machine Learning–Based Early Warning System Designed to Predict Severe Sepsis and Septic Shock. Crit. Care Med. 2019, 47, 1477–1484. [Google Scholar] [CrossRef] [PubMed]
- Li, X.; Xu, X.; Xie, F.; Xu, X.M.; Sun, Y.M.; Liu, X.M.; Jia, X.B.; Kang, Y.M.; Xie, L.; Wang, F.; et al. A Time-Phased Machine Learning Model for Real-Time Prediction of Sepsis in Critical Care. Crit. Care Med. 2020, 48, e884–e888. [Google Scholar] [CrossRef] [PubMed]
- Evans, L.; Rhodes, A.; Alhazzani, W.; Antonelli, M.; Coopersmith, C.M.; French, C.; Machado, F.R.; Mcintyre, L.; Ostermann, M.; Prescott, H.C.; et al. Surviving sepsis campaign: International guidelines for management of sepsis and septic shock 2021. Intensive Care Med. 2021, 47, 1181–1247. [Google Scholar] [CrossRef] [PubMed]

| Method | Parameters | R Package | Version | |
|---|---|---|---|---|
| Logistic regression | stats [16] | 3.6.3 | ||
| Artificial neural network | Algorithm: | Resilient backpropagation +(PROP+) | neuralnet [17] | 1.44.2 |
| No. of hidden layers: | 1 | |||
| Stopping criterion: | Threshold 0.01 | |||
| Maximal no. of training steps: | 100,000 | |||
| Error function: | Sum-of-squares error | |||
| Activation function: | Logistic function | |||
| Output function: | Simple threshold | |||
| Support vector machine | Kernel: | Radial basis kernel | e1071 [18] | 1.7–12 |
| : | 1/4 | |||
| Cost of constraints: | 1 | |||
| Maximum margin error: | 0.5 | |||
| Tolerance of termination criterion: | 0.001 | |||
| Ɛ in the loss function: | 0.1 | |||
| Random forest | No. of trees: | 500 | ranger [19] | 0.14.1 |
| No. of variables for splitting: | 2 | |||
| Splitting criterion: | Gini index | |||
| Minimal node size: | 1 | |||
| Depth of each tree: | Unlimited | |||
| Selection of observations: | Sampling with replacement | |||
| Linear discriminant analysis | Initial means of groups: | Estimated from data | MASS [20] | 7.3–58.1 |
| Initial variances of groups: | Estimated from data | |||
| Cohort Development Phase | Model Development Phase | |||
|---|---|---|---|---|
| overall | training dataset | test dataset | ||
| qSOFA ≥ 2 | qSOFA < 2 | |||
| n | 76 | 97 | 100 | 73 |
| age in years (sd) | 63.6 (20.3) | 62.3 (16.5) | 63.7 (18.9) | 61.8 (17.3) |
| gender, female/male (%) | 32/44 (42.1/57.9) | 44/53 (45.3/54.7) | 47/53 (47.0/53.0) | 29/44 (39.7/60.3) |
| circulatory or respiratory diagnosis, yes/no (%) | 40/36 (52.6/47.4) | 46/51 (47.4/52.6) | 47/53 (47.0/53.0) | 39/34 (53.4/46.6) |
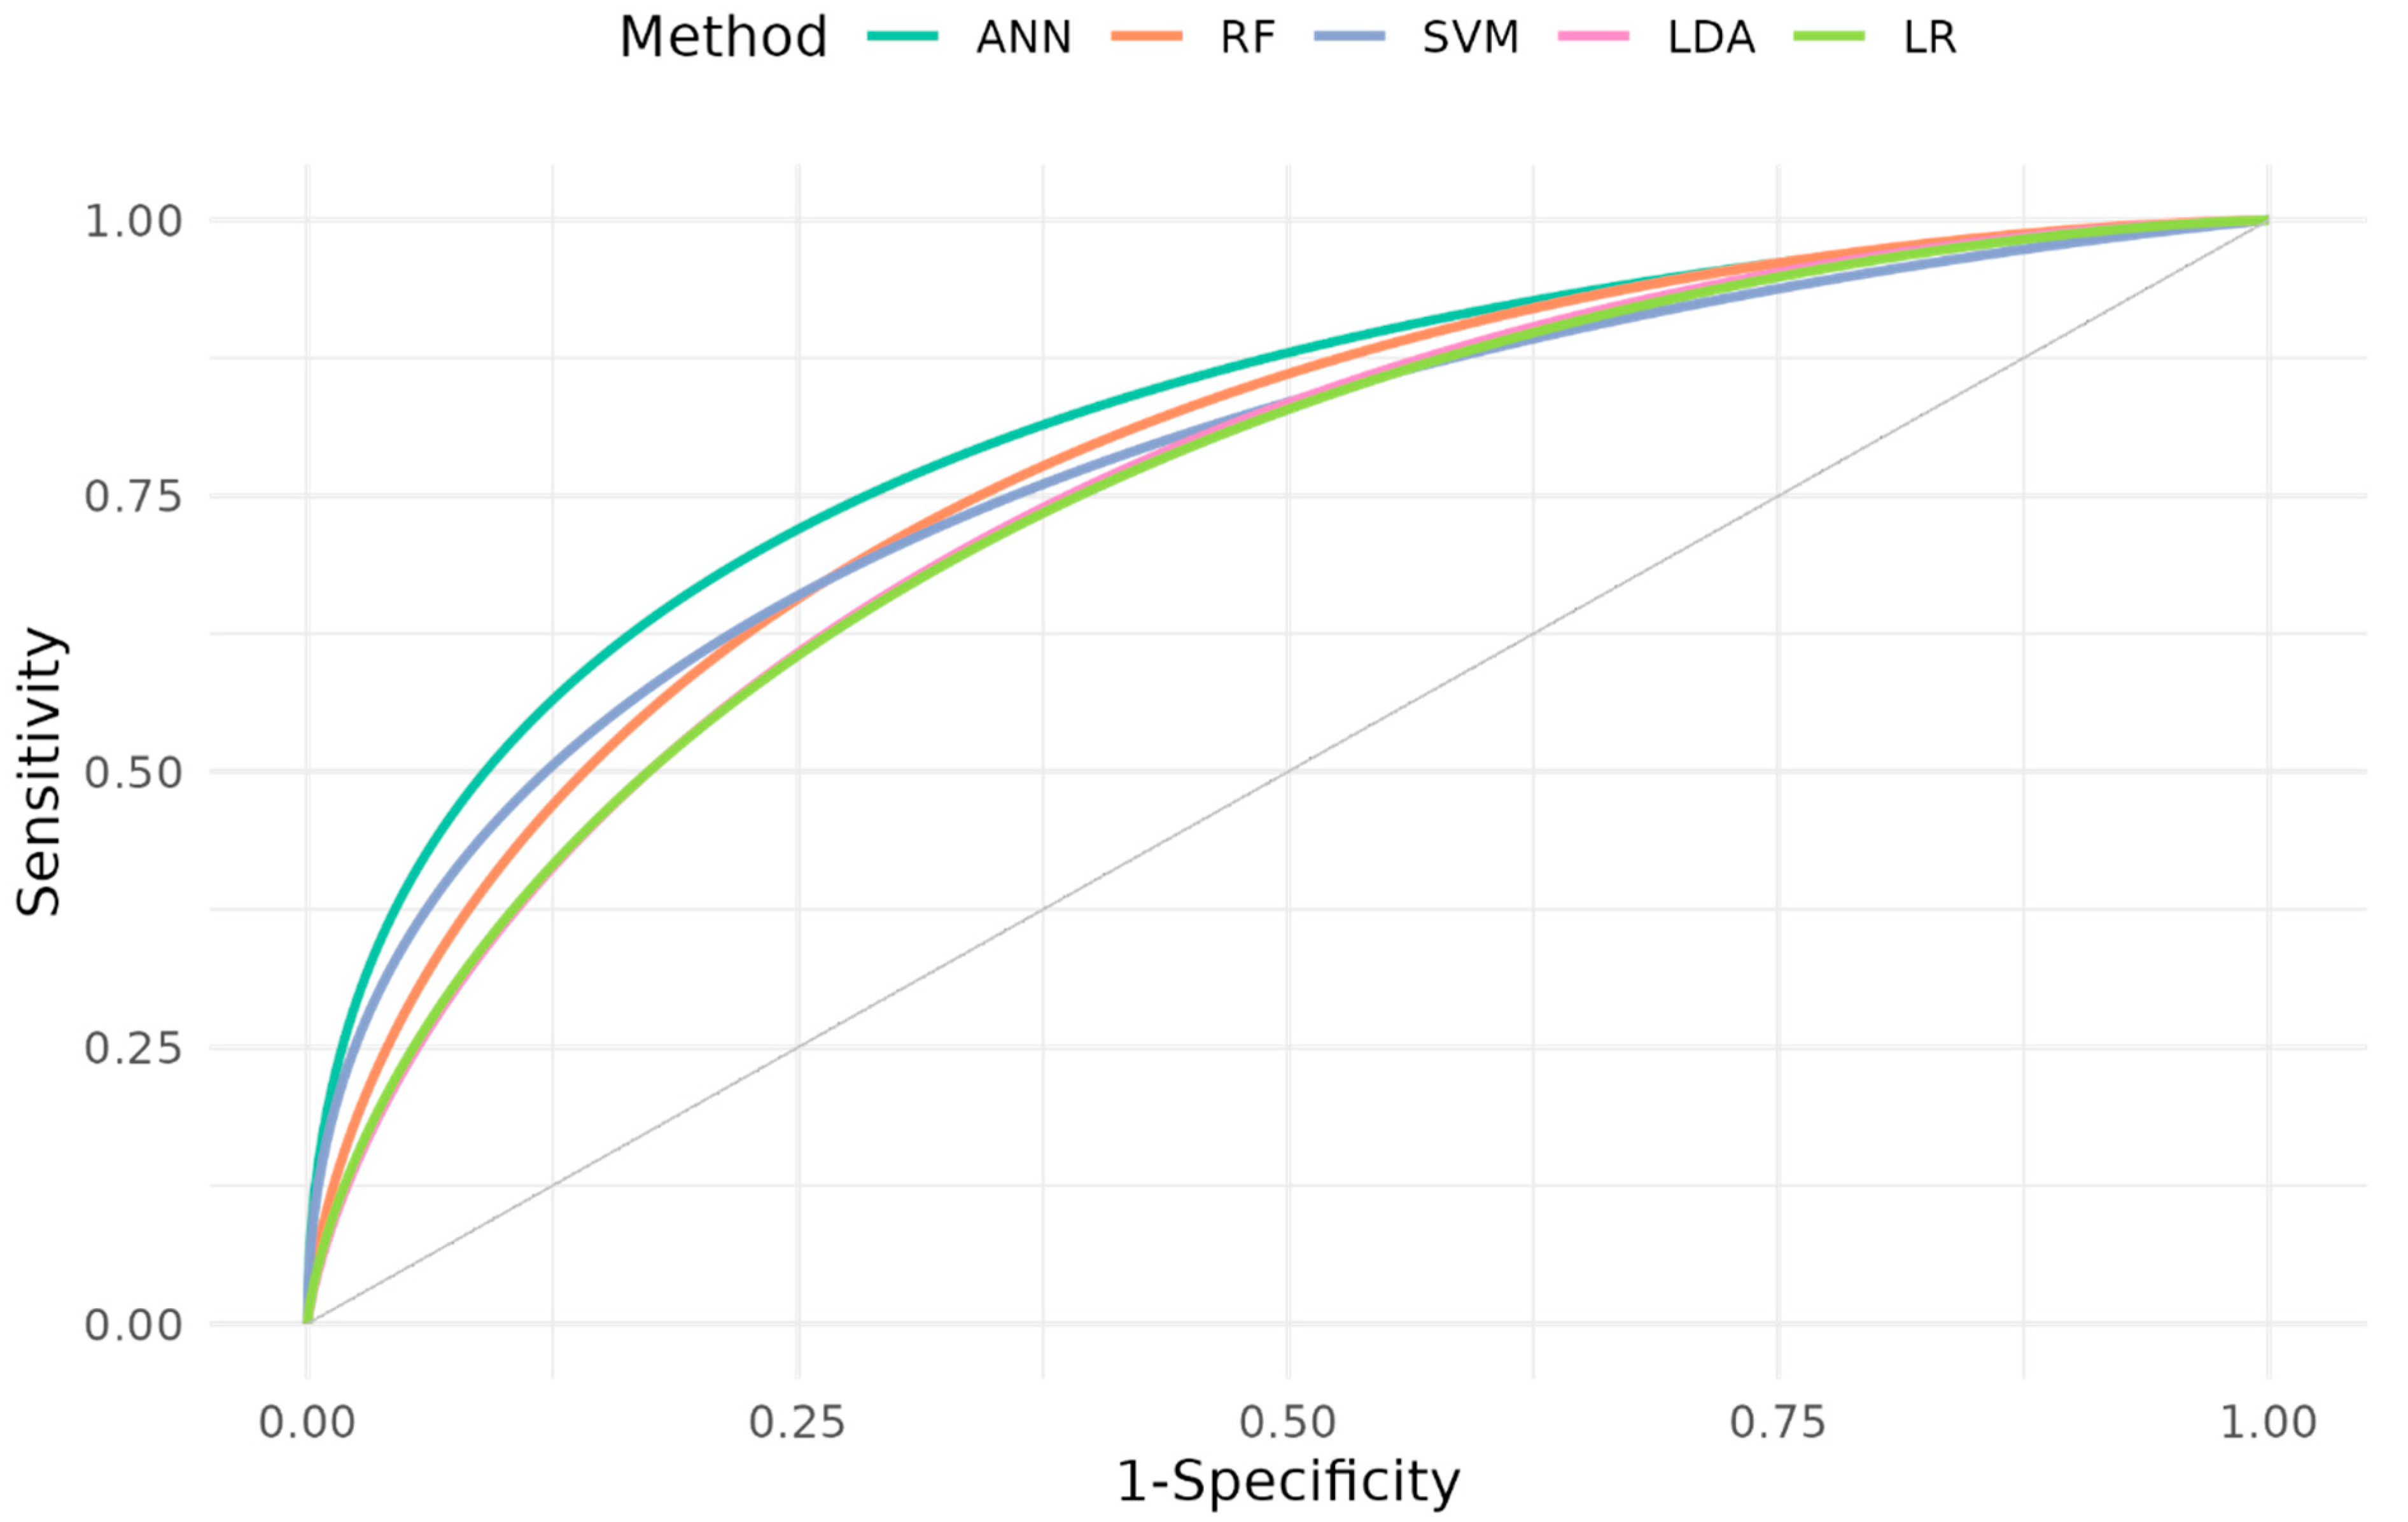
| Method | ANN | RF | SVM | LDA | LR |
|---|---|---|---|---|---|
| AUC (CI) | 0.814 (0.717, 0.912) p = 0.002 | 0.781 (0.674, 0.887) p = 0.005 | 0.778 (0.670, 0.886) p = 0.006 | 0.765 (0.652, 0.877) p = 0.011 | 0.762 (0.650, 0.875) p = 0.011 |
| Sensitivity | 0.853 | 0.706 | 0.706 | 0.735 | 0.735 |
| Specificity | 0.667 | 0.795 | 0.769 | 0.744 | 0.744 |
| PPV | 0.690 | 0.750 | 0.727 | 0.714 | 0.714 |
| NPV | 0.839 | 0.756 | 0.750 | 0.763 | 0.763 |
| Youden’s J statistic | 0.52 | 0.501 | 0.475 | 0.479 | 0.479 |
| Calibration intercept | −0.123 | 0.126 | −0.033 | 0.117 | 0.095 |
| Calibration slope | 1.259 | 0.796 | 1.171 | 0.824 | 0.881 |
| Cut-off | 0.335 | 0.435 | 0.443 | 0.395 | 0.409 |
| LR+ | 2.559 | 3.441 | 3.059 | 2.868 | 2.868 |
| LR- | 0.221 | 0.37 | 0.382 | 0.356 | 0.356 |
Disclaimer/Publisher’s Note: The statements, opinions and data contained in all publications are solely those of the individual author(s) and contributor(s) and not of MDPI and/or the editor(s). MDPI and/or the editor(s) disclaim responsibility for any injury to people or property resulting from any ideas, methods, instructions or products referred to in the content. |
© 2025 by the authors. Licensee MDPI, Basel, Switzerland. This article is an open access article distributed under the terms and conditions of the Creative Commons Attribution (CC BY) license (https://creativecommons.org/licenses/by/4.0/).
Share and Cite
Thiele, D.; Rodseth, R.; Friedland, R.; Berger, F.; Mathew, C.; Maslo, C.; Moll, V.; Leithner, C.; Storm, C.; Krannich, A.; et al. Machine Learning Models for the Early Real-Time Prediction of Deterioration in Intensive Care Units—A Novel Approach to the Early Identification of High-Risk Patients. J. Clin. Med. 2025, 14, 350. https://doi.org/10.3390/jcm14020350
Thiele D, Rodseth R, Friedland R, Berger F, Mathew C, Maslo C, Moll V, Leithner C, Storm C, Krannich A, et al. Machine Learning Models for the Early Real-Time Prediction of Deterioration in Intensive Care Units—A Novel Approach to the Early Identification of High-Risk Patients. Journal of Clinical Medicine. 2025; 14(2):350. https://doi.org/10.3390/jcm14020350
Chicago/Turabian StyleThiele, Dominik, Reitze Rodseth, Richard Friedland, Fabian Berger, Chris Mathew, Caroline Maslo, Vanessa Moll, Christoph Leithner, Christian Storm, Alexander Krannich, and et al. 2025. "Machine Learning Models for the Early Real-Time Prediction of Deterioration in Intensive Care Units—A Novel Approach to the Early Identification of High-Risk Patients" Journal of Clinical Medicine 14, no. 2: 350. https://doi.org/10.3390/jcm14020350
APA StyleThiele, D., Rodseth, R., Friedland, R., Berger, F., Mathew, C., Maslo, C., Moll, V., Leithner, C., Storm, C., Krannich, A., & Nee, J. (2025). Machine Learning Models for the Early Real-Time Prediction of Deterioration in Intensive Care Units—A Novel Approach to the Early Identification of High-Risk Patients. Journal of Clinical Medicine, 14(2), 350. https://doi.org/10.3390/jcm14020350