Author Contributions
Conceptualization, H.E. and S.K. (Satoru Kase); methodology, H.E.; software, H.E.; validation, H.E., Y.I., and S.K. (Satoru Kase); formal analysis, H.E.; investigation, H.E.; resources, S.S.; data curation, H.T.; writing—original draft preparation, H.E.; writing—review and editing, S.K. (Satoru Kase); visualization, H.E.; supervision, S.K. (Satoshi Katsuta); project administration, S.K. (Satoru Kase); funding acquisition, S.K. (Satoru Kase). All authors have read and agreed to the published version of the manuscript.
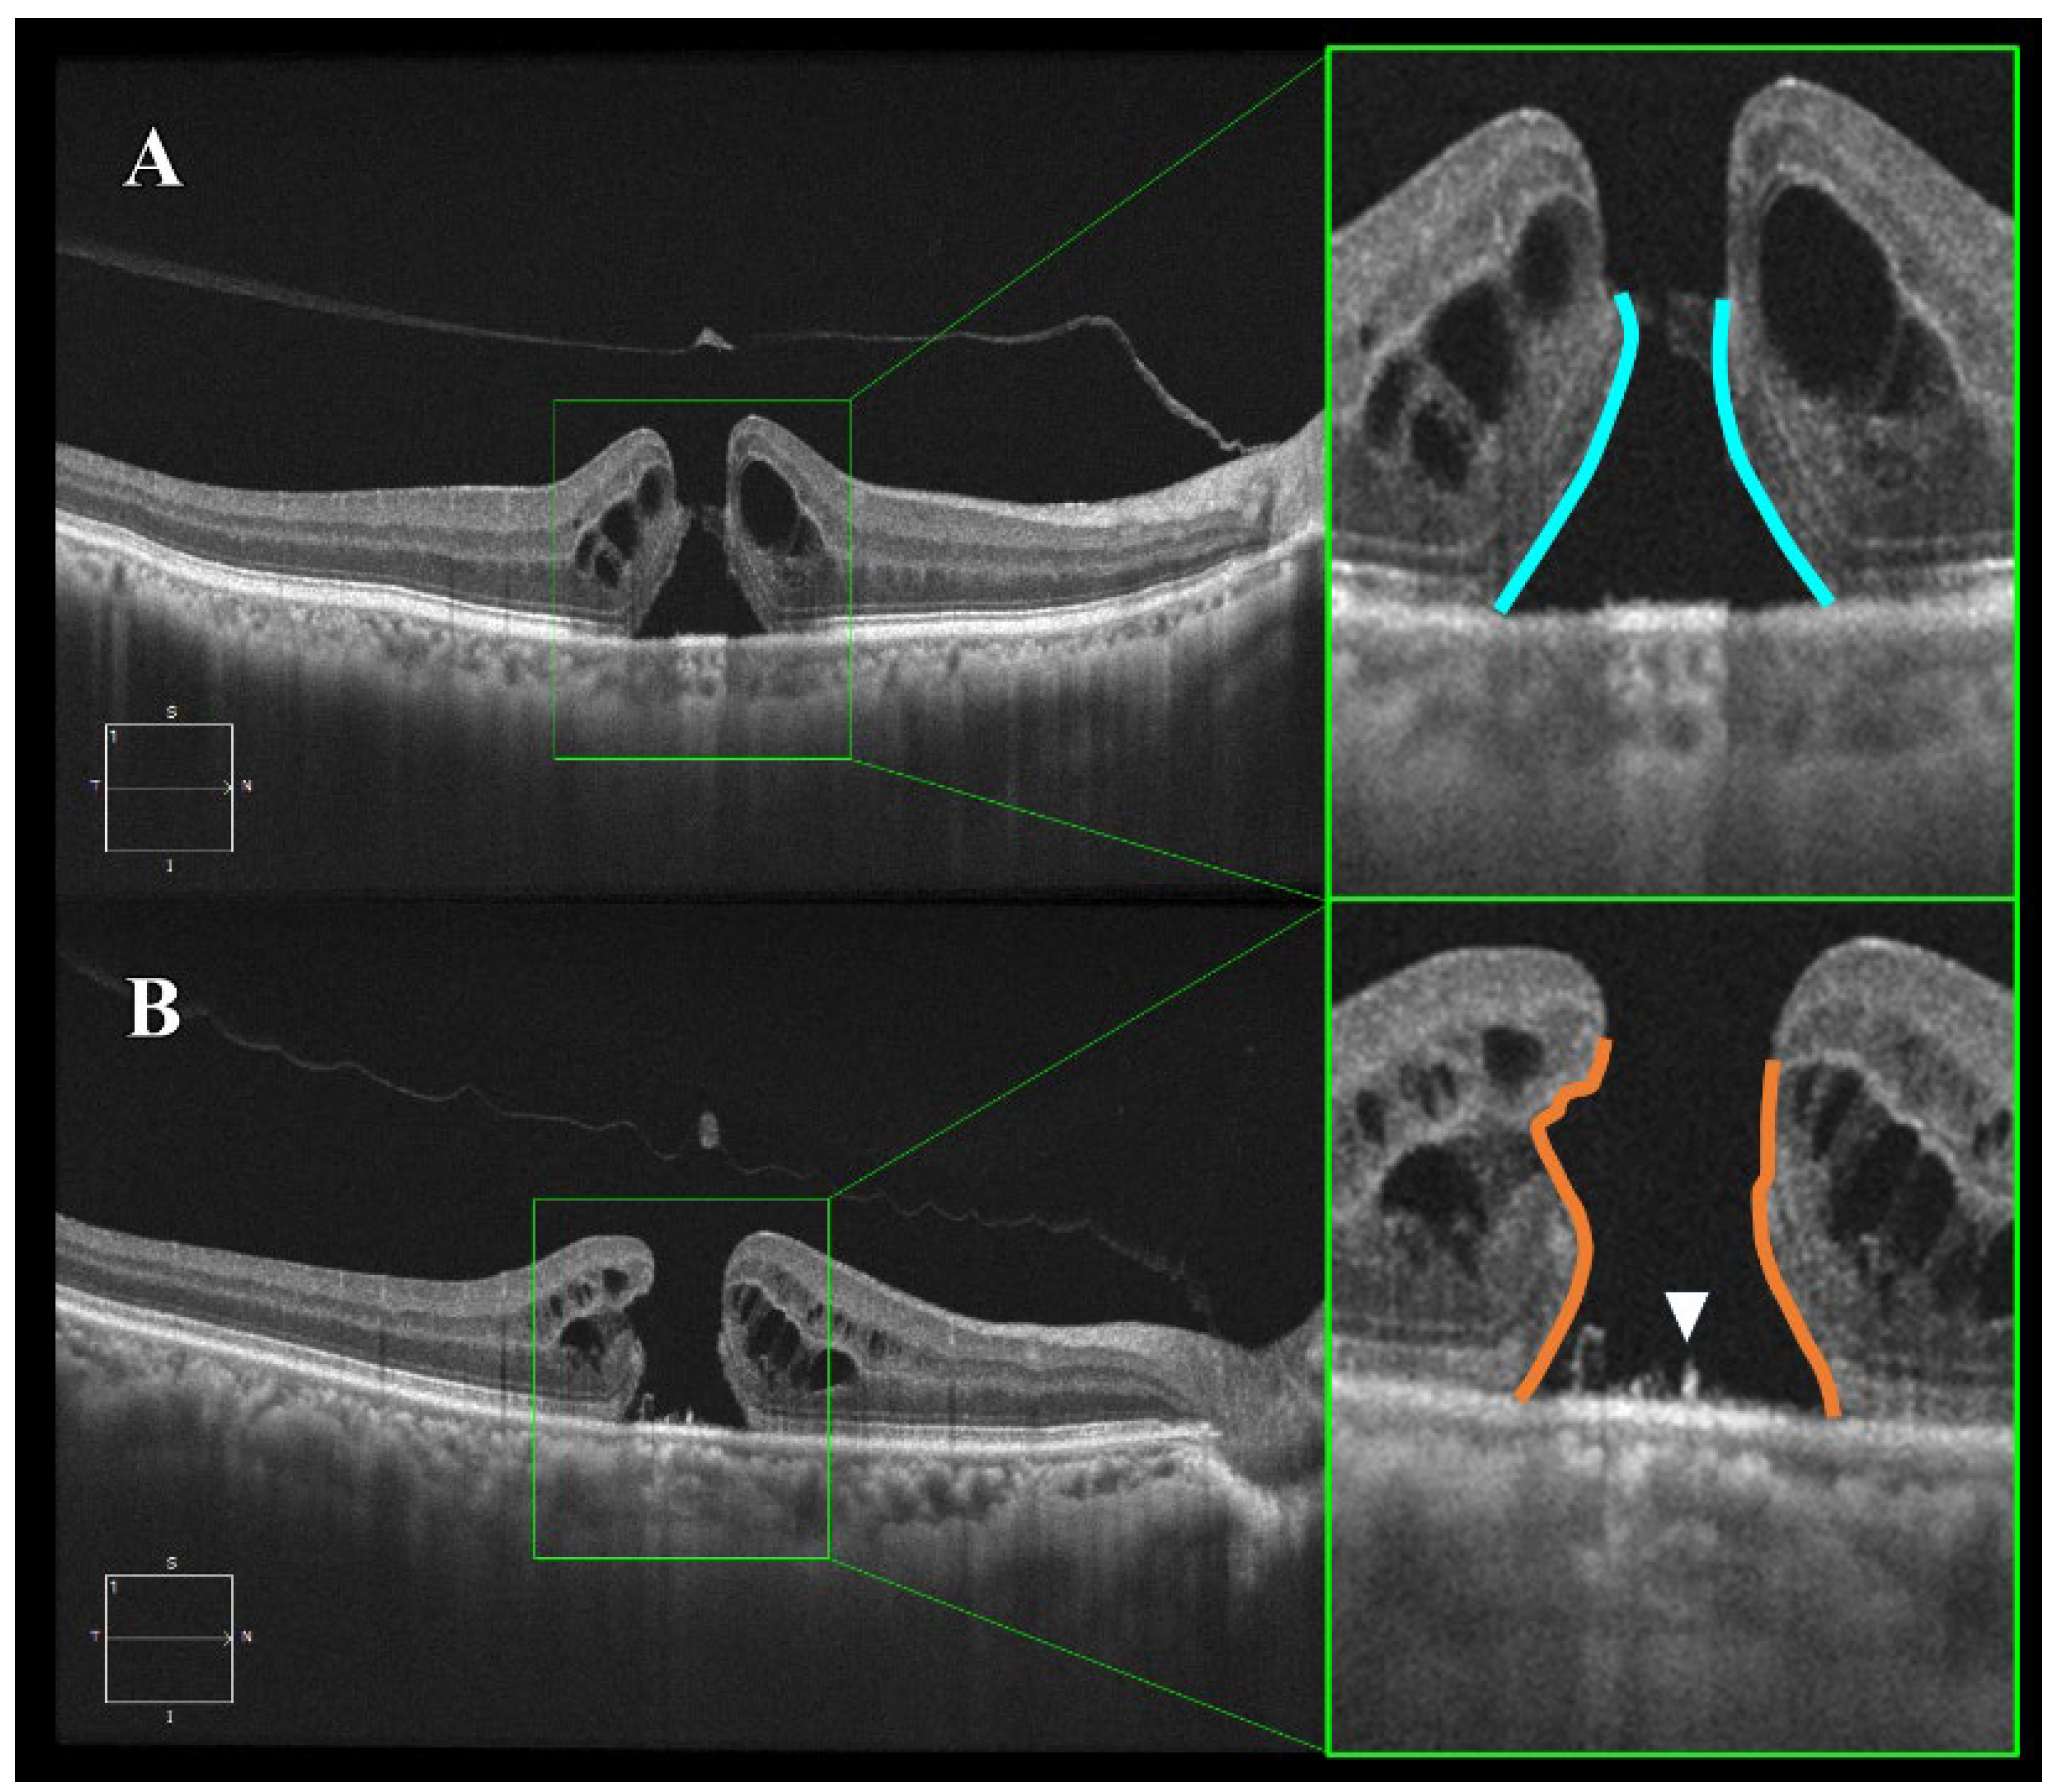
Figure 1.
Optical coherence tomography (OCT) images of smooth and bumpy idiopathic macular hole (IMH) borders. Horizontal B-scan images obtained by spectral-domain OCT. (A) Smooth border: The IMH exhibits a uniform and regular border with relatively mild photoreceptor damage (blue line). (B) Bumpy border: The IMH shows a non-uniform and irregular border with severe photoreceptor damage due to disruption of the external limiting membrane and ellipsoid zone (orange line). Additionally, supra-retinal pigment epithelium (RPE) granular deposits are observed (indicated by the white triangle).
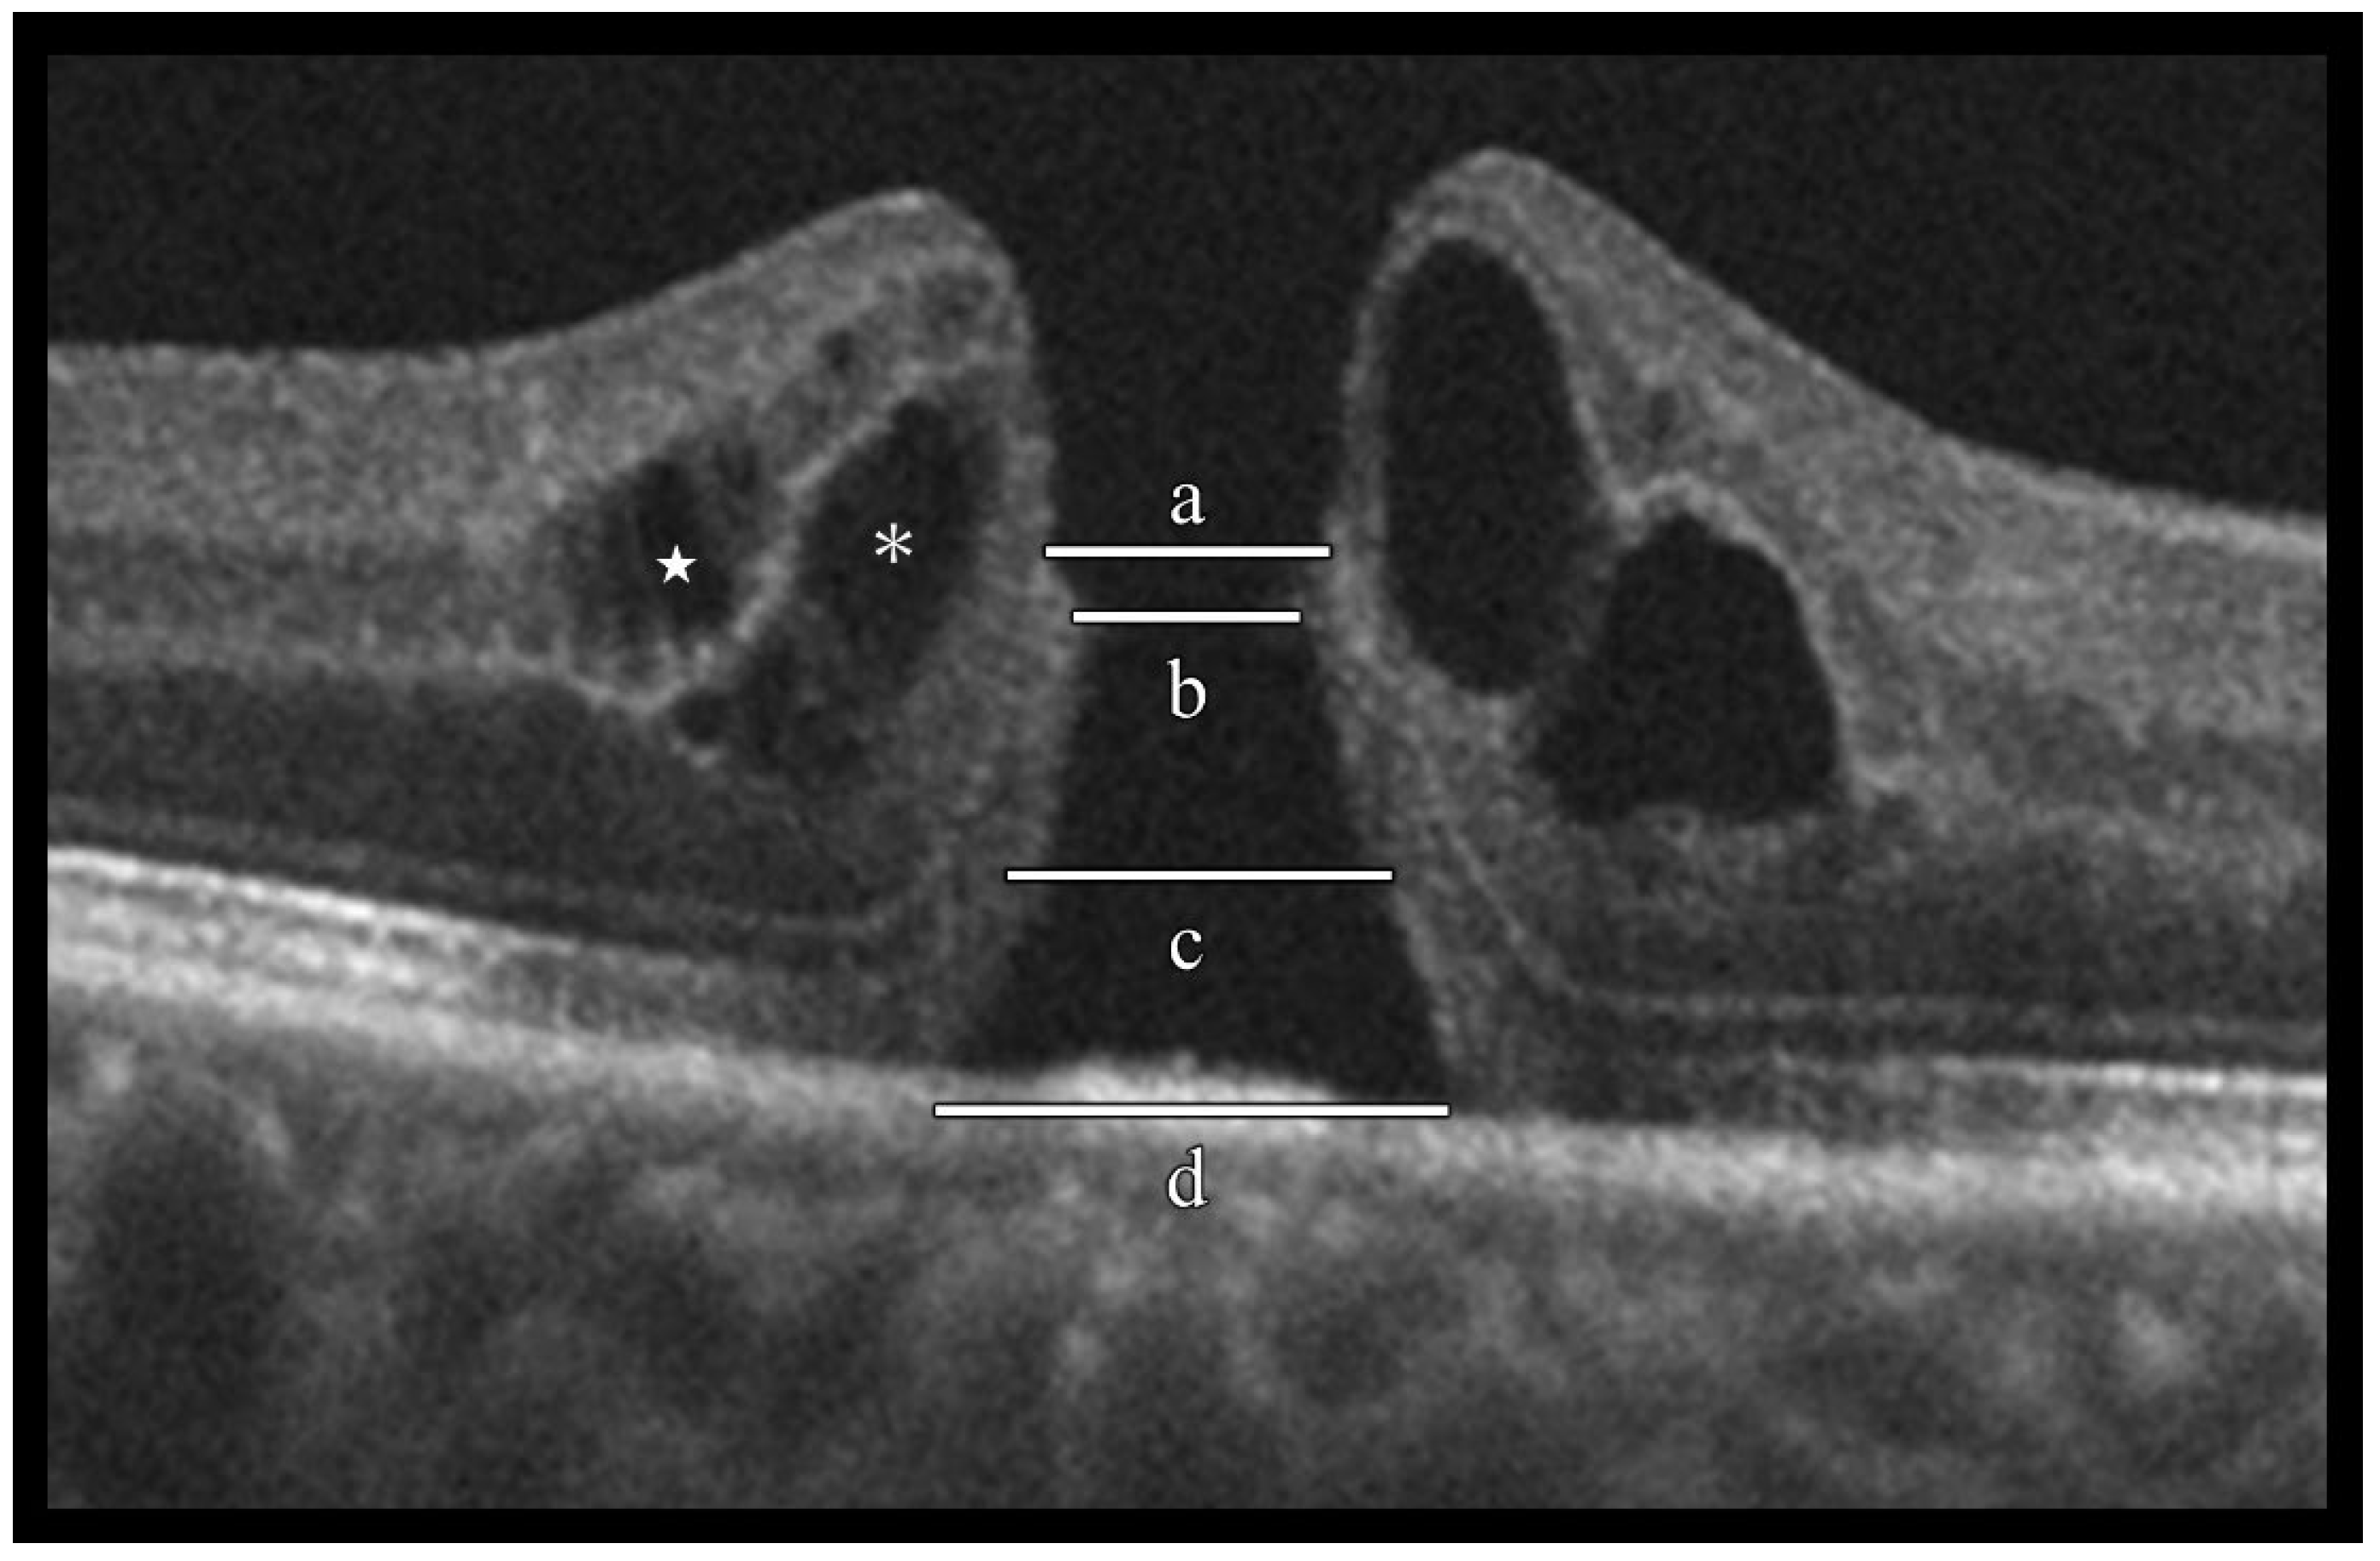
Figure 2.
Evaluation of idiopathic macular hole (IMH) morphological characteristics using optical coherence tomography (OCT). Spectral-domain OCT horizontal B-scan images were used to evaluate the following morphological characteristics of IMHs: (a) external limiting membrane (ELM) defect length, (b) minimum hole diameter, (c) ellipsoid zone (EZ) defect length, (d) basal hole diameter, inner-layer cyst (located in the inner nuclear layer, indicated by the white star), and outer-layer cyst (located in the outer plexiform layer to the Henle fiber layer, indicated by an asterisk).
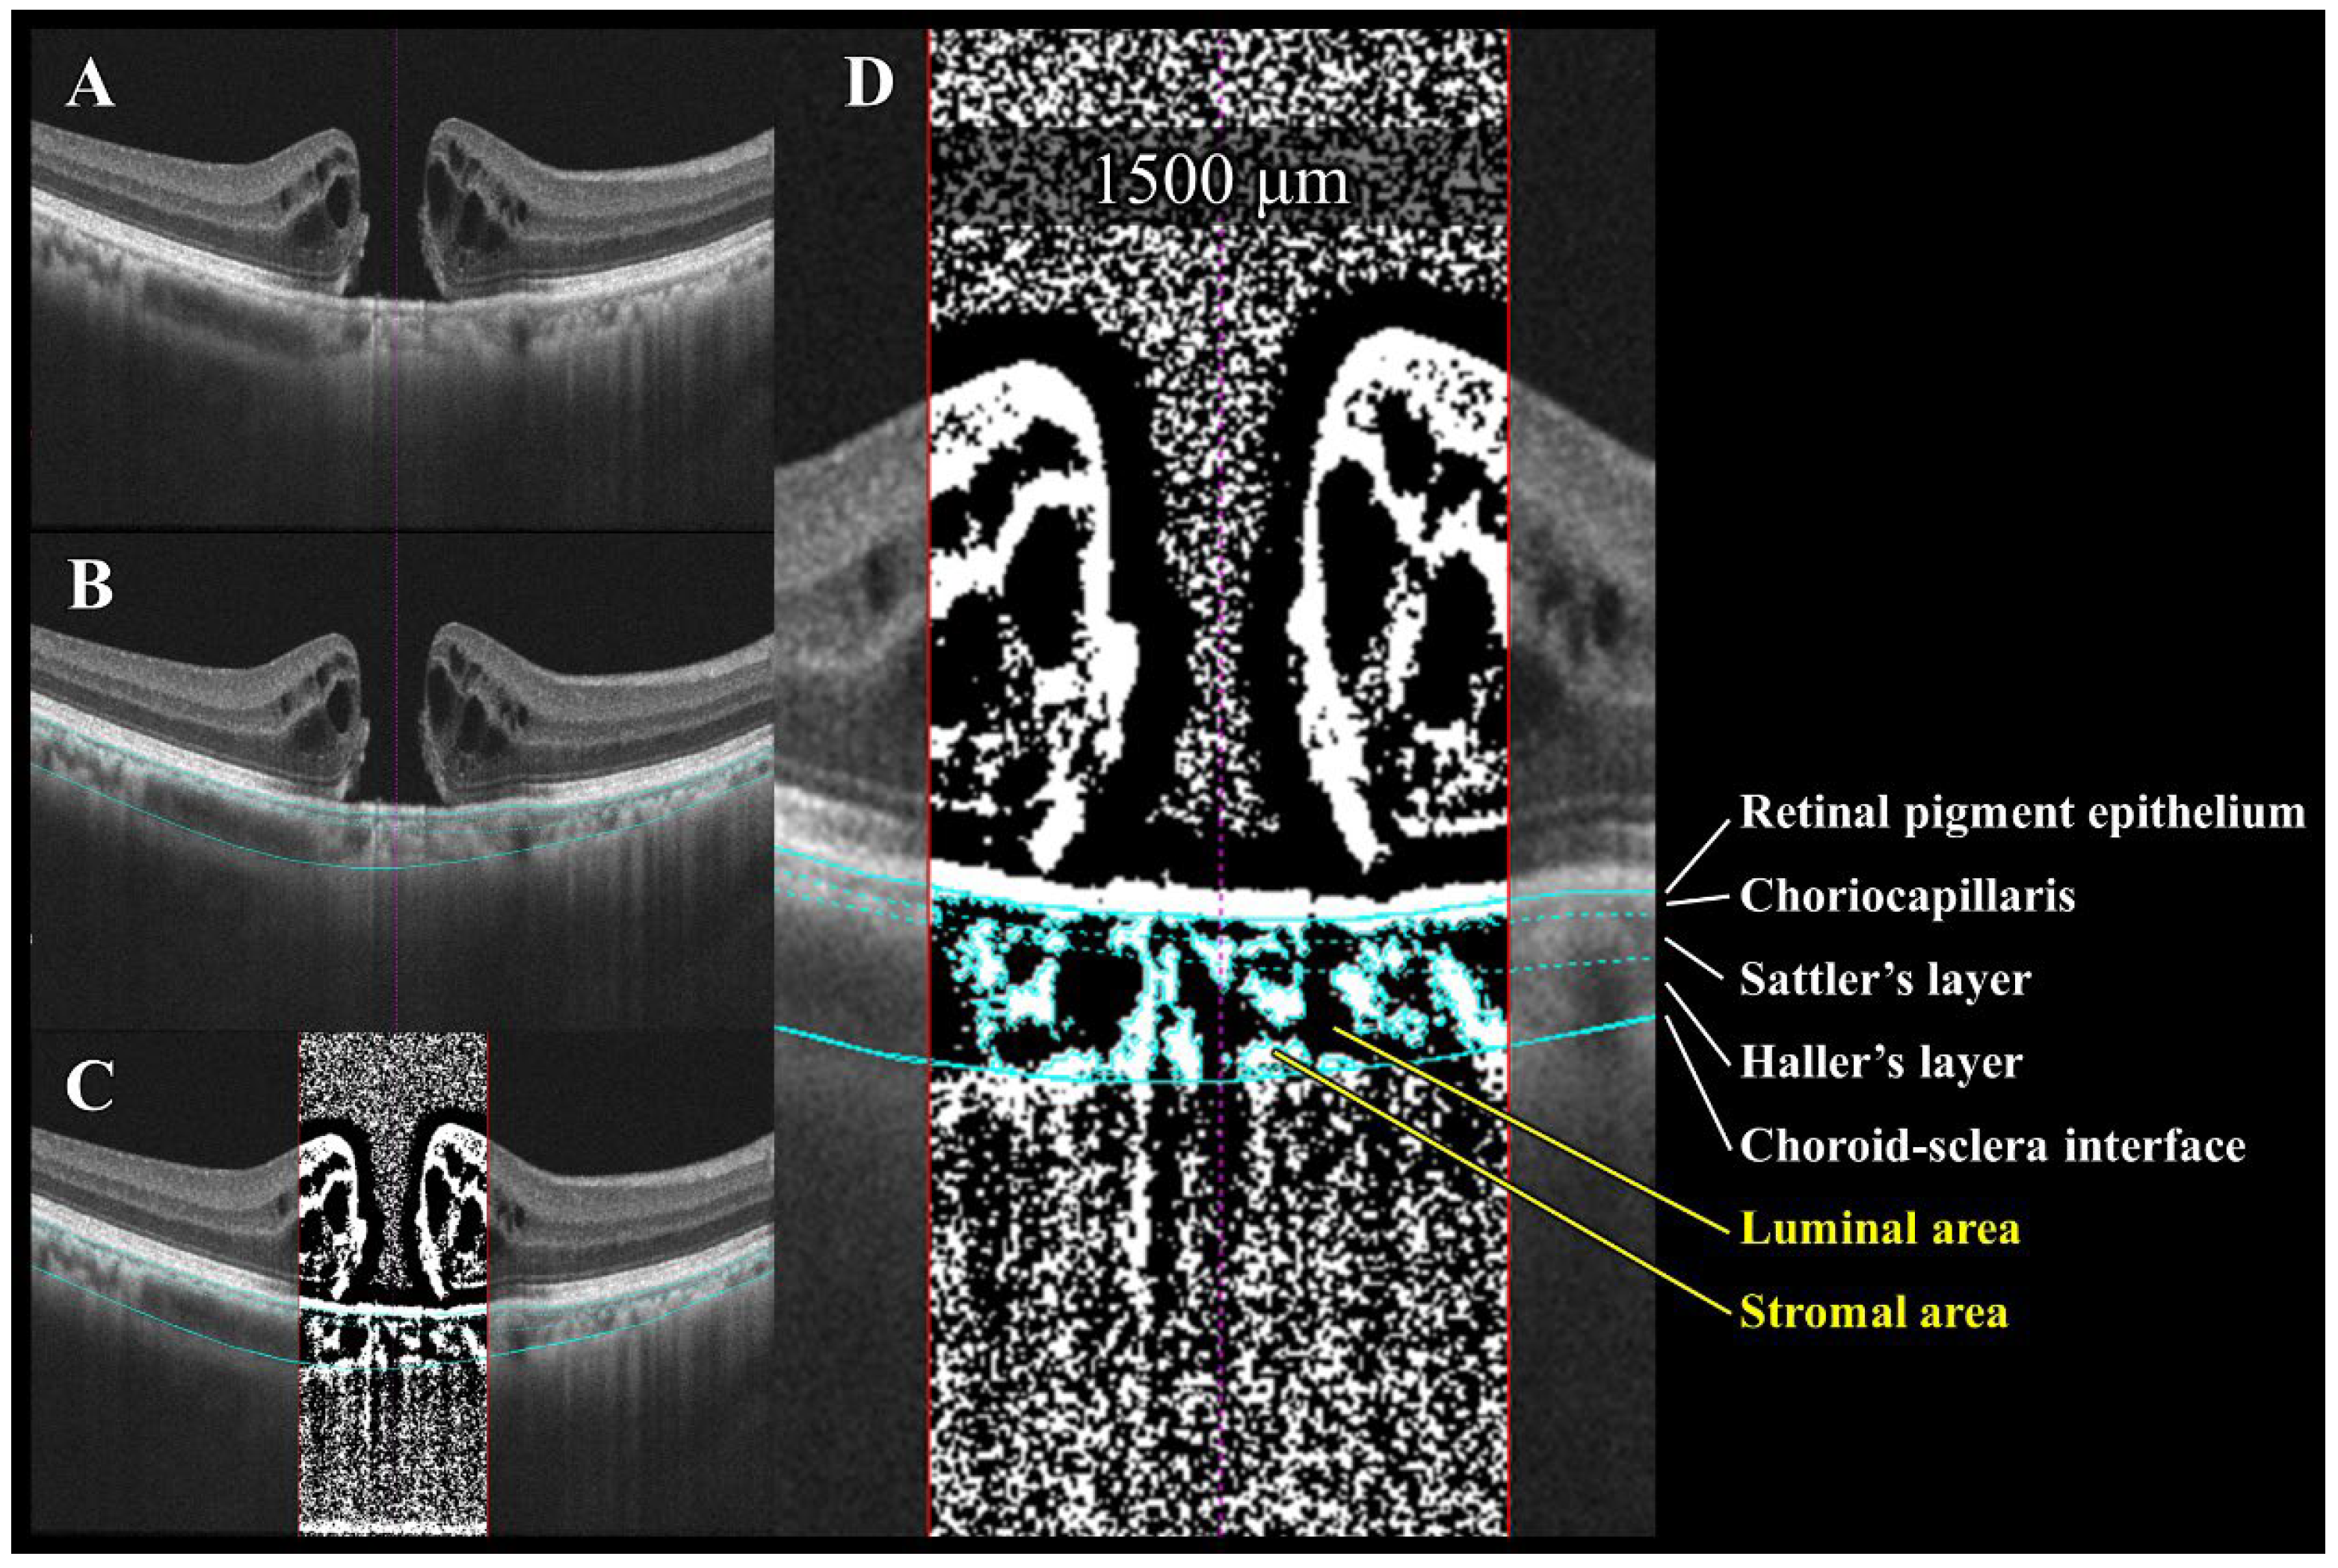
Figure 3.
Semi-automated choroidal binarization of idiopathic macular hole (IMH) with bumpy border. (A) Enhanced depth imaging optical coherence tomography (EDI-OCT) image of IMH before surgery. (B) Light blue lines delineate following interfaces from top to bottom: retinal pigment epithelium (RPE)–choriocapillaris, choriocapillaris–Sattler layer, Sattler layer–Haller layer, and choroid–sclera. (C) EDI-OCT image binarized using Niblack’s method. Dark pixels represent luminal area, while light pixels represent stromal area. (D) Quantification of luminal and stromal areas within each 1500 μm wide choroidal vascular layer and calculation of luminal/choroidal area ratio (L/C ratio).
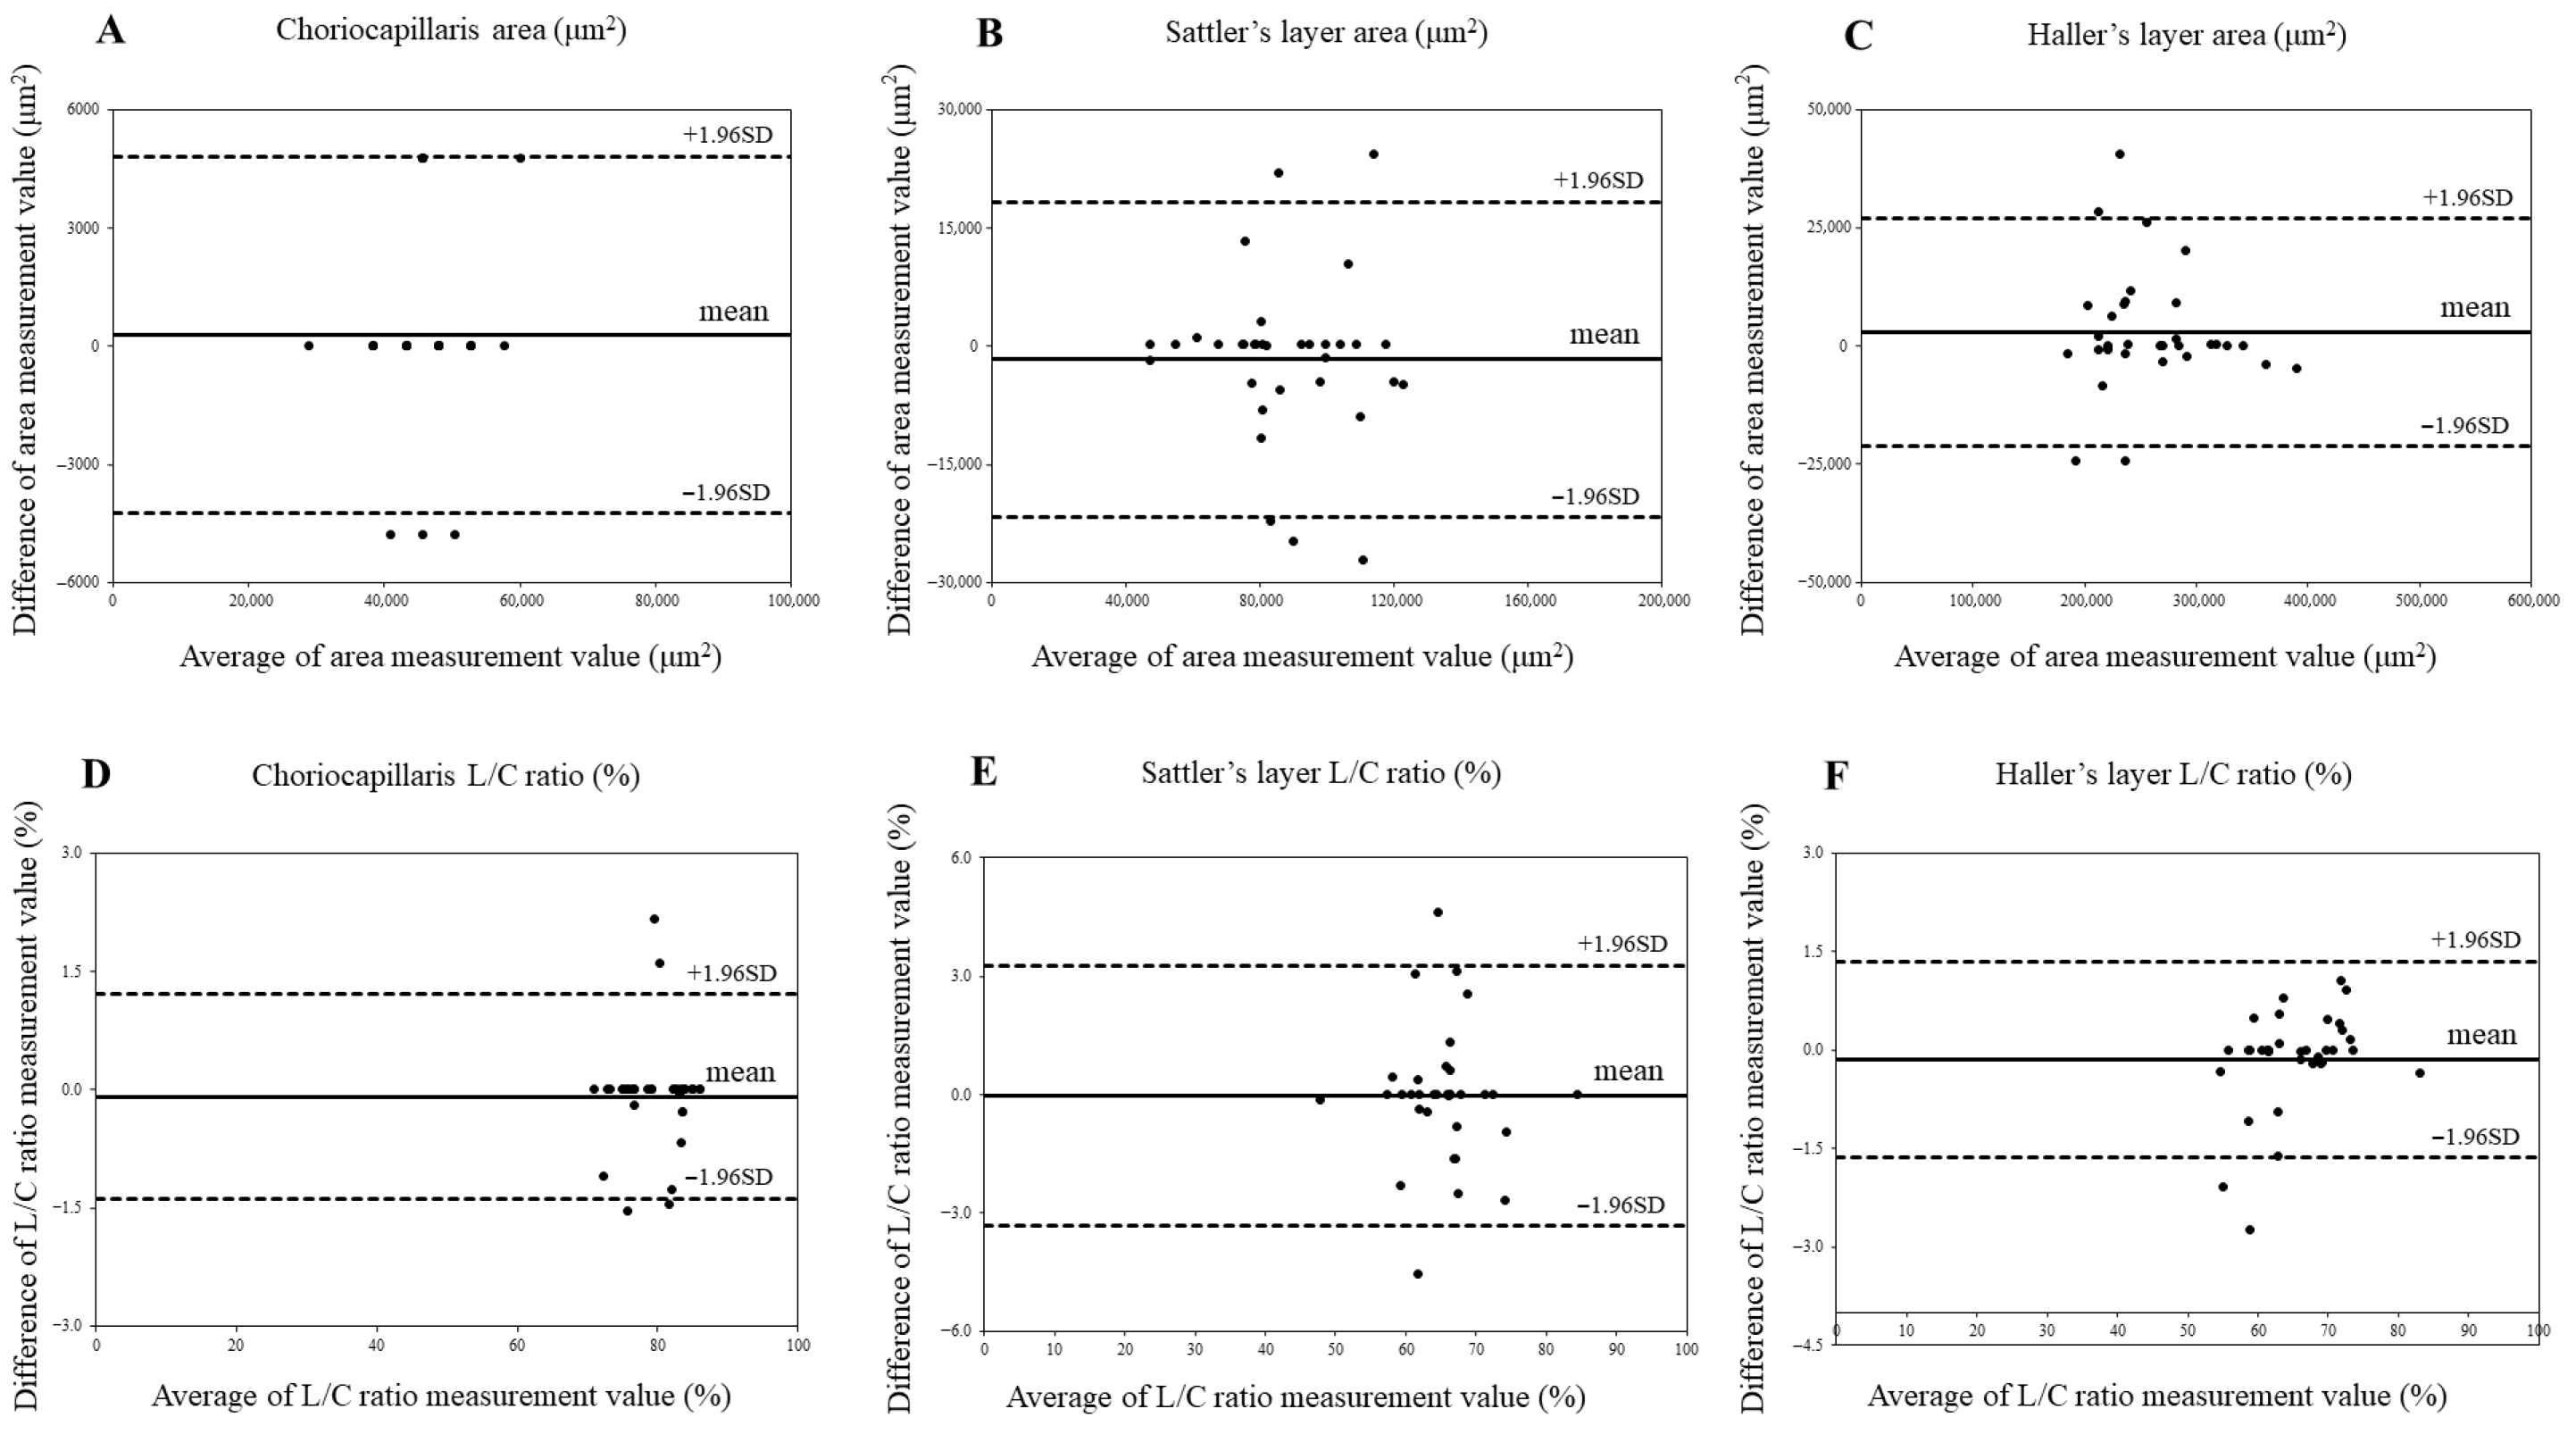
Figure 4.
Agreement between choroidal area and luminal/choroidal area ratio (L/C ratio) in control eyes using Bland–Altman plots. (A) Choriocapillaris area in control eyes. (B) Sattler’s layer area in control eyes. (C) Haller’s layer area in control eyes. (D). Choriocapillaris L/C ratio in control eyes. (E) Sattler’s layer L/C ratio in control eyes. (F) Haller’s layer L/C ratio in control eyes.
Figure 5.
Agreement between choroidal area and luminal/choroidal area ratio (L/C ratio) in idiopathic macular hole (IMH) eyes using Bland–Altman plot. (A) Choriocapillaris area in IMH eyes. (B) Sattler’s layer area in IMH eyes. (C) Haller’s layer area in IMH eyes. (D) Choriocapillaris L/C ratio in IMH eyes. (E) Sattler’s layer L/C ratio in IMH eyes. (F) Haller’s layer L/C ratio in IMH eyes.
Figure 6.
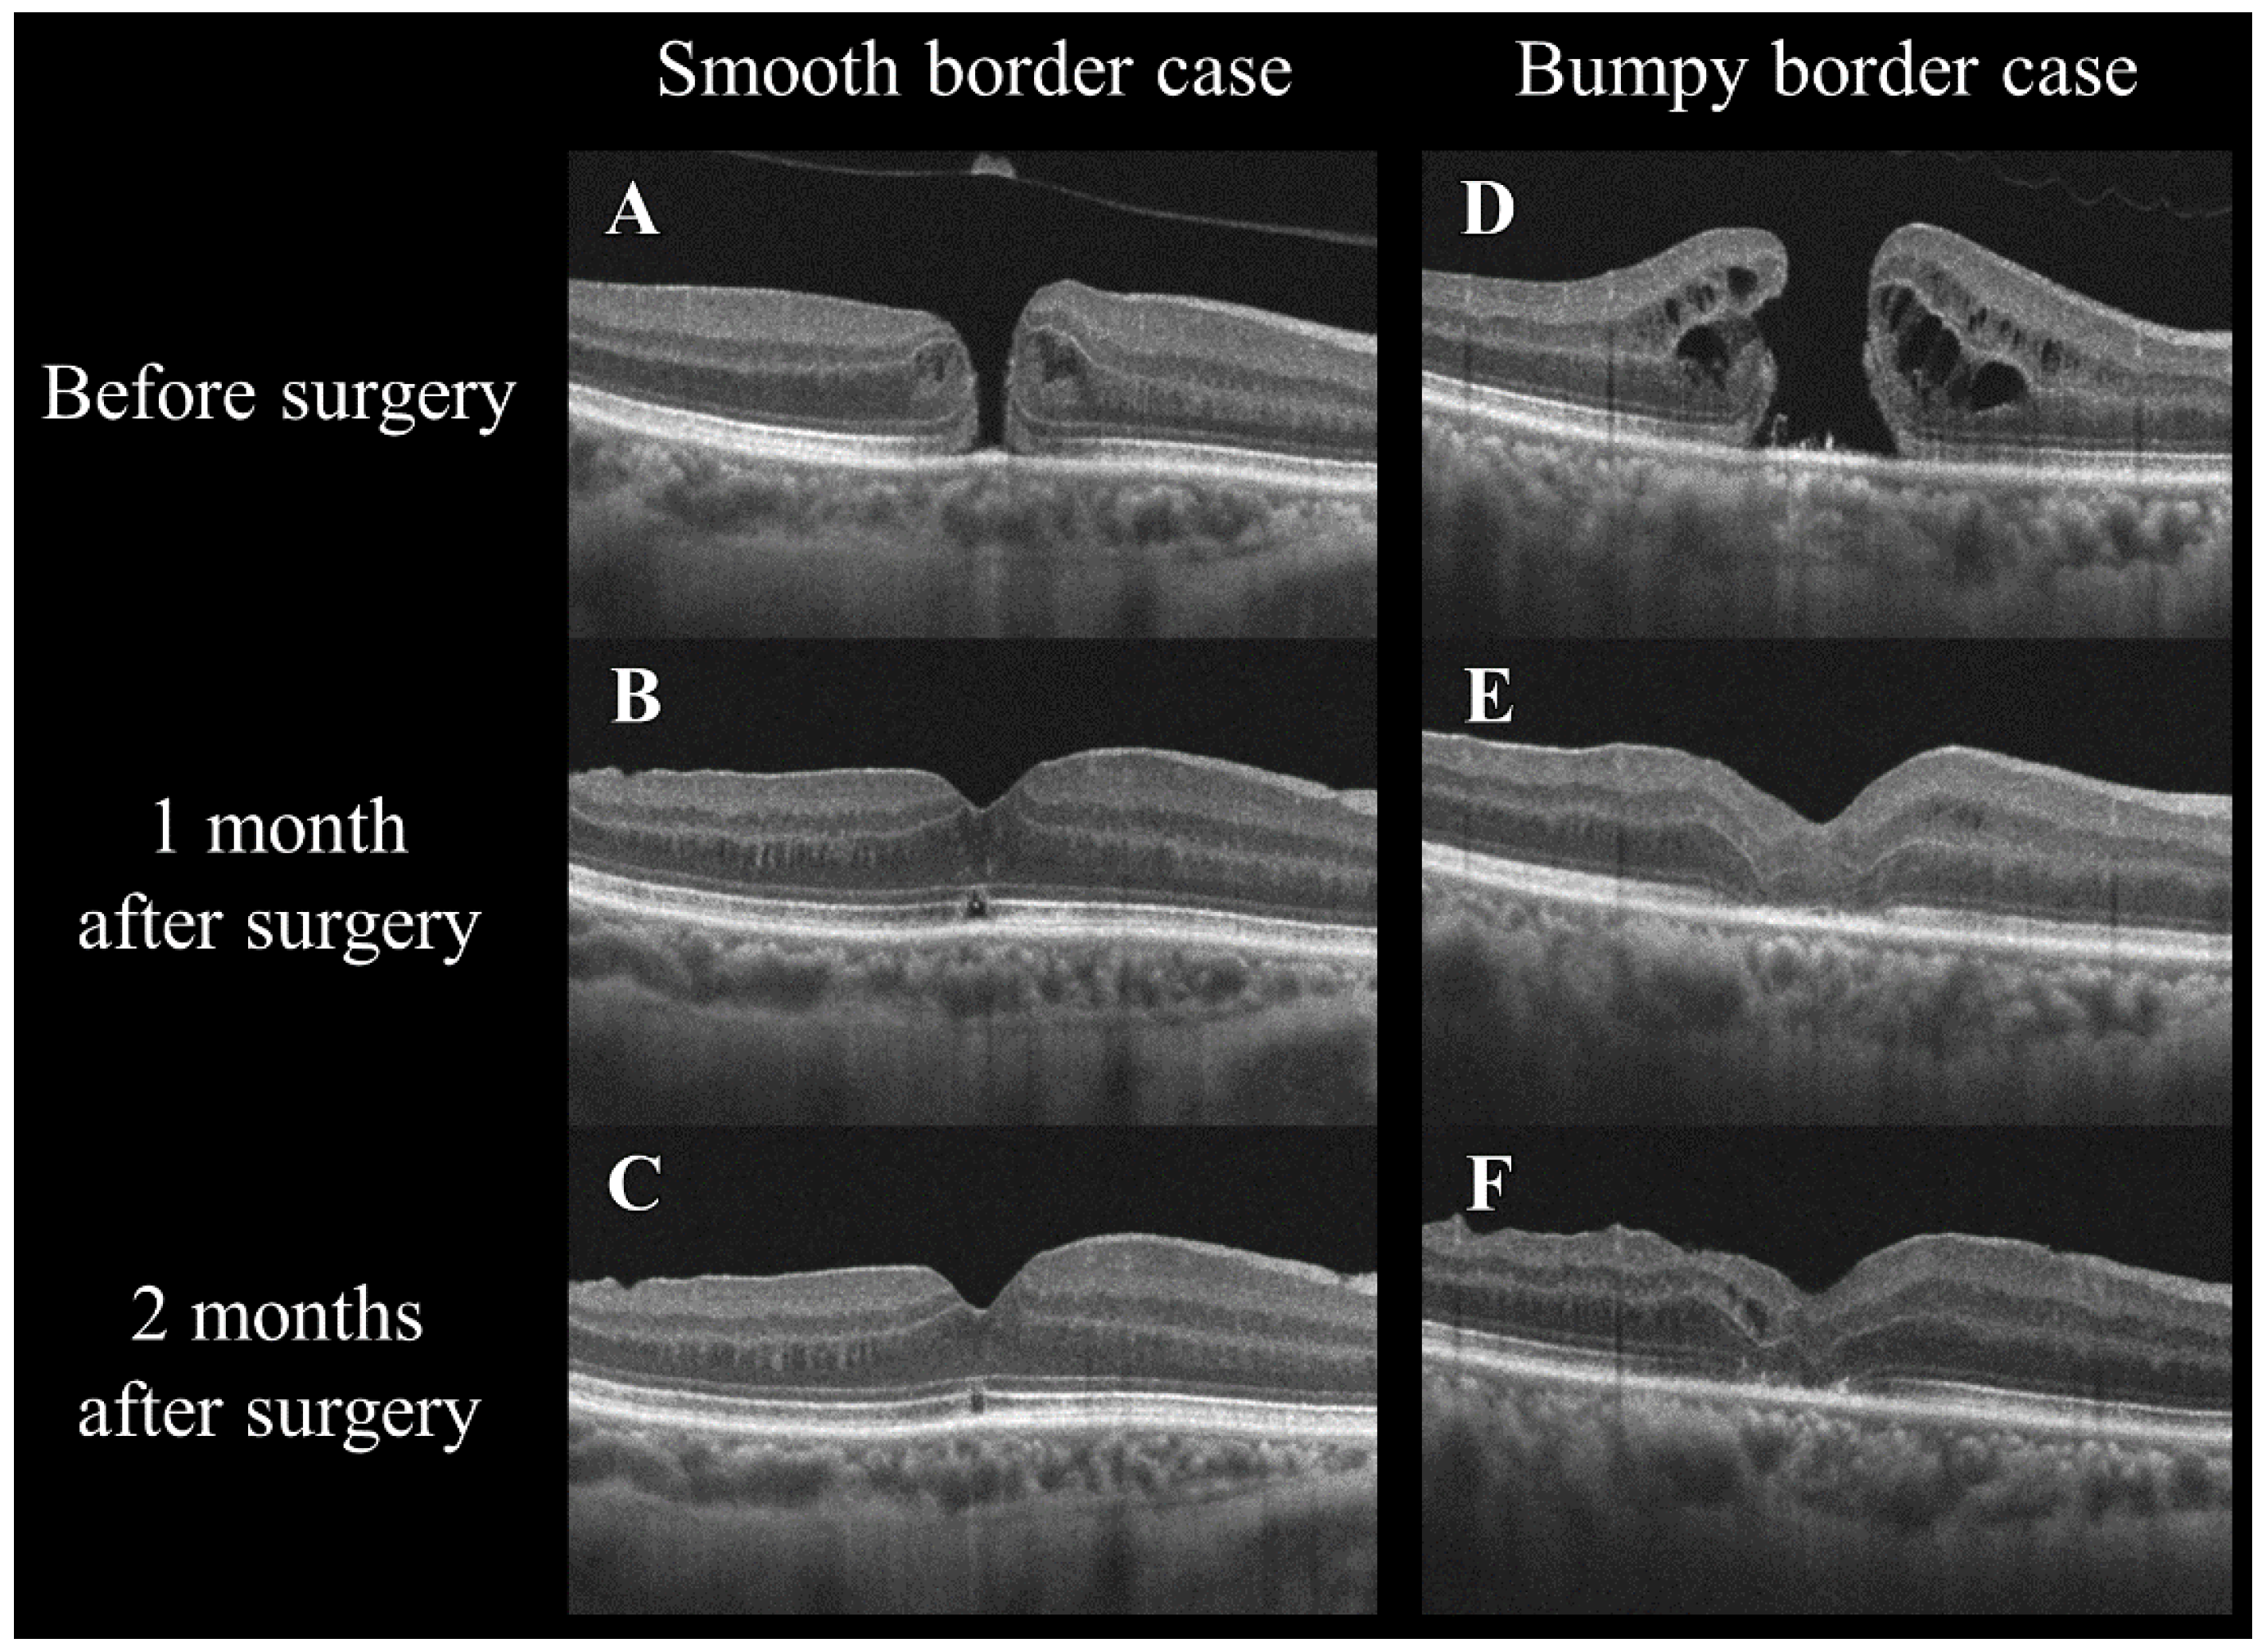
Changes in the optical coherence tomography morphology of smooth and bumpy borders in idiopathic macular holes before and after a vitrectomy. The left column (A–C) shows a smooth border case, and the right column (D–F) shows a bumpy border case. The images in the top row (A,D) were taken before surgery, those in the middle row (B,E) at 1 month after surgery, and those in the bottom row (C,F) at 2 months after surgery. Note the changes in the macular hole configuration and the adjacent retinal layers over time in both types of cases.
Table 1.
Comparison of clinical characteristics between control eyes and idiopathic macular holes (IMHs) with different border morphologies.
Table 1.
Comparison of clinical characteristics between control eyes and idiopathic macular holes (IMHs) with different border morphologies.
| | Control Eyes | IMH Eyes | p Value * | IMH with Smooth Borders | IMH with Bumpy Borders | p Value † |
|---|
| Number of eyes | 34 | 34 | | 23 | 11 | |
| Age, years | 67.0 ± 8.0 | 66.3 ± 7.9 | 0.68 ‡ | 65.7 ± 8.5 | 67.7 ± 6.2 | 0.45 ‡ |
| Gender, male/female | 10/24 | 10/24 | 0.99 ** | 7/16 | 3/8 | 0.59 †† |
| BCVA-logMAR | −0.04 ± 0.08 | 0.76 ± 0.27 | <0.001 ‡ | 0.71 ± 0.28 | 0.86 ± 0.23 | 0.17 ‡ |
| IOP, mmHg | 13.9 ± 1.9 | 15.0 ± 2.1 | 0.03 ‡ | 15.1 ± 2.1 | 14.7 ± 2.0 | 0.97 ‡ |
| SE, diopters | −0.55 ± 1.57 | −0.53 ± 2.09 | 0.59 ‡ | −0.52 ± 2.06 | −0.56 ± 2.15 | 0.78 ‡ |
| AL, mm | 23.75 ± 0.88 | 23.85 ± 0.84 | 0.77 ‡ | 23.72 ± 0.79 | 24.12 ± 0.89 | 0.25 ‡ |
| HT, % | 29.4 | 35.3 | 0.60 ** | 34.8 | 36.4 | 0.61 †† |
| SBP, mmHg | 123 ± 13 | 122 ± 13 | 0.24 ‡ | 122 ± 14 | 122 ± 10 | 0.65 ‡ |
| DBP, mmHg | 70 ± 10 | 73 ± 10 | 0.29 ‡ | 74 ± 10 | 72 ± 9 | 0.63 ‡ |
| Retinal characteristics | | | | | | |
| Duration of symptoms, days | - | 50 ± 56 | | 28 ± 26 | 96 ± 73 | 0.004 ‡ |
| MH stage 2:3:4, eyes | - | 9:16:9 | | 8:12:3 | 1:4:6 | 0.03 ** |
| Minimum hole diameter, μm | - | 356 ± 137 | | 301 ± 90 | 471 ± 146 | 0.007 ‡ |
| Basal hole diameter, μm | - | 767 ± 287 | | 666 ± 216 | 978 ± 303 | 0.009 ‡ |
| Inner macular fluid, % | - | 55.9 | | 34.8 | 100.0 | <0.001 †† |
| Outer macular fluid, % | - | 97.1 | | 95.7 | 100.0 | 0.68 †† |
| ELM defect length, μm | - | 496 ± 214 | | 430 ± 198 | 633 ± 179 | 0.005 ‡ |
| EZ defect length, μm | - | 588 ± 276 | | 471 ± 162 | 844 ± 286 | 0.001 ‡ |
| Supra-RPE granules, % | - | 50.0 | | 34.8 | 81.8 | 0.01 ** |
Table 2.
Inter-examiner reliability of choroidal segmentation in idiopathic macular holes (IMHs) and control eyes.
Table 2.
Inter-examiner reliability of choroidal segmentation in idiopathic macular holes (IMHs) and control eyes.
| | | | Relative Reliability (ICC) | | | Bland–Altman Analysis
(Fixed Bias) | Bland–Altman Analysis
(Proportional Bias) |
|---|
| | | | ICC (Single) | p Value | ICC (Mean) | p Value | CI 95% | p Value | R | p Value |
|---|
| Control eyes | Choriocapillaris (CC) | CC area | 0.9280 | <0.001 | 0.9627 | <0.001 | −535~1099 | 0.49 | 0.09 | 0.63 |
| | | L/C ratio | 0.9881 | <0.001 | 0.9970 | <0.001 | −0.14~0.33 | 0.44 | −0.03 | 0.88 |
| | Sattler’s layer (SL) | SL area | 0.8705 | <0.001 | 0.9308 | <0.001 | −1889~5351 | 0.34 | −0.17 | 0.35 |
| | | L/C ratio | 0.9617 | <0.001 | 0.9805 | <0.001 | −0.56~0.65 | 0.90 | −0.08 | 0.65 |
| | Haller’s layer (HL) | HL area | 0.9689 | <0.001 | 0.9684 | <0.001 | −1470~7191 | 0.19 | −0.02 | 0.94 |
| | | L/C ratio | 0.9927 | <0.001 | 0.9963 | <0.001 | −0.13~0.42 | 0.29 | 0.41 | 0.17 |
| IMH eyes | Choriocapillaris (CC) | CC area | 0.9997 | <0.001 | 0.9999 | <0.001 | −121~461 | 0.24 | 0.25 | 0.12 |
| | | L/C ratio | 0.9974 | <0.001 | 0.9987 | <0.001 | −0.05~0.44 | 0.11 | −0.16 | 0.36 |
| | Sattler’s layer (SL) | SL area | 0.9475 | <0.001 | 0.9731 | <0.001 | −8090~17835 | 0.45 | −0.21 | 0.23 |
| | | L/C ratio | 0.9589 | <0.001 | 0.9580 | <0.001 | −0.26~0.94 | 0.25 | 0.17 | 0.33 |
| | Haller’s layer (HL) | HL area | 0.9922 | <0.001 | 0.9961 | <0.001 | −4604~23415 | 0.18 | 0.17 | 0.35 |
| | | L/C ratio | 0.9844 | <0.001 | 0.9921 | <0.001 | −0.16~0.31 | 0.53 | −0.11 | 0.53 |
Table 3.
Comparison of choroidal characteristics in idiopathic macular holes with smooth versus bumpy borders (IMHs).
Table 3.
Comparison of choroidal characteristics in idiopathic macular holes with smooth versus bumpy borders (IMHs).
| | Control Eyes | IMH with Smooth Borders | IMH with Bumpy Borders | Kruskal–Wallis Test (p Value) | Steel–Dwass Test (p Value): Control–Smooth | Steel–Dwass Test (p Value): Control–Bumpy | Steel–Dwass Test (p Value): Smooth–Bumpy |
|---|
| Total choroid | | | | | | | |
| CA, ×103 μm2 | 393 ± 51 | 396 ± 117 | 301 ± 60 | <0.001 | 0.79 | <0.001 | 0.04 |
| LA, ×103 μm2 | 263 ± 40 | 260 ± 77 | 190 ± 38 | <0.001 | 0.94 | <0.001 | 0.02 |
| SA, ×103 μm2 | 129 ± 19 | 137 ± 41 | 112 ± 22 | 0.07 | NA | NA | NA |
| L/C ratio, % | 66.9 ± 3.7 | 65.3 ± 3.0 | 63.0 ± 1.4 | 0.002 | 0.32 | 0.002 | 0.01 |
| Choriocapillaris | | | | | | | |
| CA, ×103 μm2 | 46 ± 6 | 37 ± 6 | 32 ± 6 | <0.001 | <0.001 | <0.001 | 0.07 |
| LA, ×103 μm2 | 37 ± 5 | 23 ± 6 | 15 ± 5 | <0.001 | <0.001 | <0.001 | 0.008 |
| SA, ×103 μm2 | 9 ± 2 | 15 ± 3 | 17 ± 3 | <0.001 | <0.001 | <0.001 | 0.19 |
| L/C ratio, % | 79.6 ± 4.3 | 60.1 ± 9.2 | 46.9 ± 9.2 | <0.001 | <0.001 | <0.001 | 0.005 |
| Sattler’s layer | | | | | | | |
| CA, ×103 μm2 | 88 ± 19 | 93 ± 29 | 75 ± 22 | 0.14 | NA | NA | NA |
| LA, ×103 μm2 | 57 ± 12 | 63 ± 18 | 52 ± 13 | 0.14 | NA | NA | NA |
| SA, ×103 μm2 | 31 ± 9 | 30 ± 12 | 23 ± 10 | 0.16 | NA | NA | NA |
| L/C ratio, % | 65.3 ± 6.0 | 68.3 ± 6.9 | 71.0 ± 7.2 | 0.07 | NA | NA | NA |
| Haller’s layer | | | | | | | |
| CA, ×103 μm2 | 258 ± 49 | 266 ± 98 | 195 ± 46 | 0.02 | 0.91 | 0.005 | 0.12 |
| LA, ×103 μm2 | 169 ± 38 | 175 ± 64 | 123 ± 31 | 0.009 | 0.86 | 0.004 | 0.053 |
| SA, ×103 μm2 | 89 ± 20 | 92 ± 35 | 72 ± 18 | 0.09 | NA | NA | NA |
| L/C ratio, % | 65.4 ± 6.3 | 65.4 ± 3.7 | 62.9 ± 3.9 | 0.49 | NA | NA | NA |
| CCT, μm | 264 ± 33 | 265 ± 77 | 203 ± 40 | 0.003 | 0.80 | <0.001 | 0.04 |
Table 4.
Postoperative BCVA and retinal structural changes in idiopathic macular holes (IMHs).
Table 4.
Postoperative BCVA and retinal structural changes in idiopathic macular holes (IMHs).
| | Pre | Post 1M | Post 2M | Friedman Test (p Value) | Bonferroni Correction (p Value): Pre–Post 1M | Bonferroni Correction (p Value): Pre–Post 2M | Bonferroni Correction (p Value): Post 1M–Post 2M |
|---|
| BCVA | | | | | | | |
| IMH eyes with smooth borders | 0.71 ± 0.28 | 0.46 ± 0.22 | 0.35 ± 0.25 | <0.001 | 0.002 | <0.001 | 0.052 |
| IMH eyes with bumpy borders | 0.86 ± 0.23 | 0.73 ± 0.21 | 0.62 ± 0.18 | 0.01 | 0.25 | 0.04 | 0.22 |
| Mann–Whitney U test (p value) | 0.17 | 0.006 | 0.006 | | | | |
| ELM defect length, μm | | | | | | | |
| IMH eyes with smooth borders | 430 ± 198 | 77 ± 180 | 27 ± 125 | <0.001 | <0.001 | <0.001 | 0.06 |
| IMH eyes with bumpy borders | 633 ± 179 | 333 ± 326 | 325 ± 308 | 0.24 | NA | NA | NA |
| Mann–Whitney U test (p value) | 0.005 | 0.006 | 0.001 | | | | |
| EZ defect length, μm | | | | | | | |
| IMH eyes with smooth borders | 471 ± 162 | 235 ± 159 | 146 ± 122 | <0.001 | <0.001 | <0.001 | 0.003 |
| IMH eyes with bumpy borders | 844 ± 286 | 651 ± 360 | 554 ± 381 | <0.001 | 0.03 | 0.02 | 0.02 |
| Mann–Whitney U test (p value) | 0.001 | <0.001 | 0.001 | | | | |
Table 5.
Postoperative changes in total choroid area in idiopathic macular holes (IMHs).
Table 5.
Postoperative changes in total choroid area in idiopathic macular holes (IMHs).
| | Pre | Post 1M | Post 2M | Friedman Test (p Value) | Bonferroni Correction (p Value): Pre–Post 1M | Bonferroni Correction (p Value): Pre–Post 2M | Bonferroni Correction (p Value): Post 1M–Post 2M |
|---|
| Total choroid | | | | | | | |
| CA, ×103 μm2 | | | | | | | |
| IMH eyes with smooth borders | 396 ± 117 | 410 ± 119 | 401 ± 126 | 0.74 | NA | NA | NA |
| IMH eyes with bumpy borders | 301 ± 60 | 294 ± 65 | 278 ± 68 | 0.14 | NA | NA | NA |
| Mann–Whitney U test (p value) | 0.02 | 0.004 | 0.009 | | | | |
| LA, ×103 μm2 | | | | | | | |
| IMH eyes with smooth borders | 260 ± 77 | 273 ± 78 | 271 ± 83 | 0.96 | NA | NA | NA |
| IMH eyes with bumpy borders | 190 ± 38 | 193 ± 40 | 183 ± 43 | 0.34 | NA | NA | NA |
| Mann–Whitney U test (p value) | 0.001 | 0.004 | 0.003 | | | | |
| SA, ×103 μm2 | | | | | | | |
| IMH eyes with smooth borders | 137 ± 41 | 137 ± 44 | 130 ± 45 | 0.26 | NA | NA | NA |
| IMH eyes with bumpy borders | 112 ± 22 | 100 ± 26 | 95 ± 25 | 0.29 | NA | NA | NA |
| Mann–Whitney U test (p value) | 0.06 | 0.01 | 0.03 | | | | |
| L/C ratio, % | | | | | | | |
| IMH eyes with smooth borders | 65.3 ± 3.0 | 66.6 ± 2.3 | 67.6 ± 2.5 | 0.01 | 0.21 | 0.002 | 0.31 |
| IMH eyes with bumpy borders | 63.0 ± 1.4 | 66.1 ± 2.4 | 66.1 ± 1.8 | 0.004 | 0.04 | 0.03 | 0.99 |
| Mann–Whitney U test (p value) | 0.005 | 0.48 | 0.12 | | | | |
| CCT, μm | | | | | | | |
| IMH eyes with smooth borders | 265 ± 77 | 276 ± 80 | 270 ± 85 | 0.76 | NA | NA | NA |
| IMH eyes with bumpy borders | 203 ± 40 | 196 ± 46 | 185 ± 47 | 0.045 | 0.64 | 0.049 | 0.46 |
| Mann–Whitney U test (p value) | 0.02 | 0.004 | 0.006 | | | | |
Table 6.
Postoperative changes in choriocapillaris in idiopathic macular holes (IMHs).
Table 6.
Postoperative changes in choriocapillaris in idiopathic macular holes (IMHs).
| | Pre | Post 1M | Post 2M | Friedman Test (p Value) | Bonferroni Correction (p Value): Pre–Post 1M | Bonferroni Correction (p Value): Pre–Post 2M | Bonferroni Correction (p Value): Post 1M–Post 2M |
|---|
| Choriocapillaris | | | | | | | |
| CA, ×103 μm2 | | | | | | | |
| IMH eyes with smooth borders | 37 ± 6 | 37 ± 6 | 40 ± 5 | 0.07 | NA | NA | NA |
| IMH eyes with bumpy borders | 32 ± 6 | 33 ± 8 | 36 ± 5 | 0.35 | NA | NA | NA |
| Mann–Whitney U test (p value) | 0.03 | 0.27 | 0.02 | | | | |
| LA, ×103 μm2 | | | | | | | |
| IMH eyes with smooth borders | 23 ± 6 | 27 ± 6 | 30 ± 5 | <0.001 | <0.001 | <0.001 | 0.006 |
| IMH eyes with bumpy borders | 15 ± 5 | 22 ± 6 | 25 ± 4 | <0.001 | <0.001 | <0.001 | 0.006 |
| Mann–Whitney U test (p value) | 0.003 | 0.04 | 0.002 | | | | |
| SA, ×103 μm2 | | | | | | | |
| IMH eyes with smooth borders | 15 ± 3 | 10 ± 2 | 10 ± 2 | <0.001 | <0.001 | <0.001 | 0.82 |
| IMH eyes with bumpy borders | 17 ± 3 | 11 ± 3 | 11 ± 3 | 0.004 | 0.006 | 0.006 | 0.99 |
| Mann–Whitney U test (p value) | 0.09 | 0.67 | 0.43 | | | | |
| L/C ratio, % | | | | | | | |
| IMH eyes with smooth borders | 60.1 ± 9.2 | 72.0 ± 6.3 | 75.9 ± 5.2 | <0.001 | <0.001 | <0.001 | 0.06 |
| IMH eyes with bumpy borders | 46.9 ± 9.2 | 65.6 ± 8.0 | 70.4 ± 5.8 | <0.001 | 0.003 | 0.003 | 0.07 |
| Mann–Whitney U test (p value) | 0.002 | 0.02 | 0.02 | | | | |
| IMH eyes with smooth borders | 68.3 ± 6.9 | 67.7 ± 4.5 | 68.9 ± 4.6 | 0.68 | NA | NA | NA |
| IMH eyes with bumpy borders | 71.0 ± 7.2 | 71.1 ± 7.3 | 69.9 ± 6.4 | 0.23 | NA | NA | NA |
| Mann–Whitney U test (p value) | 0.26 | 0.25 | 0.87 | | | | |
Table 7.
Postoperative changes in Sattler’s layer in idiopathic macular holes (IMHs).
Table 7.
Postoperative changes in Sattler’s layer in idiopathic macular holes (IMHs).
| | Pre | Post 1M | Post 2M | Friedman Test (p Value) | Bonferroni Correction (p Value): Pre–Post 1M | Bonferroni Correction (p Value): Pre–Post 2M | Bonferroni Correction (p Value): Post 1M–Post 2M |
|---|
| Sattler’s layer | | | | | | | |
| CA, ×103 μm2 | | | | | | | |
| IMH eyes with smooth borders | 93 ± 29 | 101 ± 32 | 95 ± 31 | 0.57 | NA | NA | NA |
| IMH eyes with bumpy borders | 75 ± 22 | 93 ± 62 | 65 ± 20 | 0.06 | NA | NA | NA |
| Mann–Whitney U test (p value) | 0.07 | 0.07 | 0.009 | | | | |
| LA, ×103 μm2 | | | | | | | |
| IMH eyes with smooth borders | 63 ± 18 | 68 ± 21 | 65 ± 21 | 0.74 | NA | NA | NA |
| IMH eyes with bumpy borders | 52 ± 13 | 64 ± 41 | 45 ± 11 | 0.06 | NA | NA | NA |
| Mann–Whitney U test (p value) | 0.09 | 0.04 | 0.004 | | | | |
| SA, ×103 μm2 | | | | | | | |
| IMH eyes with smooth borders | 30 ± 12 | 33 ± 13 | 30 ± 12 | 0.40 | NA | NA | NA |
| IMH eyes with bumpy borders | 23 ± 10 | 29 ± 22 | 21 ± 10 | 0.53 | NA | NA | NA |
| Mann–Whitney U test (p value) | 0.16 | 0.11 | 0.03 | | | | |
| L/C ratio, % | | | | | | | |
| IMH eyes with smooth borders | 68.3 ± 6.9 | 67.7 ± 4.5 | 68.9 ± 4.6 | 0.68 | NA | NA | NA |
| IMH eyes with bumpy borders | 71.0 ± 7.2 | 71.1 ± 7.3 | 69.9 ± 6.4 | 0.23 | NA | NA | NA |
| Mann–Whitney U test (p value) | 0.26 | 0.25 | 0.87 | | | | |
Table 8.
Postoperative changes in Haller’s layer in idiopathic macular holes (IMHs).
Table 8.
Postoperative changes in Haller’s layer in idiopathic macular holes (IMHs).
| | Pre | Post 1M | Post 2M | Friedman Test (p Value) | Bonferroni Correction (p Value): Pre–Post 1M | Bonferroni Correction (p Value): Pre–Post 2M | Bonferroni Correction (p Value): Post 1M–Post 2M |
|---|
| Haller’s layer | | | | | | | |
| CA, ×103 μm2 | | | | | | | |
| IMH eyes with smooth borders | 266 ± 98 | 278 ± 107 | 270 ± 103 | 0.84 | NA | NA | NA |
| IMH eyes with bumpy borders | 195 ± 46 | 189 ± 42 | 177 ± 54 | 0.44 | NA | NA | NA |
| Mann–Whitney U test (p value) | 0.053 | 0.001 | 0.03 | | | | |
| LA, ×103 μm2 | | | | | | | |
| IMH eyes with smooth borders | 175 ± 64 | 182 ± 69 | 178 ± 67 | 0.96 | NA | NA | NA |
| IMH eyes with bumpy borders | 123 ± 31 | 121 ± 29 | 113 ± 36 | 0.70 | NA | NA | NA |
| Mann–Whitney U test (p value) | 0.02 | 0.009 | 0.008 | | | | |
| SA, ×103 μm2 | | | | | | | |
| IMH eyes with smooth borders | 92 ± 35 | 97 ± 39 | 92 ± 37 | 0.88 | NA | NA | NA |
| IMH eyes with bumpy borders | 72 ± 18 | 68 ± 15 | 64 ± 19 | 0.18 | NA | NA | NA |
| Mann–Whitney U test (p value) | 0.14 | 0.02 | 0.04 | | | | |
| L/C ratio, % | | | | | | | |
| IMH eyes with smooth borders | 65.4 ± 3.7 | 65.1 ± 2.8 | 65.8 ± 2.9 | 0.96 | NA | NA | NA |
| IMH eyes with bumpy borders | 62.9 ± 3.9 | 64.1 ± 3.1 | 63.6 ± 2.9 | 0.91 | NA | NA | NA |
| Mann–Whitney U test (p value) | 0.27 | 0.37 | 0.04 | | | | |
Table 9.
Multiple regression analysis to identify preoperative factors predicting improvement in L/C ratio of choriocapillaris after macular hole surgery.
Table 9.
Multiple regression analysis to identify preoperative factors predicting improvement in L/C ratio of choriocapillaris after macular hole surgery.
| Variables | Correlation Coefficient | p Value |
|---|
| Preoperative | | |
| Hole borders, smooth/bumpy | 0.73 | 0.01 |
| MH stage | −0.01 | 0.95 |
| Minimum hole diameter | −0.62 | 0.07 |
| Basal hole diameter | 1.27 | 0.02 |
| ELM defect length | 0.01 | 0.63 |
| EZ defect length, μm | 0.02 | 0.09 |
| Supra-RPE granular deposits | 3.63 | 0.57 |
Table 10.
Clinical and structural differences between smooth and bumpy idiopathic macular hole borders.
Table 10.
Clinical and structural differences between smooth and bumpy idiopathic macular hole borders.
| Parameter | Smooth Border | Bumpy Border |
|---|
| Visual recovery | Early and favorable | Delayed and limited |
| Symptom duration | Short (28 ± 26 days) | Long (96 ± 73 days) |
| MH stage | Mainly stage 2–3 | Mainly stage 3–4 |
| Inner macular fluid | 34.8% | 100.0% |
| ELM/EZ defect length | Short | Long |
| Basal hole diameter | Small (666 ± 216 μm) | Large (978 ± 303 μm) |
| Supra-RPE granular deposits | 34.8% | 81.8% |
| Choriocapillaris L/C ratio | High (60.1 → 75.9%) | Low (46.9 → 70.4%) |
| Central choroidal thickness | Stable | Further decrease postoperative |
