
Composite RAI, Malnutrition, and Anemia Model Superiorly Predicts 30-Day Morbidity and Mortality After Surgery for Adult Spinal Deformity

 , , , , and
Abstract
1. Introduction
2. Materials and Methods
2.1. Data Source
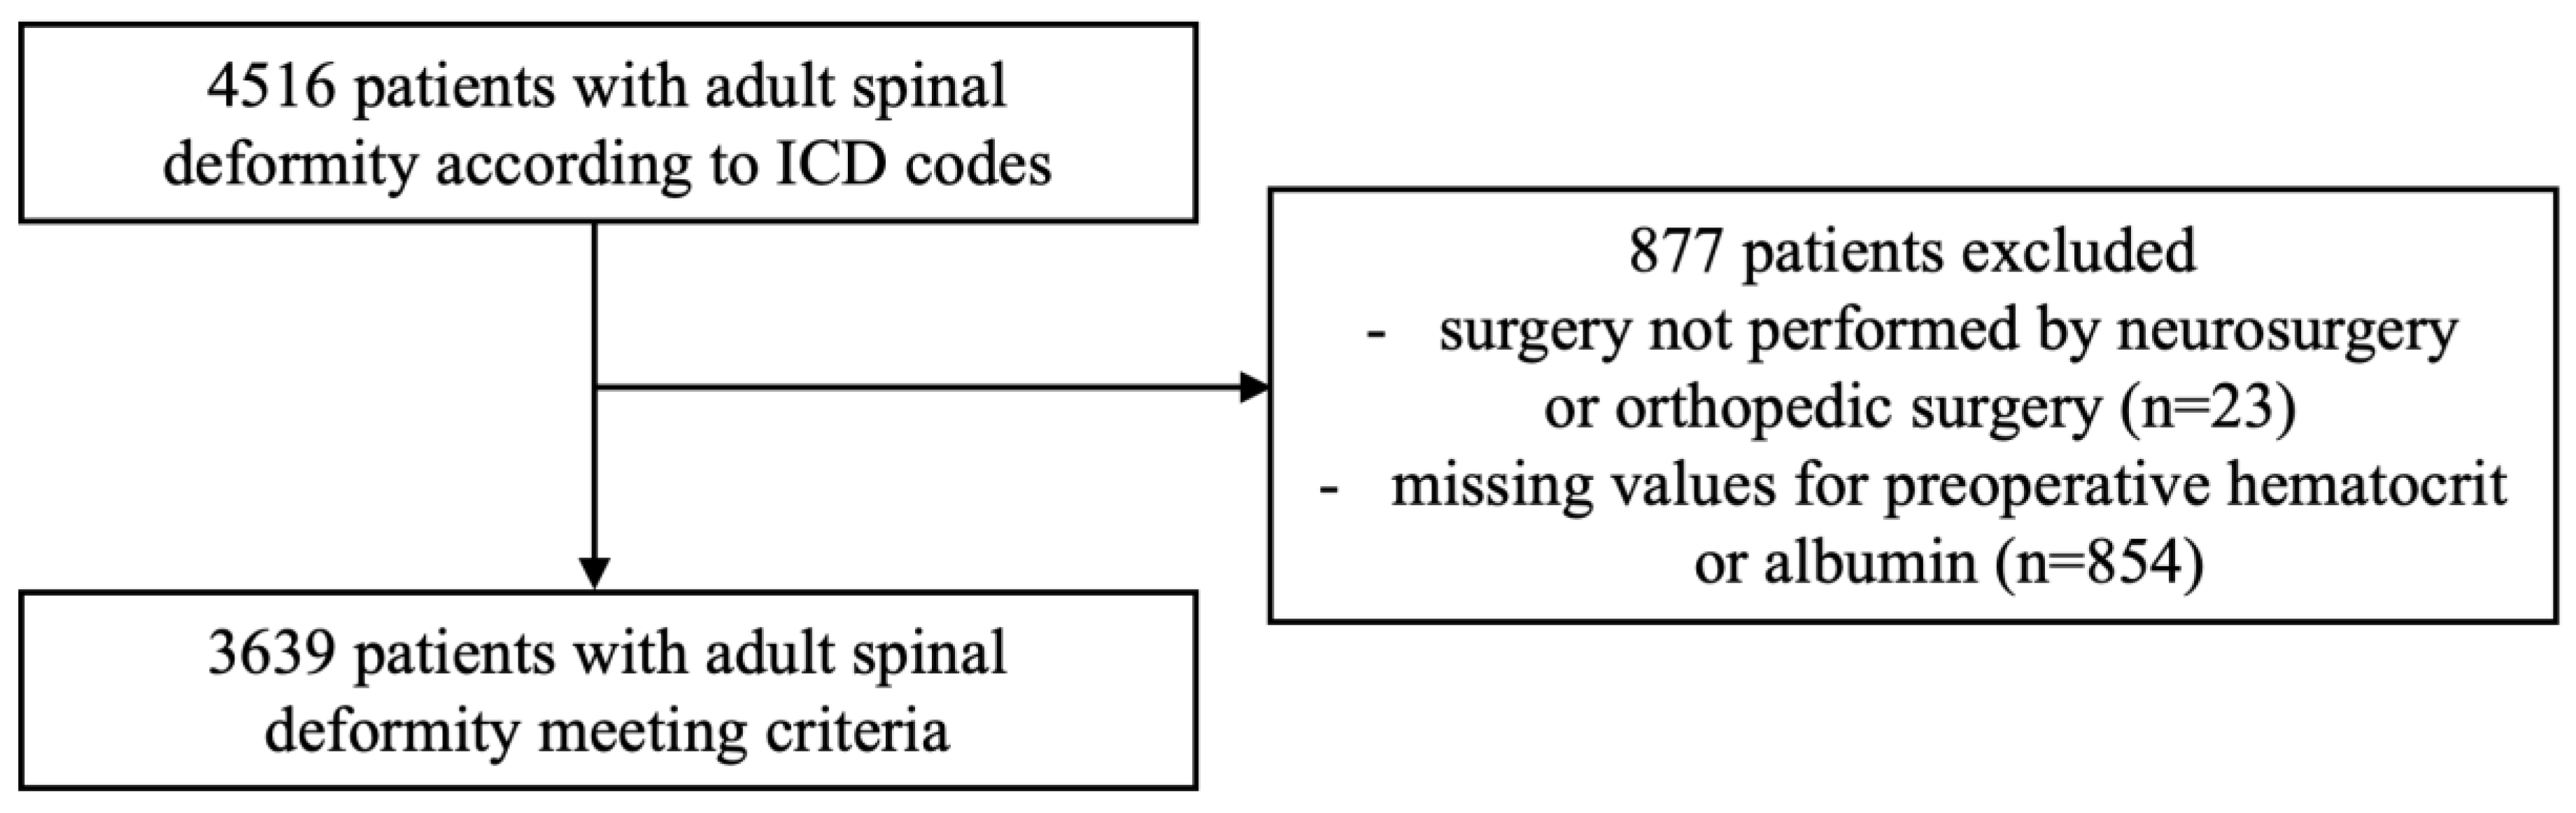
2.2. Patient Cohort
2.3. Exposure Definitions
2.4. Outcome Definitions
2.5. Statistical Analysis
3. Results
3.1. Patient Demographics and Comorbidities
3.2. 30-Day Complications and Hospital Outcomes
3.3. Multivariable Logistic Regression and ROC Analysis Comparing Predictive Models
3.3.1. Extended LOS
3.3.2. 30-Day Adverse Events
3.3.3. Non-Routine Discharge
3.3.4. 30-Day Mortality
4. Discussion
5. Conclusions
Supplementary Materials
Author Contributions
Funding
Institutional Review Board Statement
Informed Consent Statement
Data Availability Statement
Conflicts of Interest
Abbreviations
| ASD | Adult Spinal Deformity |
| ACS | American College of Surgeons |
| NSQIP | National Surgical Quality Improvement Program |
| PSF | Posterior Spinal Fusion |
| ICD | International Classification of Disease |
| CPT | Current Procedural Terminology |
| RAI-rev | Revised Risk Analysis Index |
| ROC | Receiver Operating Characteristic |
| LOS | Length of Stay |
| AE | Adverse Event |
| NRD | Non-routine Discharge |
| OR | Odds Ratio |
| CI | Confidence Interval |
| CHF | Congestive Heart Failure |
| BMI | Body Mass Index |
| ASA | American Society of Anesthesiologists |
| COPD | Chronic Obstructive Pulmonary Disease |
| SSI | Surgical Site Infection |
| PNA | Pneumonia |
| PE | Pulmonary Embolism |
| ARF | Acute Renal Failure |
| UTI | Urinary Tract Infection |
| MI | Myocardial Infarction |
| DVT | Deep Vein Thrombosis |
| RBC | Red Blood Cell |
| MAE | Minor Adverse Event |
| SAE | Severe Adverse Event |
| AIC | Akaike Information Criterion |
| AUC | Area Under the Curve |
| F | Frail Alone |
| FA | Frail + Anemic |
| FM | Frail + Malnourished |
| FAM | Frail + Anemic + Malnourished |
| NF | Not Frail |
| ERAS | Enhanced Recovery After Surgery |
References
- Martin, A.B.; Hartman, M.; Washington, B.; Catlin, A.; Team, N.H.E.A. National Health Expenditures In 2023: Faster Growth As Insurance Coverage And Utilization Increased. Health Aff. 2025, 44, 12–22. [Google Scholar] [CrossRef] [PubMed]
- Porter, M.E. A strategy for health care reform–toward a value-based system. N. Engl. J. Med. 2009, 361, 109–112. [Google Scholar] [CrossRef]
- Porter, M.E. What is value in health care? N. Engl. J. Med. 2010, 363, 2477–2481. [Google Scholar] [CrossRef] [PubMed]
- Passias, P.G.; Jalai, C.M.; Worley, N.; Vira, S.; Hasan, S.; Horn, S.R.; Segreto, F.A.; Bortz, C.A.; White, A.P.; Gerling, M.; et al. Predictors of Hospital Length of Stay and 30-Day Readmission in Cervical Spondylotic Myelopathy Patients: An Analysis of 3057 Patients Using the ACS-NSQIP Database. World Neurosurg. 2018, 110, e450–e458. [Google Scholar] [CrossRef]
- Galivanche, A.R.; Gala, R.; Bagi, P.S.; Boylan, A.J.; Dussik, C.M.; Coutinho, P.D.; Grauer, J.N.; Varthi, A.G. Perioperative Outcomes in 17,947 Patients Undergoing 2-Level Anterior Cervical Discectomy and Fusion Versus 1-Level Anterior Cervical Corpectomy for Treatment of Cervical Degenerative Conditions: A Propensity Score Matched National Surgical Quality Improvement Program Analysis. Neurospine 2020, 17, 871–878. [Google Scholar] [CrossRef]
- De la Garza-Ramos, R.; Goodwin, C.R.; Abu-Bonsrah, N.; Jain, A.; Miller, E.K.; Neuman, B.J.; Protopsaltis, T.S.; Passias, P.G.; Sciubba, D.M. Prolonged length of stay after posterior surgery for cervical spondylotic myelopathy in patients over 65 years of age. Clin. Neurosci. 2016, 31, 137–141. [Google Scholar] [CrossRef] [PubMed]
- Wynkoop, E.I.; Reitenbach, M.L.; Behrens, K.M.; Tanios, M.; Kouri, A.; Khuder, S.; Risser, I.; Elgafy, H. 30- and 90-day readmission after elective spine surgery—Does postoperative inpatient medical optimization affect readmission rates: A retrospective cross-sectional study. AME Surg. J. 2024, 4, 8. [Google Scholar] [CrossRef]
- Kim, H.J.; Yang, J.H.; Chang, D.G.; Lenke, L.G.; Suh, S.W.; Nam, Y.; Park, S.C.; Suk, S.I. Adult Spinal Deformity: A Comprehensive Review of Current Advances and Future Directions. Asian Spine J. 2022, 16, 776–788. [Google Scholar] [CrossRef]
- Smith, J.S.; Shaffrey, C.I.; Bess, S.; Shamji, M.F.; Brodke, D.; Lenke, L.G.; Fehlings, M.G.; Lafage, V.; Schwab, F.; Vaccaro, A.R.; et al. Recent and Emerging Advances in Spinal Deformity. Neurosurgery 2017, 80, S70–S85. [Google Scholar] [CrossRef]
- Safaee, M.M.; Ames, C.P.; Smith, J.S. Epidemiology and Socioeconomic Trends in Adult Spinal Deformity Care. Neurosurgery 2020, 87, 25–32. [Google Scholar] [CrossRef]
- Zygourakis, C.C.; Liu, C.Y.; Keefe, M.; Moriates, C.; Ratliff, J.; Dudley, R.A.; Gonzales, R.; Mummaneni, P.V.; Ames, C.P. Analysis of National Rates, Cost, and Sources of Cost Variation in Adult Spinal Deformity. Neurosurgery 2018, 82, 378–387. [Google Scholar] [CrossRef] [PubMed]
- Fried, L.P.; Tangen, C.M.; Walston, J.; Newman, A.B.; Hirsch, C.; Gottdiener, J.; Seeman, T.; Tracy, R.; Kop, W.J.; Burke, G.; et al. Frailty in older adults: Evidence for a phenotype. J. Gerontol. A Biol. Sci. Med. Sci. 2001, 56, M146–M156. [Google Scholar] [CrossRef] [PubMed]
- Makary, M.A.; Segev, D.L.; Pronovost, P.J.; Syin, D.; Bandeen-Roche, K.; Patel, P.; Takenaga, R.; Devgan, L.; Holzmueller, C.G.; Tian, J.; et al. Frailty as a predictor of surgical outcomes in older patients. J. Am. Coll. Surg. 2010, 210, 901–908. [Google Scholar] [CrossRef]
- Stopa, B.M.; Robertson, F.C.; Karhade, A.V.; Chua, M.; Broekman, M.L.D.; Schwab, J.H.; Smith, T.R.; Gormley, W.B. Predicting nonroutine discharge after elective spine surgery: External validation of machine learning algorithms. J. Neurosurg. Spine 2019, 31, 742–747. [Google Scholar] [CrossRef]
- Yadla, S.; Ghobrial, G.M.; Campbell, P.G.; Maltenfort, M.G.; Harrop, J.S.; Ratliff, J.K.; Sharan, A.D. Identification of complications that have a significant effect on length of stay after spine surgery and predictive value of 90-day readmission rate. J. Neurosurg. Spine 2015, 23, 807–811. [Google Scholar] [CrossRef] [PubMed]
- Charlson, M.E.; Pompei, P.; Ales, K.L.; MacKenzie, C.R. A new method of classifying prognostic comorbidity in longitudinal studies: Development and validation. J. Chronic Dis. 1987, 40, 373–383. [Google Scholar] [CrossRef] [PubMed]
- Weaver, D.J.; Malik, A.T.; Jain, N.; Yu, E.; Kim, J.; Khan, S.N. The Modified 5-Item Frailty Index: A Concise and Useful Tool for Assessing the Impact of Frailty on Postoperative Morbidity Following Elective Posterior Lumbar Fusions. World Neurosurg. 2019, 124, e626–e632. [Google Scholar] [CrossRef]
- Hall, D.E.; Arya, S.; Schmid, K.K.; Blaser, C.; Carlson, M.A.; Bailey, T.L.; Purviance, G.; Bockman, T.; Lynch, T.G.; Johanning, J. Development and Initial Validation of the Risk Analysis Index for Measuring Frailty in Surgical Populations. JAMA Surg. 2017, 152, 175–182. [Google Scholar] [CrossRef]
- Lee, C.T.; Chen, M.Z.; Yip, C.Y.C.; Yap, E.S.; Lee, S.Y.; Merchant, R.A. Prevalence of Anemia and Its Association with Frailty, Physical Function and Cognition in Community-Dwelling Older Adults: Findings from the HOPE Study. J. Nutr. Health Aging 2021, 25, 679–687. [Google Scholar] [CrossRef]
- Liu, W.; Chen, S.; Jiang, F.; Zhou, C.; Tang, S. Malnutrition and Physical Frailty among Nursing Home Residents: A Cross-Sectional Study in China. J. Nutr. Health Aging 2020, 24, 500–506. [Google Scholar] [CrossRef]
- Stretton, B.; Booth, A.E.C.; Kovoor, J.; Gupta, A.; Edwards, S.; Hugh, T.; Maddison, J.; Talley, N.J.; Plummer, M.; Meyer, E.; et al. Impact of frailty, malnutrition and socioeconomic status on perioperative outcomes. Age Ageing 2024, 53, afae263. [Google Scholar] [CrossRef]
- Shah, N.V.; Kim, D.J.; Patel, N.; Beyer, G.A.; Hollern, D.A.; Wolfert, A.J.; Kim, N.; Suarez, D.E.; Monessa, D.; Zhou, P.L.; et al. The 5-factor modified frailty index (mFI-5) is predictive of 30-day postoperative complications and readmission in patients with adult spinal deformity (ASD). J. Clin. Neurosci. 2022, 104, 69–73. [Google Scholar] [CrossRef]
- Arya, S.; Varley, P.; Youk, A.; Borrebach, J.D.; Perez, S.; Massarweh, N.N.; Johanning, J.M.; Hall, D.E. Recalibration and External Validation of the Risk Analysis Index: A Surgical Frailty Assessment Tool. Ann. Surg. 2020, 272, 996–1005. [Google Scholar] [CrossRef]
- Conlon, M.; Thommen, R.; Kazim, S.F.; Dicpinigaitis, A.J.; Schmidt, M.H.; McKee, R.G.; Bowers, C.A. Risk Analysis Index and Its Recalibrated Version Predict Postoperative Outcomes Better Than 5-Factor Modified Frailty Index in Traumatic Spinal Injury. Neurospine 2022, 19, 1039–1048. [Google Scholar] [CrossRef]
- Maitra, S.; Mikhail, C.; Cho, S.K.; Daubs, M.D. Preoperative Maximization to Reduce Complications in Spinal Surgery. Global Spine J. 2020, 10, 45S–52S. [Google Scholar] [CrossRef]
- Elsamadicy, A.A.; Havlik, J.; Reeves, B.C.; Sherman, J.J.Z.; Craft, S.; Serrato, P.; Sayeed, S.; Koo, A.B.; Khalid, S.I.; Lo, S.L.; et al. Association of Malnutrition with Surgical and Hospital Outcomes after Spine Surgery for Spinal Metastases: A National Surgical Quality Improvement Program Study of 1613 Patients. J. Clin. Med. 2024, 13, 1542. [Google Scholar] [CrossRef] [PubMed]
- Leven, D.M.; Lee, N.J.; Kothari, P.; Steinberger, J.; Guzman, J.; Skovrlj, B.; Shin, J.I.; Caridi, J.M.; Cho, S.K. Frailty Index Is a Significant Predictor of Complications and Mortality After Surgery for Adult Spinal Deformity. Spine 2016, 41, E1394–E1401. [Google Scholar] [CrossRef] [PubMed]
- Miller, E.K.; Neuman, B.J.; Jain, A.; Daniels, A.H.; Ailon, T.; Sciubba, D.M.; Kebaish, K.M.; Lafage, V.; Scheer, J.K.; Smith, J.S.; et al. An assessment of frailty as a tool for risk stratification in adult spinal deformity surgery. Neurosurg. Focus. 2017, 43, E3. [Google Scholar] [CrossRef] [PubMed]
- Baek, W.; Park, S.Y.; Kim, Y. Impact of frailty on the outcomes of patients undergoing degenerative spine surgery: A systematic review and meta-analysis. BMC Geriatr. 2023, 23, 771. [Google Scholar] [CrossRef]
- Mo, K.; Ortiz-Babilonia, C.; Al Farii, H.; Raad, M.; Musharbash, F.N.; Neuman, B.J.; Kebaish, K.M. Increased Severity of Anemia Is Associated with Postoperative Complications following a Adult Spinal Deformity Surgery. World Neurosurg. 2022, 167, e541–e548. [Google Scholar] [CrossRef]
- Jung, A.; Kong, R.; Tracey, O.; Patel, N.; Hadid, B.; Ikwuazom, C.; Shah, N.V.; Paulino, C.B.; Monsef, J.B. Impact of iron deficiency anemia on postoperative outcomes of thoracolumbar spinal fusion (≥2-level) on patients with adult spinal deformity with minimum two-year follow-up surveillance. Spine J. 2022, 22, S60–S61. [Google Scholar] [CrossRef]
- Phan, K.; Dunn, A.E.; Kim, J.S.; Capua, J.D.; Somani, S.; Kothari, P.; Lee, N.J.; Xu, J.; Dowdell, J.E.; Cho, S.K. Impact of Preoperative Anemia on Outcomes in Adults Undergoing Elective Posterior Cervical Fusion. Global Spine J. 2017, 7, 787–793. [Google Scholar] [CrossRef]
- Wang, J.; Oe, S.; Yamato, Y.; Hasegawa, T.; Yoshida, G.; Banno, T.; Arima, H.; Mihara, Y.; Ide, K.; Watanabe, Y.; et al. Preoperative Malnutrition-Associated Spinal Malalignment with Patient-Reported Outcome Measures in Adult Spinal Deformity Surgery: A 2-Year Follow-Up Study. Spine Surg. Relat. Res. 2023, 7, 74–82. [Google Scholar] [CrossRef]
- Oe, S.; Yamato, Y.; Hasegawa, T.; Yoshida, G.; Kobayashi, S.; Yasuda, T.; Banno, T.; Arima, H.; Mihara, Y.; Ushirozako, H.; et al. Association between a prognostic nutritional index less than 50 and the risk of medical complications after adult spinal deformity surgery. J. Neurosurg. Spine 2020, 33, 219–224. [Google Scholar] [CrossRef]
- Adogwa, O.; Martin, J.R.; Huang, K.; Verla, T.; Fatemi, P.; Thompson, P.; Cheng, J.; Kuchibhatla, M.; Lad, S.P.; Bagley, C.A.; et al. Preoperative serum albumin level as a predictor of postoperative complication after spine fusion. Spine 2014, 39, 1513–1519. [Google Scholar] [CrossRef]
- Li, C.Q.; Zhang, C.; Yu, F.; Li, X.Y.; Wang, D.X. The composite risk index based on frailty predicts postoperative complications in older patients recovering from elective digestive tract surgery: A retrospective cohort study. BMC Anesthesiol. 2022, 22, 7. [Google Scholar] [CrossRef] [PubMed]
- Han, D.; Wang, P.; Wang, S.K.; Cui, P.; Lu, S.B. Frailty and malnutrition as predictors of major complications following posterior thoracolumbar fusion in elderly patients: A retrospective cohort study. Spine J. 2024, 25, 679–687. [Google Scholar] [CrossRef] [PubMed]
- Camino-Willhuber, G.; Tani, S.; Schonnagel, L.; Caffard, T.; Haffer, H.; Chiapparelli, E.; Sarin, M.; Shue, J.; Soffin, E.M.; Zelenty, W.D.; et al. Association of Frailty and Preoperative Hypoalbuminemia with the Risk of Complications, Readmission, and Mortality After Spine Surgery. World Neurosurg. 2023, 174, e152–e158. [Google Scholar] [CrossRef]
- Pennington, Z.; Cottrill, E.; Lubelski, D.; Ehresman, J.; Theodore, N.; Sciubba, D.M. Systematic review and meta-analysis of the clinical utility of Enhanced Recovery After Surgery pathways in adult spine surgery. J. Neurosurg. Spine 2021, 34, 325–347. [Google Scholar] [CrossRef]
- Porche, K.; Yan, S.; Mohamed, B.; Garvan, C.; Samra, R.; Melnick, K.; Vaziri, S.; Seubert, C.; Decker, M.; Polifka, A.; et al. Enhanced recovery after surgery (ERAS) improves return of physiological function in frail patients undergoing one- to two-level TLIFs: An observational retrospective cohort study. Spine J. 2022, 22, 1513–1522. [Google Scholar] [CrossRef]
- Cui, P.; Wang, S.; Wang, P.; Yang, L.; Kong, C.; Lu, S. Comparison of perioperative outcomes in frail patients following multilevel lumbar fusion surgery with and without the implementation of the enhanced recovery after surgery protocol. Front. Surg. 2022, 9, 997657. [Google Scholar] [CrossRef] [PubMed]
- Chen, C.H.; Hsieh, H.-M. The Introduction of ERAS Nutritional Care Can Improve the Quality of Postoperative Care. Curr. Dev. Nutr. 2022, 6, 738. [Google Scholar] [CrossRef]
- Saleh, H.; Williamson, T.K.; Passias, P.G. Perioperative Nutritional Supplementation Decreases Wound Healing Complications Following Elective Lumbar Spine Surgery: A Randomized Controlled Trial. Spine 2023, 48, 376–383. [Google Scholar] [CrossRef] [PubMed]
- Vitale, M.G.; Stazzone, E.J.; Gelijns, A.C.; Moskowitz, A.J.; Roye, D.P. The effectiveness of preoperative erythropoietin in averting allogenic blood transfusion among children undergoing scoliosis surgery. J. Pediatr. Orthop. B 1998, 7, 203–209. [Google Scholar] [CrossRef]
- Cahill, C.M.; Alhasson, B.; Blumberg, N.; Melvin, A.; Knight, P.; Gloff, M.; Robinson, R.; Akwaa, F.; Refaai, M.A. Preoperative anemia management program reduces blood transfusion in elective cardiac surgical patients, improving outcomes and decreasing hospital length of stay. Transfusion 2021, 61, 2629–2636. [Google Scholar] [CrossRef]
- Villafañe, J.H.; Valdes, K.; Pedersini, P.; Berjano, P. Osteoarthritis: A call for research on central pain mechanism and personalized prevention strategies. Clin. Rheumatol. 2019, 38, 583–584. [Google Scholar] [CrossRef]


| Variables | Frail Alone (n = 460) | Frail + Anemic (n = 266) | Frail + Malnourished (n = 37) | Frail + Anemic + Malnourished (n = 121) | Not Frail (n = 2755) | p-Value |
|---|---|---|---|---|---|---|
| Age (years), mean (SD) | 70.94 (7.69) | 69.85 (8.05) | 73.08 (9.24) | 70.47 (8.75) | 45.50 (17.48) | <0.001 * |
| Female, n (%) | 245 (53.3) | 82 (30.8) | 21 (56.8) | 57 (47.1) | 1992 (72.3) | <0.001 * |
| Race/Ethnicity, n (%) | 0.005 * | |||||
| NHW | 373 (85.9) | 186 (76.9) | 18 (64.3) | 85 (76.6) | 1866 (80.6) | |
| NHB | 27 (6.2) | 26 (10.7) | 3 (10.7) | 13 (11.7) | 242 (10.4) | |
| Hispanic | 16 (3.7) | 21 (8.7) | 5 (17.9) | 6 (5.4) | 127 (5.5) | |
| Other | 18 (4.1) | 9 (3.7) | 2 (7.1) | 7 (6.3) | 81 (3.5) | |
| BMI (kg/m2), mean (SD) | 29.33 (6.02) | 29.07 (6.84) | 29.17 (6.70) | 28.10 (6.43) | 27.49 (7.25) | <0.001 * |
| ASA, n (%) | <0.001 * | |||||
| 1 | 2 (0.4) | 0 (0.0) | 0 (0.0) | 0 (0.0) | 186 (6.8) | |
| 2 | 118 (25.7) | 38 (14.3) | 7 (18.9) | 16 (13.2) | 1190 (43.3) | |
| 3 | 328 (71.3) | 199 (75.1) | 24 (64.9) | 75 (62.0) | 1302 (47.3) | |
| ≥4 | 12 (2.6) | 28 (10.6) | 6 (16.2) | 30 (24.8) | 72 (2.6) | |
| Hypertension, n (%) | 324 (70.4) | 193 (72.6) | 23 (62.2) | 86 (71.1) | 879 (31.9) | <0.001 * |
| Diabetes mellitus, n (%) | 79 (17.2) | 66 (24.8) | 12 (32.4) | 35 (28.9) | 244 (8.9) | <0.001 * |
| COPD, n (%) | 28 (6.1) | 19 (7.1) | 3 (8.1) | 9 (7.4) | 82 (3.0) | <0.001 * |
| CHF, n (%) | 9 (2.0) | 9 (3.4) | 2 (5.4) | 2 (1.7) | 5 (0.2) | <0.001 * |
| Dependent functional status, n (%) | 33 (7.2) | 31 (11.7) | 3 (8.1) | 34 (28.1) | 95 (3.5) | <0.001 * |
| Disseminated cancer, n (%) | 14 (3.0) | 25 (9.4) | 7 (18.9) | 12 (9.9) | 0 (0.0) | <0.001 * |
| Electrolyte abnormality, n (%) | 28 (6.1) | 25 (9.5) | 5 (13.5) | 26 (21.5) | 143 (5.9) | <0.001 * |
| Smoking, n (%) | 33 (7.2) | 46 (17.3) | 7 (18.9) | 18 (14.9) | 540 (19.6) | <0.001 * |
| Pre-operative steroids, n (%) | 24 (5.2) | 19 (7.1) | 2 (5.4) | 21 (17.4) | 111 (4.0) | <0.001 * |
| Bleeding disorder, n (%) | 10 (2.2) | 17 (6.4) | 2 (5.4) | 4 (3.3) | 43 (1.6) | <0.001 * |
| Variables | Frail Alone (n = 460) | Frail + Anemic (n = 266) | Frail + Malnourished (n = 37) | Frail + Anemic + Malnourished (n = 121) | Not Frail (n = 2755) | p-Value |
|---|---|---|---|---|---|---|
| Any AE, n (%) | 213 (46.3) | 161 (60.5) | 16 (43.2) | 75 (62.0) | 1259 (45.7) | <0.001 * |
| Surgical AEs, n (%) | ||||||
| Superficial SSI | 5 (1.1) | 8 (3.0) | 0 (0.0) | 2 (1.7) | 37 (1.3) | 0.214 |
| Deep SSI | 4 (0.9) | 2 (0.8) | 1 (2.7) | 1 (0.8) | 25 (0.9) | 0.842 |
| Organ space SSI | 4 (0.9) | 5 (1.9) | 0 (0.0) | 3 (2.5) | 33 (1.2) | 0.488 |
| Wound dehiscence | 2 (0.4) | 3 (1.1) | 0 (0.0) | 1 (0.8) | 23 (0.8) | 0.830 |
| Medical AEs, n (%) | ||||||
| PNA | 13 (2.8) | 14 (5.3) | 2 (5.4) | 5 (4.1) | 66 (2.4) | 0.051 |
| Reintubation | 3 (0.7) | 10 (3.8) | 0 (0.0) | 8 (6.6) | 36 (1.3) | <0.001 * |
| Ventilator requirement | 8 (1.7) | 12 (4.5) | 0 (0.0) | 10 (8.3) | 40 (1.5) | <0.001 * |
| PE | 16 (3.5) | 11 (4.1) | 1 (2.7) | 2 (1.7) | 36 (1.3) | 0.001 * |
| Renal insufficiency | 5 (1.2) | 6 (2.5) | 0 (0.0) | 0 (0.0) | 12 (0.5) | 0.004 * |
| ARF | 1 (0.2) | 2 (0.8) | 0 (0.0) | 1 (0.8) | 3 (0.1) | 0.093 |
| UTI | 22 (4.8) | 15 (5.6) | 2 (5.4) | 4 (3.3) | 62 (2.3) | 0.001 * |
| Cardiac arrest or MI | 3 (0.7) | 2 (0.8) | 0 (0.0) | 2 (1.7) | 10 (0.4) | 0.260 |
| DVT | 7 (1.5) | 9 (3.4) | 0 (0.0) | 2 (1.7) | 30 (1.1) | 0.032 * |
| C. diff colitis | 0 (0.0) | 3 (1.5) | 0 (0.0) | 1 (1.2) | 6 (0.3) | 0.039 * |
| Systemic sepsis | 12 (2.6) | 8 (3.0) | 1 (2.7) | 4 (3.3) | 53 (1.9) | 0.576 |
| Septic shock | 2 (0.4) | 2 (0.8) | 1 (2.7) | 5 (4.1) | 9 (0.3) | <0.001 * |
| Postoperative RBC transfusion | 174 (37.8) | 145 (54.5) | 12 (32.4) | 64 (52.9) | 1143 (41.5) | <0.001 * |
| AE severity, n (%) | ||||||
| MAE | 42 (9.1) | 38 (14.3) | 4 (10.8) | 11 (9.1) | 166 (6.0) | <0.001 * |
| SAE | 197 (42.8) | 156 (58.6) | 13 (35.1) | 70 (57.9) | 1221 (44.3) | <0.001 * |
| Hospital length of stay (days), mean (SD) | 6.41 (5.09) | 8.92 (7.58) | 12.61 (11.30) | 13.49 (12.72) | 6.50 (6.24) | <0.001 * |
| Total operation time (hours), mean (SD) | 5.49 (2.69) | 5.41 (2.76) | 4.64 (2.67) | 4.80 (2.29) | 5.51 (2.62) | 0.017 * |
| Readmission, n (%) | 40 (8.7) | 28 (10.6) | 3 (8.1) | 14 (11.6) | 171 (6.3) | 0.010 * |
| Reoperation, n (%) | 26 (5.7) | 16 (6.0) | 4 (10.8) | 8 (6.6) | 143 (5.2) | 0.568 |
| Non-routine discharge, n (%) | 210 (46.2) | 154 (58.6) | 28 (77.8) | 79 (65.8) | 587 (21.4) | <0.001 * |
| Mortality, n (%) | 3 (0.7) | 4 (1.5) | 1 (2.7) | 9 (7.4) | 9 (0.3) | <0.001 * |
| Adjusted OR | Lower Limit 95% CI | Upper Limit 95% CI | p-Value | |
|---|---|---|---|---|
| Extended Hospital Length of Stay | ||||
| RAI-rev | 1.03 | 1.01 | 1.04 | <0.001 * |
| Anemic | 1.84 | 1.45 | 2.35 | <0.001 * |
| Malnourished | 2.34 | 1.69 | 3.24 | <0.001 * |
| Female | 1.39 | 1.10 | 1.75 | 0.006 * |
| ASA | ||||
| 1–2 | REF | REF | REF | REF |
| ≥3 | 1.90 | 1.47 | 2.47 | <0.001 * |
| Dependent functional status | 2.05 | 1.39 | 3.03 | <0.001 * |
| Bleeding disorder | 1.68 | 0.91 | 3.12 | 0.098 |
| 30-Day Adverse Events | ||||
| RAI-rev | 1.07 | 1.04 | 1.11 | <0.001 * |
| Anemic | 2.09 | 1.66 | 2.61 | <0.001 * |
| Malnourished | 0.93 | 0.67 | 1.28 | 0.646 |
| Age | 0.98 | 0.96 | 0.99 | 0.001 * |
| Female | 2.17 | 1.72 | 2.75 | <0.001 * |
| Race/Ethnicity | ||||
| NHW | REF | REF | REF | REF |
| NHB | 0.66 | 0.48 | 0.91 | 0.012 * |
| Hispanic | 0.67 | 0.44 | 1.02 | 0.061 |
| Other | 1.25 | 0.74 | 2.09 | 0.400 |
| ASA | ||||
| 1–2 | REF | REF | REF | REF |
| ≥ 3 | 1.54 | 1.24 | 1.91 | <0.001 * |
| Diabetes mellitus | 0.81 | 0.62 | 1.06 | 0.123 |
| Disseminated cancer | 0.28 | 0.12 | 0.62 | 0.002 * |
| Smoking | 0.60 | 0.47 | 0.77 | <0.001 * |
| Adjusted OR | Lower Limit 95% CI | Upper Limit 95% CI | p-Value | |
|---|---|---|---|---|
| Nonroutine Discharge | ||||
| RAI-rev | 1.11 | 1.06 | 1.16 | <0.001 * |
| Anemic | 1.25 | 0.97 | 1.62 | 0.090 |
| Malnourished | 1.57 | 1.08 | 2.29 | 0.018 * |
| Age | 1.03 | 1.01 | 1.05 | <0.001 * |
| Female | 1.45 | 1.09 | 1.92 | 0.010 * |
| BMI | 1.02 | 1.00 | 1.04 | 0.034 * |
| Hypertension | 0.62 | 0.48 | 0.80 | <0.001 * |
| Diabetes mellitus | 1.36 | 1.00 | 1.85 | 0.053 |
| COPD | 1.41 | 0.89 | 2.25 | 0.145 |
| Disseminated cancer | 0.19 | 0.07 | 0.49 | <0.001 * |
| SAE | 1.65 | 1.28 | 2.14 | <0.001 * |
| LOS (days) | 1.09 | 1.07 | 1.12 | <0.001 * |
| Operation time (hours) | 1.14 | 1.08 | 1.19 | <0.001 * |
| 30-Day Mortality | ||||
| RAI-rev | 1.10 | 1.04 | 1.17 | 0.001 * |
| Anemic | 1.04 | 0.34 | 3.17 | 0.951 |
| Malnourished | 3.79 | 1.24 | 11.60 | 0.020 * |
| Age | 0.97 | 0.94 | 1.00 | 0.081 |
| Electrolyte abnormality | 2.54 | 0.83 | 7.78 | 0.102 |
| Smoking | 0.25 | 0.03 | 2.07 | 0.199 |
| Pre-operative steroids | 5.74 | 2.10 | 15.69 | <0.001 * |
| Bleeding disorder | 3.19 | 0.75 | 13.60 | 0.117 |
| MAE | 6.44 | 2.47 | 16.80 | <0.001 * |
| SAE | 2.94 | 0.93 | 9.37 | 0.068 |
Disclaimer/Publisher’s Note: The statements, opinions and data contained in all publications are solely those of the individual author(s) and contributor(s) and not of MDPI and/or the editor(s). MDPI and/or the editor(s) disclaim responsibility for any injury to people or property resulting from any ideas, methods, instructions or products referred to in the content. |
© 2025 by the authors. Licensee MDPI, Basel, Switzerland. This article is an open access article distributed under the terms and conditions of the Creative Commons Attribution (CC BY) license (https://creativecommons.org/licenses/by/4.0/).
Share and Cite
Elsamadicy, A.A.; Serrato, P.; Ghanekar, S.D.; Hansen, J.; Brown, E.D.L.; Khalid, S.I.; Schneider, D.; Lo, S.-f.L.; Sciubba, D.M. Composite RAI, Malnutrition, and Anemia Model Superiorly Predicts 30-Day Morbidity and Mortality After Surgery for Adult Spinal Deformity. J. Clin. Med. 2025, 14, 5379. https://doi.org/10.3390/jcm14155379
Elsamadicy AA, Serrato P, Ghanekar SD, Hansen J, Brown EDL, Khalid SI, Schneider D, Lo S-fL, Sciubba DM. Composite RAI, Malnutrition, and Anemia Model Superiorly Predicts 30-Day Morbidity and Mortality After Surgery for Adult Spinal Deformity. Journal of Clinical Medicine. 2025; 14(15):5379. https://doi.org/10.3390/jcm14155379
Chicago/Turabian StyleElsamadicy, Aladine A., Paul Serrato, Shaila D. Ghanekar, Justice Hansen, Ethan D. L. Brown, Syed I. Khalid, Daniel Schneider, Sheng-fu Larry Lo, and Daniel M. Sciubba. 2025. "Composite RAI, Malnutrition, and Anemia Model Superiorly Predicts 30-Day Morbidity and Mortality After Surgery for Adult Spinal Deformity" Journal of Clinical Medicine 14, no. 15: 5379. https://doi.org/10.3390/jcm14155379
APA StyleElsamadicy, A. A., Serrato, P., Ghanekar, S. D., Hansen, J., Brown, E. D. L., Khalid, S. I., Schneider, D., Lo, S.-f. L., & Sciubba, D. M. (2025). Composite RAI, Malnutrition, and Anemia Model Superiorly Predicts 30-Day Morbidity and Mortality After Surgery for Adult Spinal Deformity. Journal of Clinical Medicine, 14(15), 5379. https://doi.org/10.3390/jcm14155379