
Trunk Laterality Judgement in Chronic Low Back Pain: Influence of Low Back Pain History, Task Complexity, and Clinical Correlates

 ,
,  , , and
Abstract
1. Introduction
2. Materials and Methods
2.1. Study Design
2.2. Participants and Recruitment
2.3. Procedures
2.3.1. Self-Report Measures
Sociodemographic Data
Clinical Parameters
- Pain-free persons
- Patients with CLBP
2.3.2. Left/Right Discrimination Task
2.4. Data Processing and Outcomes
2.5. Statistical Analyses
2.6. Sample Size
3. Results
3.1. Participant Characteristics
3.2. LRDT Outliers and Trade-Off Between Accuracy and Reaction Times
3.3. Associations Between Sociodemographic Variables and LRDT Outcomes
3.4. Differences in LRDT Between CLBP and Pain-Free Persons
3.4.1. Accuracy
CLBP vs. PF-Total Group
CLBP vs. PF-noLBP vs. PF-LBP Groups
3.4.2. Reaction Time
CLBP vs. PF-Total Group
CLBP vs. PF-noLBP vs. PF-LBP Groups
3.5. Associations Between Clinical Parameters and LRDT in CLBP
4. Discussion
4.1. Clinical Implications
4.2. Implications for Future Research
4.3. Study Limitations
5. Conclusions
Supplementary Materials
Author Contributions
Funding
Institutional Review Board Statement
Informed Consent Statement
Data Availability Statement
Conflicts of Interest
Abbreviations
| ACC | Accuracy |
| CLBP | Chronic low back pain |
| LBP | Low back pain |
| LRD | Left/right discrimination |
| LRDT | Left/right discrimination task |
| PF | Pain-free |
| PF-LBP | Pain-free with low back pain history |
| PF-noLBP | Pain-free without low back pain history |
| RT | Reaction time |
References
- Hartvigsen, J.; Hancock, M.J.; Kongsted, A.; Louw, Q.; Ferreira, M.L.; Genevay, S.; Hoy, D.; Karppinen, J.; Pransky, G.; Sieper, J.; et al. What low back pain is and why we need to pay attention. Lancet 2018, 391, 2356–2367. [Google Scholar] [CrossRef] [PubMed]
- Matheve, T.; Hodges, P.; Danneels, L. The Role of Back Muscle Dysfunctions in Chronic Low Back Pain: State-of-the-Art and Clinical Implications. J. Clin. Med. 2023, 12, 5510. [Google Scholar] [CrossRef] [PubMed]
- Hodges, P.W.; Danneels, L. Changes in Structure and Function of the Back Muscles in Low Back Pain: Different Time Points, Observations, and Mechanisms. J. Orthop. Sports Phys. Ther. 2019, 49, 464–476. [Google Scholar] [CrossRef]
- Kregel, J.; Meeus, M.; Malfliet, A.; Dolphens, M.; Danneels, L.; Nijs, J.; Cagnie, B. Structural and functional brain abnormalities in chronic low back pain: A systematic review. Semin. Arthritis Rheum. 2015, 45, 229–237. [Google Scholar] [CrossRef]
- Goossens, N.; Rummens, S.; Janssens, L.; Caeyenberghs, K.; Brumagne, S. Association Between Sensorimotor Impairments and Functional Brain Changes in Patients with Low Back Pain: A Critical Review. Am. J. Phys. Med. Rehabil./Assoc. Acad. Physiatr. 2018, 97, 200–211. [Google Scholar] [CrossRef]
- Jenkins, L.C.; Chang, W.J.; Buscemi, V.; Liston, M.; Humburg, P.; Nicholas, M.; Graven-Nielsen, T.; Hodges, P.W.; McAuley, J.H.; Schabrun, S.M. Cortical function and sensorimotor plasticity are prognostic factors associated with future low back pain after an acute episode: The Understanding persistent Pain Where it ResiDes prospective cohort study. Pain 2023, 164, 14–26. [Google Scholar] [CrossRef]
- Mansour, A.R.; Baliki, M.N.; Huang, L.; Torbey, S.; Herrmann, K.M.; Schnitzer, T.J.; Apkarian, V.A. Brain white matter structural properties predict transition to chronic pain. Pain 2013, 154, 2160–2168. [Google Scholar] [CrossRef]
- Baliki, M.N.; Petre, B.; Torbey, S.; Herrmann, K.M.; Huang, L.; Schnitzer, T.J.; Fields, H.L.; Apkarian, A.V. Corticostriatal functional connectivity predicts transition to chronic back pain. Nat. Neurosci. 2012, 15, 1117–1119. [Google Scholar] [CrossRef]
- Bagg, M.K.; Wand, B.M.; Cashin, A.G.; Lee, H.; Hübscher, M.; Stanton, T.R.; O’Connell, N.E.; O’Hagan, E.T.; Rizzo, R.R.N.; Wewege, M.A.; et al. Effect of Graded Sensorimotor Retraining on Pain Intensity in Patients with Chronic Low Back Pain: A Randomized Clinical Trial. JAMA 2022, 328, 430–439. [Google Scholar] [CrossRef]
- Timmers, I.; de Jong, J.R.; Goossens, M.; Verbunt, J.A.; Smeets, R.J.; Kaas, A.L. Exposure in vivo Induced Changes in Neural Circuitry for Pain-Related Fear: A Longitudinal fMRI Study in Chronic Low Back Pain. Front. Neurosci. 2019, 13, 970. [Google Scholar] [CrossRef]
- Ashar, Y.K.; Gordon, A.; Schubiner, H.; Uipi, C.; Knight, K.; Anderson, Z.; Carlisle, J.; Polisky, L.; Geuter, S.; Flood, T.F.; et al. Effect of Pain Reprocessing Therapy vs Placebo and Usual Care for Patients with Chronic Back Pain: A Randomized Clinical Trial. JAMA Psychiatry 2022, 79, 13–23. [Google Scholar] [CrossRef] [PubMed]
- Daffada, P.J.; Walsh, N.; McCabe, C.S.; Palmer, S. The impact of cortical remapping interventions on pain and disability in chronic low back pain: A systematic review. Physiotherapy 2015, 101, 25–33. [Google Scholar] [CrossRef] [PubMed]
- Iglar, L.; Mansfield, C.J.; Bleacher, J.; Briggs, M. Monkey See, Monkey Do—Using Graded Motor Imagery in the Management of Chronic Low Back Pain: A Case Report. JOSPT Cases 2021, 1, 61–67. [Google Scholar] [CrossRef]
- Moseley, G.L.; Butler, D.S.; Beames, T.B. The Graded Motor Imagery Handbook; NOI Group: Adelaide, Australia, 2012. [Google Scholar]
- Lotze, M.; Moseley, G.L. Clinical and Neurophysiological Effects of Progressive Movement Imagery Training for Pathological Pain. J. Pain 2022, 23, 1480–1491. [Google Scholar] [CrossRef]
- Parsons, L.M. Integrating cognitive psychology, neurology and neuroimaging. Acta Psychol. 2001, 107, 155–181. [Google Scholar] [CrossRef]
- Breckenridge, J.D.; Ginn, K.A.; Wallwork, S.B.; McAuley, J.H. Do People with Chronic Musculoskeletal Pain Have Impaired Motor Imagery? A Meta-analytical Systematic Review of the Left/Right Judgment Task. J. Pain 2019, 20, 119–132. [Google Scholar] [CrossRef]
- Kohler, M.; Strauss, S.; Horn, U.; Langner, I.; Usichenko, T.; Neumann, N.; Lotze, M. Differences in Neuronal Representation of Mental Rotation in Patients with Complex Regional Pain Syndrome and Healthy Controls. J. Pain 2019, 20, 898–907. [Google Scholar] [CrossRef]
- Beisheim-Ryan, E.H.; Pohlig, R.T.; Medina, J.; Hicks, G.E.; Sions, J.M. Body representation among adults with phantom limb pain: Results from a foot identification task. Eur. J. Pain 2022, 26, 255–269. [Google Scholar] [CrossRef]
- Ravat, S.; Olivier, B.; Gillion, N.; Lewis, F. Laterality judgment performance between people with chronic pain and pain-free individuals. A systematic review and meta-analysis. Physiother. Theory Pract. 2020, 36, 1279–1299. [Google Scholar] [CrossRef]
- Pelletier, R.; Higgins, J.; Bourbonnais, D. Laterality recognition of images, motor performance, and aspects related to pain in participants with and without wrist/hand disorders: An observational cross-sectional study. Musculoskelet. Sci. Pract. 2018, 35, 18–24. [Google Scholar] [CrossRef]
- García-Dopico, N.; Terrasa, J.L.; González-Roldán, A.M.; Velasco-Roldán, O.; Sitges, C. Unraveling the Left-Right Judgment Task in Chronic Low Back Pain: Insights Through Behavioral, Electrophysiological, Motor Imagery, and Bodily Disruption Perspectives. J. Pain 2024, 25, 104484. [Google Scholar] [CrossRef]
- Linder, M.; Michaelson, P.; Röijezon, U. Laterality judgments in people with low back pain--A cross-sectional observational and test-retest reliability study. Man. Ther. 2016, 21, 128–133. [Google Scholar] [CrossRef]
- Bray, H.; Moseley, G.L. Disrupted working body schema of the trunk in people with back pain. Br. J. Sports Med. 2011, 45, 168–173. [Google Scholar] [CrossRef] [PubMed]
- Bowering, K.J.; Butler, D.S.; Fulton, I.J.; Moseley, G.L. Motor imagery in people with a history of back pain, current back pain, both, or neither. Clin. J. Pain 2014, 30, 1070–1075. [Google Scholar] [CrossRef] [PubMed]
- Kim, Y.K.; Park, E.; Lee, A.; Im, C.H.; Kim, Y.H. Changes in network connectivity during motor imagery and execution. PLoS ONE 2018, 13, e0190715. [Google Scholar] [CrossRef]
- Alsubaie, A.M.; Mazaheri, M.; Martinez-Valdes, E.; Falla, D. Is movement variability altered in people with chronic non-specific low back pain? A systematic review. PLoS ONE 2023, 18, e0287029. [Google Scholar] [CrossRef]
- Matheve, T.; De Baets, L.; Bogaerts, K.; Timmermans, A. Lumbar range of motion in chronic low back pain is predicted by task-specific, but not by general measures of pain-related fear. Eur. J. Pain 2019, 23, 1171–1184. [Google Scholar] [CrossRef]
- Matheve, T.; Timmermans, A.; Danneels, L.; De Baets, L. Task-Specific Perceived Harmfulness Predicts Protective Movement Behaviour in Chronic Low Back Pain. J. Clin. Med. 2024, 13, 5025. [Google Scholar] [CrossRef]
- Christe, G.; Crombez, G.; Edd, S.; Opsommer, E.; Jolles, B.M.; Favre, J. Relationship between psychological factors and spinal motor behaviour in low back pain: A systematic review and meta-analysis. Pain 2021, 162, 672–686. [Google Scholar] [CrossRef]
- Toussaint, L.; Billot, M.; Cabirol, R.; Rigoard, P.; Teillet, P.; David, R.; Tisserand, R. Impact of chronic low back pain on implicit motor imagery assessed by a new laterality judgment task. J. Pain 2025, 26, 104719. [Google Scholar] [CrossRef]
- Demoulin, C.; Huijnen, I.P.; Somville, P.R.; Grosdent, S.; Salamun, I.; Crielaard, J.M.; Vanderthommen, M.; Volders, S. Relationship between different measures of pain-related fear and physical capacity of the spine in patients with chronic low back pain. Spine J. 2013, 13, 1039–1047. [Google Scholar] [CrossRef] [PubMed]
- Wallwork, S.B.; Leake, H.B.; Peek, A.L.; Moseley, G.L.; Stanton, T.R. Implicit motor imagery performance is impaired in people with chronic, but not acute, neck pain. PeerJ 2020, 8, e8553. [Google Scholar] [CrossRef] [PubMed]
- Elsig, S.; Luomajoki, H.; Sattelmayer, M.; Taeymans, J.; Tal-Akabi, A.; Hilfiker, R. Sensorimotor tests, such as movement control and laterality judgment accuracy, in persons with recurrent neck pain and controls. A case-control study. Man. Ther. 2014, 19, 555–561. [Google Scholar] [CrossRef] [PubMed]
- Devecchi, V.; Rushton, A.B.; Gallina, A.; Heneghan, N.R.; Falla, D. Are neuromuscular adaptations present in people with recurrent spinal pain during a period of remission? a systematic review. PLoS ONE 2021, 16, e0249220. [Google Scholar] [CrossRef]
- Proske, U.; Gandevia, S.C. The proprioceptive senses: Their roles in signaling body shape, body position and movement, and muscle force. Physiol. Rev. 2012, 92, 1651–1697. [Google Scholar] [CrossRef]
- Maher, C.; Underwood, M.; Buchbinder, R. Non-specific low back pain. Lancet 2017, 389, 736–747. [Google Scholar] [CrossRef]
- Chiarotto, A.; Maxwell, L.J.; Ostelo, R.W.; Boers, M.; Tugwell, P.; Terwee, C.B. Measurement Properties of Visual Analogue Scale, Numeric Rating Scale, and Pain Severity Subscale of the Brief Pain Inventory in Patients with Low Back Pain: A Systematic Review. J. Pain 2018, 20, 245–263. [Google Scholar] [CrossRef]
- Roland, M.; Morris, R. A study of the natural history of back pain. Part I: Development of a reliable and sensitive measure of disability in low-back pain. Spine 1983, 8, 141–144. [Google Scholar] [CrossRef]
- Sullivan, M.J.; Bishop, F.L.; Pivik, J. The pain catastrophizing scale: Development and validation. Psychol. Assess. 1995, 7, 524–532. [Google Scholar] [CrossRef]
- Vlaeyen, J.W.; Kole-Snijders, A.M.; Boeren, R.G.; van Eek, H. Fear of movement/(re)injury in chronic low back pain and its relation to behavioral performance. Pain 1995, 62, 363–372. [Google Scholar] [CrossRef]
- Hoaglin, D.C.; Iglewicz, B. Fine tuning some resistant rules for outlier labeling. J. Am. Stat. Assoc. 1987, 82, 1147–1149. [Google Scholar] [CrossRef]
- Lee, W.J.; Choi, S.H.; Jang, J.H.; Moon, J.Y.; Kim, Y.C.; Noh, E.; Shin, J.E.; Shin, H.; Kang, D.H. Different patterns in mental rotation of facial expressions in complex regional pain syndrome patients. Medicine 2017, 96, e7990. [Google Scholar] [CrossRef] [PubMed]
- Cohen, J. Statistical Power Analysis for the Behavioral Sciences, 2nd ed.; Lawrence Erlbaum: Hillsdale, MI, USA, 1988. [Google Scholar]
- Han, J.; Waddington, G.; Adams, R.; Anson, J.; Liu, Y. Assessing proprioception: A critical review of methods. J. Sport. Health Sci. 2016, 5, 80–90. [Google Scholar] [CrossRef] [PubMed]
- D’Hooge, R.; Hodges, P.; Tsao, H.; Hall, L.; Macdonald, D.; Danneels, L. Altered trunk muscle coordination during rapid trunk flexion in people in remission of recurrent low back pain. J. Electromyogr. Kinesiol. 2013, 23, 173–181. [Google Scholar] [CrossRef]
- Stanton, T.R.; Latimer, J.; Maher, C.G.; Hancock, M.J. A modified Delphi approach to standardize low back pain recurrence terminology. Eur. Spine J. 2011, 20, 744–752. [Google Scholar] [CrossRef]
- da Silva, T.; Mills, K.; Brown, B.T.; Pocovi, N.; de Campos, T.; Maher, C.; Hancock, M.J. Recurrence of low back pain is common: A prospective inception cohort study. J. Physiother. 2019, 65, 159–165. [Google Scholar] [CrossRef]
- Imai, R.; Imaoka, M.; Nakao, H.; Hida, M.; Fujii, R.; Shiba, T.; Nishigami, T. Task-specific fear rather than general kinesiophobia assessment is associated with kinematic differences in chronic low back pain during lumbar flexion: A preliminary investigation. Pain Rep. 2022, 7, 1025. [Google Scholar] [CrossRef]
- De Baets, L.; Meulders, A.; Van Damme, S.; Caneiro, J.P.; Matheve, T. Understanding discrepancies in a person’s fear of movement and avoidance behaviour: A guide for musculoskeletal rehabilitation clinicians who support people with chronic musculoskeletal pain. J. Orthop. Sports Phys. Ther. 2023, 53, 307–316. [Google Scholar] [CrossRef]
- Moseley, G.L. Why do people with complex regional pain syndrome take longer to recognize their affected hand? Neurology 2004, 62, 2182–2186. [Google Scholar] [CrossRef]
- Martínez, E.; Guillen, V.; Buesa, I.; Azkue, J.J. A Distorted Body Schema and Susceptibility to Experiencing Anomalous Somatosensory Sensations in Fibromyalgia Syndrome. Clin. J. Pain 2019, 35, 887–893. [Google Scholar] [CrossRef]
- Rio, E.K.; Stanton, T.R.; Wand, B.M.; Debenham, J.R.; Cook, J.; Catley, M.J.; Moseley, G.L.; Butler, P.; Cheng, K.; Mallows, A.J.; et al. Implicit Motor Imagery of the Foot and Hand in People with Achilles Tendinopathy: A Left Right Judgement Study. Pain Med. 2021, 22, 2998–3007. [Google Scholar] [CrossRef]
- Prego-Domínguez, J.; Khazaeipour, Z.; Mallah, N.; Takkouche, B. Socioeconomic status and occurrence of chronic pain: A meta-analysis. Rheumatology 2021, 60, 1091–1105. [Google Scholar] [CrossRef]
- Hansen, J.; Hansen, H.; Nilsson, C.; Ekholm, O.; Molsted, S. Association between educational level and self-reported musculoskeletal pain and physical functioning in Danes 60–70 years old from 2010 to 2017: A longitudinal analysis of trends over time on data from the Danish Health and Morbidity Survey. BMJ Open 2023, 13, e073523. [Google Scholar] [CrossRef]
- Airaksinen, O.; Brox, J.I.; Cedraschi, C.; Hildebrandt, J.; Klaber-Moffett, J.; Kovacs, F.; Mannion, A.F.; Reis, S.; Staal, J.B.; Ursin, H.; et al. Chapter 4. European guidelines for the management of chronic nonspecific low back pain. Eur. Spine J. 2006, 15 (Suppl. 2), S192–S300. [Google Scholar] [CrossRef]


| CLBP | Pain-Free | CLBP vs. PF-Total | CLBP vs. PF-noLBP vs. PF-LBP | |||
|---|---|---|---|---|---|---|
| PF-Total | PF-noLBP | PF-LBP | ||||
| Mean (SD) | Mean (SD) | Mean (SD) | Mean (SD) | |||
| N | 150 | 150 | 107 | 43 | ||
| Sex (n F, %F) | 82 (55%) | 82 (55%) | 59 (55%) | 23 (53%) | 1.00 | 0.98 |
| Age (years) | 41.3 (12.5) | 41.2 (12.4) | 39.5 (11.9) | 45.5 (12.5) | 0.87 | 0.03 a |
| BMI (kg/m2) | 24.8 (3.4) | 23.6 (2.7) | 23.5 (2.8) | 23.9 (2.1) | 0.004 | 0.02 b |
| Education (n high, %high) | 85 (57%) | 100 (67%) | 74 (69%) | 26 (60%) | 0.08 | 0.12 |
| Onset current LBP (years) | 6.6 (8.8) | |||||
| Onset first LBP (years) | 12.0 (10.4) | |||||
| LBP location (n, %) | ||||||
| Right side | 19 (13%) | |||||
| Left side | 16 (11%) | |||||
| Central | 62 (41%) | |||||
| Bilateral | 53 (35%) | |||||
| LBP intensity 7 days (0–10) | 5.0 (1.7) | |||||
| LBP intensity current (0–10) | 4.1 (2.0) | |||||
| RMDQ (0–24) | 8.9 (4.7) | |||||
| TSK (17–68) | 36.4 (7.4) | |||||
| PCS (0–52) | 18.6 (9.6) | |||||
| CLBP (n = 150) | Pain-Free Persons | |||
|---|---|---|---|---|
| PF-Total (n = 150) | PF-noLBP (n = 107) | PF-LBP (n = 43) | ||
| Simple condition | −0.38 ** | −0.32 ** | −0.34 ** | −0.27 |
| Complex condition | −0.21 * | −0.13 | −0.20 * | 0.11 |
| CLBP (n = 150) | PF-Total (n = 150) | PF-noLBP (n = 107) | PF-LBP (n = 43) | |||||
|---|---|---|---|---|---|---|---|---|
| r | p | r | p | r | p | r | p | |
| Accuracy (%) | ||||||||
| Simple | −0.22 | 0.008 | −0.22 | 0.007 | −0.25 | 0.01 | −0.09 | 0.58 |
| Complex | −0.14 | 0.08 | −0.24 | 0.003 | −0.24 | 0.01 | 0.02 | 0.86 |
| Reaction Time (s) | ||||||||
| Simple | 0.19 | 0.02 | 0.06 | 0.50 | −0.24 | 0.01 | −0.09 | 0.55 |
| Complex | 0.09 | 0.27 | −0.04 | 0.66 | −0.03 | 0.72 | −0.09 | 0.55 |
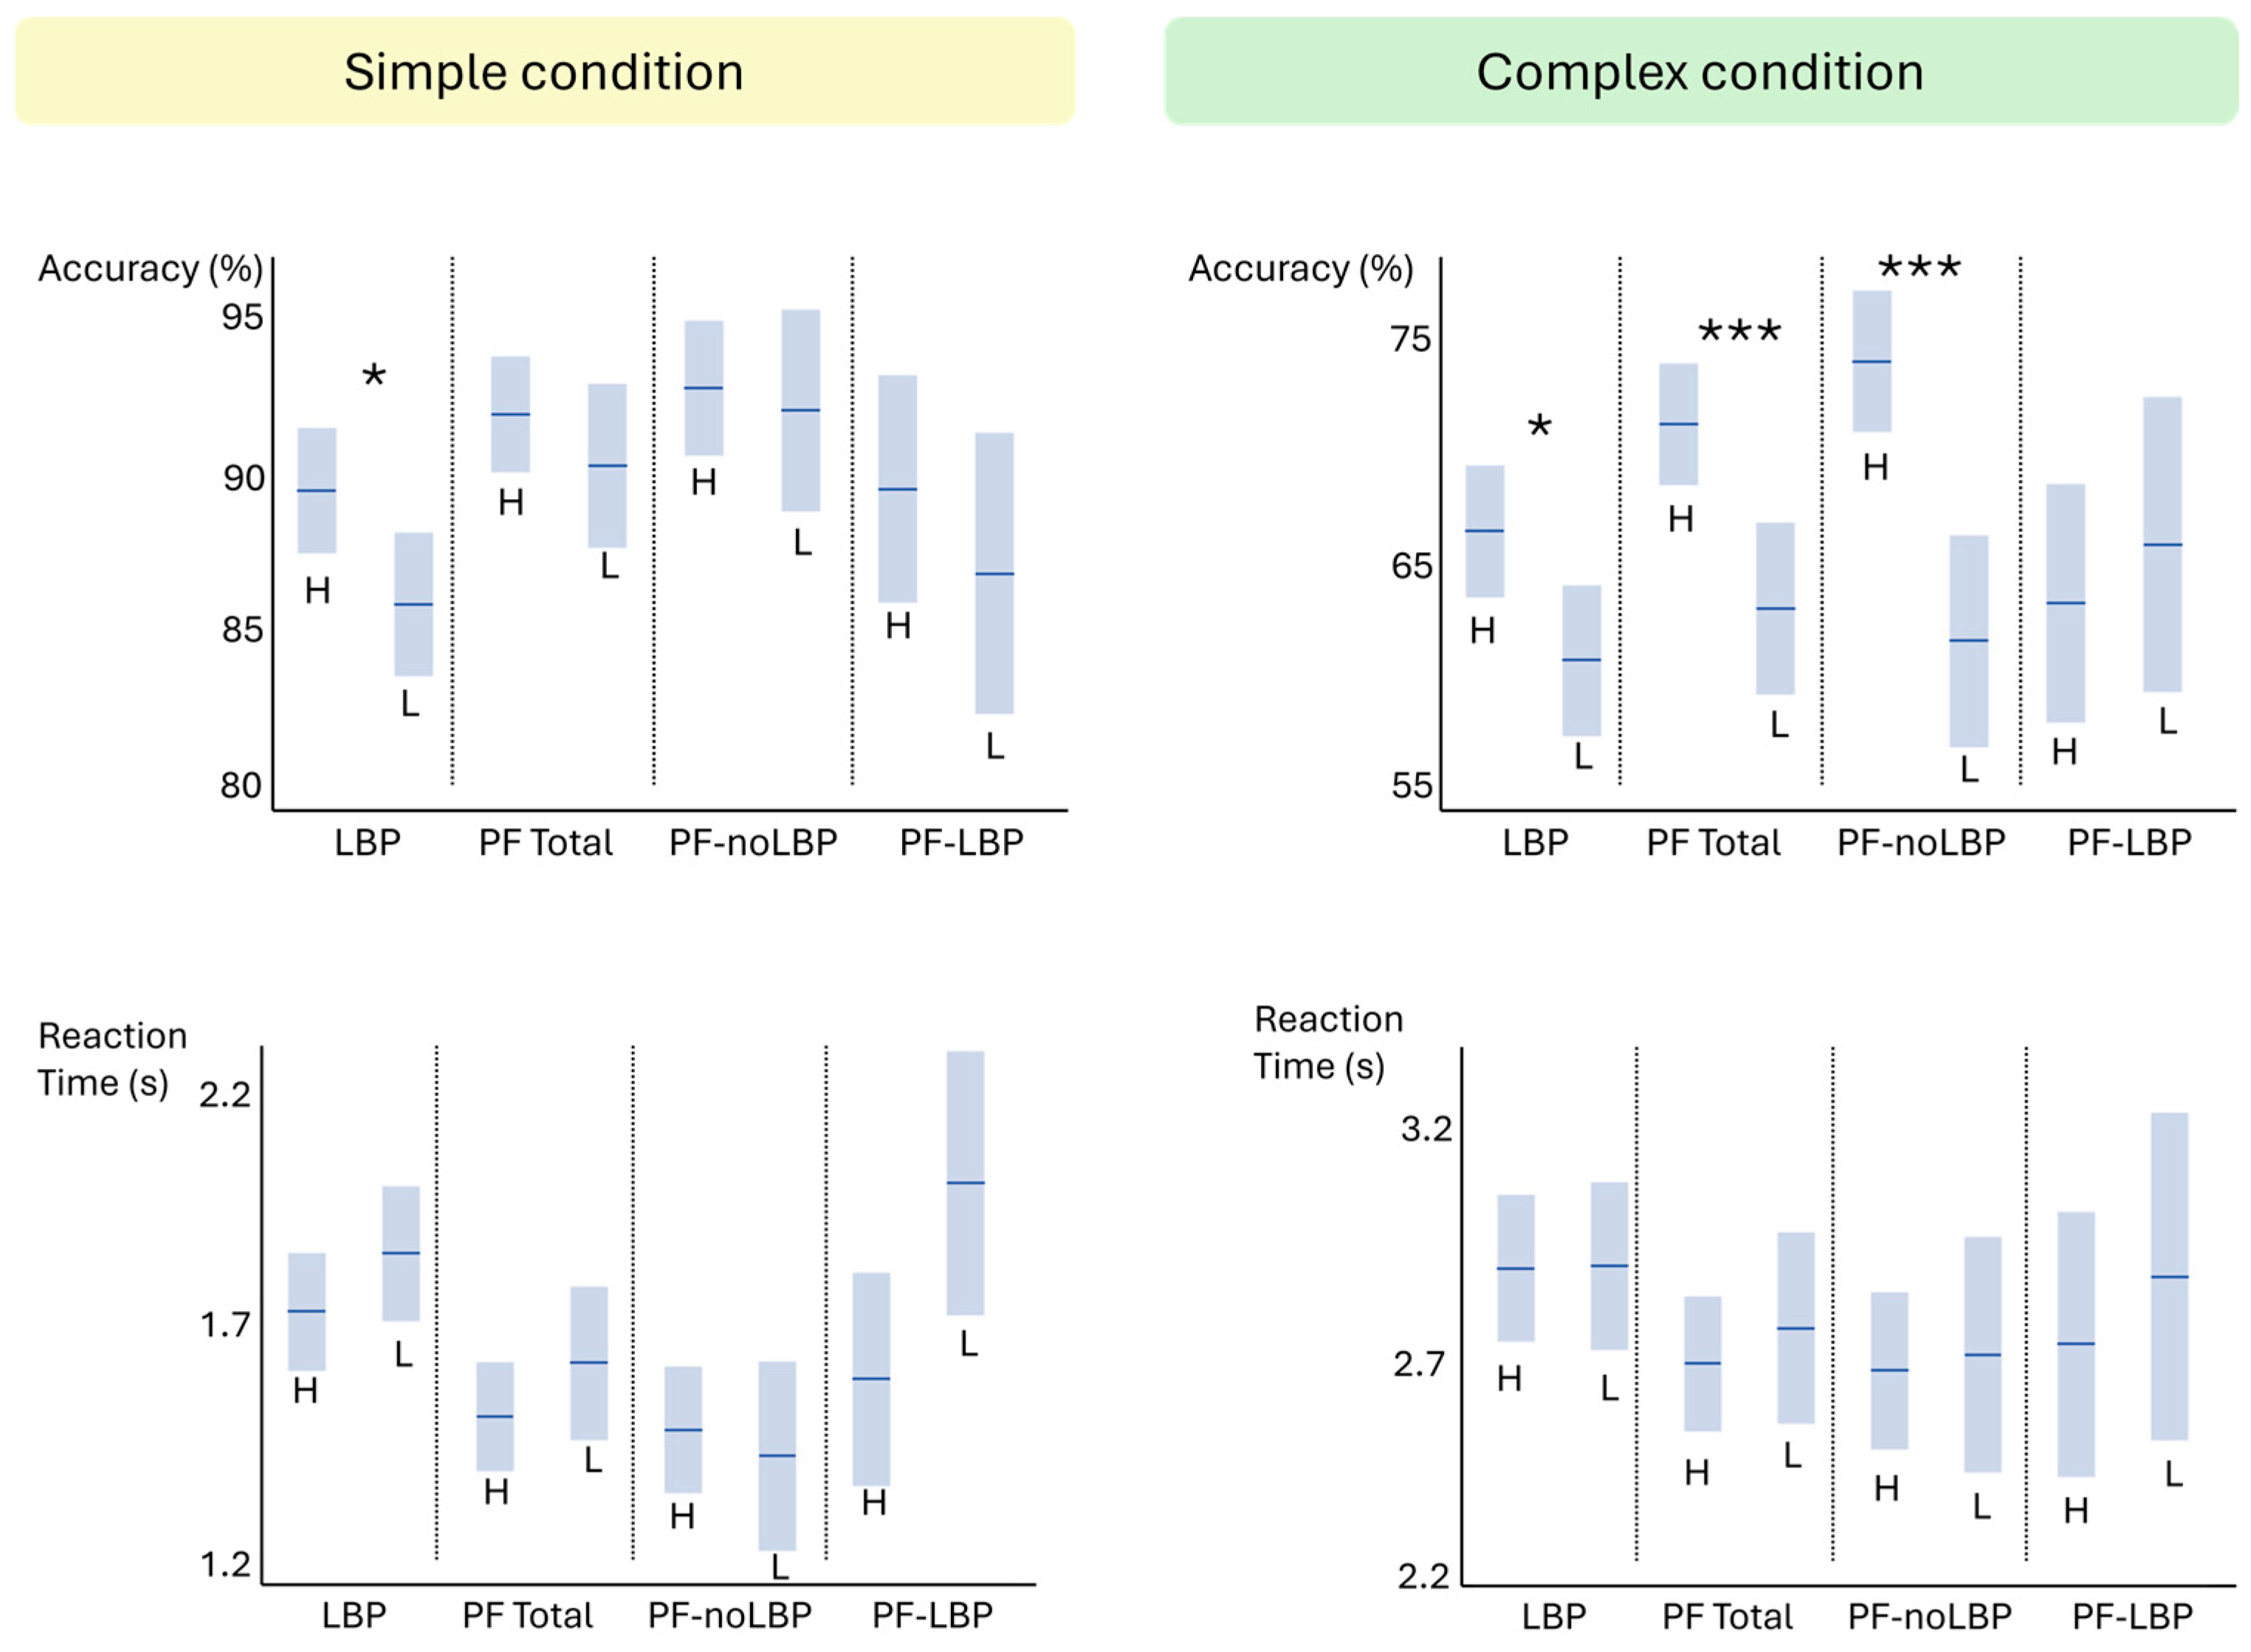
| High Educational Level | Low Educational Level | ES (d) | p | |||||
|---|---|---|---|---|---|---|---|---|
| N | M | SD | N | M | SD | |||
| Accuracy (%) | ||||||||
| Simple | ||||||||
| CLBP | 85 | 90.1 | 8.6 | 65 | 86.4 | 10.3 | 0.39 | 0.02 |
| PF-total | 98 | 92.4 | 6.6 | 50 | 91.8 | 6.9 | 0.09 | 0.61 |
| PF-noLBP | 74 | 92.1 | 6.4 | 33 | 92.8 | 6.0 | −0.11 | 0.60 |
| PF-LBP | 24 | 91.0 | 8.2 | 17 | 91.0 | 8.1 | 0 | 0.99 |
| Complex | ||||||||
| CLBP | 85 | 66.5 | 14.8 | 65 | 60.7 | 12.8 | 0.42 | 0.01 |
| PF-total | 100 | 71.2 | 13.9 | 50 | 63.1 | 13.6 | 0.59 | 0.0009 |
| PF-noLBP | 74 | 74.0 | 12.9 | 33 | 61.6 | 14.8 | 0.89 | <0.0001 |
| PF-LBP | 26 | 63.3 | 13.9 | 17 | 65.9 | 10.8 | −0.21 | 0.49 |
| Reaction time (s) | ||||||||
| Simple | ||||||||
| CLBP | 84 | 1.73 | 0.56 | 64 | 1.82 | 0.58 | 0.16 | 0.39 |
| PF-total | 100 | 1.52 | 0.54 | 49 | 1.59 | 0.60 | 0.12 | 0.47 |
| PF-noLBP | 74 | 1.49 | 0.54 | 33 | 1.43 | 0.45 | −0.12 | 0.58 |
| PF-LBP | 26 | 1.60 | 0.55 | 16 | 1.91 | 0.75 | 0.47 | 0.16 |
| Complex | ||||||||
| CLBP | 85 | 2.89 | 0.80 | 65 | 2.90 | 0.69 | 0.01 | 0.97 |
| PF-total | 100 | 2.69 | 0.74 | 50 | 2.77 | 0.67 | 0.11 | 0.53 |
| PF-noLBP | 74 | 2.68 | 0.64 | 33 | 2.71 | 0.64 | 0.05 | 0.81 |
| PF-LBP | 26 | 2.73 | 0.59 | 17 | 2.88 | 0.74 | 0.22 | 0.51 |
| CLBP (n = 150) | PF-Total (n = 150) | PF-noLBP (n = 107) | PF-LBP (n = 43) | Smallest p-Value | ||||||
|---|---|---|---|---|---|---|---|---|---|---|
| M (45%) | F (55%) | M (45%) | F (55%) | M (45%) | F (55%) | M (47%) | F (53%) | |||
| Accuracy (%) | ||||||||||
| Simple | 88.8 (8.3) | 87.8 (11.1) | 92.8 (5.7) | 91.6 (7.4) | 93.0 (5.6) | 92.3 (6.6) | 92.4 (6.2) | 89.7 (9.2) | 0.23 | |
| Complex | 66.3 (14.0) | 62.1 (14.2) | 68.0 (14.2) | 68.9 (14.6) | 68.9 (15.5) | 71.2 (14.0) | 65.9 (10.4) | 62.9 (14.5) | 0.11 | |
| Reaction time (s) | ||||||||||
| Simple | 1.78 (0.61) | 1.77 (0.54) | 1.48 (0.52) | 1.59 (0.59) | 1.42 (0.47) | 1.52 (0.54) | 1.62 (0.61) | 1.80 (0.68) | 0.30 | |
| Complex | 2.93 (0.81) | 2.87 (0.71) | 2.68 (0.70) | 2.75 (0.73) | 2.33 (0.73) | 2.71 (0.75) | 2.71 (0.63) | 2.85 (0.67) | 0.50 | |
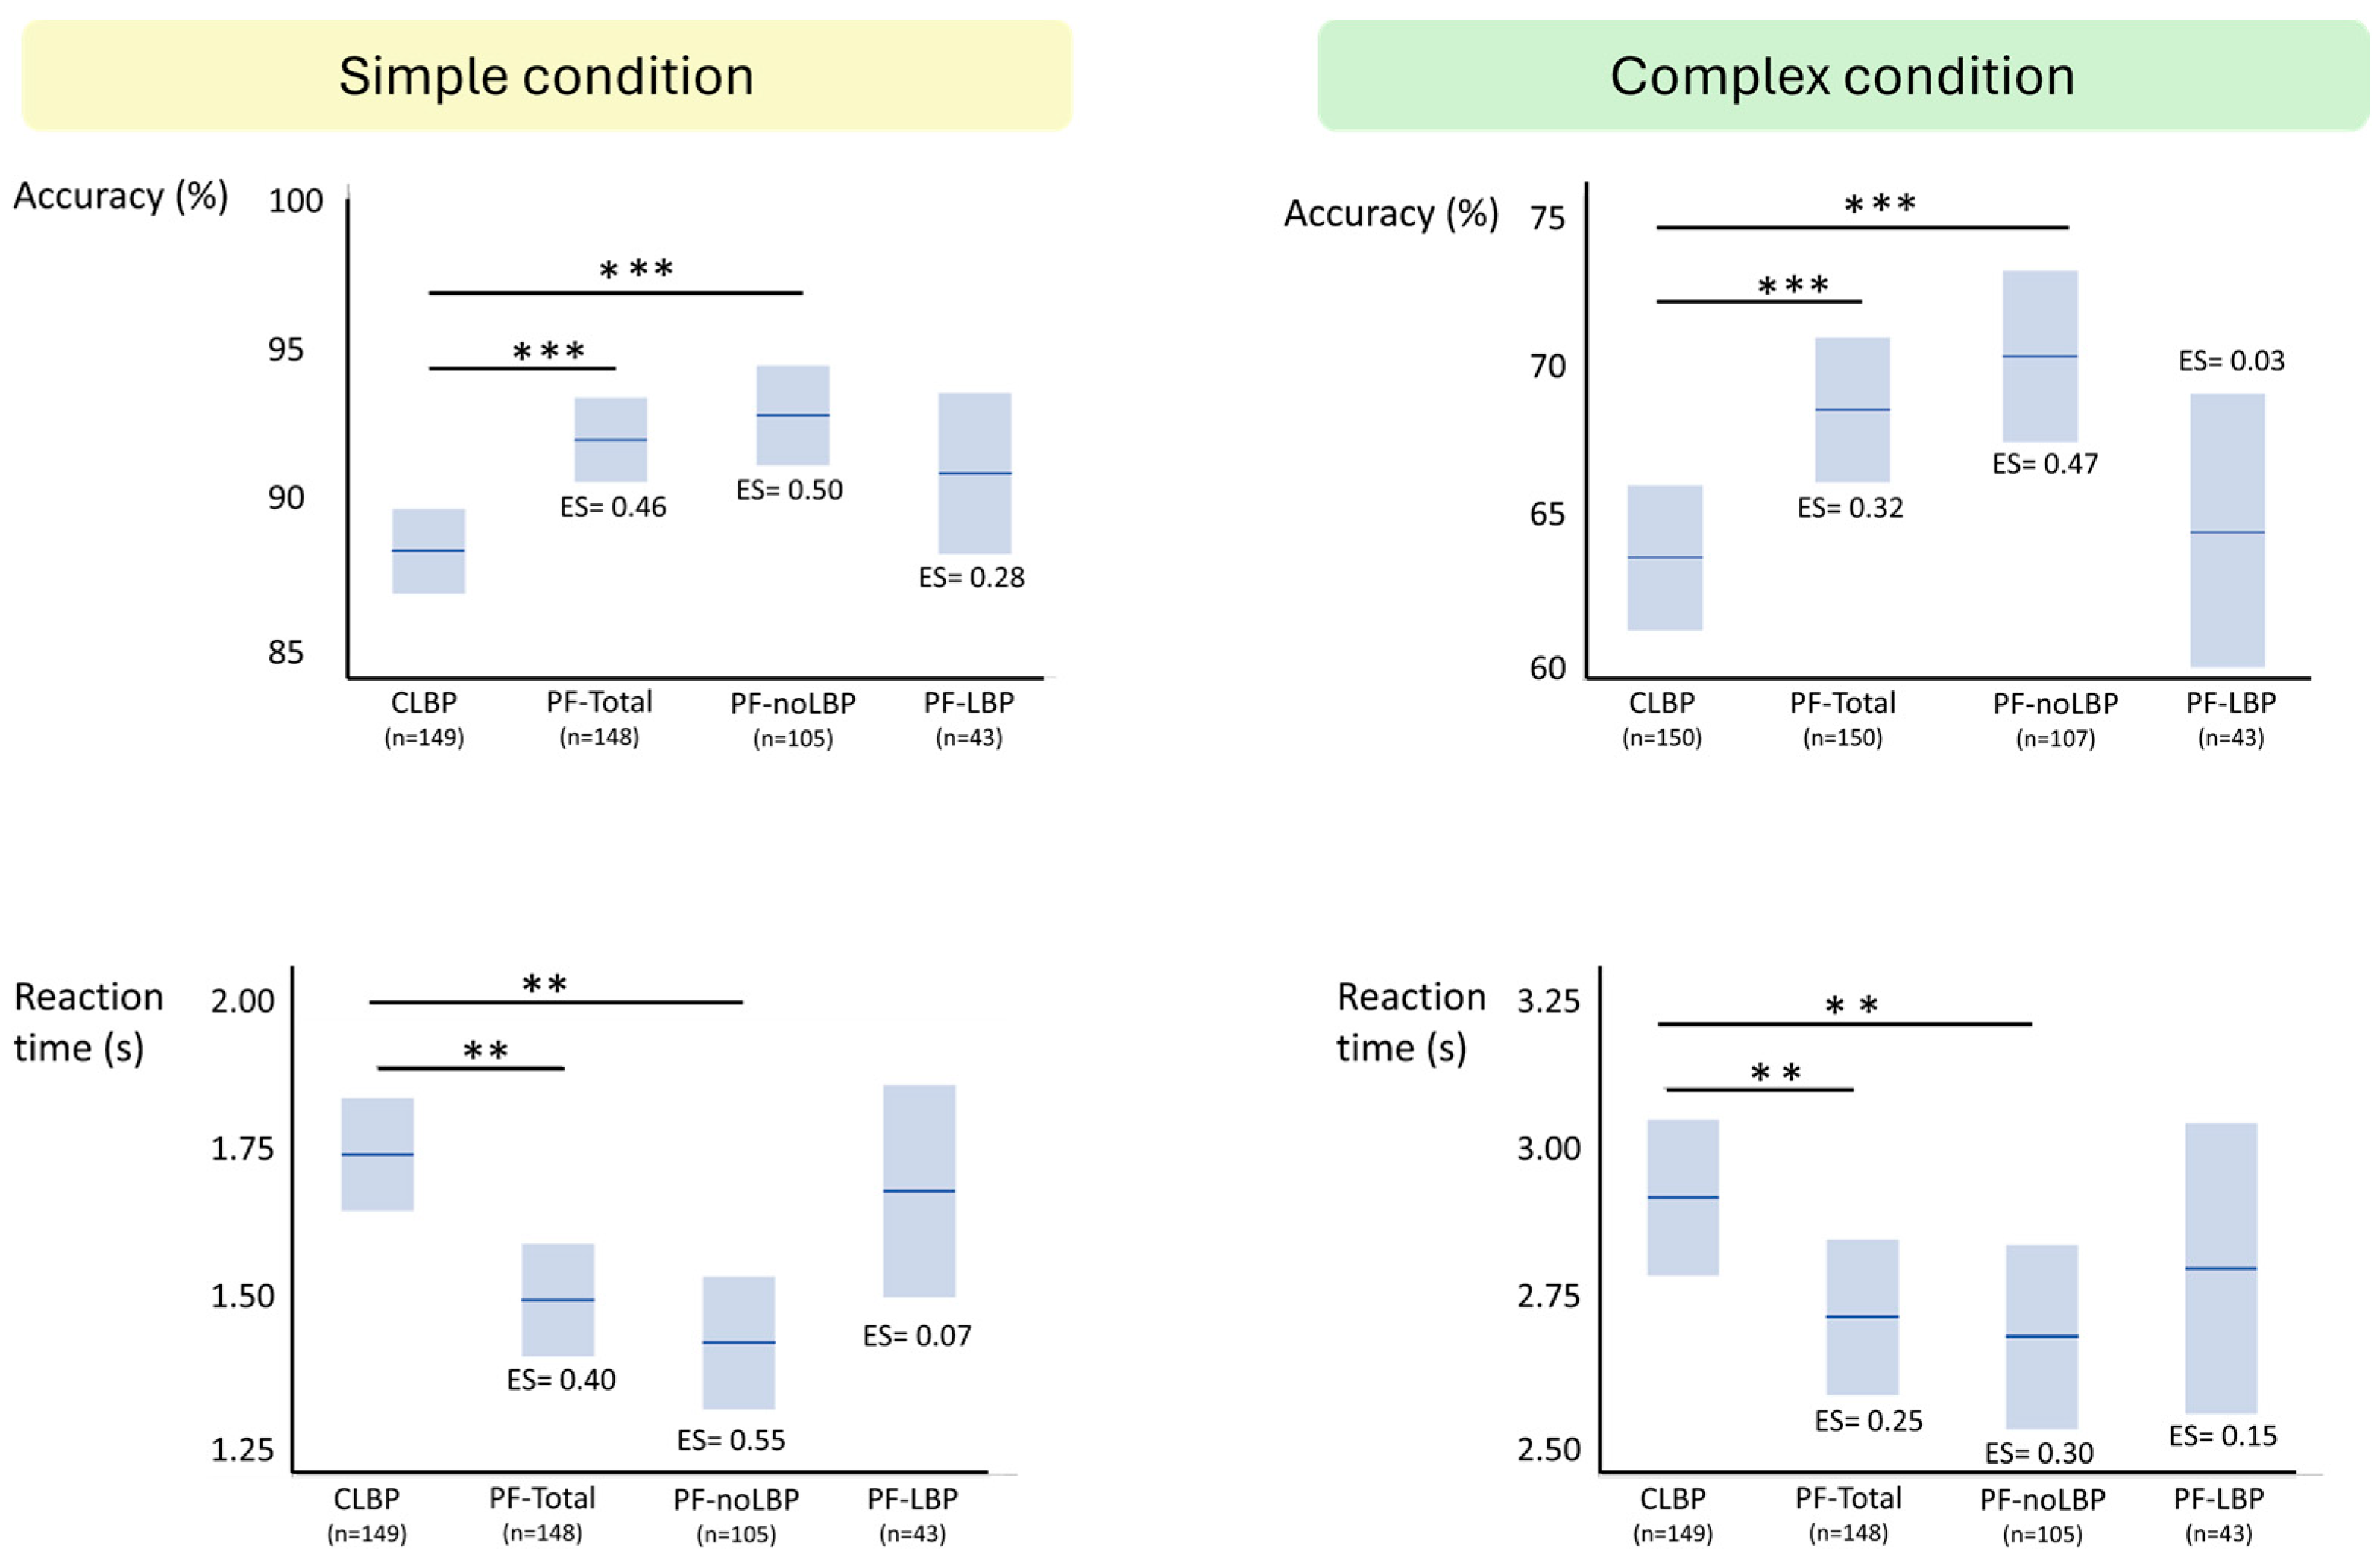
| CLBP (n = 150) | Pain-Free | ||||||||||
|---|---|---|---|---|---|---|---|---|---|---|---|
| PF-Total (n = 150) | PF-noLBP (n = 107) | PF-LBP (n = 43) | |||||||||
| M | SE | M | SE | ES | M | SE | ES | M | SE | ES | |
| Accuracy (%) | |||||||||||
| Simple | 88.0 | 0.9 | 91.3 | 0.9 | 0.46 *** | 91.5 | 1.1 | 0.50 *** | 90.9 | 1.8 | 0.28 |
| Complex | 63.5 | 0.9 | 67.9 | 0.9 | 0.32 *** | 69.1 | 1.1 | 0.47 *** | 64.7 | 1.8 | 0.03 |
| Reaction time (s) | |||||||||||
| Simple | 1.77 | 0.05 | 1.54 | 0.05 | 0.40 ** | 1.48 | 0.06 | 0.55 ** | 1.72 | 0.10 | 0.07 |
| Complex | 2.90 | 0.05 | 2.71 | 0.05 | 0.25 ** | 2.69 | 0.06 | 0.30 ** | 2.75 | 0.10 | 0.15 |
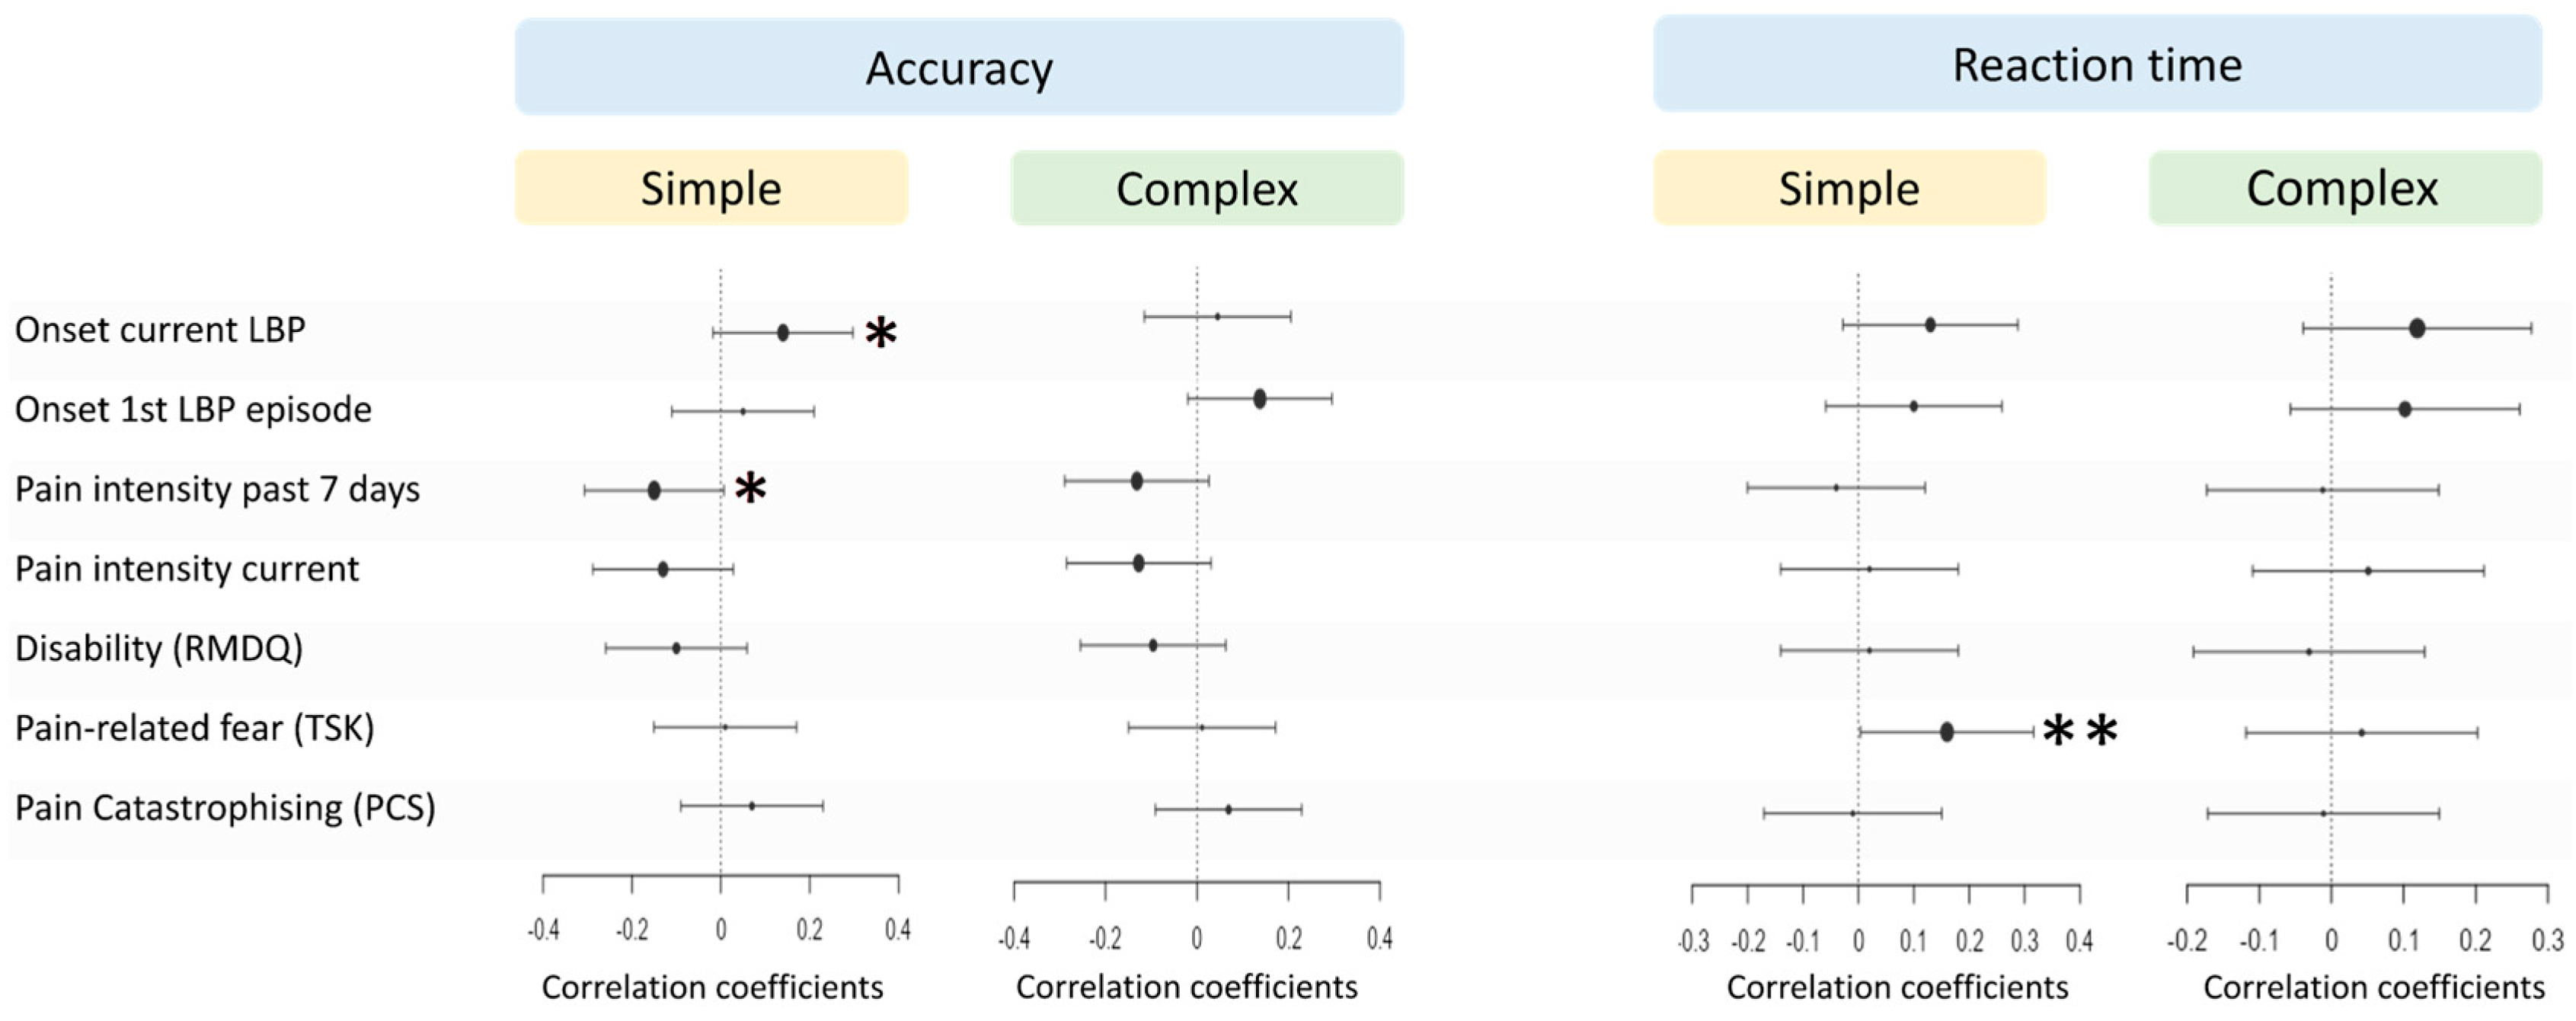
| NPRS 7D | NPRS Current | RMDQ | TSK | PCS | LBP Onset 1st Episode | LBP Onset Current Episode | |
|---|---|---|---|---|---|---|---|
| Accuracy | |||||||
| Simple | −0.15 * | −0.13 | −0.10 | 0.01 | 0.07 | 0.05 | 0.14 * |
| Complex | −0.12 | −0.12 | −0.11 | 0.01 | 0.06 | 0.13 | 0.05 |
| Reaction time | |||||||
| Simple | −0.04 | 0.02 | 0.02 | 0.16 ** | −0.003 | 0.10 | 0.13 |
| Complex | −0.03 | 0.04 | −0.01 | 0.04 | −0.01 | 0.11 | 0.11 |
| Fixed Effects | Estimate | SE | t Ratio | p | |
|---|---|---|---|---|---|
| Accuracy | Intercept | 86.03 | 3.66 | 23.53 | <0.0001 |
| Age | −0.14 | 0.07 | −2.10 | 0.04 | |
| Education (Low) | −2.14 | 0.82 | −2.62 | 0.009 | |
| Condition (Complex) | −12.29 | 0.56 | −21.77 | <0.0001 | |
| NPRS 7D | −0.90 | 0.49 | −1.85 | 0.07 | |
| NPRS 7D*Condition | −0.11 | 0.34 | −0.32 | 0.75 | |
| Onset current LBP | −0.001 | 0.10 | −0.02 | 0.99 | |
| Onset current LBP*Condition | 0.05 | 0.07 | 0.78 | 0.43 | |
| Reaction time | Intercept | 1.85 | 0.28 | 6.64 | <0.001 |
| Age | 0.006 | 0.004 | 1.60 | 0.11 | |
| Condition (Complex) | 0.56 | 0.02 | 22.75 | <0.001 | |
| TSK | 0.006 | 0.007 | 0.95 | 0.35 | |
| TSK*Condition | −0.004 | 0.003 | −1.22 | 0.23 |
Disclaimer/Publisher’s Note: The statements, opinions and data contained in all publications are solely those of the individual author(s) and contributor(s) and not of MDPI and/or the editor(s). MDPI and/or the editor(s) disclaim responsibility for any injury to people or property resulting from any ideas, methods, instructions or products referred to in the content. |
© 2025 by the authors. Licensee MDPI, Basel, Switzerland. This article is an open access article distributed under the terms and conditions of the Creative Commons Attribution (CC BY) license (https://creativecommons.org/licenses/by/4.0/).
Share and Cite
Matheve, T.; Janssens, L.; Timmermans, A.; Goossens, N.; Danneels, L.; Meirezonne, H.; Brandt, M.; De Baets, L. Trunk Laterality Judgement in Chronic Low Back Pain: Influence of Low Back Pain History, Task Complexity, and Clinical Correlates. J. Clin. Med. 2025, 14, 5328. https://doi.org/10.3390/jcm14155328
Matheve T, Janssens L, Timmermans A, Goossens N, Danneels L, Meirezonne H, Brandt M, De Baets L. Trunk Laterality Judgement in Chronic Low Back Pain: Influence of Low Back Pain History, Task Complexity, and Clinical Correlates. Journal of Clinical Medicine. 2025; 14(15):5328. https://doi.org/10.3390/jcm14155328
Chicago/Turabian StyleMatheve, Thomas, Lotte Janssens, Annick Timmermans, Nina Goossens, Lieven Danneels, Hannes Meirezonne, Michiel Brandt, and Liesbet De Baets. 2025. "Trunk Laterality Judgement in Chronic Low Back Pain: Influence of Low Back Pain History, Task Complexity, and Clinical Correlates" Journal of Clinical Medicine 14, no. 15: 5328. https://doi.org/10.3390/jcm14155328
APA StyleMatheve, T., Janssens, L., Timmermans, A., Goossens, N., Danneels, L., Meirezonne, H., Brandt, M., & De Baets, L. (2025). Trunk Laterality Judgement in Chronic Low Back Pain: Influence of Low Back Pain History, Task Complexity, and Clinical Correlates. Journal of Clinical Medicine, 14(15), 5328. https://doi.org/10.3390/jcm14155328