
Assessing Metabolic Syndrome Risk in Children and Adolescents with Prader–Willi Syndrome: A Comparison of Index Performance
 ,
,  ,
,  ,
,  , , , ,
  and
and
Abstract
1. Introduction
2. Materials and Methods
2.1. Study Population
2.2. Anthropometric Data
2.3. Blood Pressure Measurements and Instrumental Examination
2.4. Laboratory Analyses
2.5. Definitions
- BMI: weight (kg)/height in m2.
- BMI SDS [32]: [BMI-mean BMI (for age and gender)]/SD.
- TMI [16]: mass in kg/height in m3.
- BMFI [17]: BMI × FM (%) × WC (cm).
- FMI [15]: fat mass in kg/height in m2.
- FFMI [19]: fat-free mass in kg/height in m2.
- Body Shape Index (ABSI) [40]: WC/BMI2/3 × height1/2.
- VAI [20]: males: [WC/39.68 + (1.88 × BMI)] × (TG/1.03) × (1.31/HDL); females: [WC/36.58 + (1.89 × BMI)] × (TG/0.81) × (1.52/HDL).
- WtHR [18]: WC (cm)/height (cm).
- CMI [21]: WtHR × TG/HDL-C.
- TC/HDL-C ratio [41].
- TG/HDL-C ratio [22].
2.6. Statistical Analysis
3. Results
4. Discussion
Author Contributions
Funding
Institutional Review Board Statement
Informed Consent Statement
Data Availability Statement
Acknowledgments
Conflicts of Interest
Abbreviations
| ABSI | body shape index |
| AUC | area under the curve |
| AUROC | Area Under the Receiver Operating Characteristic Curve |
| BMI | Body Mass Index |
| BMFI | body mass fat index |
| BP | blood pressure |
| CI | confidence interval |
| CMI | cardiometabolic index |
| CVD | cardiovascular disease |
| del15 | paternal deletion of chromosome 15 |
| DXA | dual-energy X-ray absorptiometry |
| EC | Ethical Committee |
| FFM | fat-free mass |
| FFMI | fat-free mass index |
| FM | fat mass |
| FMI | fat mass index |
| FPG | fasting plasma glucose |
| HbA1c | hemoglobin A1c |
| HDL-C | high-density lipoprotein cholesterol |
| HOMA | homeostatic model assessment |
| IDEFICS | Identification and prevention of Dietary- and lifestyle-induced health EFfects In Children and infantS |
| IDF | International Diabetes Federation |
| IQR | interquartile range |
| IR | insulin resistance |
| MetS | metabolic syndrome |
| NLR | negative likelihood ratio |
| NPV | negative predictive value |
| PLR | positive likelihood ratio |
| PPV | positive predictive value |
| PWS | Prader–Willi syndrome |
| rhGH | recombinant human growth hormone |
| ROC | receiver operating characteristic |
| TC | total cholesterol |
| T2DM | type 2 diabetes mellitus |
| TG | triglyceride |
| TMI | tri-ponderal mass index |
| UPD15 | maternal uniparental disomy for chromosome 15 |
| VAI | visceral adiposity index |
| WC | waist circumference |
| WHO | World Health Organization |
| WtHR | waist-to-height ratio |
References
- Butler, M.G.; Hartin, S.N.; Hossain, W.A.; Manzardo, A.M.; Kimonis, V.; Dykens, E.; Gold, J.A.; Kim, S.J.; Weisensel, N.; Tamura, R.; et al. Molecular genetic classification in Prader-Willi syndrome: A multisite cohort study. J. Med. Genet. 2019, 56, 149–153. [Google Scholar] [CrossRef] [PubMed]
- Bar, C.; Diene, G.; Molinas, C.; Bieth, E.; Casper, C.; Tauber, M. Early diagnosis and care is achieved but should be improved in infants with Prader-Willi syndrome. Orphanet J. Rare Dis. 2017, 12, 118. [Google Scholar] [CrossRef] [PubMed]
- Cassidy, S.B.; Schwartz, S.; Miller, J.L.; Driscoll, D.J. Prader-Willi syndrome. Genet. Med. 2012, 14, 10–26. [Google Scholar] [CrossRef] [PubMed]
- Angulo, M.A.; Butler, M.G.; Cataletto, M.E. Prader-Willi syndrome: A review of clinical, genetic and endocrine finding. J. Endocrinol. Investig. 2015, 38, 1249–1263. [Google Scholar] [CrossRef]
- Tauber, M.; Hoybye, C. Endocrine disorders in Prader-Willi syndrome: A model to understand and treat hypothalamic dysfunction. Lancet Diabetes Endocrinol. 2021, 9, 235–246. [Google Scholar] [CrossRef]
- Bochukova, E.G.; Lawler, K.; Croizier, S.; Keogh, J.M.; Patel, N.; Strohbehn, G.; Lo, K.K.; Humphrey, J.; Hokken-Koelega, A.; Damen, L.; et al. A transcriptomic signature of the hypothalamic response to fasting and BDNF deficiency in Prader-Willi Syndrome. Cell Rep. 2018, 22, 3401–3408. [Google Scholar] [CrossRef]
- Giesecke, J.; Oskarsson, A.; Petersson, M.; Nordenvall, A.S.; Tettamanti, G.; Nordgren, A.; Höybye, C. Comorbidities, Endocrine Medications, and Mortality in Prader-Willi Syndrome-A Swedish Register Study. J. Clin. Med. 2025, 14, 1307. [Google Scholar] [CrossRef]
- Proffitt, J.; Osann, K.; McManus, B.; Kimonis, V.E.; Heinemann, J.; Butler, M.G.; Stevenson, D.A.; Gold, J.A. Contributing factors of mortality in Prader-Willi syndrome. Am. J. Med. Genet. A. 2019, 179, 196–205. [Google Scholar] [CrossRef]
- Bellis, S.A.; Kuhn, I.; Adams, S.; Mullarkey, L.; Holland, A. The consequences of hyperphagia in people with Prader-Willi Syndrome: A systematic review of studies of morbidity and mortality. Eur. J. Med. Genet. 2022, 65, 104379. [Google Scholar] [CrossRef]
- Fahed, G.; Aoun, L.; Bou Zerdan, M.; Allam, S.; Bou Zerdan, M.; Bouferraa, Y.; Assi, H.I. Metabolic Syndrome: Updates on Pathophysiology and Management in 2021. Int. J. Mol. Sci. 2022, 23, 786. [Google Scholar] [CrossRef]
- Theodoro, M.F.; Talebizadeh, Z.; Butler, M.G. Body composition and fatness patterns in Prader–Willi syndrome: Comparison with simple obesity. Obesity 2006, 14, 1685–1690. [Google Scholar] [CrossRef] [PubMed]
- Orsso, C.E.; Mackenzie, M.; Alberga, A.S.; Sharma, A.M.; Richer, L.; Rubin, D.A.; Prado, C.M.; Haqq, A.M. The use of magnetic resonance imaging to characterize abnormal body composition phenotypes in youth with Prader-Willi syndrome. Metabolism 2017, 69, 67–75. [Google Scholar] [CrossRef] [PubMed]
- Brambilla, P.; Crinò, A.; Bedogni, G.; Bosio, L.; Cappa, M.; Corrias, A.; Delvecchio, M.; Di Candia, S.; Gargantini, L.; Grechi, E.; et al. Metabolic syndrome in children with Prader-Willi syndrome: The effect of obesity. Nutr. Metab. Cardiovasc. Dis. 2011, 21, 269–276. [Google Scholar] [CrossRef] [PubMed]
- Grugni, G.; Crinò, A.; Bedogni, G.; Cappa, M.; Sartorio, A.; Corrias, A.; Di Candia, S.; Gargantini, L.; Iughetti, L.; Pagano, C.; et al. Metabolic syndrome in adult patients with Prader-Willi syndrome. Nutr. Metab. Cardiovasc. Dis. 2013, 23, 1134–1140. [Google Scholar] [CrossRef]
- Allison, D.B.; Zhu, S.K.; Plankey, M.; Faith, M.S.; Heo, M. Differential associations of body mass index and adiposity with all cause mortality among men in the first and second National Health and Nutrition Examination Surveys (NHANES I and NHANES II) follow-up studies. Int. J. Obes. Relat. Metab. Disord. 2002, 26, 410–416. [Google Scholar] [CrossRef]
- Peterson, C.M.; Su, H.; Thomas, D.M.; Heo, M.; Golnabi, A.H.; Pietrobelli, A.; Heymsfield, S.B. Tri-ponderal mass index vs body mass index in estimating body fat during adolescence. JAMA Pediatr. 2017, 171, 629–636. [Google Scholar] [CrossRef]
- Radetti, G.; Fanolla, A.; Grugni, G.; Lupi, F.; Sartorio, A. Indexes of adiposity and body composition in the prediction of metabolic syndrome in obese children and adolescents: Which is the best? Nutr. Metab. Cardiovasc. Dis. 2019, 29, 1189–1196. [Google Scholar] [CrossRef]
- Maffeis, C.; Banzato, C.; Talamini, G.; Obesity Study Group of the Italian Society of Pediatric Endocrinology and Diabetology. Waist-to-height ratio, a useful index to identify high metabolic risk in overweight children. J. Pediatr. 2008, 152, 207–213. [Google Scholar] [CrossRef]
- VanItallie, T.B.; Yang, M.U.; Heymsfield, S.B.; Funk, R.C.; Boileau, R.A. Height-normalized indices of the body’s fat-free mass and fat mass: Potentially useful indicators of nutritional status. Am. J. Clin. Nutr. 1990, 52, 953–959. [Google Scholar] [CrossRef]
- Amato, M.C.; Giordano, C.; Galia, M.; Criscimanna, A.; Vitabile, S.; Midiri, M.; Galluzzo, A.; AlkaMeSy Study Group. Visceral Adiposity Index: A reliable indicator of visceral fat function associated with cardiometabolic risk. Diabetes Care 2010, 33, 920–922. [Google Scholar] [CrossRef]
- Wakabayashi, I.; Daimon, T. The “cardiometabolic index” as a new marker determined by adiposity and blood lipids for discrimination of diabetes mellitus. Clin. Chim. Acta 2015, 438, 274–278. [Google Scholar] [CrossRef] [PubMed]
- Aslan Çin, N.N.; Yardımcı, H.; Koç, N.; Uçaktürk, S.A.; Akçil Ok, M. Triglycerides/high-density lipoprotein cholesterol is a predictor similar to the triglyceride-glucose index for the diagnosis of metabolic syndrome using International Diabetes Federation criteria of insulin resistance in obese adolescents: A cross-sectional study. J. Pediatr. Endocrinol. Metab. 2020, 33, 777–784. [Google Scholar] [CrossRef] [PubMed]
- Radetti, G.; Grugni, G.; Lupi, F.; Fanolla, A.; Caroli, D.; Bondesan, A.; Sartorio, A. High Tg/HDL-Cholesterol Ratio Highlights a Higher Risk of Metabolic Syndrome in Children and Adolescents with Severe Obesity. J. Clin. Med. 2022, 11, 4488. [Google Scholar] [CrossRef] [PubMed]
- Radetti, G.; Fanolla, A.; Lupi, F.; Sartorio, A.; Grugni, G. Accuracy of Different Indexes of Body Composition and Adiposity in Identifying Metabolic Syndrome in Adult Subjects with Prader-Willi Syndrome. J. Clin. Med. 2020, 9, 1646. [Google Scholar] [CrossRef]
- Rubin, D.A.; Nowak, J.; McLaren, E.; Patiño, M.; Castner, D.M.; Dumont-Driscoll, M.C. Nutritional intakes in children with Prader-Willi syndrome and non-congenital obesity. Food Nutr. Res. 2015, 59, 29427. [Google Scholar] [CrossRef]
- Percorso Diagnostico Terapeutico Assistenziale per la Sindrome di Prader-Willi. Available online: https://www.siedp.it/pagina/852/pdta+sindrome+di+prader-willi (accessed on 12 June 2025).
- Tanner, J.M.; Whitehouse, R.H. Clinical longitudinal standards for height, weight, height velocity, weight velocity and stages of puberty. Arch. Dis. Child. 1976, 51, 170–179. [Google Scholar] [CrossRef]
- Lohman, T.G.; Roche, A.F.; Martorell, R. Anthropometric Standardization Reference Manual; Human Kinetics Books: Champaign, IL, USA, 1988; pp. 39–54. [Google Scholar]
- Expert Panel on Integrated Guidelines for Cardiovascular Health and Risk Reduction in Children and Adolescents; National Heart, Lung, and Blood Institute. Expert panel on integrated guidelines for cardiovascular health and risk reduction in children and adolescents: Summary report. Pediatrics 2011, 128 (Suppl. 5), S213–S256. [CrossRef]
- Faienza, M.F.; Brunetti, G.; Fintini, D.; Grugni, G.; Wasniewska, M.G.; Crinò, A.; D’Amato, G.; Piacente, L.; Oranger, A.; Dicarlo, M.; et al. High levels of LIGHT/TNFSF14 in patients with Prader-Willi syndrome. J. Endocrinol. Investig. 2023, 46, 1901–1909. [Google Scholar] [CrossRef]
- Matthews, D.R.; Hosker, J.P.; Rudenski, A.S.; Naylor, B.A.; Treacher, D.F.; Turner, R.C. Homeostasis model assessment: Insulin resistance and b-cell function from fasting plasma glucose and insulin concentrations in man. Diabetologia 1985, 28, 412–419. [Google Scholar] [CrossRef]
- The WHO Child Growth Standards. Available online: https://www.who.int/tools/child-growth-standards/standards (accessed on 22 April 2025).
- Ahrens, W.; Moreno, L.A.; Mårild, S.; Molnár, D.; Siani, A.; De Henauw, S.; Böhmann, J.; Günther, K.; Hadjigeorgiou, C.; Iacoviello, L.; et al. Metabolic syndrome in young children: Definitions and results of the IDEFICS study. Int. J. Obes. 2014, 38 (Suppl. 2), S4–S14. [Google Scholar] [CrossRef]
- Nagy, P.; Kovacs, E.; Moreno, L.A.; Veidebaum, T.; Tornaritis, M.; Kourides, Y.; Siani, A.; Lauria, F.; Sioen, I.; Claessens, M.; et al. Percentile reference values for anthropometric body composition indices in European children from the IDEFICS study. Int. J. Obes. 2014, 38 (Suppl. 2), S15–S25. [Google Scholar] [CrossRef]
- Barba, G.; Buck, C.; Bammann, K.; Hadjigeorgiou, C.; Hebestreit, A.; Mårild, S.; Molnár, D.; Russo, P.; Veidebaum, T.; Vyncke, K.; et al. Blood pressure reference values for European non-overweight school children: The IDEFICS study. Int. J. Obes. 2014, 38 (Suppl. 2), S48–S56. [Google Scholar] [CrossRef] [PubMed]
- De Henauw, S.; Michels, N.; Vyncke, K.; Hebestreit, A.; Russo, P.; Intemann, T.; Peplies, J.; Fraterman, A.; Eiben, G.; de Lorgeril, M.; et al. Blood lipids among young children in Europe: Results from the European IDEFICS study. Int. J. Obes. 2014, 38 (Suppl. 2), S67–S75. [Google Scholar] [CrossRef] [PubMed]
- Peplies, J.; Jiménez-Pavón, D.; Savva, S.C.; Buck, C.; Günther, K.; Fraterman, A.; Russo, P.; Iacoviello, L.; Veidebaum, T.; Tornaritis, M.; et al. Percentiles of fasting serum insulin, glucose, HbA1c and HOMA-IR in pre-pubertal normal weight European children from the IDEFICS cohort. Int. J. Obes. 2014, 38 (Suppl. 2), S39–S47. [Google Scholar] [CrossRef]
- Zimmet, P.; Alberti, K.G.; Kaufman, F.; Tajima, N.; Silink, M.; Arslanian, S.; Wong, G.; Bennett, P.; Shaw, J.; Caprio, S.; et al. The metabolic syndrome in children and adolescents—An IDF consensus report. Pediatr. Diabetes 2007, 8, 299–306. [Google Scholar] [CrossRef]
- McCharty, H.D.; Jarret, K.V.; Crawley, H.F. The development of waist circumference percentiles in British children aged 5.0-16.9 y. Eur.J. Clin. Nutr. 2001, 55, 902–907. [Google Scholar] [CrossRef]
- Mameli, C.; Krakauer, N.Y.; Krakauer, J.C.; Bosetti, A.; Ferrari, C.M.; Moiana, N.; Schneider, L.; Borsani, B.; Genoni, T.; Zuccotti, G. The association between a body shape index and cardiovascular risk in overweight and obese children and adolescents. PLoS ONE 2018, 13, e0190426. [Google Scholar] [CrossRef]
- Chu, S.Y.; Jung, J.H.; Park, M.J.; Kim, S.H. Risk assessment of metabolic syndrome in adolescents using the triglyceride/high-density lipoprotein cholesterol ratio and the total cholesterol/high-density lipoprotein cholesterol ratio. Ann. Pediatr. Endocrinol. Metab. 2019, 24, 41–48. [Google Scholar] [CrossRef]
- Katzmarzyk, P.T.; Srinivasan, S.R.; Chen, W.; Malina, R.M.; Bouchard, C.; Berenson, G.S. Body mass index, waist circumference, and clustering of cardiovascular disease risk factors in a biracial sample of children and adolescents. Pediatrics 2004, 114, e198–e205. [Google Scholar] [CrossRef]
- Youden, W.J. Index for rating diagnostic tests. Cancer 1950, 3, 32–35. [Google Scholar] [CrossRef]
- Ivanes, F.; Isorni, M.A.; Halimi, J.M.; Fauchier, L.; Saint Etienne, C.; Babuty, D.; Angoulvant, D.; Brunet-Bernard, A. Predictive factors of contrast-induced nephropathy in patients undergoing primary coronary angioplasty. Arch. Cardiovasc. Dis. 2014, 107, 424–432. [Google Scholar] [CrossRef]
- Whittington, J.E.; Holland, A.J.; Webb, T.; Butler, J.; Clarke, D.; Boer, H. Population prevalence and estimated birth incidence and mortality rate for people with Prader-Willi syndrome in one UK health region. J. Med. Genet. 2001, 38, 792–798. [Google Scholar] [CrossRef] [PubMed]
- Manzardo, A.M.; Loker, J.; Heinemann, J.; Loker, C.; Butler, M.G. Survival trends from the Prader-Willi Syndrome Association (USA) 40-year mortality survey. Genet. Med. 2018, 20, 24–30. [Google Scholar] [CrossRef] [PubMed]
- Nur Zati Iwani, A.K.; Jalaludin, M.Y.; Yahya, A.; Mansor, F.; Md Zain, F.; Hong, J.Y.H.; Wan Mohd Zin, R.M.; Mokhtar, A. TG: HDL-C Ratio as Insulin Resistance Marker for Metabolic Syndrome in Children With Obesity. Front. Endocrinol. 2022, 13, 852290. [Google Scholar] [CrossRef] [PubMed]
- Zhou, F.; Sun, X.; Liu, J.; Li, L.; Li, L.; Li, P. Triglyceride to high-density lipoprotein cholesterol ratio in adolescence as a predictive marker of metabolic syndrome and obesity in early adulthood in China. Endocrine 2022, 76, 331–340. [Google Scholar] [CrossRef]
- Di Bonito, P.; Moio, N.; Scilla, C.; Cavuto, L.; Sibilio, G.; Sanguigno, E.; Forziato, C.; Saitta, F.; Iardino, M.R.; Di Carluccio, C.; et al. Usefulness of the high triglyceride-to-HDL cholesterol ratio to identify cardiometabolic risk factors and preclinical signs of organ damage in outpatient children. Diabetes Care 2012, 35, 158–162. [Google Scholar] [CrossRef]
- Marcus, M.D.; Baranowski, T.; DeBar, L.L.; Edelstein, S.; Kaufman, F.R.; Schneider, M.; Siega-Riz, A.M.; Staten, M.A.; Virus, A.; Yin, Z. Severe obesity and selected risk factors in a sixth grade multiracial cohort: The HEALTHY study. J. Adolesc. Health 2010, 47, 604–607. [Google Scholar] [CrossRef]
- Seo, J.Y.; Kim, J.H. Validation of surrogate markers for metabolic syndrome and cardiometabolic risk factor clustering in children and adolescents: A nationwide popula-tion-based study. PLoS ONE 2017, 12, e0186050. [Google Scholar] [CrossRef]
- Di Bonito, P.; Mozzillo, E.; Rosanio, F.M.; Maltoni, G.; Piona, C.A.; Franceschi, R.; Ripoli, C.; Ricciardi, M.R.; Tornese, G.; Arnaldi, C.; et al. Albuminuric and non-albuminuric reduced eGFR phenotypes in youth with type 1 diabetes: Factors associated with cardiometabolic risk. Nutr. Metab. Cardiovasc. Dis. 2021, 31, 2033–2041. [Google Scholar] [CrossRef]
- Faienza, M.F.; Ventura, A.; Lauciello, R.; Crinò, A.; Ragusa, L.; Cavallo, L.; Spera, S.; Grugni, G. Analysis of endothelial protein C receptor gene and metabolic profile in Prader-Willi syndrome and obese subjects. Obesity 2012, 20, 1866–1870. [Google Scholar] [CrossRef]


| Age | Criteria | WC | SBP or DBP | Lipids | Glucose Metabolism | Diagnosis of MetS | |
|---|---|---|---|---|---|---|---|
| 7– < 10 years | IDEFICS [33] | >90th percentile | >90th percentile | TG > 90th percentile or HDL-C < 10th percentile | HOMA-IR > 90th percentile or fasting blood glucose > 90th percentile | At least three factors | |
| 10– < 16 years | IDF [38] | >90th percentile | SBP > 130 mmHg or DBP > 85 mmHg | TG > 150 mg/dL (1.7 mmol/L) | HDL-C < 40 mg/dL (1.03 mmol/L) | FPG > 100 mg/dL (5.6 mmol/L) or previously diagnosed IGT/T2DM | Abdominal obesity plus two or more of the other factors |
| 16+ years | IDF [38] | >94 cm for males and >80 cm for females | SBP > 130 mmHg or DBP > 85 mmHg, or specific treatment | TG > 150 mg/dL (1.7 mmol/L) or specific treatment | HDL-C < 40 mg/dL for males and <50 mg/dL (1.29 mmol/L) for females, or specific treatment | FPG > 100 mg/dL (5.6 mmol/L) or previously diagnosed IGT/T2DM | Abdominal obesity plus two or more of the other factors |
| Variable | Total (n = 124) | Females (n = 61) | Males (n = 63) | p |
|---|---|---|---|---|
| Age (yr) | 13.3 (6.9–18.9) | 13.2 (7.0–18.9) | 14.0 (6.9–18.8) | 0.6331 $ |
| Weight (kg) | 60.1 (19.0–121.7) | 57.8 (19.0–121.7) | 68.0 (23.0–120.6) | 0.0921 $ |
| Height (cm) | 149.3 (108.0–174.7) | 144.0 (108.0–173.1) | 153.2 (110.1–174.7) | 0.0058 $ * |
| WC (cm) | 86.5 (54.0–131.0) | 83.0 (54.0–125.0) | 93.0 (56.0–131.0) | 0.0980 $ |
| BMI (kg/m2) | 26.4 (14.2–54.3) | 26.2 (15.7–54.3) | 28.1 (14.2–45.4) | 0.5876 $ |
| BMI SDS | 2.1 (−2.0–5.7) | 1.8 (−1.3–5.0) | 2.5 (−2.0–5.7) | 0.1351 $ |
| Obese n (%) | 70 (56.4%) | 29 (47.5%) | 41 (65.1%) | 0.07377 & |
| Glycemia (mg/dL) | 80.0 (60.0–167.0) | 78.0 (60.0–167.0) | 83.0 (63.0–163.0) | 0.0128 $ * |
| Insulin (µU/mL) | 11.4 (0.5–49.4) | 9.8 (0.5–49.4) | 12.2 (2.7–46.5) | 0.1990 $ |
| HOMA | 2.3 (0.1–10.2) | 1.9 (0.1–9.6) | 2.7 (0.4–10.2) | 0.1207 $ |
| HbA1c | 5.4 (4.3–9.9) | 5.3 (4.6–9.9) | 5.4 (4.3–8.2) | 0.3014 $ |
| Total cholesterol (mg/dL) | 166.5 (106.0–256.0) | 163.0 (106.0–243.0) | 171.0 (113.0–256.0) | 0.7003 $ |
| HDL-C (mg/dL) | 52.0 (32.0–107.0) | 54.0 (32.0–107.0) | 49.0 (36.0–96.0) | 0.0687 $ |
| Triglycerides (mg/dL) | 77.0 (30.0–266.0) | 74.0 (35.0–218.0) | 84.0 (30.0–266.0) | 0.2114 $ |
| SBP (mm/Hg) | 111.0 (80.0–141.0) | 110.0 (80.0–138.0) | 116.0 (89.0–141.0) | 0.1081 $ |
| DBP (mm/Hg) | 70.0 (40.0–92.0) | 69.0 (40.0–92.0) | 70.0 (50.0–89.0) | 0.3021 $ |
| FFM (kg) | 31.4 (11.4–65.8) | 28.2 (11.4–50.8) | 35.4 (14.2–65.8) | 0.0039 $ * |
| FFM (%) | 53.6 (35.4–87.3) | 51.5 (35.4–69.8) | 54.9 (40.6–87.3) | 0.0458 $ * |
| FM (kg) | 27.1 (2.3–71.2) | 24.4 (7.0–71.2) | 28.3 (2.3–62.1) | 0.3763 $ |
| FM (%) | 46.5 (12.7–64.6) | 48.5 (30.2–64.6) | 45.1 (12.7–59.4) | 0.0458 $ * |
| TMI | 88.0 (20.9–200.8) | 80.6 (20.9–200.8) | 96.7 (25.3–196.6) | 0.0437 $ * |
| BMFI | 10.7 (1.7–34.7) | 10.4 (2.7–34.7) | 10.9 (1.7–28.4) | 0.8592 $ |
| FMI | 11.9 (1.9–40.5) | 12.1 (4.2–40.5) | 11.6 (1.9–23.4) | 0.9502 $ |
| FFMI | 31.4 (11.4–65.8) | 28.2 (11.4–50.8) | 35.4 (14.2–65.8) | 0.0039 $ * |
| ABSI | 0.1 (0.1–0.1) | 0.1 (0.1–0.1) | 0.1 (0.1–0.1) | 0.0443 $ * |
| VAI | 1.0 (0.3–4.2) | 1.1 (0.4–4.2) | 0.9 (0.3–4.1) | 0.1006 $ |
| WtHR | 0.6 (0.4–0.9) | 0.6 (0.4–0.9) | 0.6 (0.4–0.9) | 0.4732 $ |
| CMI | 0.9 (0.3–5.7) | 0.8 (0.3–3.1) | 1.0 (0.3–5.7) | 0.1006 $ |
| TC/HDL-C | 3.2 (1.5–7.1) | 3.0 (1.5–5.6) | 3.4 (1.7–7.1) | 0.0236 $ * |
| TG/HDL-C | 1.5 (0.5–7.0) | 1.5 (0.5–5.2) | 1.7 (0.5–7.0) | 0.0748 $ |
| MetS % | 19.4 | 14.8 | 23.8 | 0.2020 & |
| Variable | Total (n = 124) | MetS (n = 24) | No MetS (n = 100) | p |
|---|---|---|---|---|
| Age (yr) | 13.3 (6.9–18.9) | 12.0 (7.0–18.2) | 14.0 (6.9–18.9) | 0.1799 $ |
| Weight (kg) | 60.1 (19.0–121.7) | 69.4 (27.8–121.7) | 58.5 (19.0–116.0) | 0.0417 $ * |
| Height (cm) | 149.3 (108.0–174.7) | 144.1 (122.4–166.5) | 150.4 (108.0–174.7) | 0.4846 $ |
| WC (cm) | 86.5 (54.0–131.0) | 104.5 (61.5–131.0) | 83.5 (54.0–117.0) | 0.0010 $ * |
| BMI (kg/m2) | 26.4 (14.2–54.3) | 36.2 (17.3–54.3) | 25.6 (14.2–49.7) | 0.0021 $ * |
| BMI SDS | 2.1 (−2.0–5.7) | 3.5 (0.9–5.7) | 1.9 (−2.0–4.7) | <0.0001 $ * |
| Obese n (%) | 70 (56.4%) | 19 (79.2%) | 51 (51.0%) | 0.02321 & |
| Glycemia (mg/dL) | 80.0 (60.0–167.0) | 86.0 (72.0–167.0) | 79.5 (60.0–99.0) | 0.0014 $ * |
| Insulin (µU/mL) | 11.4 (0.5–49.4) | 17.8 (2.7–46.5) | 9.8 (0.5–49.4) | 0.0005 $ * |
| HOMA | 2.3 (0.1–10.2) | 3.6 (0.6–10.2) | 1.9 (0.1–9.6) | 0.0001 $ * |
| HbA1c | 5.4 (4.3–9.9) | 5.5 (4.7–9.9) | 5.3 (4.3–9.4) | 0.0566 $ |
| Total cholesterol (mg/dL) | 166.5 (106.0–256.0) | 172.5 (115.0–235.0) | 165.5 (106.0–256.0) | 0.9975 $ |
| HDL-C (mg/dL) | 52.0 (32.0–107.0) | 39.0 (32.0–72.0) | 54.0 (36.0–107.0) | <0.0001 $ * |
| Triglycerides (mg/dL) | 77.0 (30.0–266.0) | 133.0 (67.0- 266.0) | 72.0 (30.0–202.0) | <0.0001 $ * |
| SBP (mm/Hg) | 111.0 (80.0–141.0) | 114.5 (96.0–141.0) | 111.0 (80.0–140.0) | 0.3185 $ |
| DBP (mm/Hg) | 70.0 (40.0–92.0) | 75.0 (52.0–92.0) | 69.0 (40.0–91.0) | 0.0156 $ * |
| FFM (kg) | 31.4 (11.4–65.8) | 33.6 (17.1–56.2) | 30.9 (11.4–65.8) | 0.0962 $ |
| FFM (%) | 53.6 (35.4–87.3) | 49.9 (35.4–69.5) | 54.2 (40.6–87.3) | 0.0369 $ * |
| FM (kg) | 27.1 (2.3–71.2) | 33.7 (8.1–71.2) | 24.7 (2.3–56.7) | 0.0152 $ * |
| FM (%) | 46.5 (12.7–64.6) | 50.2 (30.5–64.6) | 45.8 (12.7–59.4) | 0.0369 $ * |
| TMI | 88.0 (20.9–200.8) | 96.4 (34.0–200.8) | 86.0 (20.9–189.1) | 0.1001 $ |
| BMFI | 10.7 (1.7–34.7) | 18.8 (3.5–34.7) | 9.5 (1.7–29.8) | 0.0010 $ * |
| FMI | 11.9 (1.9–40.5) | 16.6 (5.4–40.5) | 11.0 (1.9–25.3) | 0.0027 $ * |
| FFMI | 31.4 (11.4–65.8) | 33.6 (17.1–56.2) | 30.9 (11.4–65.8) | 0.0962 $ |
| ABSI | 0.1 (0.1–0.1) | 0.1 (0.1–0.1) | 0.1 (0.1–0.1) | 0.4003 $ |
| VAI | 1.0 (0.3–4.2) | 2.1 (0.6–4.2) | 0.9 (0.3–2.4) | <0.0001 $ * |
| WtHR | 0.6 (0.4–0.9) | 0.7 (0.5–0.9) | 0.6 (0.4–0.8) | 0.0001 $ * |
| CMI | 0.9 (0.3–5.7) | 2.5 (0.5–5.7) | 0.8 (0.3–2.4) | <0.0001 $ * |
| TC/HDL-C | 3.2 (1.5–7.1) | 4.0 (2.6–5.6) | 3.0 (1.5–7.1) | <0.0001 $ * |
| TG/HDL-C | 1.5 (0.5–7.0) | 3.4 (1.1–7.0) | 1.4 (0.5–4.0) | <0.0001 $ * |
| MetS + (n = 24) | MetS − (n = 100) | |||||
|---|---|---|---|---|---|---|
| Variable | Females (n = 9) | Males (n = 15) | p | Females (n = 52) | Males (n = 48) | p |
| Age (yr) | 11.1 (8.0–17.6) | 13.2 (7.0–18.2) | 0.8346 $ | 13.2 (7.0–18.9) | 14.5 (6.9–18.8) | 0.6072 $ |
| Weight (kg) | 66.2 (27.8–121.7) | 79.2 (31.2–120.6) | 0.4561 $ | 57.4 (19.0–100.2) | 60.0 (23.0–116.0) | 0.2450 $ |
| Height (cm) | 143.1 (122.4–165.0) | 148.1 (124.0–166.5) | 0.5709 $ | 145.0 (108.0–173.1) | 154.0 (110.1–174.7) | 0.0033 $ * |
| WC (cm) | 91.0 (62.0–125.0) | 110.5 (61.5–131.0) | 0.2570 $ | 82.0 (54.0–115.0) | 86.8 (56.0–117.0) | 0.41951 $ |
| BMI (kg/m2) | 28.1 (18.6–54.3) | 38.5 (17.3–45.4) | 0.5711 $ | 25.8 (15.7–49.7) | 25.1 (14.2–43.7) | 0.7146 $ |
| BMI SDS | 2.7 (1.1–5.0) | 3.6 (0.9–5.7) | 0.1997 $ | 1.8 (−1.3–4.7) | 2.1 (−2.0–3.8) | 0.6097 $ |
| Obese n (%) | 5 (55.5%) | 14 (93.3%) | 0.09158 & | 24 (46.1%) | 27 (56.2%) | 0.41863 & |
| Glycemia (mg/dL) | 80.0 (72.0–167.0) | 88.0 (77.0–163.0) | 0.1353 $ | 78.0 (60.0–99.0) | 81.5 (63.0–99.0) | 0.0940 $ |
| Insulin (µU/mL) | 15.5 (7.3–35.9) | 17.9 (2.7–46.5) | 0.8815 $ | 8.7 (0.5–49.4) | 10.4 (2.7–37.0) | 0.2593 $ |
| HOMA | 3.6 (1.4–6.4) | 3.6 (0.6–10.2) | 0.9287 $ | 1.6 (0.1–9.6) | 2.0 (0.4–7.4) | 0.1698 $ |
| HbA1c | 5.3 (5.0–9.9) | 5.5 (4.7–8.2) | 0.5107 $ | 5.3 (4.6–9.4) | 5.4 (4.3–6.1) | 0.6937 $ |
| Total cholesterol (mg/dL) | 156.0 (125.0–235.0) | 179.0 (115.0–216.0) | 0.2700 $ | 164.0 (106.0–243.0) | 168.0 (113.0–256.0) | 0.9917 $ |
| HDL-C (mg/dL) | 38.0 (32.0–72.0) | 41.0 (36.0–54.0) | 0.0586 $ | 56.5 (38.0–107.0) | 54.0 (36.0–96.0) | 0.0710 $ |
| Triglycerides (mg/dL) | 130.0 (71.0–218.0) | 146.0 (67.0–266.0) | 0.4929 $ | 71.0 (35.0–202.0) | 75.5 (30.0–161.0) | 0.4901 $ |
| SBP (mm/Hg) | 110.0 (98.0–127.0) | 120.0 (96.0–141.0) | 0.2826 $ | 110.0 (80.0–138.0) | 115.0 (89.0–140.0) | 0.2373 $ |
| DBP (mm/Hg) | 75.0 (52.0–92.0) | 76.0 (54.0–85.0) | 0.3864 $ | 68.5 (40.0–91.0) | 70.0 (50.0–89.0) | 0.6502 $ |
| FFM (kg) | 29.9 (18.5–50.8) | 42.2 (17.1–56.2) | 0.2966 $ | 27.9 (11.4–46.1) | 34.7 (14.2–65.8) | 0.0107 $ * |
| FFM (%) | 50.2 (35.4–69.5) | 49.8 (43.6–64.4) | 0.9762 $ | 53.1 (40.9–69.8) | 57.6 (40.6–87.3) | 0.0100 $ * |
| FM (kg) | 31.3 (8.1–71.2) | 34.7 (11.2–62.1) | 0.5312 $ | 24.3 (7.0–51.1) | 25.8 (2.3–56.7) | 0.7667 $ |
| FM (%) | 49.8 (30.5–64.6) | 50.2 (35.6–56.4) | 0.9762 $ | 46.9 (30.2–59.1) | 42.4 (12.7–59.4) | 0.0100 $ * |
| TMI | 95.3 (34.0–200.8) | 125.0 (41.9–196.6) | 0.4561 $ | 80.4 (20.9–147.7) | 95.4 (25.3–189.1) | 0.0923 $ |
| BMFI | 12.7 (3.5–34.7) | 21.5 (3.8–28.4) | 0.6547 $ | 10.3 (2.7–29.8) | 8.7 (1.7–25.0) | 0.3961 $ |
| FMI | 13.1 (5.4–40.5) | 19.1 (6.2–23.4) | 0.7429 $ | 11.9 (4.2–25.3) | 10.6 (1.9–21.4) | 0.3238 $ |
| FFMI | 29.9 (18.5–50.8) | 42.2 (17.1–56.2) | 0.2966 $ | 27.9 (11.4–46.1) | 34.7 (14.2–65.8) | 0.0107 $ * |
| ABSI | 0.1 (0.1–0.1) | 0.1 (0.1–0.1) | 0.2700 $ | 0.1 (0.1–0.1) | 0.1 (0.1–0.1) | 0.1239 $ |
| VAI | 2.6 (0.8–4.2) | 2.0 (0.6–4.1) | 0.1011 $ | 1.0 (0.4–2.4) | 0.8 (0.3–2.2) | 0.0109 $ * |
| WtHR | 0.7 (0.5–0.9) | 0.7 (0.5–0.9) | 0.3252 $ | 0.6 (0.4–0.8) | 0.6 (0.4–0.8) | 0.7510 $ |
| CMI | 2.5 (0.5–3.1) | 2.4 (0.6–5.7) | 0.6983 $ | 0.7 (0.3–1.8) | 0.8 (0.3–2.4) | 0.3410 $ |
| TC/HDL-C | 3.9 (3.3–5.6) | 4.0 (2.6–5.2) | 0.6983 $ | 2.9 (1.5–4.6) | 3.2 (1.7–7.1) | 0.0401 $ * |
| TG/HDL-C | 3.4 (1.1–5.2) | 3.3 (1.3–7.0) | 0.9762 $ | 1.4 (0.5–3.0) | 1.4 (0.5–4.0) | 0.1807 $ |
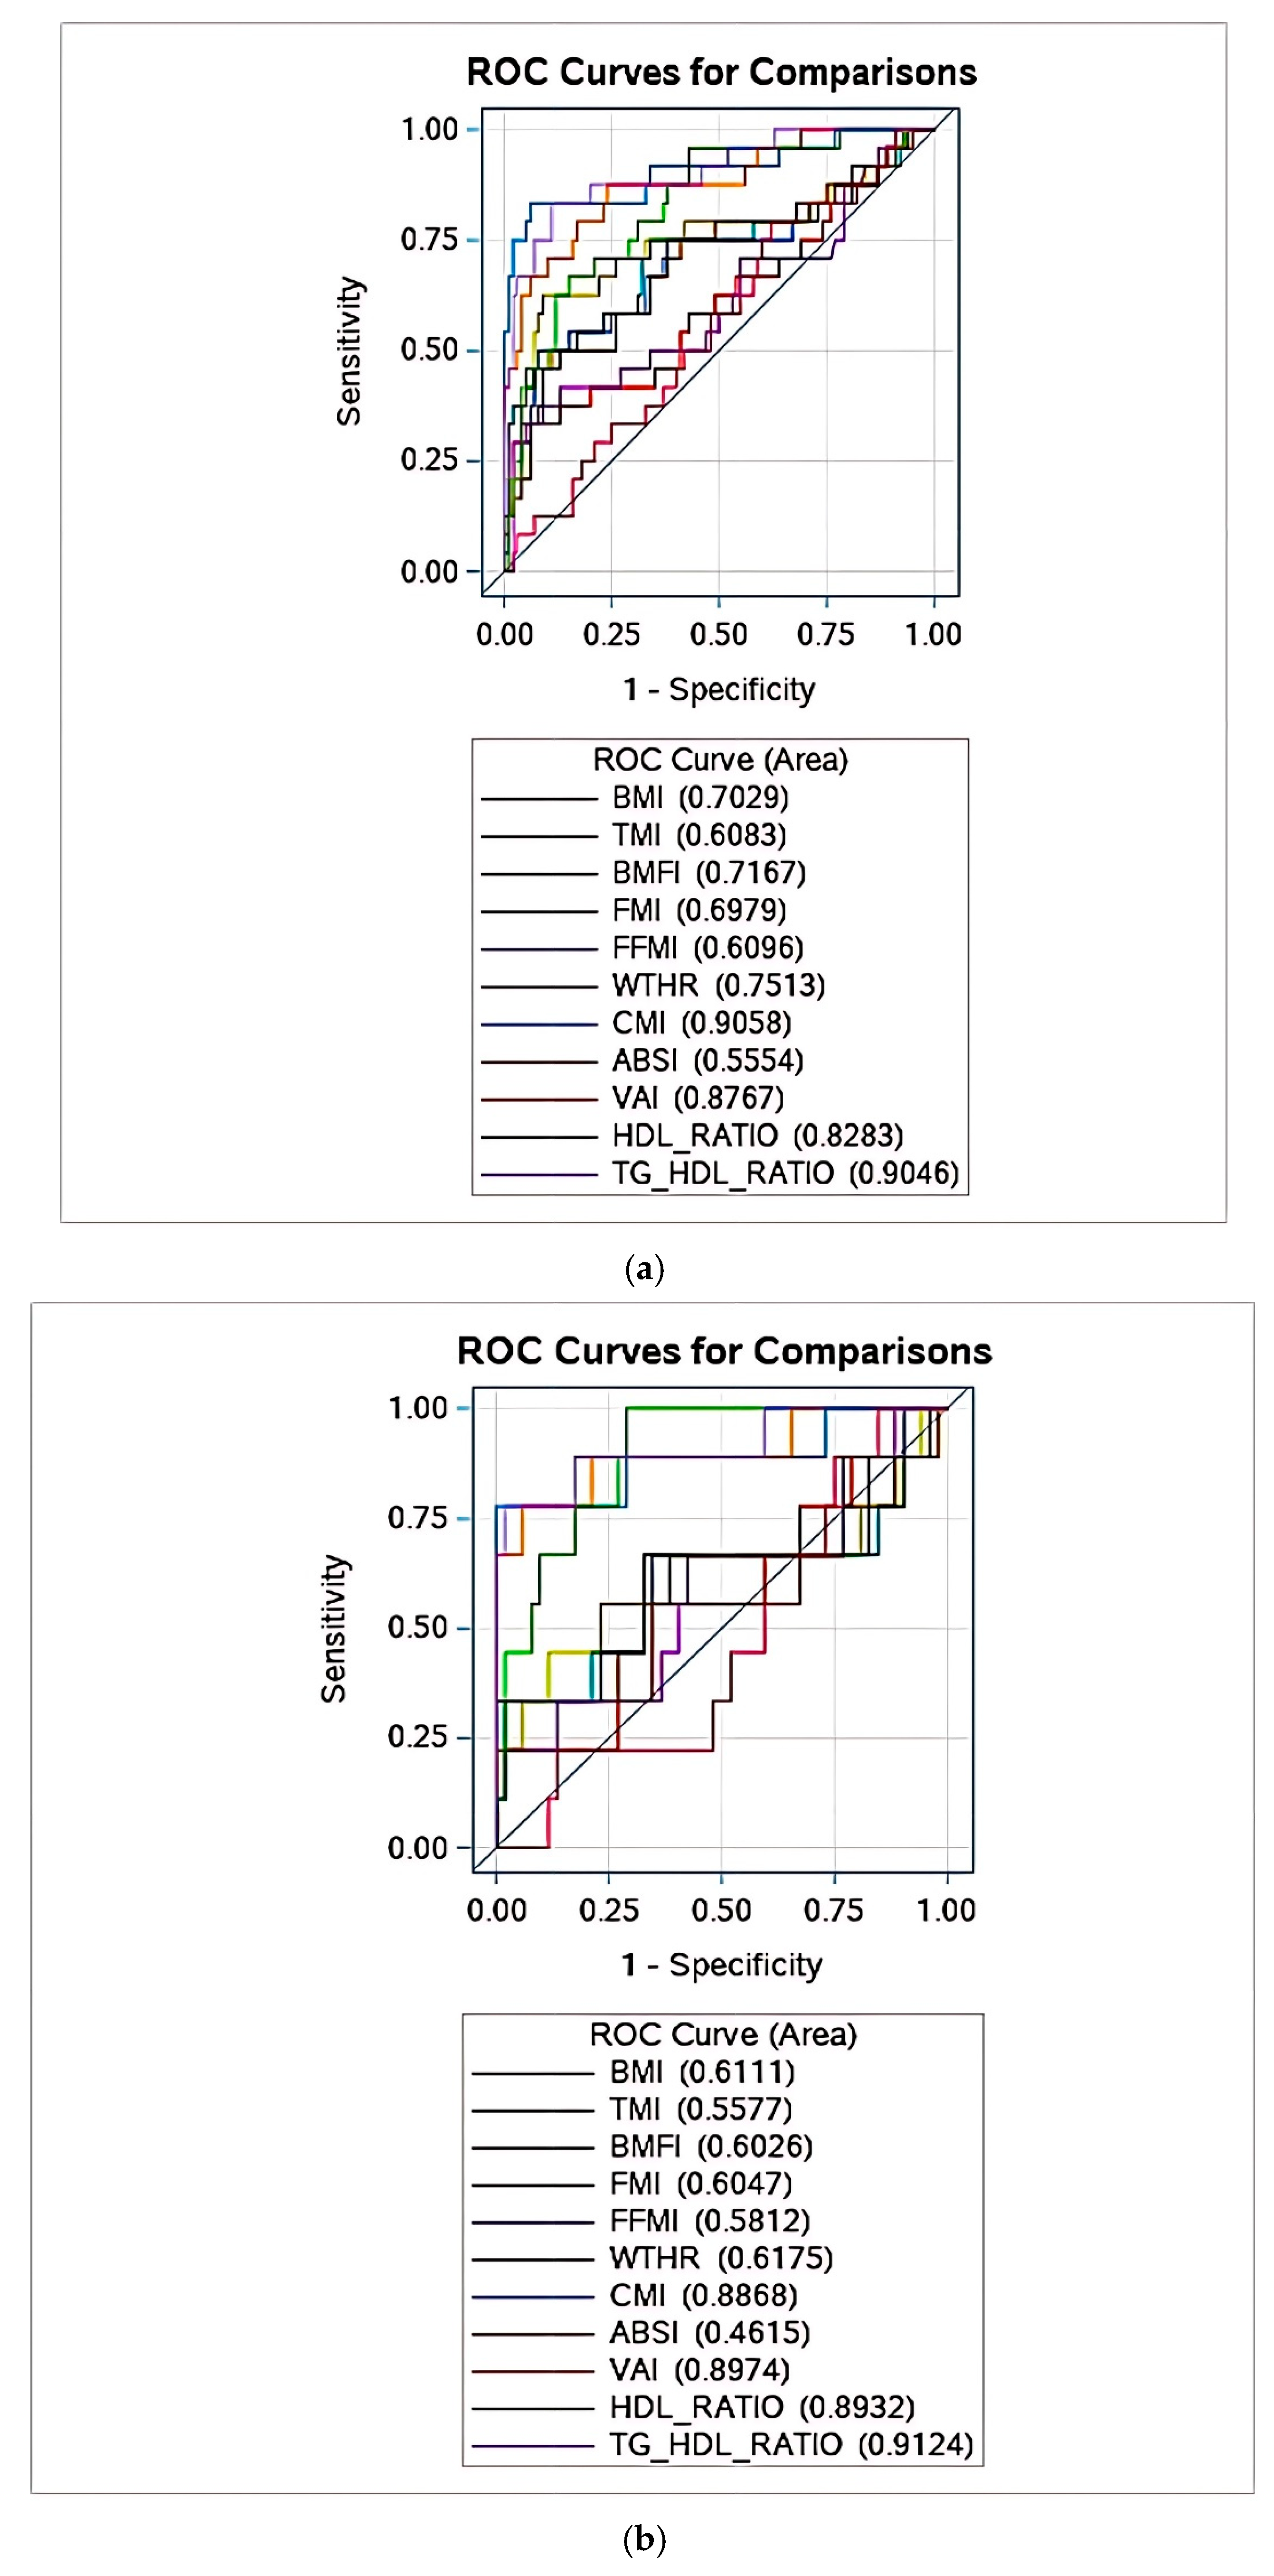
| CMI | Whole Group | Females | Males |
|---|---|---|---|
| Sensitivity | 0.7083 (0.5265–0.8902) | 0.7778 (0.5062–1.000) | 0.6667 (0.4281–0.9052) |
| Specificity | 0.9800 (0.9526–1.000) | 1.000 (1.000–1.000) | 0.9583 (0.9018–1.000) |
| PPV | 0.8947 (0.7567–1.000) | 1.000 (1.000–1.000) | 0.8333 (0.6225–1.000) |
| NPV | 0.9333 (0.8856–0.9810) | 0.9630 (0.9126–1.000) | 0.9020 (0.8203–0.9836) |
| Youden Index | 0.773 | 0.778 | 0.783 |
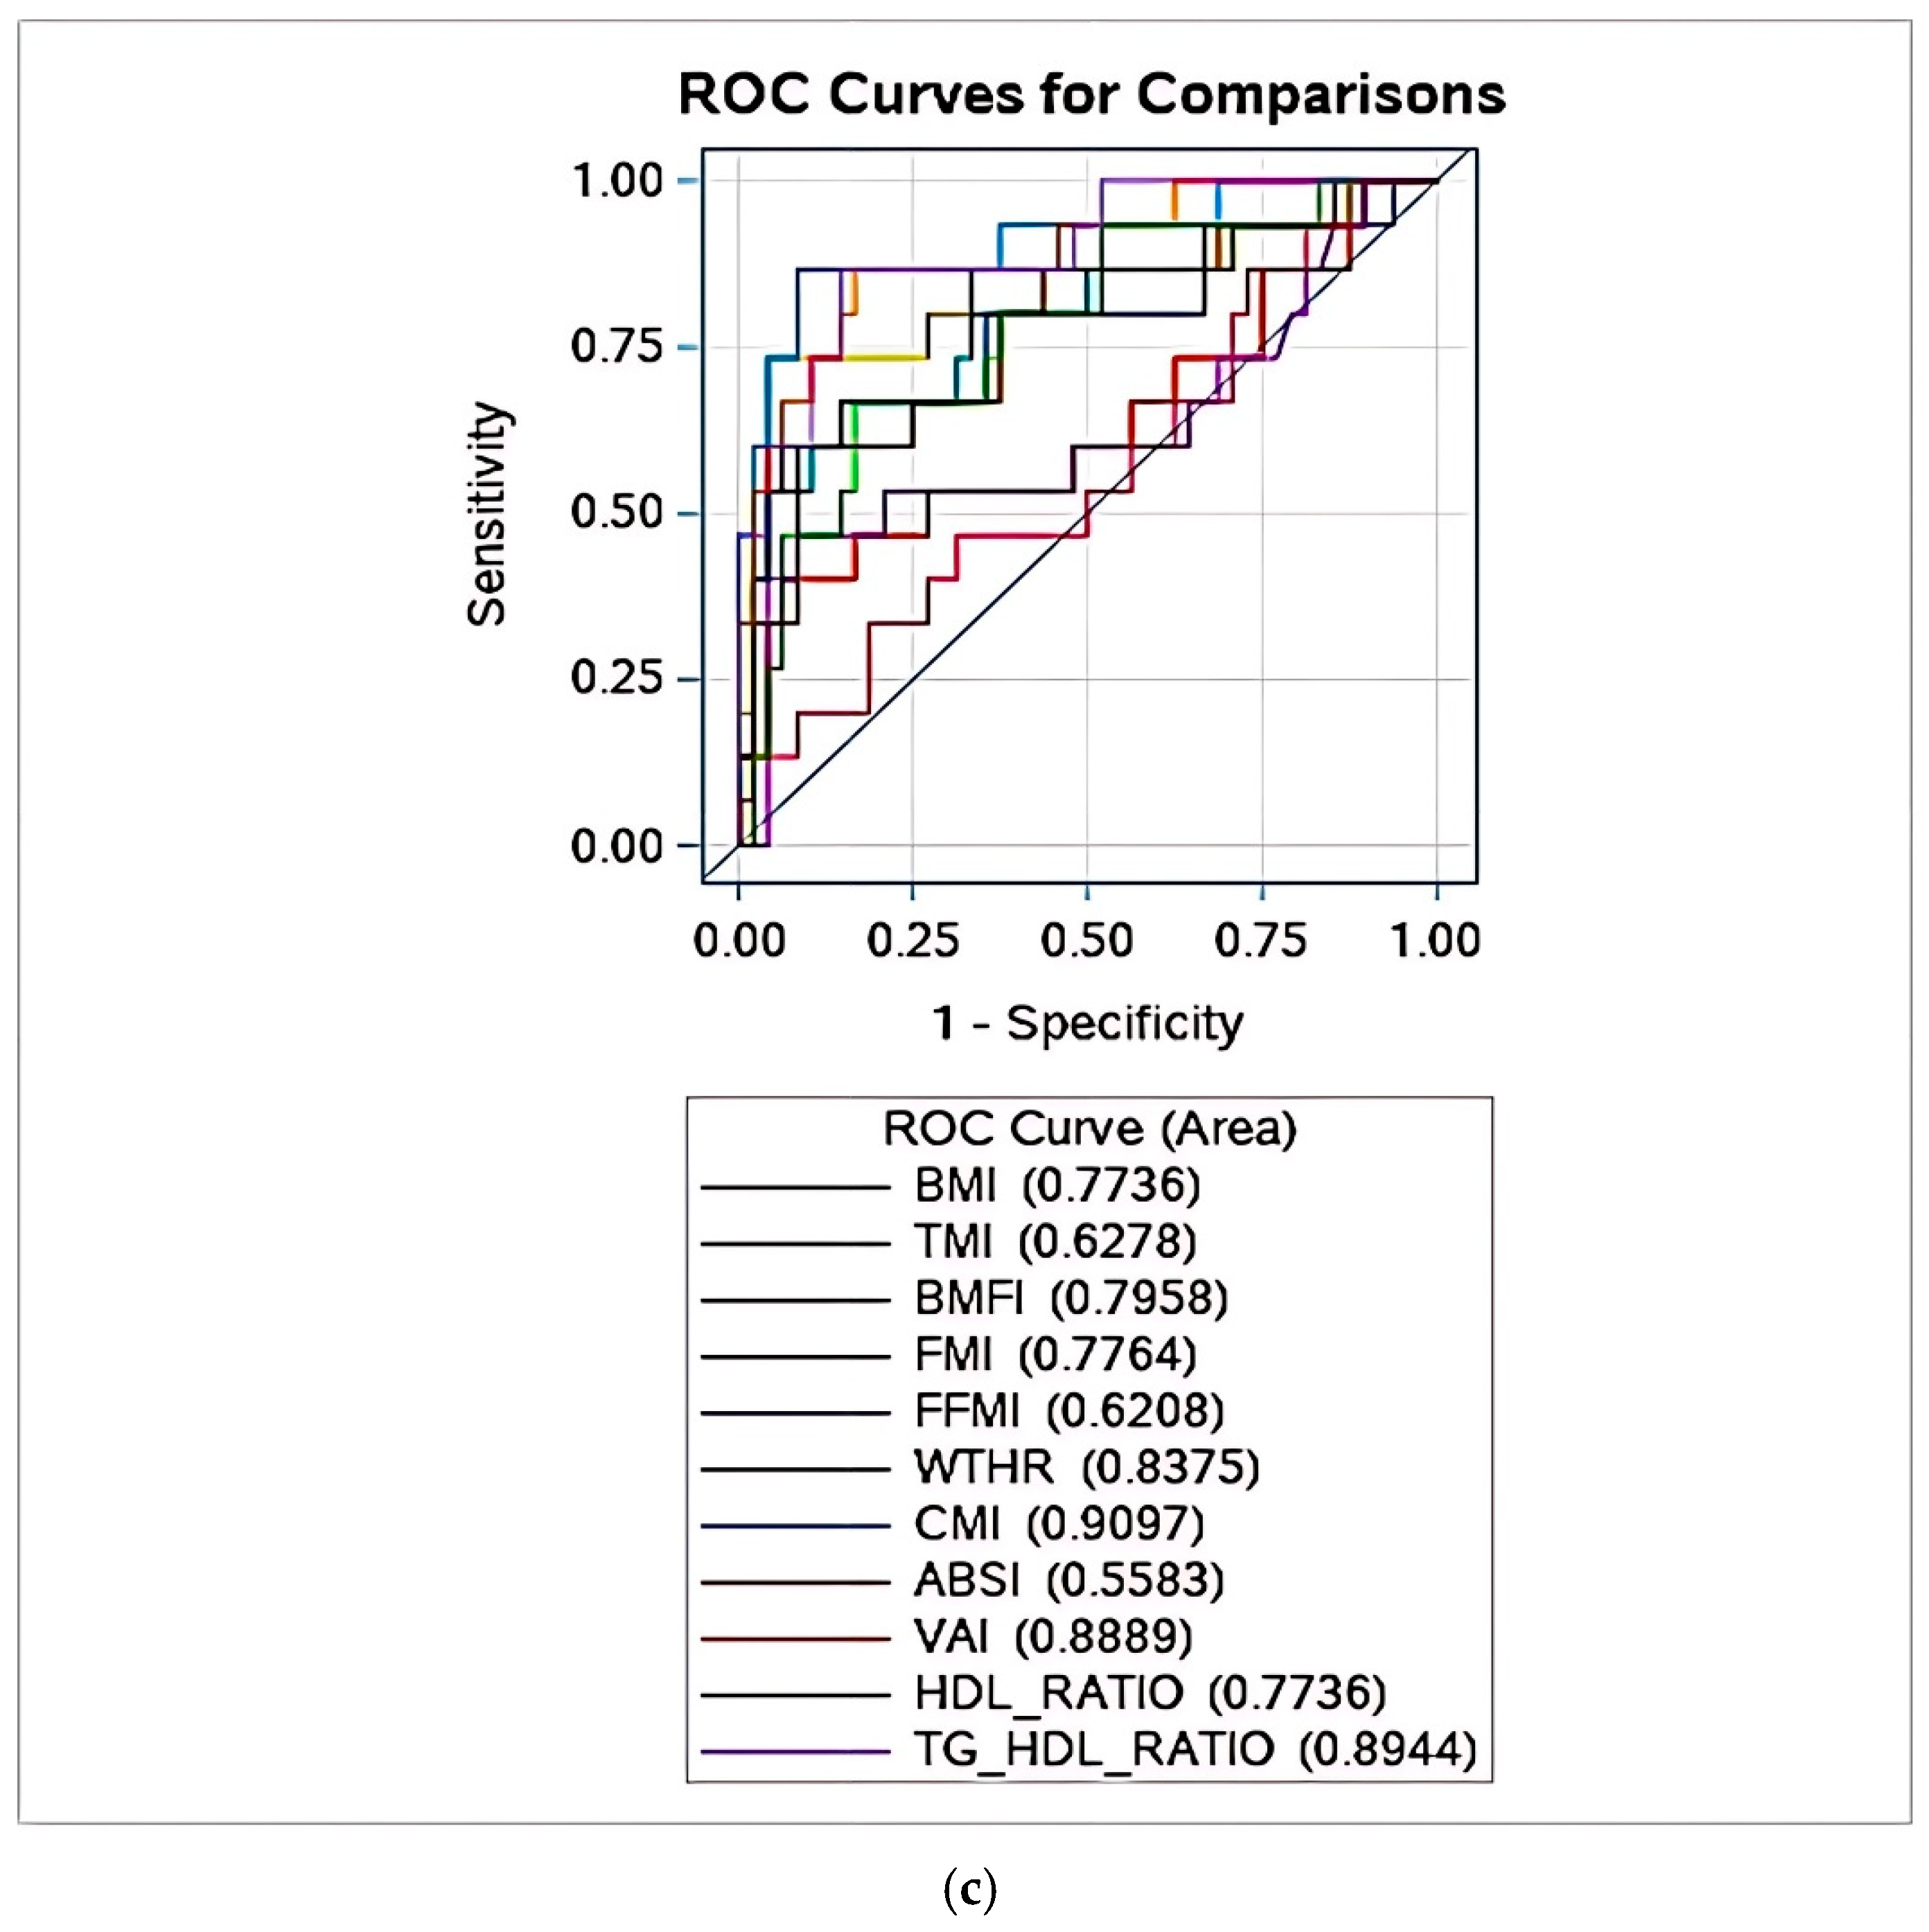
| AUROC | 0.906 | 0.887 | 0.910 * |
| TG/HDL-C | Whole group | Females | Males |
| Sensitivity | 0.6250 (0.4313–0.8187) | 0.6667 (0.3587–0.9746) | 0.6000 (0.3521–0.8479) |
| Specificity | 0.9700 (0.9366–1.000) | 0.9808 (0.9434–1.000) | 0.9583 (0.9018–1.000) |
| PPV | 0.8333 (0.6612–1.000) | 0.8571 (0.5979–1.000) | 0.8182 (0.5903–1.000) |
| NPV | 0.9151 (0.8620–0.9682) | 0.9444 (0.8833–1.000) | 0.8846 (0.7978–0.9715) |
| Youden Index | 0.723 | 0.759 | 0.721 |
| AUROC | 0.905 | 0.912 | 0.894 * |
| Whole Group | Females | Males | |
|---|---|---|---|
| BMI (kg/m2) | 0.36 * | 0.30 * | 0.42 * |
| BMI SDS | 0.36 * | 0.33 * | 0.42 * |
| glycemia (mg/dL) | 0.22 * | 0.24 | 0.17 |
| HDL-C (mg/dL) | −0.69 * | −0.65 * | −0.73 * |
| Triglycerides (mg/dL) | 0.90 * | 0.85 * | 0.93 * |
| SBP (mm/Hg) | 0.22 * | 0.09 | 0.30 * |
| DBP (mm/Hg) | 0.21 * | 0.16 | 0.23 |
Disclaimer/Publisher’s Note: The statements, opinions and data contained in all publications are solely those of the individual author(s) and contributor(s) and not of MDPI and/or the editor(s). MDPI and/or the editor(s) disclaim responsibility for any injury to people or property resulting from any ideas, methods, instructions or products referred to in the content. |
© 2025 by the authors. Licensee MDPI, Basel, Switzerland. This article is an open access article distributed under the terms and conditions of the Creative Commons Attribution (CC BY) license (https://creativecommons.org/licenses/by/4.0/).
Share and Cite
Grugni, G.; Lupi, F.; Bonetti, M.; Bocchini, S.; Bucolo, C.; Corica, D.; Crinò, A.; Faienza, M.F.; Fintini, D.; Licenziati, M.R.; et al. Assessing Metabolic Syndrome Risk in Children and Adolescents with Prader–Willi Syndrome: A Comparison of Index Performance. J. Clin. Med. 2025, 14, 4716. https://doi.org/10.3390/jcm14134716
Grugni G, Lupi F, Bonetti M, Bocchini S, Bucolo C, Corica D, Crinò A, Faienza MF, Fintini D, Licenziati MR, et al. Assessing Metabolic Syndrome Risk in Children and Adolescents with Prader–Willi Syndrome: A Comparison of Index Performance. Journal of Clinical Medicine. 2025; 14(13):4716. https://doi.org/10.3390/jcm14134716
Chicago/Turabian StyleGrugni, Graziano, Fiorenzo Lupi, Mirko Bonetti, Sarah Bocchini, Carmen Bucolo, Domenico Corica, Antonino Crinò, Maria Felicia Faienza, Danilo Fintini, Maria Rosaria Licenziati, and et al. 2025. "Assessing Metabolic Syndrome Risk in Children and Adolescents with Prader–Willi Syndrome: A Comparison of Index Performance" Journal of Clinical Medicine 14, no. 13: 4716. https://doi.org/10.3390/jcm14134716
APA StyleGrugni, G., Lupi, F., Bonetti, M., Bocchini, S., Bucolo, C., Corica, D., Crinò, A., Faienza, M. F., Fintini, D., Licenziati, M. R., Maghnie, M., Mozzillo, E., Pajno, R., Zampino, G., Sartorio, A., & Radetti, G., on behalf of the Genetic Obesity Group of the Italian Society of Pediatric Endocrinology and Diabetology. (2025). Assessing Metabolic Syndrome Risk in Children and Adolescents with Prader–Willi Syndrome: A Comparison of Index Performance. Journal of Clinical Medicine, 14(13), 4716. https://doi.org/10.3390/jcm14134716