
Effects of Pre-Operative HbA1c on Outcomes and the Rate of Clinical Improvement Following Anterior Cervical Discectomy and Fusion


Abstract
1. Introduction
2. Methodology
2.1. Patient-Reported Outcome Measures (PROMs)
2.2. Statistical Analysis
3. Results
4. Discussion
4.1. Rate of Recovery
4.2. Post-Operative Recovery Trend
4.3. Pre-Operative HbA1c and PROMs
4.4. Post-Operative Complications
4.5. Pathophysiologic Considerations
4.6. Future Directions
4.7. Limitations
5. Conclusions
Author Contributions
Funding
Institutional Review Board Statement
Informed Consent Statement
Data Availability Statement
Conflicts of Interest
References
- Brodke, D.S.; Zdeblick, T.A. Modified Smith-Robinson procedure for anterior cervical discectomy and fusion. Spine 1992, 17, 427–430. [Google Scholar] [CrossRef] [PubMed]
- Emery, S.E.; Bolesta, M.J.; Banks, M.A.; Jones, P.K. Robinson anterior cervical fusion comparison of the standard and modified techniques. Spine 1994, 19, 660–663. [Google Scholar] [CrossRef]
- Lehmann, C.L.; Buchowski, J.M.; Stoker, G.E.; Riew, K.D. Neurologic recovery after anterior cervical discectomy and fusion. Glob. Spine J. 2014, 4, 041–046. [Google Scholar] [CrossRef]
- Iwasaki, M.; Okuda, S.; Miyauchi, A.; Sakaura, H.; Mukai, Y.; Yonenobu, K.; Yoshikawa, H. Surgical strategy for cervical myelopathy due to ossification of the posterior longitudinal ligament: Part 1: Clinical results and limitations of laminoplasty. Spine 2007, 32, 647–653. [Google Scholar] [CrossRef] [PubMed]
- Spinal Fusion-OrthoInfo-AAOS. Available online: https://orthoinfo.aaos.org/en/treatment/spinal-fusion (accessed on 12 December 2024).
- Epstein, N.E. A Review of Complication Rates for Anterior Cervical Diskectomy and Fusion (ACDF). Surg. Neurol. Int. 2019, 10, 100. [Google Scholar] [CrossRef] [PubMed]
- Campbell, P.G.; Yadla, S.; Nasser, R.; Malone, J.; Maltenfort, M.G.; Ratliff, J.K. Patient comorbidity score predicting the incidence of perioperative complications: Assessing the impact of comorbidities on complications in spine surgery. J. Neurosurg. Spine 2012, 16, 37–43. [Google Scholar] [CrossRef]
- Flynn, D.E.; Mao, D.; Yerkovich, S.T.; Franz, R.; Iswariah, H.; Hughes, A.; Shaw, I.M.; Tam, D.P.L.; Chandrasegaram, M.D.; Farag, E. The impact of comorbidities on post-operative complications following colorectal cancer surgery. PLoS ONE 2020, 15, e0243995. [Google Scholar] [CrossRef] [PubMed]
- Fang, M. Trends in the Prevalence of Diabetes Among U.S. Adults: 1999–2016. Am. J. Prev. Med. 2018, 55, 497–505. [Google Scholar] [CrossRef]
- Satake, K.; Kanemura, T.; Matsumoto, A.; Yamaguchi, H.; Ishikawa, Y. Predisposing factors for surgical site infection of spinal instrumentation surgery for diabetes patients. Eur. Spine J. 2013, 22, 1854–1858. [Google Scholar] [CrossRef]
- Luangboriboon, J.; Gibson, I. 970 The Effect of Diabetes on the Fusion Rate of Spinal Fusion Surgery: A Comprehensive Systematic Review and Meta-Analysis. Br. J. Surg. 2024, 111, znae163-677. [Google Scholar] [CrossRef]
- Ruggiero, N.; Soliman, M.A.; Kuo, C.C.; Aguirre, A.O.; Quiceno, E.; Saleh, J.; Yeung, K.; Khan, A.; Hess, R.M.; Lim, J.; et al. The Effect of Diabetes on Complications after Spinal Fusion: A Systematic Review and Meta-Analysis. World Neurosurg. 2024, 185, e976–e994. [Google Scholar] [CrossRef] [PubMed]
- Browne, J.A.; Cook, C.; Pietrobon, R.; Bethel, M.A.; Richardson, W.J. Diabetes and early postoperative outcomes following lumbar fusion. Spine 2007, 32, 2214–2219. [Google Scholar] [CrossRef] [PubMed]
- Roth, S.G.; Chanbour, H.; Gupta, R.; O’Brien, A.; Davidson, C.; Archer, K.R.; Pennings, J.S.; Devin, C.J.; Stephens, B.F.; Abtahi, A.M.; et al. Optimal hemoglobin A1C target in diabetics undergoing elective cervical spine surgery. Spine J. 2022, 22, 1149–1159. [Google Scholar] [CrossRef]
- Liow, M.H.L.; Lee, M.; Goh, G.S.-H.; Chen, L.T.J.; Yue, W.-M.; Guo, C.M.; Tan, S.B. Poorer Fusion Outcomes in Diabetic Cervical Spondylotic Myelopathy Patients Undergoing Single-level Anterior Cervical Discectomy and Fusion Does Not Compromise Functional Outcomes and Quality of Life. Spine 2018, 43, 477–483. [Google Scholar] [CrossRef]
- Gates, S.; Tzeuton, S.; Hadley, C.; Hill, B.W.; Patel, M.; Abboud, J. Establishing maximal medical improvement following aseptic revision of shoulder arthroplasty. J. Shoulder Elb. Surg. 2022, 31, S78–S82. [Google Scholar] [CrossRef]
- Patel, D.V.; Yoo, J.S.; Khechen, B.; Gowd, A.K.; Sayari, A.; Lamoutte, E.H.; Karmarkar, S.S.; Liu, J.N.; Singh, K. 46. Establishing maximal medical improvement following anterior cervical discectomy and fusion. Spine J. 2019, 19, S23. [Google Scholar] [CrossRef]
- Matar, R.N.; Gardner, T.J.; Kassam, F.; Grawe, B.M. When do patients truly reach maximal medical improvement after undergoing reverse shoulder arthroplasty? The incidence and clinical significance of pain and patient-reported outcome measure improvement. JSES Int. 2020, 4, 675–679. [Google Scholar] [CrossRef]
- Young, B.A.; Walker, M.J.; Strunce, J.B.; Boyles, R.E.; Whitman, J.M.; Childs, J.D. Responsiveness of the Neck Disability Index in patients with mechanical neck disorders. Spine J. 2009, 9, 802–808. [Google Scholar] [CrossRef]
- Hung, M.; Saltzman, C.L.; Kendall, R.; Bounsanga, J.; Voss, M.W.; Lawrence, B.; Spiker, R.; Brodke, D. What Are the MCIDs for PROMIS, NDI, and ODI Instruments Among Patients with Spinal Conditions? Clin. Orthop. Relat. Res. 2018, 476, 2027–2036. [Google Scholar] [CrossRef]
- Shuman, W.H.; Neifert, S.N.; Gal, J.S.; Snyder, D.J.; Deutsch, B.C.; Zimering, J.H.; Rothrock, R.J.; Caridi, J.M. The Impact of Diabetes on Outcomes and Health Care Costs Following Anterior Cervical Discectomy and Fusion. Glob. Spine J. 2020, 12, 780. [Google Scholar] [CrossRef]
- Saifi, C.; Fein, A.W.; Cazzulino, A.; Lehman, R.A.; Phillips, F.M.; An, H.S.; Riew, K.D. Trends in resource utilization and rate of cervical disc arthroplasty and anterior cervical discectomy and fusion throughout the United States from 2006 to 2013. Spine J. 2017, 17, 1460–1467. [Google Scholar] [CrossRef]
- Tao, X.M.; Matur, A.V.; Shukla, G.B.; Adogwa, O. Preoperative HbA1c and postoperative outcomes in spine surgery: A systematic review and meta-analysis. Spine 2023, 48, 1155–1165. [Google Scholar] [CrossRef] [PubMed]
- Cancienne, J.M.; Werner, B.C.; Hassanzadeh, H.; Singla, A.; Shen, F.H.; Shimer, A.L. The association of perioperative glycemic control with deep postoperative infection following anterior cervical discectomy and fusion. Spine J. 2017, 17, 359–366. [Google Scholar]
- Beighley, A.; Zhang, A.; Huang, B.; Carr, C.; Mathkour, M.; Werner, C.; Scullen, T.; Kilgore, M.D.; Maulucci, C.M.; Dallapiazza, R.F.; et al. Patient-reported outcome measures in spine surgery: A systematic review. J. Craniovertebral Junction Spine 2022, 13, 378–389. [Google Scholar] [CrossRef]
- Hills, J.M.; Weisenthal, B.; Sivaganesan, A.; Bydon, M.; Archer, K.R.; Devin, C.J. Value-based spine care: Paying for outcomes, not volume. Semin. Spine Surg. 2018, 30, 129–135. [Google Scholar] [CrossRef]
- American Diabetes Association. 10. Cardiovascular disease and risk management: Standards of Care in Diabetes—2024. Diabetes Care 2024, 47 (Suppl. S1), S179–S200. [Google Scholar] [CrossRef]
- As of August 2023 User Guide for Enhancing the Utilization of Patient-Reported Outcomes Measures (PROMs) in Orthopaedic Practice. Available online: https://www.aaos.org/globalassets/quality-and-practice-resources/patient-reported-outcome-measures/proms-user-guide.pdf (accessed on 10 December 2024).
- Capturing the Voice of the Patient: Using PROMs Improves Shared Decision Making. Available online: https://www.healthcatalyst.com/learn/success-stories/patient-reported-outcomes-measures-partners-healthcare (accessed on 12 December 2024).
- Dhatariya, K.; Levy, N.; Kilvert, A.; Watson, B.; Cousins, D.; Flanagan, D.; Hilton, L.; Jairam, C.; Leyden, K.; Lipp, A.; et al. NHS Diabetes guideline for the perioperative management of the adult patient with diabetes. Diabet. Med. 2012, 29, 420–433. [Google Scholar] [CrossRef] [PubMed]
- Guideline for Perioperative Care for People with Diabetes Mellitus Undergoing Elective and Emergency Surgery. 2021. Available online: https://cpoc.org.uk/sites/cpoc/files/documents/2021-03/CPOC-Diabetes-Guideline2021_0.pdf (accessed on 15 December 2024).
- Australian Diabetes Society, Peri-Operative Diabetes Management Guidelines. 2012. Available online: https://diabetessociety.com.au/documents/perioperativediabetesmanagementguidelinesfinalcleanjuly2012.pdf (accessed on 15 December 2024).
- Koutsoumbelis, S.; Hughes, A.P.; Girardi, F.P.; Cammisa, F.P.; Finerty, E.A.; Nguyen, J.T.; Gausden, E.; Sama, A.A. Risk factors for postoperative infection following posterior lumbar instrumented arthrodesis. J. Bone Jt. Surg. 2011, 93, 1627–1633. [Google Scholar] [CrossRef]
- Hikata, T.; Iwanami, A.; Hosogane, N.; Watanabe, K.; Ishii, K.; Nakamura, M.; Toyama, Y.; Matsumoto, M.; Kamata, M. High preoperative hemoglobin A1c is a risk factor for surgical site infection after posterior thoracic and lumbar spinal instrumentation surgery. J. Orthop. Sci. 2014, 19, 223–228. [Google Scholar] [CrossRef]
- Guzman, J.Z.; Iatridis, J.C.; Skovrlj, B.; Cutler, H.S.; Hecht, A.C.; Qureshi, S.A.; Cho, S.K. Outcomes and complications of diabetes mellitus on patients undergoing degenerative lumbar spine surgery. Spine 2014, 39, 1596–1604. [Google Scholar] [CrossRef]
- Walid, M.S.; Zaytseva, N. How does chronic endocrine disease affect cost in spine surgery? World Neurosurg. 2010, 73, 578–581. [Google Scholar] [CrossRef] [PubMed]
- Walid, M.S.; Newman, B.F.; Yelverton, J.C.; Nutter, J.P.; Ajjan, M.; Robinson, J.S., Jr. Prevalence of previously unknown elevation of glycosylated hemoglobin in spine surgery patients and impact on length of stay and total cost. J. Hosp. Med. 2010, 5, E10–E14. [Google Scholar] [CrossRef] [PubMed]
- Arrighi-Allisan, A.E.; Neifert, S.N.; Gal, J.S.; Zeldin, L.; Zimering, J.H.; Gilligan, J.T.; Deutsch, B.C.; Snyder, D.J.; Nistal, D.A.; Caridi, J.M. Diabetes Is Predictive of Postoperative Outcomes and Readmission Following Posterior Lumbar Fusion. Glob. Spine J. 2020, 12, 229–236. [Google Scholar] [CrossRef] [PubMed]
- Wong, S.L.; Demers, M.; Martinod, K.; Gallant, M.; Wang, Y.; Goldfine, A.B.; Kahn, C.R. Diabetes primes neutrophils to undergo NETosis, which impairs wound healing. Nat. Med. 2015, 21, 815–819. [Google Scholar] [CrossRef]
- Sajithlal, G.B.; Chithra, P.; Chandrakasan, G. Advanced glycation end products induce crosslinking of collagen In Vitro. Biochim. Biophys. Acta 1998, 1407, 215–224. [Google Scholar] [CrossRef]
- Marin, C.; Luyten, F.P.; Van der Schueren, B.; Kerckhofs, G.; Vandamme, K. The impact of type 2 diabetes on bone fracture healing. Front. Endocrinol. 2018, 9, 6. [Google Scholar] [CrossRef]


| Variable | Mean or Total Count N = 313 |
|---|---|
| Age | 55.7 ± 10.8 |
| BMI | 31.1 ± 7.2 |
| Female Male | 176 (56%) 137 (44%) |
| Pre-Operative HbA1c | 5.9 ± 0.8 |
| Diabetic Status Diabetic Non-Diabetic | 52 (17%) 261 (83%) |
| Follow-Up Time (Months) | 20.9 ± 12.7 |
| Length of Stay (Days) | 1.9 ± 0.6 |
| Post-Operative Complications Yes No | 15 (5%) 298 (95%) |
| Return to Operating Room Yes No | 11 (4%) 302 (96%) |
| Fusion(s) Single Multiple | 108 (34%) 205 (66%) |
| Number of Levels Fused 1 2 3 4 | 108 (34%) 134 (43%) 59 (19%) 13 (4%) |
| Mean Number of Levels Fused | 1.9 ± 0.8 |
| Total Count N = 313 | Non-Diabetic N = 261 | Diabetic N = 52 | p-Value | |
|---|---|---|---|---|
| Complication (total) | 15 (4.8%) | 10 (3.8%) | 5 (9.6%) | 0.090 |
| Pseudarthrosis | 6 (1.9%) | 4 (1.5%) | 2 (3.8%) | 0.267 |
| Seroma | 1 (0.3%) | 1 (0.4%) | 0 | |
| Hematoma | 1 (0.3%) | 1 (0.4%) | 0 | |
| Surgical site infection | 3 (1.0%) | 2 (0.8%) | 1 (1.9%) | 0.434 |
| Neurological deficit | 1 (0.3%) | 0 | 1 (1.9%) | |
| Hardware failure | 2 (0.6%) | 2 (0.8%) | 0 | |
| Excessive blood loss | 1 (0.3%) | 0 | 1 (1.9%) |
| Non-Diabetic (A1c < 6.5) N = 261 | Diabetic (A1c ≥ 6.5) N = 52 | p-Value | |
|---|---|---|---|
| Age | 54.8 ± 10.6 | 60.1 ± 10.5 | <0.001 |
| BMI | 30.3 ± 6.7 | 35.4 ± 7.9 | <0.001 |
| Sex Female Male | 151 (57%) 112 (43%) | 26 (50%) 26 (50%) | 0.325 |
| Follow-Up Time (Months) | 20.5 ± 12.4 | 22.5 ± 14.2 | 0.464 |
| Length of Stay (Days) | 1.8 ± 0.6 | 2 ± 0.8 | 0.047 |
| Post-Operative Complications Yes No | 10 (4%) 251 (96%) | 5 (10%) 47 (90%) | 0.090 |
| Return to Operating Room Yes No | 6 (2%) 255 (98%) | 2 (4%) 50 (96) | 0.512 |
| Fusion(s) Single Multiple | 89 (34%) 174 (66%) | 20 (38%) 32 (62%) | 0.522 |
| Number of Levels Fused 1 2 3 4 | 90 (34%) 109 (41%) 53 (20%) 11 (5%) | 19 (37%) 25 (48%) 6 (12%) 2 (3%) | 0.523 |
| Mean Number of Levels Fused | 1.9 ± 0.8 | 1.8 ± 0.9 | 0.360 |
| PROM | Total N = 313 | Non-Diabetic (A1c < 6.5) N = 261 | Diabetic (A1c ≥ 6.5) N = 52 | p-Value |
|---|---|---|---|---|
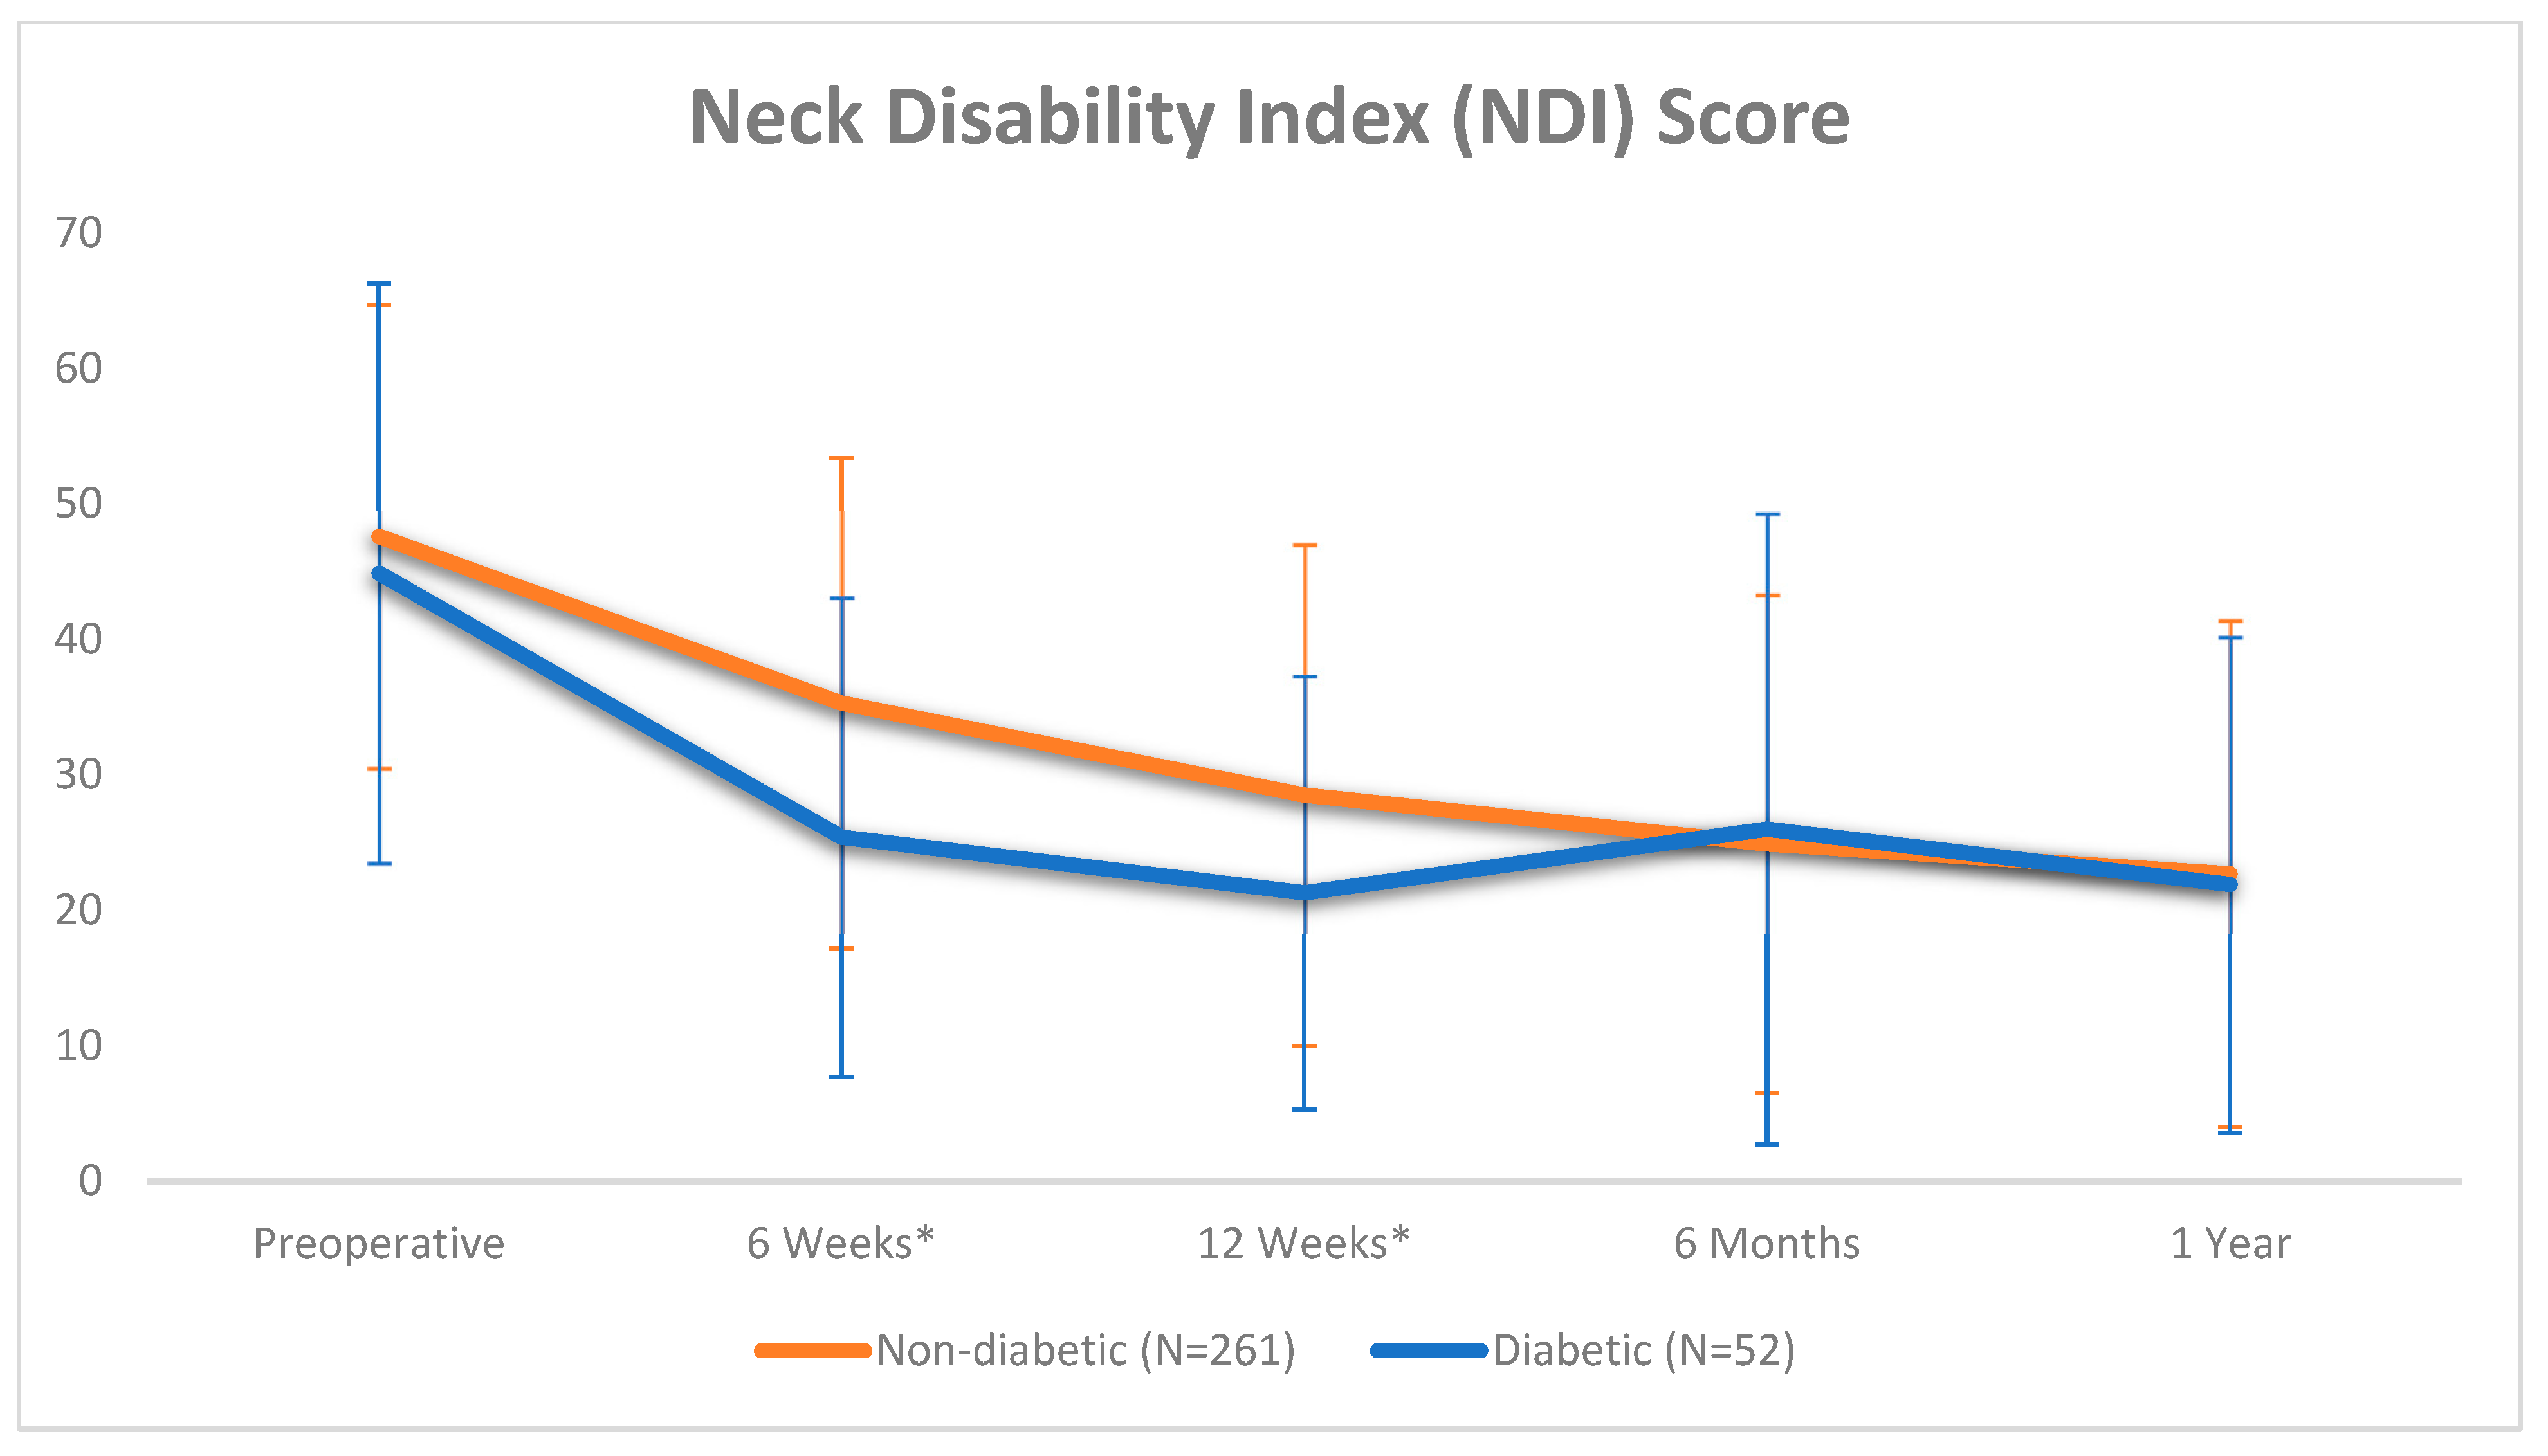
| NDI Pre-op 6 Weeks 12 Weeks 6 Months 1 Year | 47.1 ± 17.9 33.5 ± 18.4 27.2 ± 18.2 25.1 ± 19.3 22.6 ± 18.6 | 47.6 ± 17.1 35.3 ± 18.1 * 28.5 ± 18.5 * 24.9 ± 18.4 * 22.7 ± 18.7 * | 44.9 ± 21.4 25.4 ± 17.7 * 21.3 ± 16.0 26.0 ± 23.3 21.9 ± 18.3 * | 0.312 0.032 0.011 0.752 0.824 |
| PROMIS Global Pre-op 6 Weeks 12 Weeks 6 Months 1 Year | 29.2 ± 6.7 33.4 ± 7.4 33.3 ± 7.7 33.5 ± 8.0 33.5 ± 8.3 | 29.2 ± 6.5 33.0 ± 7.2 * 33.3 ± 7.7 * 33.7 ± 7.8 33.4 ± 8.1 | 29.4 ± 7.4 35.0 ± 8.4 * 33.5 ± 7.7 32.3 ± 8.4 33.6 ± 9.3 | 0.636 0.433 0.366 0.358 0.373 |
| PROMIS Physical Pre-op 6 Weeks 12 Weeks 6 Months 1 Year | 38.1 ± 6.6 44.8 ± 7.9 45.1 ± 8.3 45.4 ± 8.9 45.5 ± 9.2 | 38.2 ± 6.5 44.5 ± 7.6 * 44.9 ± 8.2 * 45.7 ± 8.6 45.3 ± 8.9 | 37.7 ± 7.1 46.1 ± 9.1 * 46.1 ± 8.5 * 44.2 ± 10.1 * 46.8 ± 10.5 | 0.636 0.433 0.366 0.358 0.373 |
| PROMIS Mental Pre-op 6 Weeks 12 Weeks 6 Months 1 Year | 44.0 ± 8.4 47.0 ± 8.6 46.8 ± 9.4 46.8 ± 9.6 46.8 ± 10.0 | 43.8 ± 8.1 46.5 ± 8.3 * 46.7 ± 9.4 47.0 ± 9.6 46.8 ± 9.9 | 44.8 ± 9.9 49.4 ± 9.7 * 47.3 ± 9.7 46.1 ± 9.7 47.0 ± 11.1 | 0.406 0.175 0.676 0.599 0.911 |
| Timepoint MCID Met | Total N = 313 | Non-Diabetic (A1c < 6.5) N = 261 | Diabetic (A1c ≥ 6.5) N = 52 | p-Value |
|---|---|---|---|---|
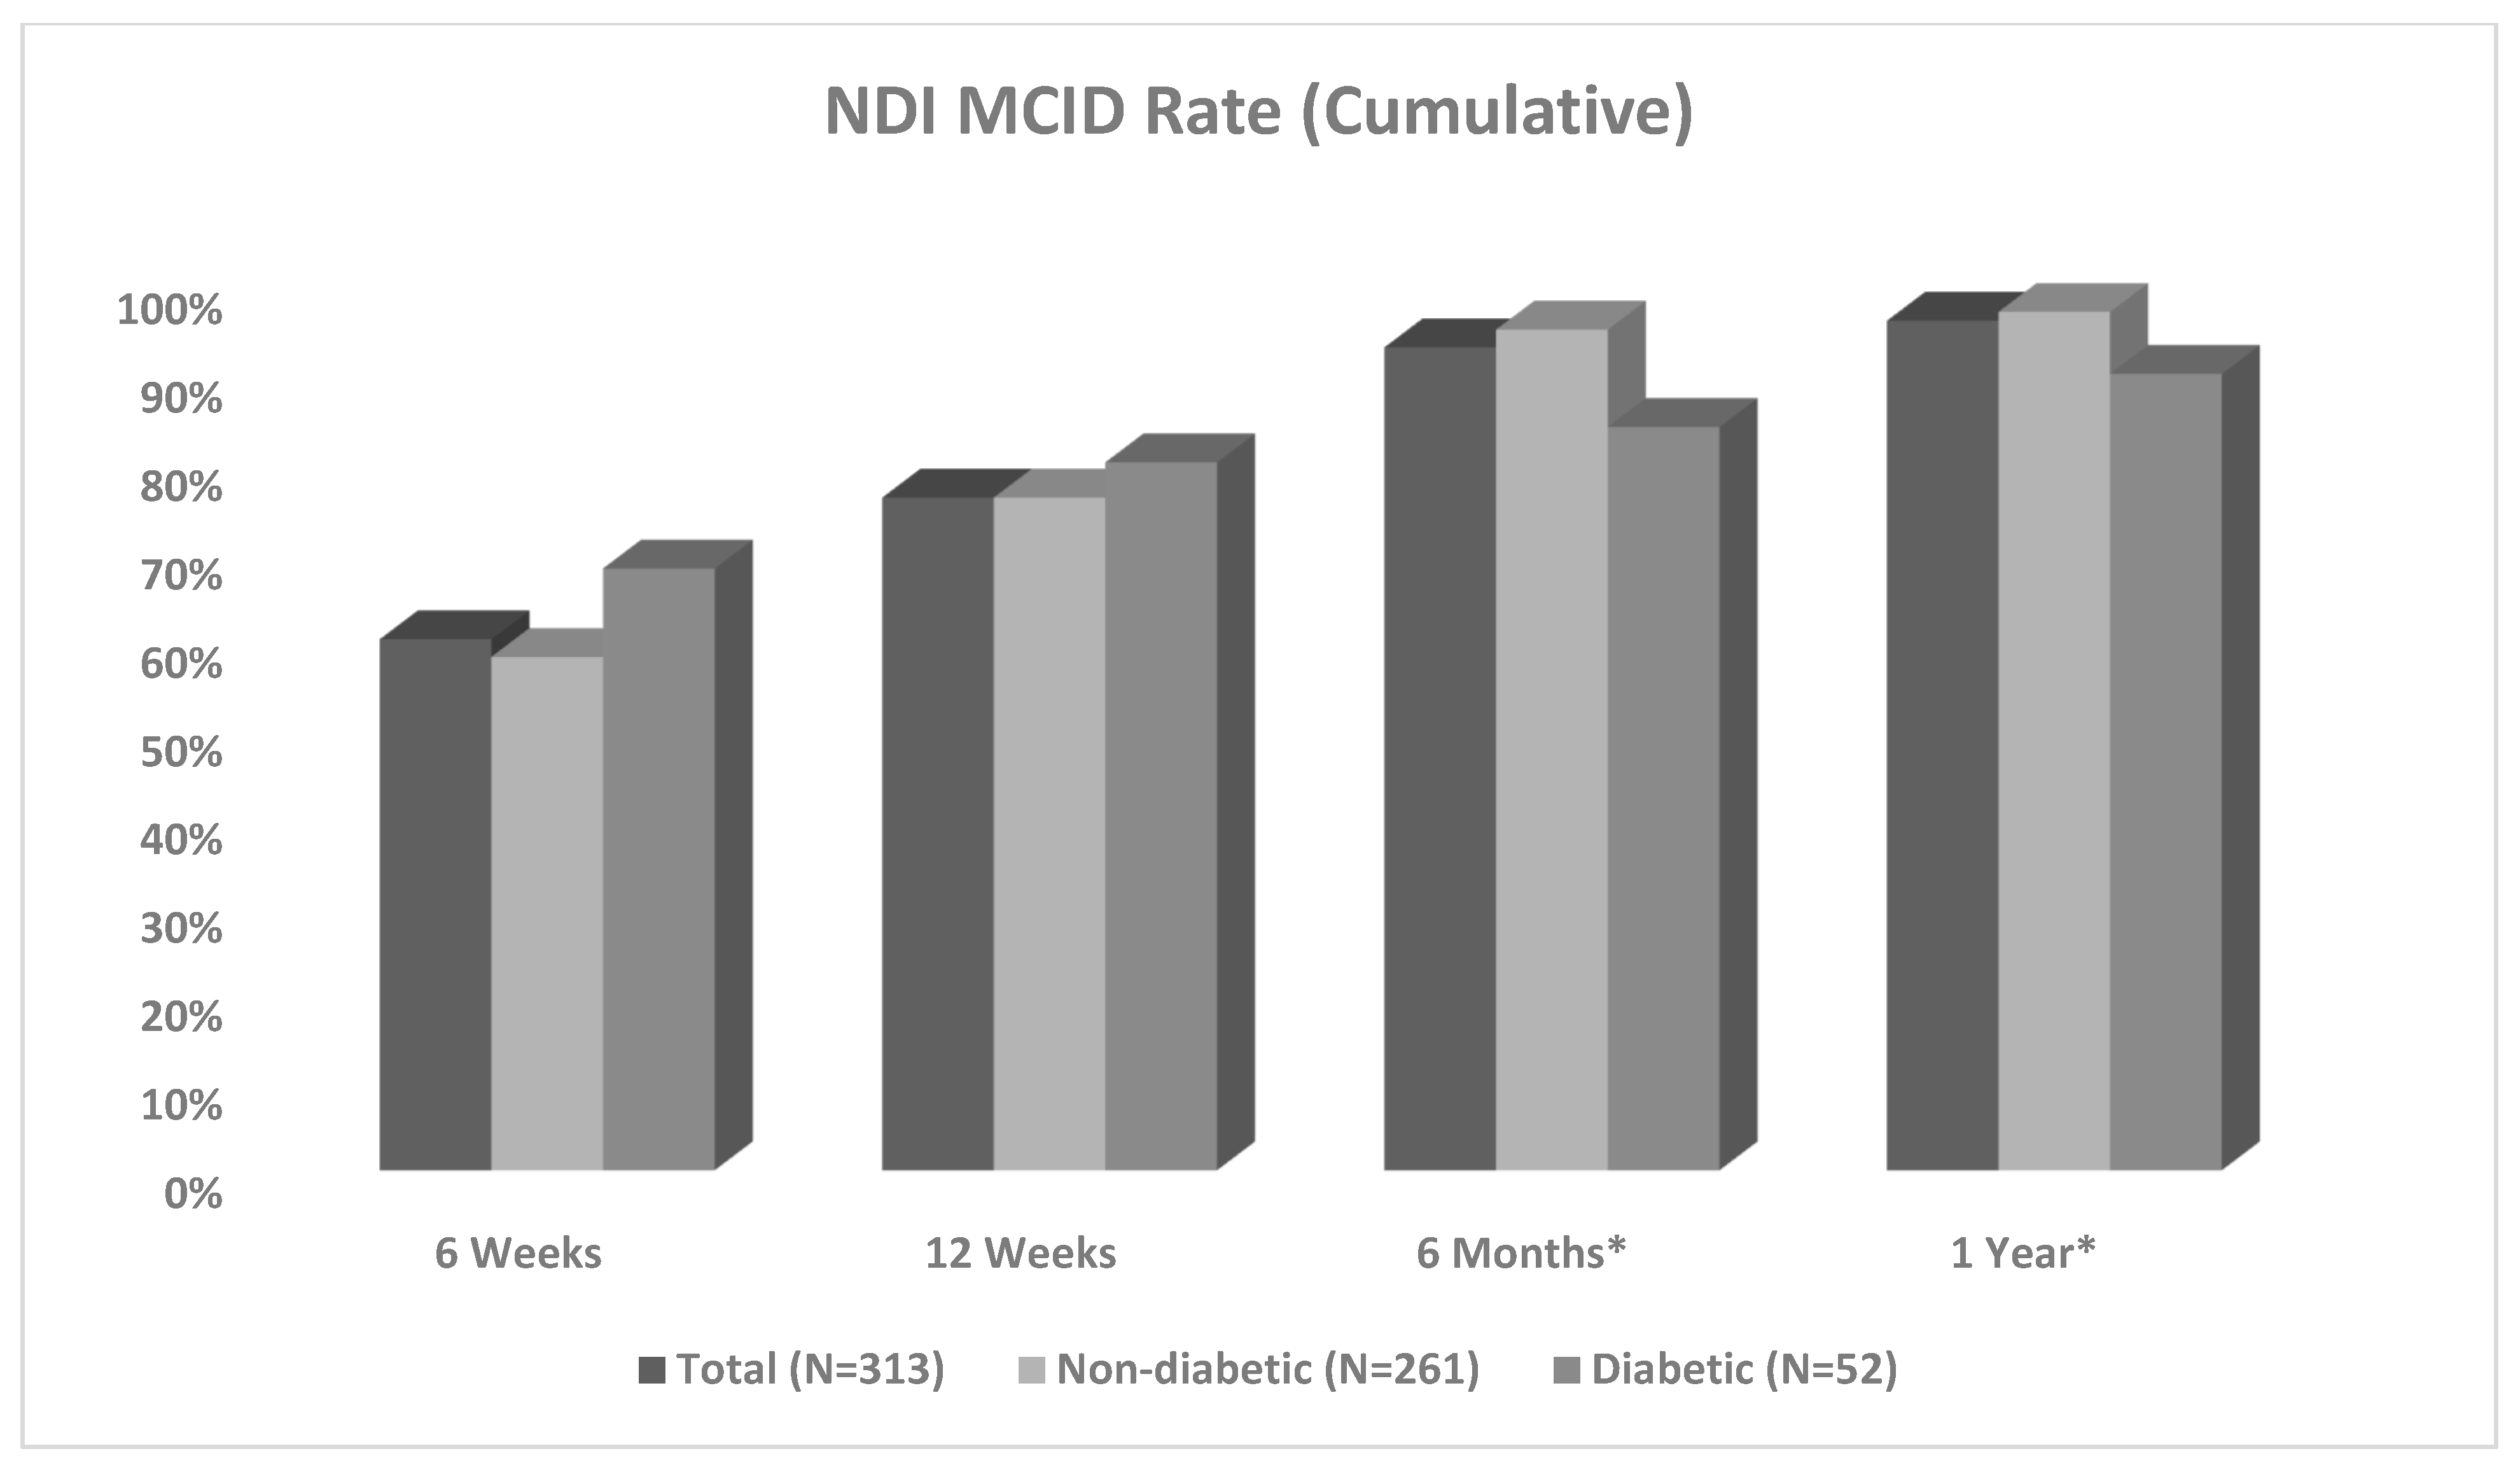
| NDI 6 Weeks 12 Weeks 6 Months 1 Year | 63/105 (60%) 230/301 (76%) 284/306 (93%) 299/313 (96%) | 50/86 (58%) 190/251 (76%) 241/255 (95%) 252/261 (97%) | 13/19 (68%) 40/50 (80%) 43/51 (84%) 47/52 (90%) | 0.408 0.513 0.010 0.049 |
| PROMIS Global 6 Weeks 12 Weeks 6 Months 1 Year | 16/105 (15%) 80/299 (26%) 96/304 (32%) 115/313 (37%) | 13/86 (13%) 68/249 (37%) 81/253 (47%) 96/261 (49%) | 3/19 (32%) 12/50 (48%) 15/51 (51%) 19/52 (62%) | 0.941 0.629 0.715 0.958 |
| PROMIS Physical 6 Weeks 12 Weeks 6 Months 1 Year | 28/105 (27%) 115/299 (38%) 144/304 (47%) 160/313 (51%) | 22/86 (13%) 91/249 (37%) 118/253 (47%) 128/261 (49%) | 6/19 (32%) 24/50 (48%) 26/51 (51%) 32/52 (62%) | 0.592 0.128 0.571 0.105 |
| PROMIS Mental 6 Weeks 12 Weeks 6 Months 1 Year | 11/105 (10%) 61/299 (20%) 76/304 (25%) 94/313 (30%) | 8/86 (9%) 51/249 (20%) 66/254 (26%) 83/261 (32%) | 3/19 (16%) 10/50 (20%) 10/51 (20%) 11/52 (21%) | 0.403 0.938 0.337 0.126 |
| Diabetic Status | ||||
|---|---|---|---|---|
| 1-Year Survey | Multivariate OR | p-Value | Univariate OR | p-Value |
| NDI MCID MCID30 | 2.585 0.716 | 0.346 0.606 | 1.733 0.818 | 0.391 0.626 |
| PROMIS Global MCID MCID30 | 1.153 1.075 | 0.804 0.904 | 0.708 0.678 | 0.449 0.420 |
| PROMIS Physical MCID MCID30 | 3.046 2.328 | 0.076 0.150 | 1.594 1.251 | 0.215 0.601 |
| PROMIS Mental MCID MCID30 | 0.176 1.127 | 0.036 0.897 | 0.224 0.641 | 0.047 0.565 |
| Pre-Operative HbA1c | ||||
|---|---|---|---|---|
| DM (HbA1c ≥ 6.5%) N = 52 | Non-DM (HbA1c < 6.5%) N = 261 | |||
| 1-Year Survey | Multivariate OR | p-Value | Multivariate OR | p-Value |
| NDI MCID MCID30 | 3.814 0.884 | 0.357 0.806 | 0.715 1.150 | 0.661 0.825 |
| PROMIS Global MCID MCID30 | 0.687 0.777 | 0.501 0.645 | 2.859 2.829 | 0.075 0.085 |
| PROMIS Physical MCID MCID30 | 0.441 0.347 | 0.180 0.155 | 1.977 4.866 | 0.210 0.015 |
| PROMIS Mental MCID MCID30 | 0.691 0.691 | 0.772 0.772 | 1.253 0.922 | 0.708 0.929 |
| Complications | 0.365 | 0.373 | 0.223 | 0.287 |
| Return to OR | 0.593 | 0.526 | 0.214 | 0.308 |
| Single-Level Fusion | Multiple-Level Fusion | |||||||||
|---|---|---|---|---|---|---|---|---|---|---|
| MCID 30 (1-Year) | N | AUC | p-Value | Cutoff | Sens, Spec | N | AUC | p-Value | Cutoff | Sens, Spec |
| NDI (Non-DM) | 57 | 0.716 | 0.009 | 5.05 5.45 | 0.92, 0.05 0.71, 0.60 | 174 | 0.490 | 0.889 | 5.15 5.45 | 0.88, 0.19 0.61, 0.38 |
| NDI (DM) | 20 | 0.589 | 0.664 | 6.80 7.30 | 0.86, 0.50 0.57, 0.75 | 32 | 0.343 | 0.205 | 5.15 5.45 | 0.88, 0.14 0.67, 0.24 |
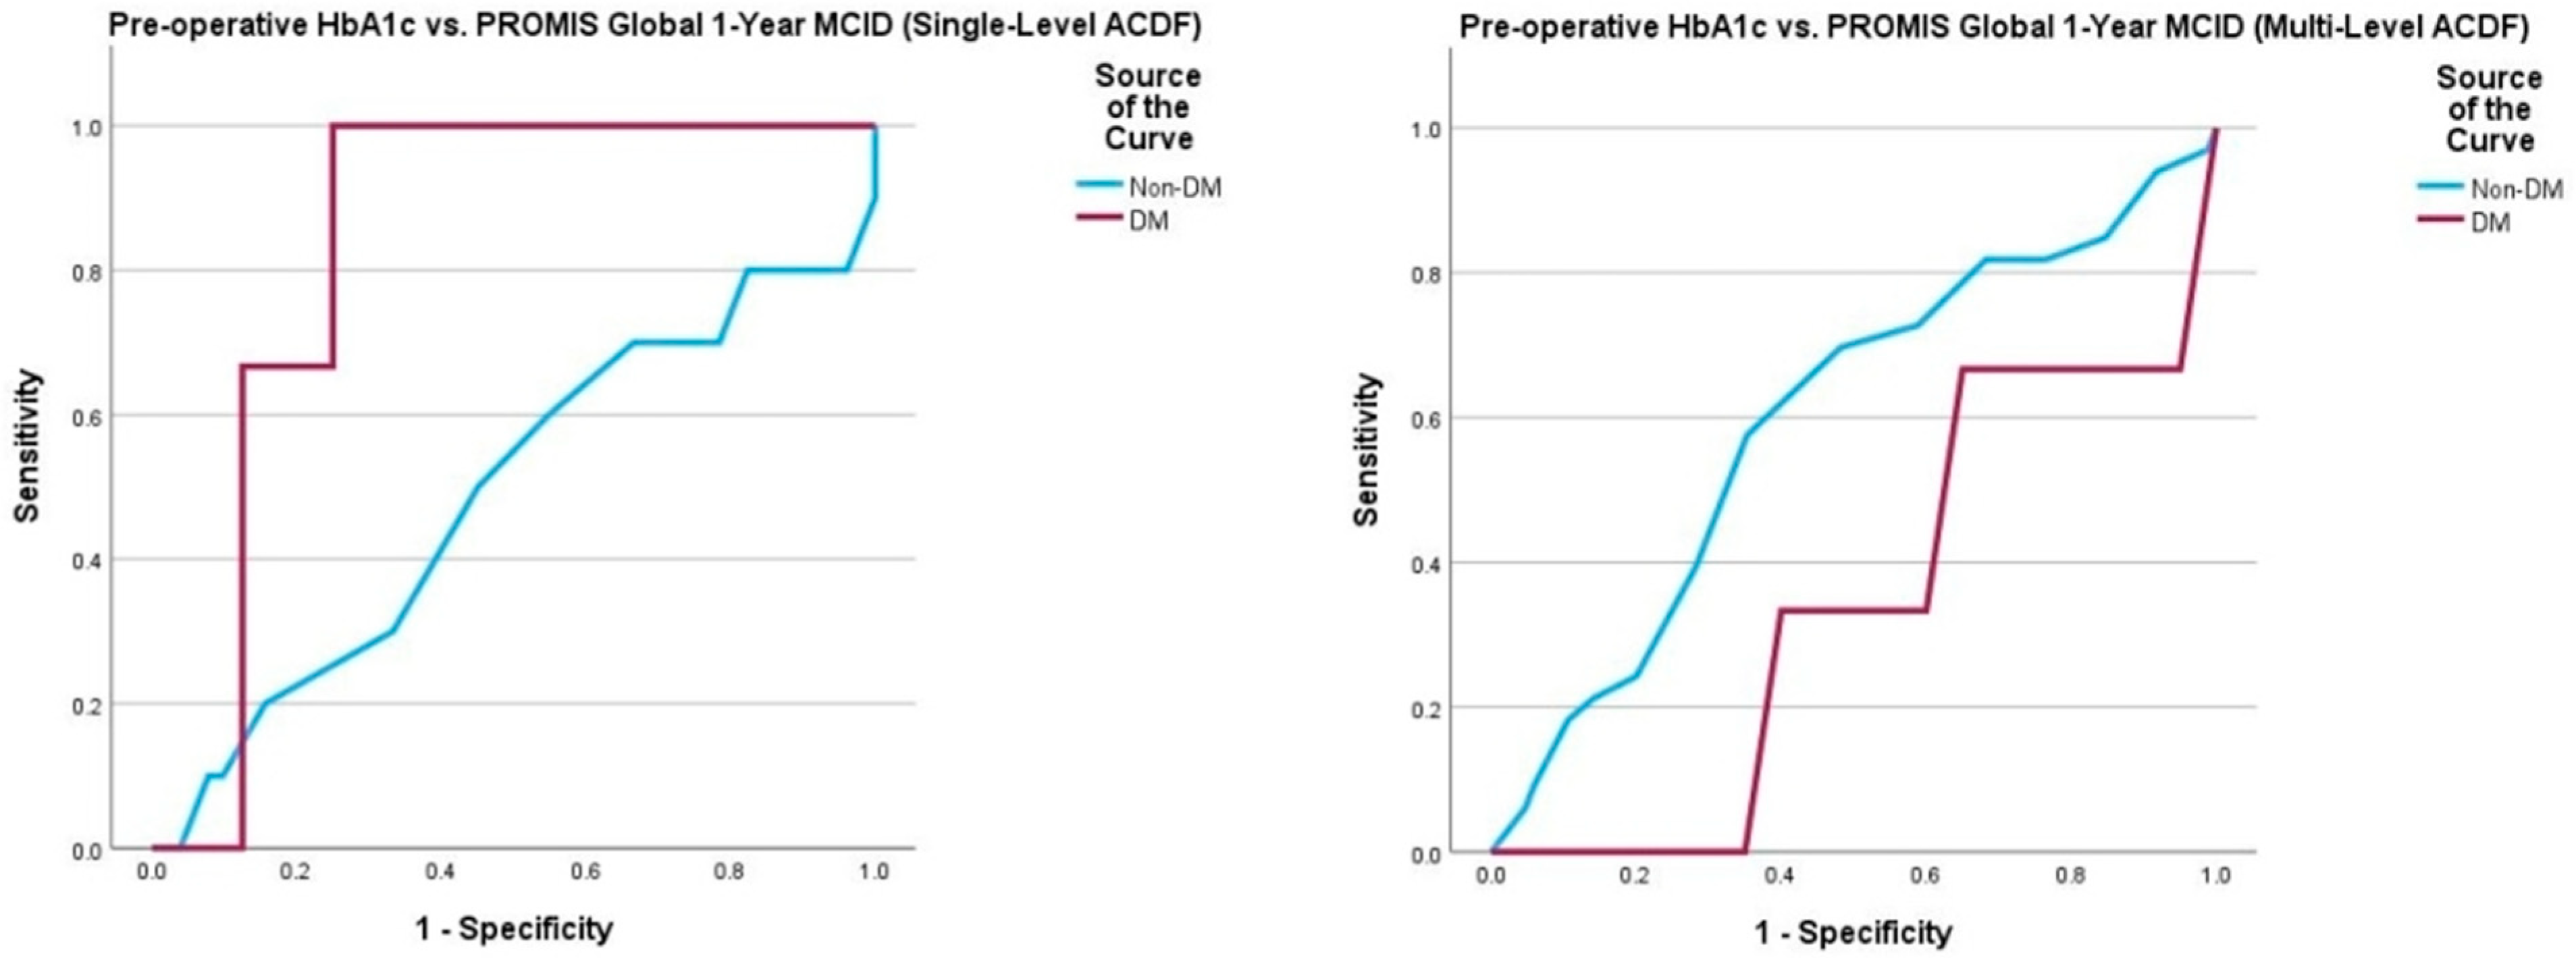
| PROMIS Overall (Non-DM) | 57 | 0.489 | 0.920 | 3.90 5.55 | 1.00, 0.00 0.50, 0.65 | 174 | 0.598 | 0.096 | 5.05 5.65 | 0.94, 0.08 0.58, 0.65 |
| PROMIS Overall (DM) | 20 | 0.833 | 0.009 | 7.30 7.85 | 1.00, 0.25 0.67, 0.88 | 32 | 0.342 | 0.326 | 7.00 7.40 | 0.67, 0.35 0.33, 0.60 |
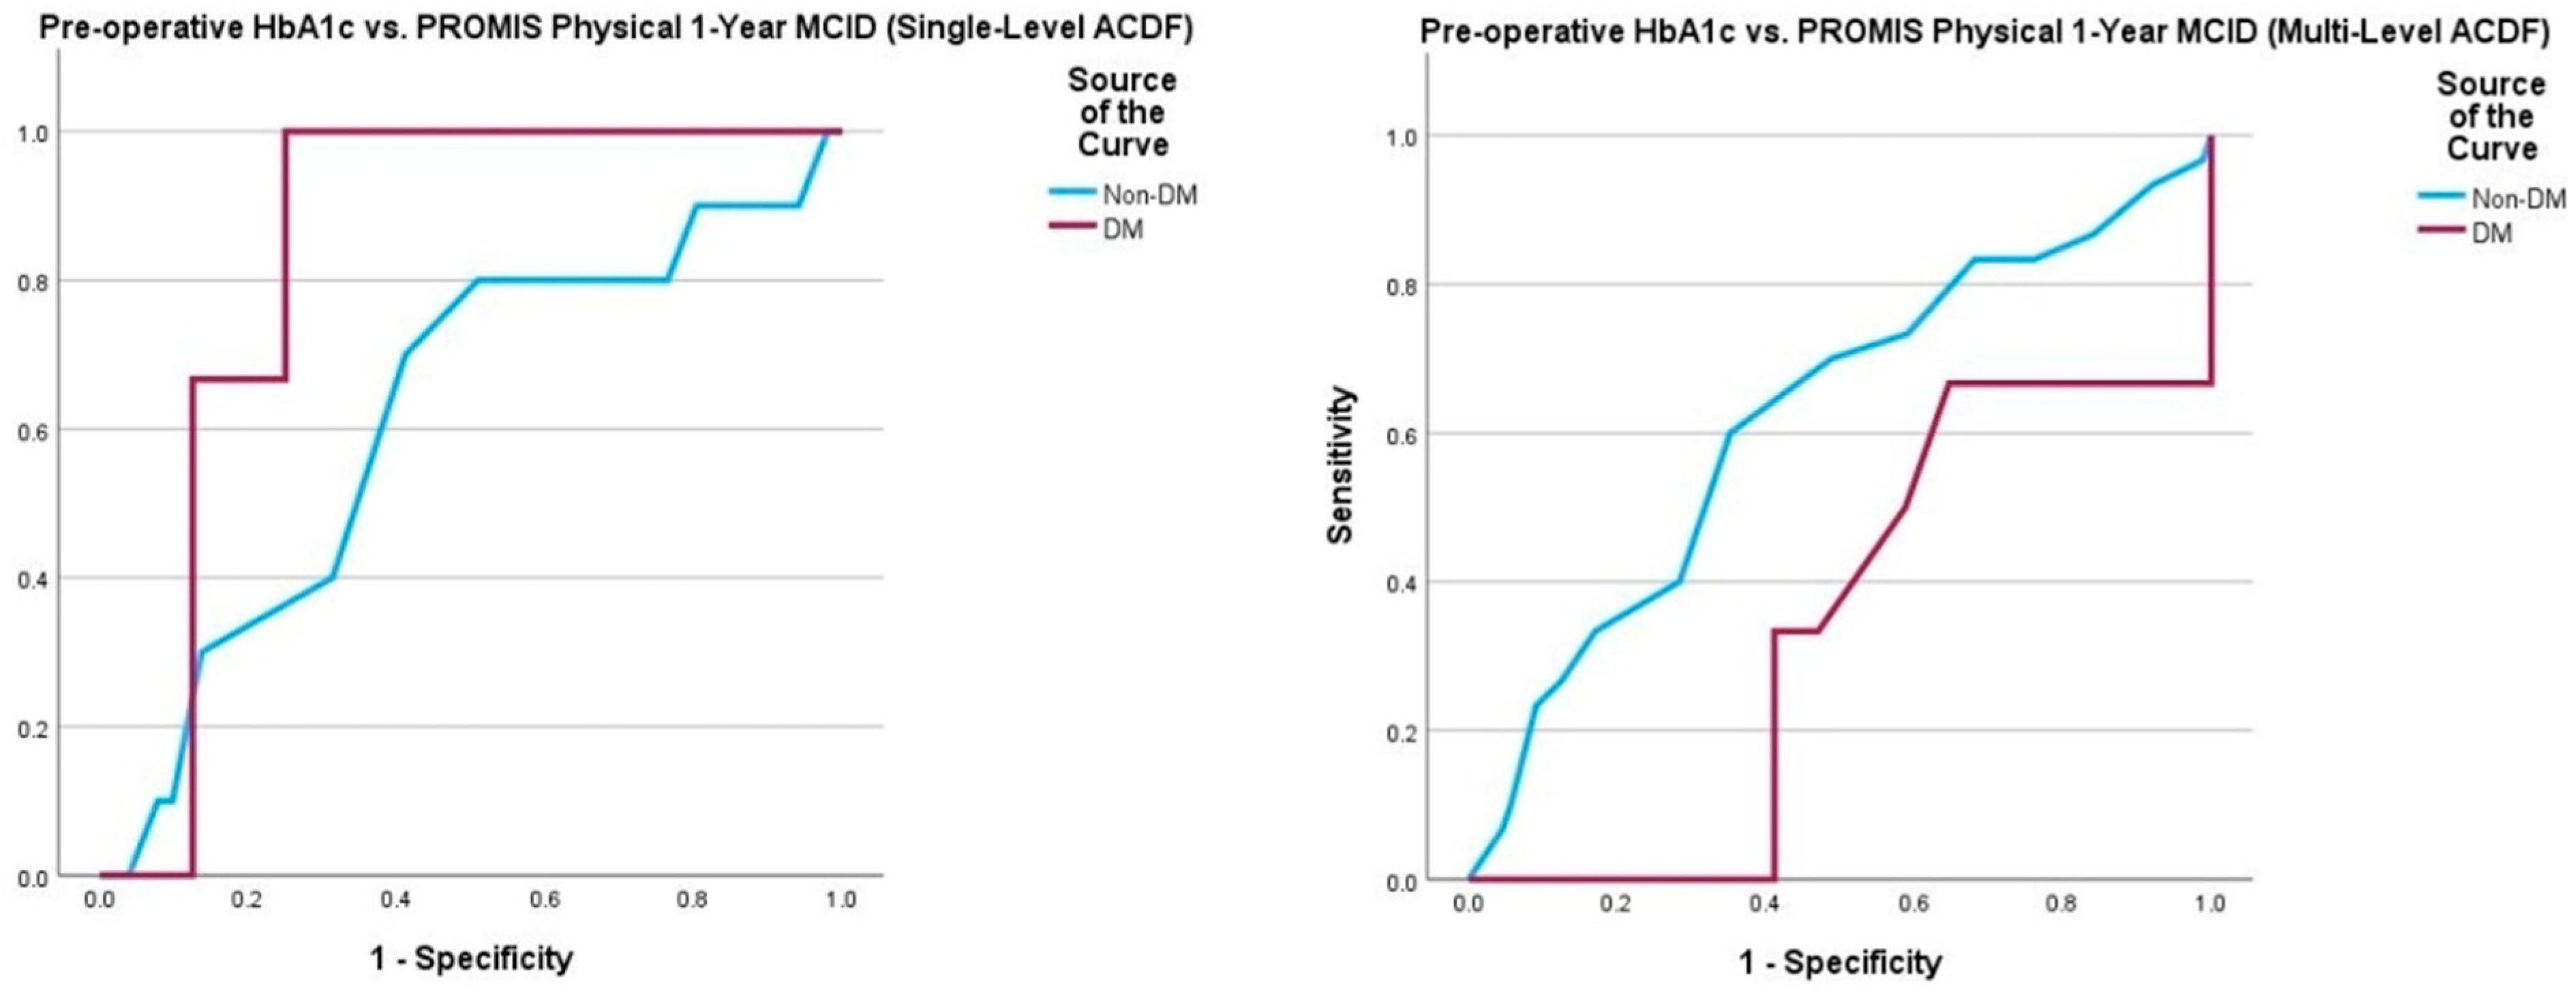
| PROMIS Physical (Non-DM) | 57 | 0.619 | 0.098 | 5.15 5.55 | 0.90, 0.20 0.70, 0.59 | 174 | 0.621 | 0.049 | 5.15 5.95 | 0.89, 0.14 0.34, 0.84 |
| PROMIS Physical (DM) | 20 | 0.833 | 0.001 | 7.30 7.85 | 1.00, 0.25 0.67, 0.88 | 32 | 0.338 | 0.206 | 5.50 7.00 | 1.00, 0.00 0.67, 0.34 |
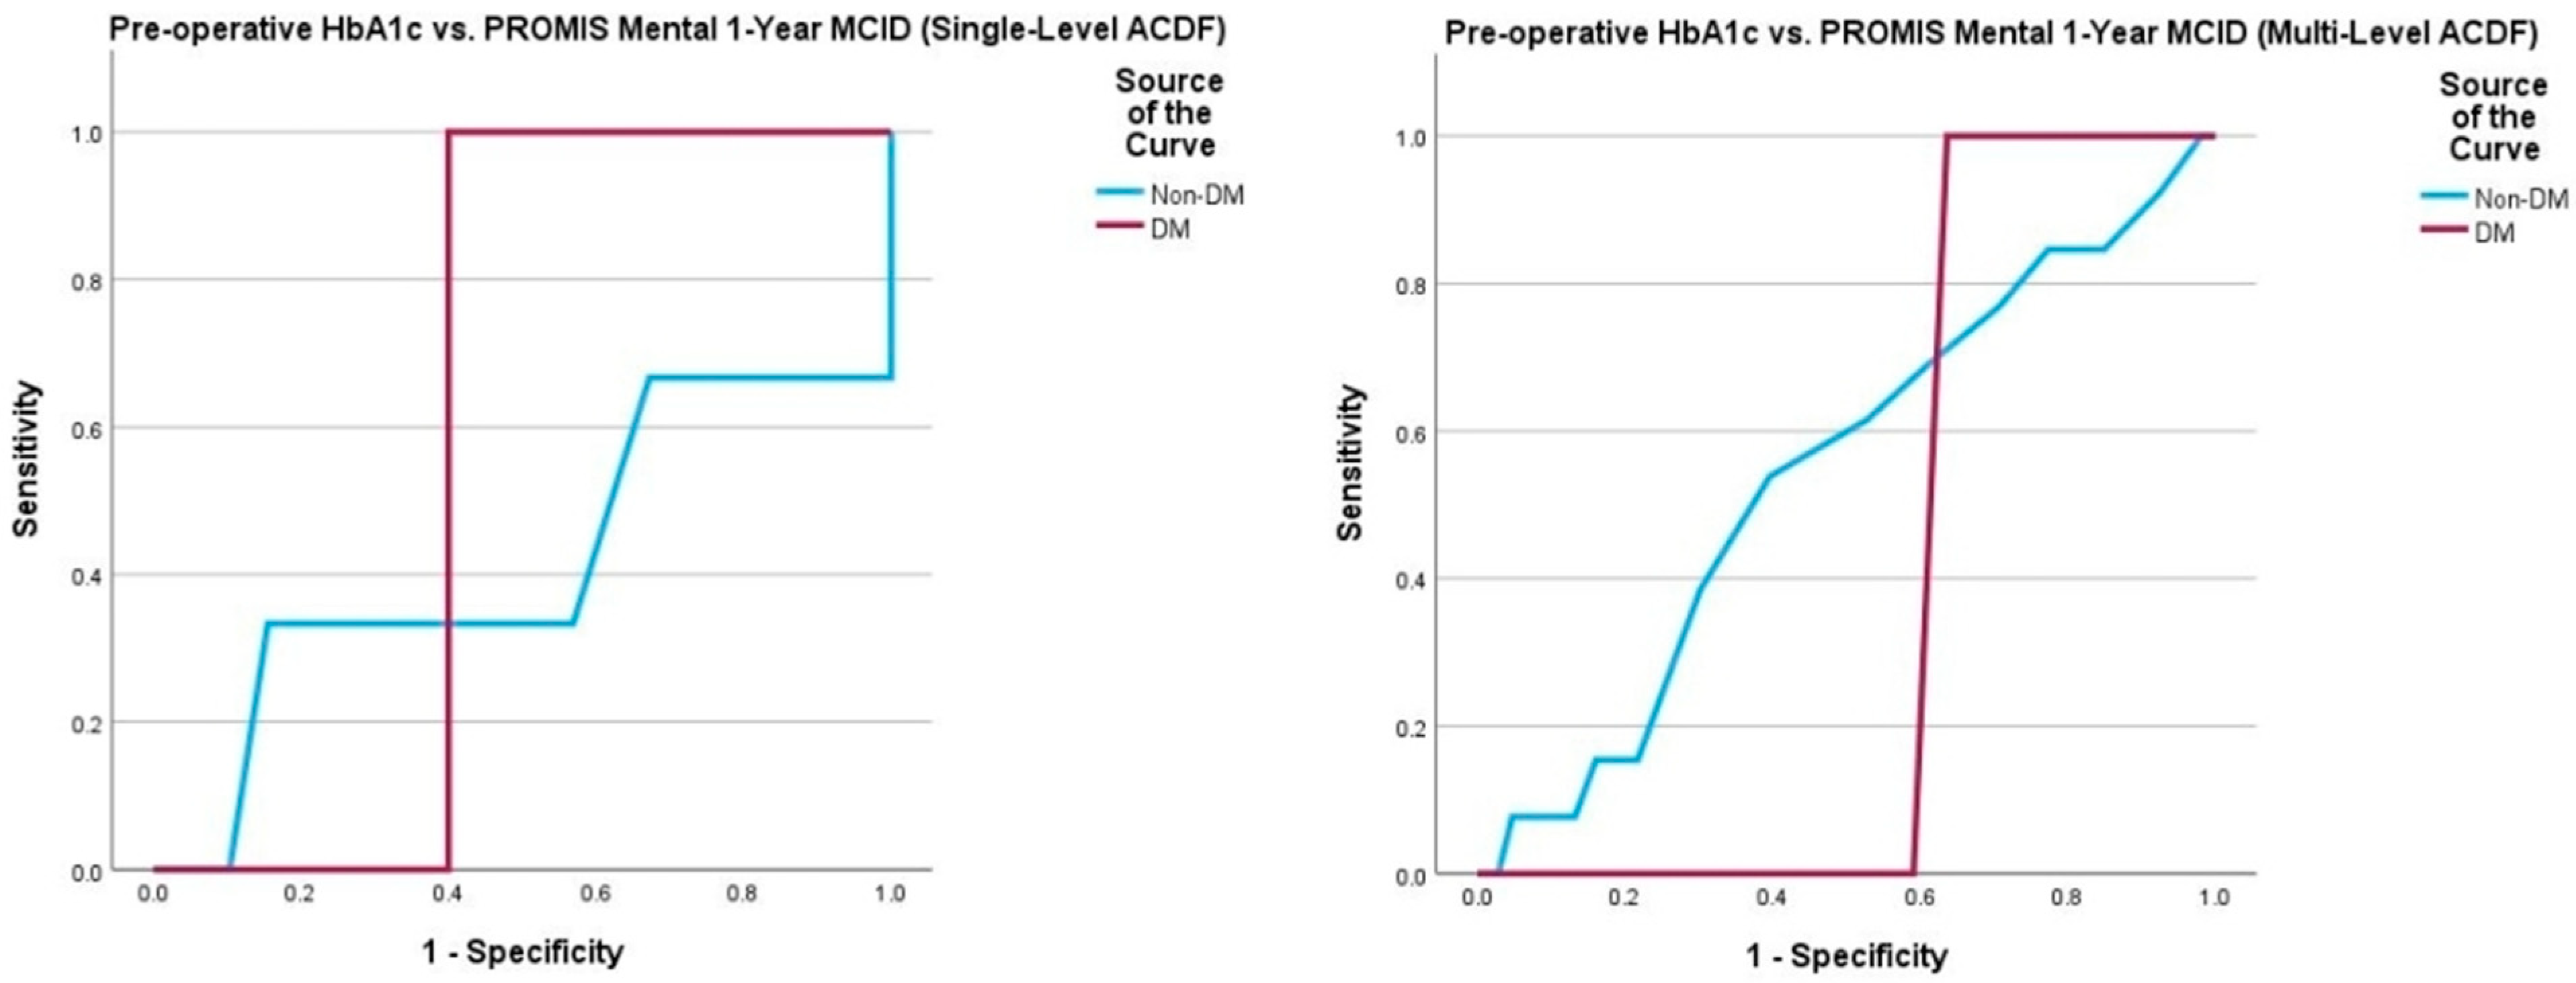
| PROMIS Mental (Non-DM) | 57 | 0.417 | 0.690 | 5.15 5.45 | 0.85, 0.15 0.70, 0.49 | 174 | 0.544 | 0.596 | 5.15 5.45 | 0.82, 0.75 0.79, 0.44 |
| PROMIS Mental (DM) | 20 | 0.600 | 0.519 | 7.30 - | 1.00, 0.40 - | 32 | 0.386 | 0.277 | 7.00 - | 1.00, 0.36 - |
Disclaimer/Publisher’s Note: The statements, opinions and data contained in all publications are solely those of the individual author(s) and contributor(s) and not of MDPI and/or the editor(s). MDPI and/or the editor(s) disclaim responsibility for any injury to people or property resulting from any ideas, methods, instructions or products referred to in the content. |
© 2025 by the authors. Licensee MDPI, Basel, Switzerland. This article is an open access article distributed under the terms and conditions of the Creative Commons Attribution (CC BY) license (https://creativecommons.org/licenses/by/4.0/).
Share and Cite
Khoylyan, A.; Coleman, N.; Parry, M.; Tang, A.; Chen, T. Effects of Pre-Operative HbA1c on Outcomes and the Rate of Clinical Improvement Following Anterior Cervical Discectomy and Fusion. J. Clin. Med. 2025, 14, 4589. https://doi.org/10.3390/jcm14134589
Khoylyan A, Coleman N, Parry M, Tang A, Chen T. Effects of Pre-Operative HbA1c on Outcomes and the Rate of Clinical Improvement Following Anterior Cervical Discectomy and Fusion. Journal of Clinical Medicine. 2025; 14(13):4589. https://doi.org/10.3390/jcm14134589
Chicago/Turabian StyleKhoylyan, Ara, Noah Coleman, Matthew Parry, Alex Tang, and Tan Chen. 2025. "Effects of Pre-Operative HbA1c on Outcomes and the Rate of Clinical Improvement Following Anterior Cervical Discectomy and Fusion" Journal of Clinical Medicine 14, no. 13: 4589. https://doi.org/10.3390/jcm14134589
APA StyleKhoylyan, A., Coleman, N., Parry, M., Tang, A., & Chen, T. (2025). Effects of Pre-Operative HbA1c on Outcomes and the Rate of Clinical Improvement Following Anterior Cervical Discectomy and Fusion. Journal of Clinical Medicine, 14(13), 4589. https://doi.org/10.3390/jcm14134589