Establishment of Normative Retinal Nerve Fiber Layer Thickness in Healthy Koreans Using Huvitz Optical Coherence Tomography and Comparison with Cirrus OCT


Abstract
1. Introduction
2. Materials and Methods
2.1. Study Design and Participants
2.2. Ophthalmic Examination
2.3. Optical Coherence Tomography
2.4. Statistical Analysis
3. Results
3.1. Baseline Characteristics and Population Distribution
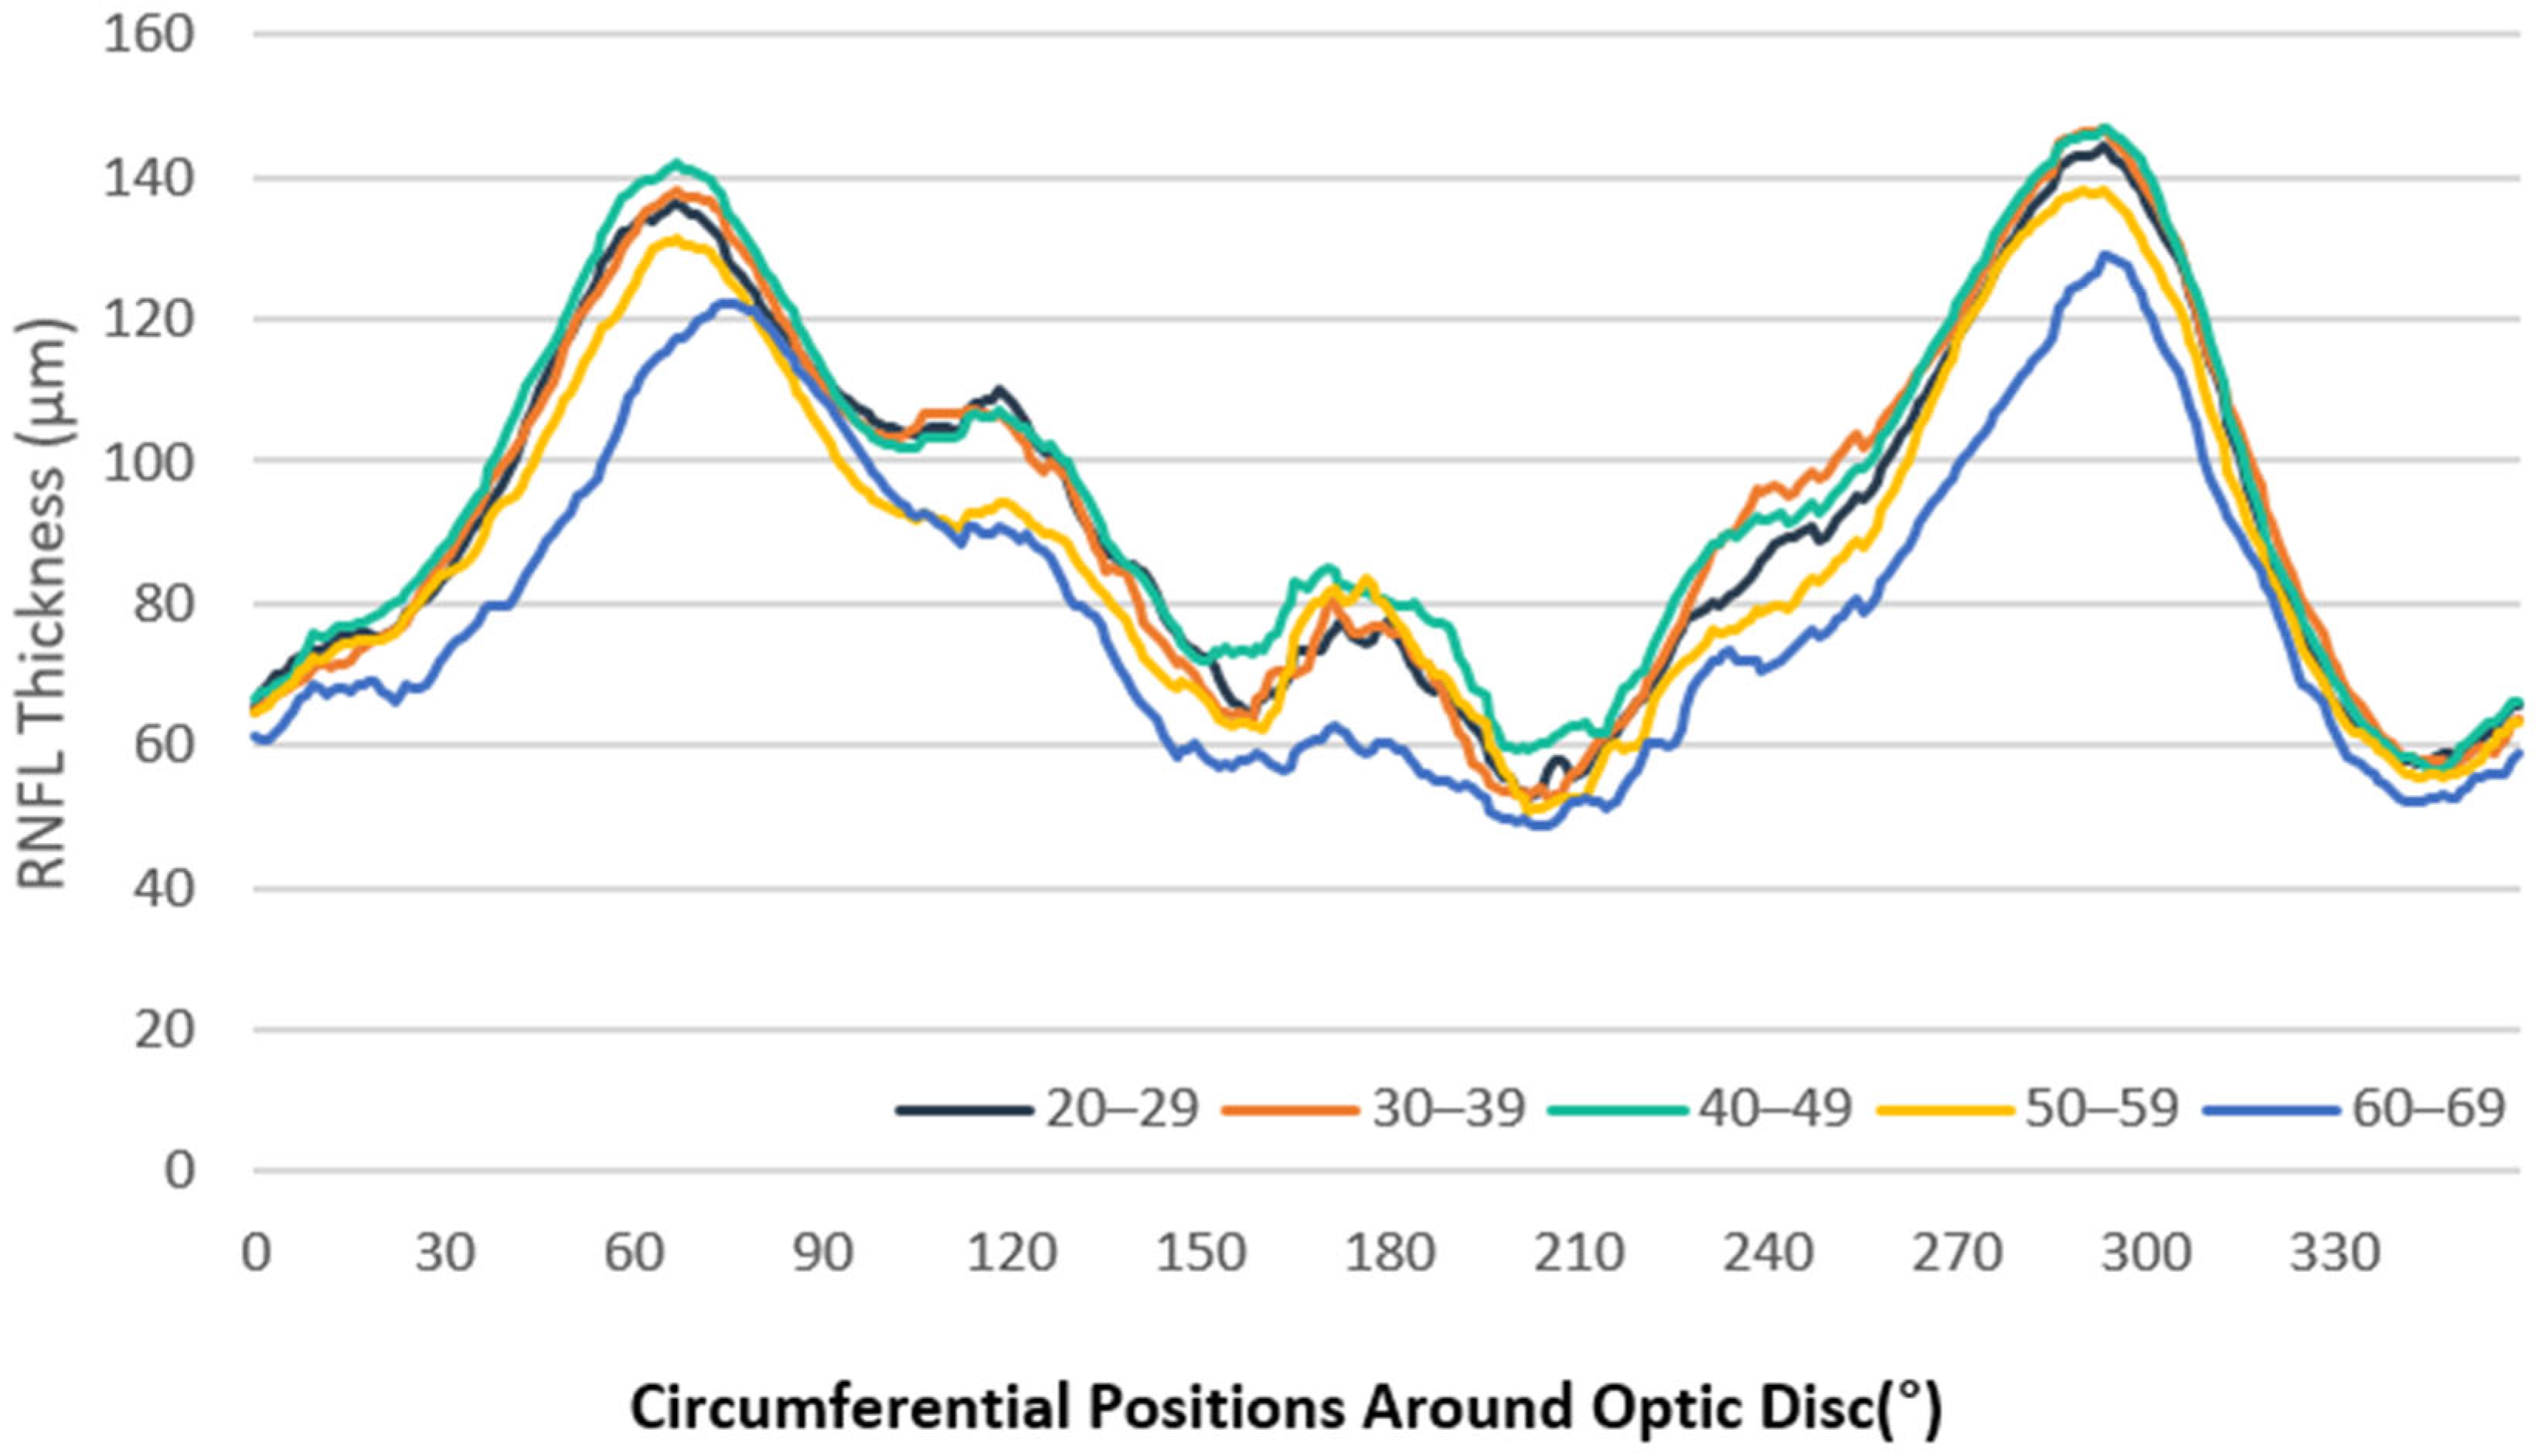
3.2. RNFL Thickness Measurements
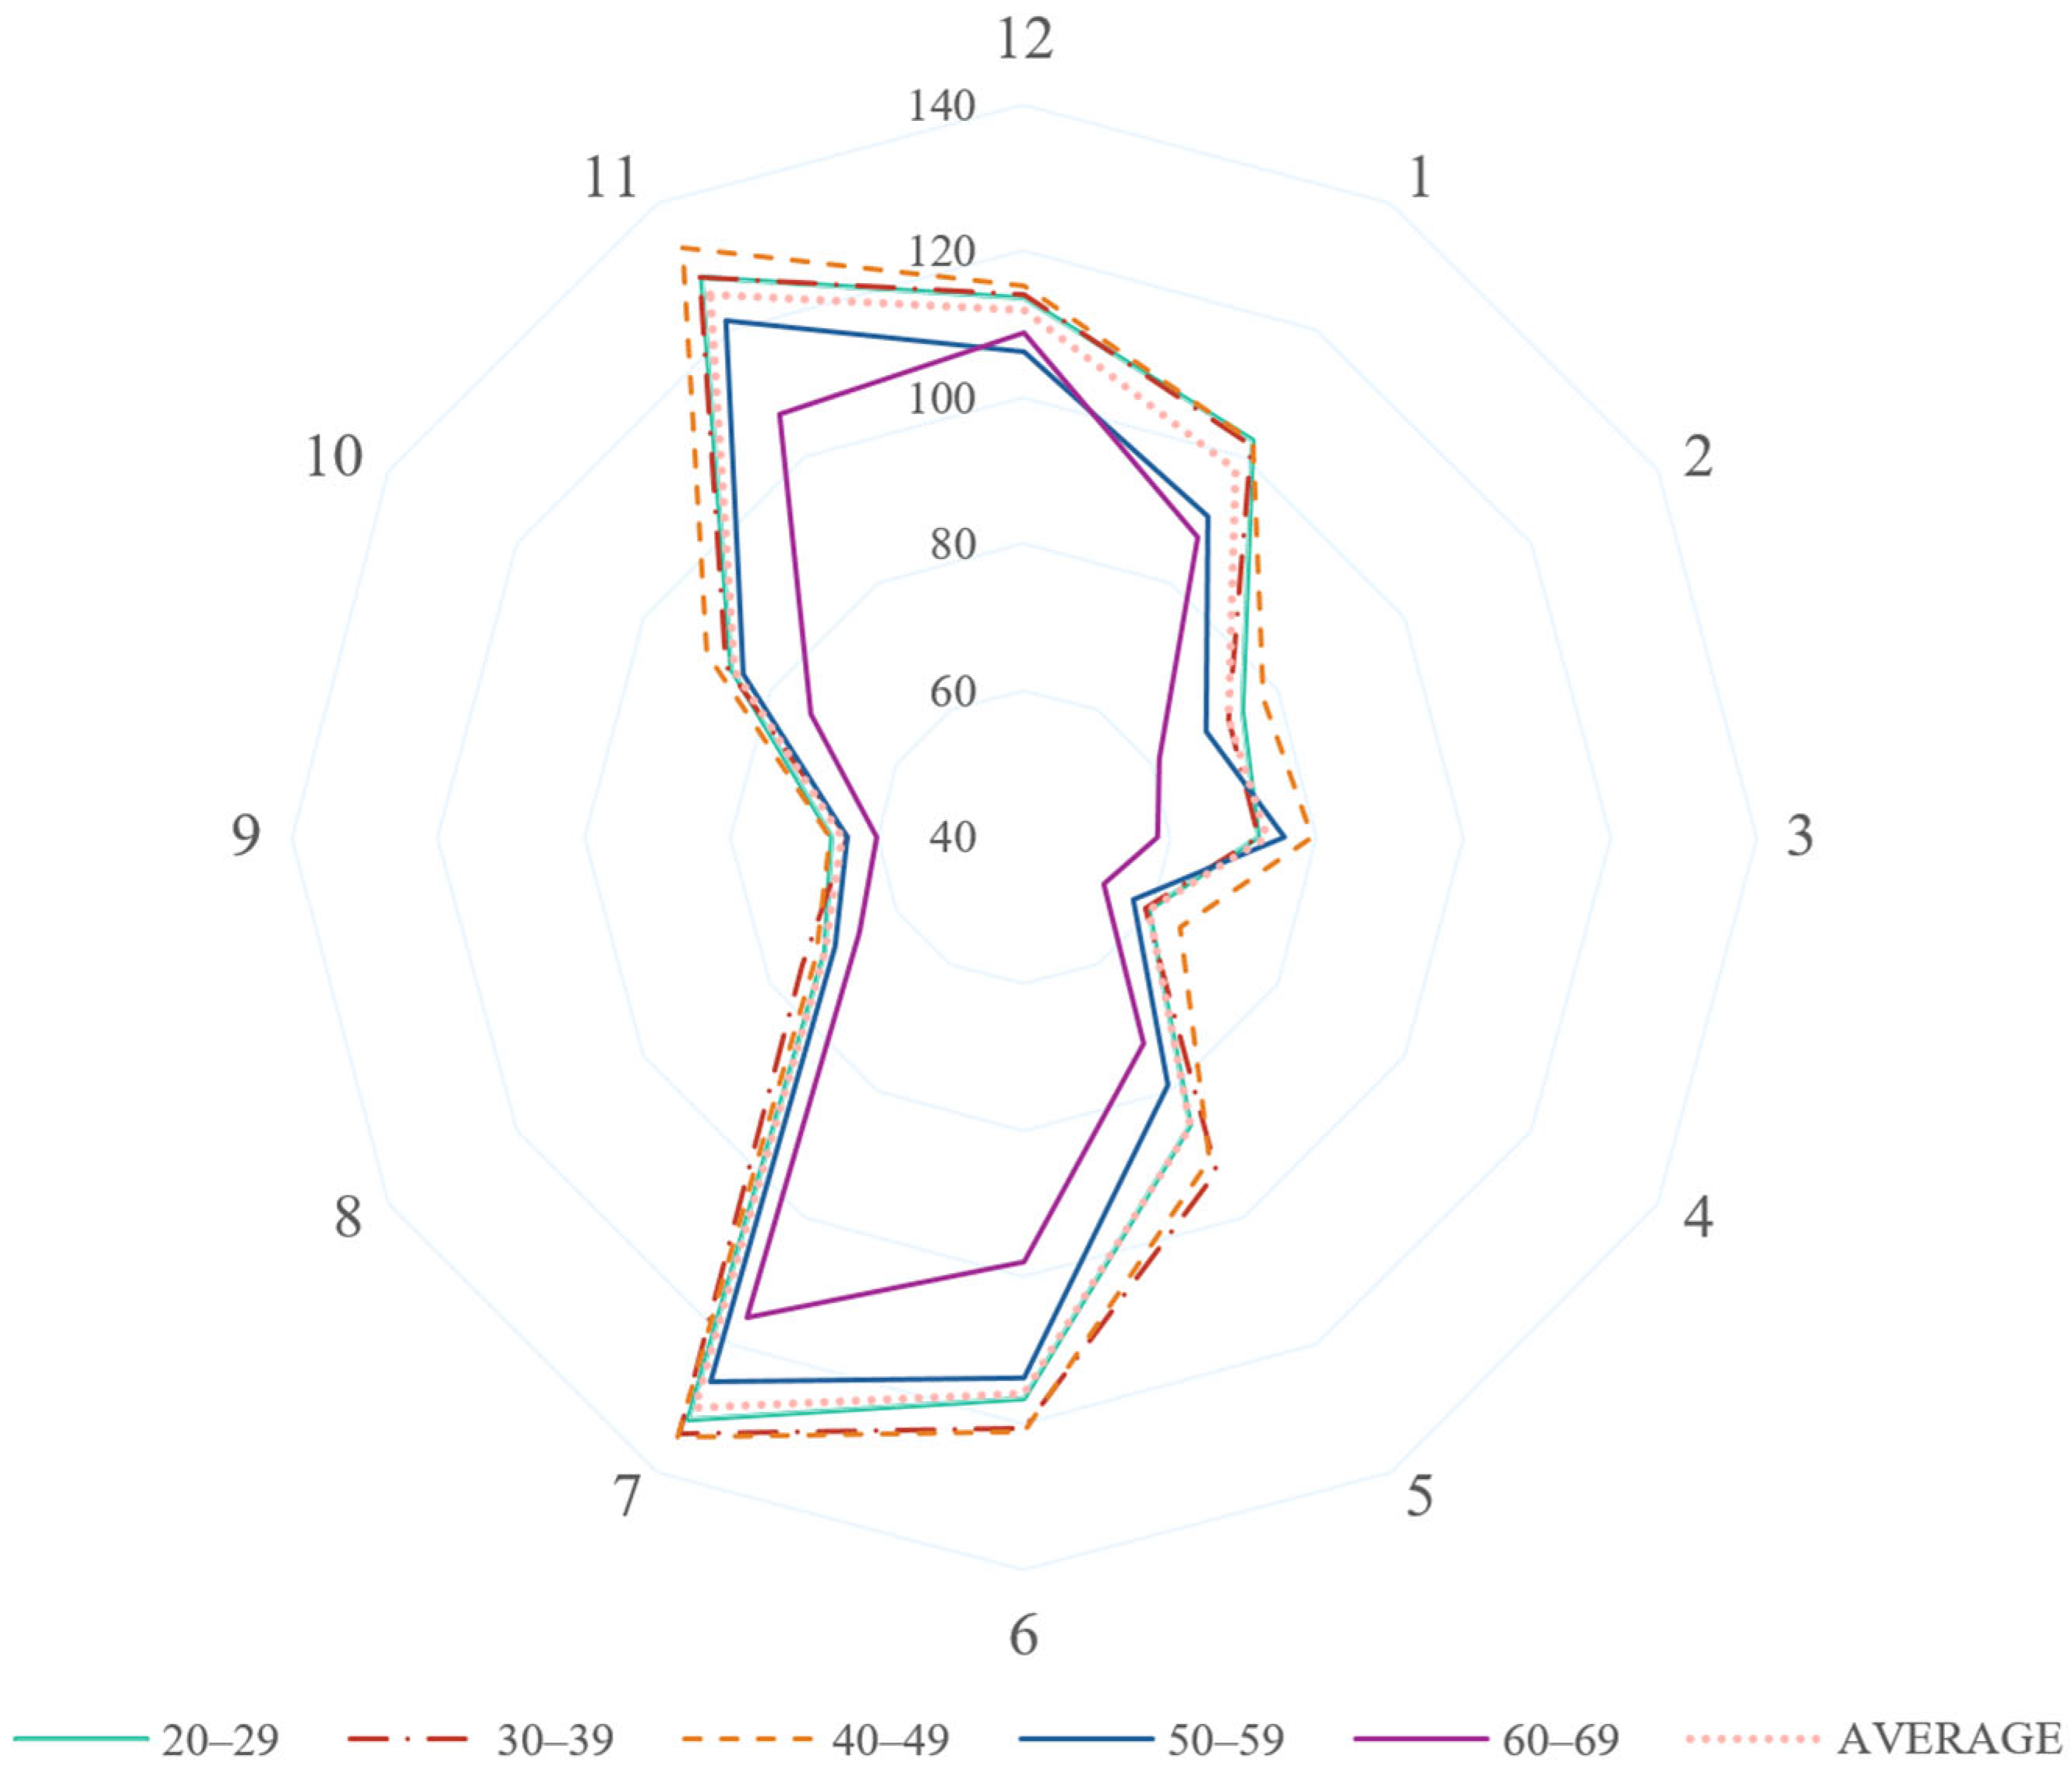
3.3. Analysis by Clock-Hour Sectors
3.4. Correlation Analysis
3.5. Macular Thickness Measurement
3.6. Comparison of RNFL Thickness Measurements
4. Discussion
5. Conclusions
Supplementary Materials
Author Contributions
Funding
Institutional Review Board Statement
Informed Consent Statement
Data Availability Statement
Conflicts of Interest
Correction Statement
References
- Allison, K.; Patel, D.; Alabi, O. Epidemiology of Glaucoma: The Past, Present, and Predictions for the Future. Cureus 2020, 12, e11686. [Google Scholar] [CrossRef] [PubMed]
- Tham, Y.C.; Li, X.; Wong, T.Y.; Quigley, H.A.; Aung, T.; Cheng, C.Y. Global prevalence of glaucoma and projections of glaucoma burden through 2040: A systematic review and meta-analysis. Ophthalmology 2014, 121, 2081–2090. [Google Scholar] [CrossRef]
- Jonas, J.B.; Aung, T.; Bourne, R.R.; Bron, A.M.; Ritch, R.; Panda-Jonas, S. Glaucoma. Lancet 2017, 390, 2183–2193. [Google Scholar] [CrossRef]
- Bussel, I.I.; Wollstein, G.; Schuman, J.S. OCT for glaucoma diagnosis, screening and detection of glaucoma progression. Br. J. Ophthalmol. 2014, 98 (Suppl. 2), ii15–ii19. [Google Scholar] [CrossRef] [PubMed]
- Nouri-Mahdavi, K.; Hoffman, D.; Tannenbaum, D.P.; Law, S.K.; Caprioli, J. Identifying early glaucoma with optical coherence tomography. Am. J. Ophthalmol. 2004, 137, 228–235. [Google Scholar] [CrossRef]
- Geevarghese, A.; Wollstein, G.; Ishikawa, H.; Schuman, J.S. Optical Coherence Tomography and Glaucoma. Annu. Rev. Vis. Sci. 2021, 7, 693–726. [Google Scholar] [CrossRef] [PubMed]
- Fort, P.E.; Kansal, V.; Armstrong, J.J.; Pintwala, R.; Hutnik, C. Optical coherence tomography for glaucoma diagnosis: An evidence based meta-analysis. PLoS ONE 2018, 13, e0190621. [Google Scholar]
- Scuderi, G.; Fragiotta, S.; Scuderi, L.; Iodice, C.M.; Perdicchi, A. Ganglion Cell Complex Analysis in Glaucoma Patients: What Can It Tell Us? Eye Brain 2020, 12, 33–44. [Google Scholar] [CrossRef] [PubMed]
- Kim, H.J.; Lee, S.-Y.; Park, K.H.; Kim, D.M.; Jeoung, J.W. Glaucoma Diagnostic Ability of Layer-by-Layer Segmented Ganglion Cell Complex by Spectral-Domain Optical Coherence Tomography. Investig. Ophthalmol. Vis. Sci. 2016, 57, 4799–4805. [Google Scholar] [CrossRef]
- Savini, G.; Carbonelli, M.; Barboni, P. Spectral-domain optical coherence tomography for the diagnosis and follow-up of glaucoma. Curr. Opin. Ophthalmol. 2011, 22, 115–123. [Google Scholar] [CrossRef]
- Tao, Y.L.; Tao, L.M.; Jiang, Z.X.; Liu, H.T.; Liang, K.; Li, M.H.; Zhu, X.S.; Ren, Y.L.; Cui, B.J. Parameters of ocular fundus on spectral-domain optical coherence tomography for glaucoma diagnosis. Int. J. Ophthalmol. 2017, 10, 982–991. [Google Scholar] [PubMed]
- Alasil, T.; Wang, K.; Keane, P.A.; Lee, H.; Baniasadi, N.; de Boer, J.F.; Chen, T.C. Analysis of Normal Retinal Nerve Fiber Layer Thickness by Age, Sex, and Race Using Spectral Domain Optical Coherence Tomography. J. Glaucoma 2013, 22, 532–541. [Google Scholar] [CrossRef]
- Girkin, C.A.; McGwin, G.; Sinai, M.J.; Sekhar, G.C.; Fingeret, M.; Wollstein, G.; Varma, R.; Greenfield, D.; Liebmann, J.; Araie, M.; et al. Variation in Optic Nerve and Macular Structure with Age and Race with Spectral-Domain Optical Coherence Tomography. Ophthalmology 2011, 118, 2403–2408. [Google Scholar] [CrossRef]
- Poon, L.Y.-C.; Antar, H.; Tsikata, E.; Guo, R.; Papadogeorgou, G.; Freeman, M.; Khoueir, Z.; Lee, R.; Shieh, E.; Simavli, H.; et al. Effects of Age, Race, and Ethnicity on the Optic Nerve and Peripapillary Region Using Spectral-Domain OCT 3D Volume Scans. Transl. Vis. Sci. Technol. 2018, 7, 12. [Google Scholar] [CrossRef]
- Celebi, A.R.; Mirza, G.E. Age-related change in retinal nerve fiber layer thickness measured with spectral domain optical coherence tomography. Investig. Ophthalmol. Vis. Sci. 2013, 54, 8095–8103. [Google Scholar] [CrossRef] [PubMed]
- Lee, J.Y.; Hwang, Y.H.; Lee, S.M.; Kim, Y.Y. Age and retinal nerve fiber layer thickness measured by spectral domain optical coherence tomography. Korean J. Ophthalmol. 2012, 26, 163–168. [Google Scholar] [CrossRef] [PubMed]
- Hong, S.; Kim, S.-M.; Park, K.; Lee, J.M.; Kim, C.Y.; Seong, G.J. Adjusted color probability codes for peripapillary retinal nerve fiber layer thickness in healthy Koreans. BMC Ophthalmol. 2014, 14, 38. [Google Scholar] [CrossRef]
- Parikh, R.S.; Parikh, S.R.; Sekhar, G.C.; Prabakaran, S.; Babu, J.G.; Thomas, R. Normal Age-Related Decay of Retinal Nerve Fiber Layer Thickness. Ophthalmology 2007, 114, 921–926. [Google Scholar] [CrossRef]
- Feuer, W.J.; Budenz, D.L.; Anderson, D.R.; Cantor, L.; Greenfield, D.S.; Savell, J.; Schuman, J.S.; Varma, R. Topographic differences in the age-related changes in the retinal nerve fiber layer of normal eyes measured by Stratus optical coherence tomography. J. Glaucoma 2011, 20, 133–138. [Google Scholar] [CrossRef]
- Peng, P.H.; Hsu, S.Y.; Wang, W.S.; Ko, M.L. Age and axial length on peripapillary retinal nerve fiber layer thickness measured by optical coherence tomography in nonglaucomatous Taiwanese participants. PLoS ONE 2017, 12, e0179320. [Google Scholar] [CrossRef]
- Kanamori, A.; Escano, M.F.; Eno, A.; Nakamura, M.; Maeda, H.; Seya, R.; Ishibashi, K.; Negi, A. Evaluation of the effect of aging on retinal nerve fiber layer thickness measured by optical coherence tomography. Ophthalmologica 2003, 217, 273–278. [Google Scholar] [CrossRef] [PubMed]
- Budenz, D.L.; Anderson, D.R.; Varma, R.; Schuman, J.; Cantor, L.; Savell, J.; Greenfield, D.S.; Patella, V.M.; Quigley, H.A.; Tielsch, J. Determinants of Normal Retinal Nerve Fiber Layer Thickness Measured by Stratus OCT. Ophthalmology 2007, 114, 1046–1052. [Google Scholar] [CrossRef]
- Alamouti, B.; Funk, J. Retinal thickness decreases with age: An OCT study. Br. J. Ophthalmol. 2003, 87, 899–901. [Google Scholar] [CrossRef] [PubMed]
- Sung, K.R.; Wollstein, G.; Bilonick, R.A.; Townsend, K.A.; Ishikawa, H.; Kagemann, L.; Noecker, R.J.; Fujimoto, J.G.; Schuman, J.S. Effects of Age on Optical Coherence Tomography Measurements of Healthy Retinal Nerve Fiber Layer, Macula, and Optic Nerve Head. Ophthalmology 2009, 116, 1119–1124. [Google Scholar] [CrossRef]
- Bendschneider, D.; Tornow, R.P.; Horn, F.K.; Laemmer, R.; Roessler, C.W.; Juenemann, A.G.; Kruse, F.E.; Mardin, C.Y. Retinal Nerve Fiber Layer Thickness in Normals Measured by Spectral Domain OCT. J. Glaucoma 2010, 19, 475–482. [Google Scholar] [CrossRef]
- Kampougeris, G.; Spyropoulos, D.; Mitropoulou, A.; Zografou, A.; Kosmides, P. Peripapillary retinal nerve fibre layer thickness measurement with SD-OCT in normal and glaucomatous eyes: Distribution and correlation with age. Int. J. Ophthalmol. 2013, 6, 662–665. [Google Scholar]
- Eriksson, U.; Alm, A. Macular thickness decreases with age in normal eyes: A study on the macular thickness map protocol in the Stratus OCT. Br. J. Ophthalmol. 2009, 93, 1448–1452. [Google Scholar] [CrossRef] [PubMed]
- Leung, C.K.S.; Yu, M.; Weinreb, R.N.; Ye, C.; Liu, S.; Lai, G.; Lam, D.S.C. Retinal Nerve Fiber Layer Imaging with Spectral-Domain Optical Coherence Tomography. Ophthalmology 2012, 119, 731–737. [Google Scholar] [CrossRef]
- Hirasawa, H.; Tomidokoro, A.; Araie, M.; Konno, S.; Saito, H.; Iwase, A.; Shirakashi, M.; Abe, H.; Ohkubo, S.; Sugiyama, K.; et al. Peripapillary Retinal Nerve Fiber Layer Thickness Determined by Spectral-Domain Optical Coherence Tomography in Ophthalmologically Normal Eyes. Arch. Ophthalmol. 2010, 128, 1420–1426. [Google Scholar] [CrossRef]
- Wang, Y.X.; Pan, Z.; Zhao, L.; You, Q.S.; Xu, L.; Jonas, J.B. Retinal nerve fiber layer thickness. The Beijing Eye Study 2011. PLoS ONE 2013, 8, e66763. [Google Scholar] [CrossRef]
- Huvitz Inc. Huvitz HRK-9000A User Manual; Huvitz Inc.: Gunpo, Republic of Korea, 2020. [Google Scholar]
- Statistics Korea. Age and Sex distribution of South Korea; Statistics Korea: Daejeon, Republic of Korea, 2016.
- Jonas, J.B.; Schmidt, A.M.; Muller-Bergh, J.A.; Schlotzer-Schrehardt, U.M.; Naumann, G.O. Human optic nerve fiber count and optic disc size. Investig. Ophthalmol. Vis. Sci. 1992, 33, 2012–2018. [Google Scholar]
- FitzGibbon, T.; Taylor, S.F. Mean retinal ganglion cell axon diameter varies with location in the human retina. Jpn. J. Ophthalmol. 2012, 56, 631–637. [Google Scholar] [CrossRef] [PubMed]
- Tan, B.B.; Natividad, M.; Chua, K.C.; Yip, L.W. Comparison of retinal nerve fiber layer measurement between 2 spectral domain OCT instruments. J. Glaucoma 2012, 21, 266–273. [Google Scholar] [CrossRef] [PubMed]
- Domínguez-Vicent, A.; Brautaset, R.; Gustafsson, J. Precision and agreement of individual and simultaneous macular and optic disc volumetric measurements with spectral domain optical coherence tomography. Front. Med. 2021, 8, 764236. [Google Scholar] [CrossRef]

| Baseline Characteristics | |||||||||||
|---|---|---|---|---|---|---|---|---|---|---|---|
| Parameters | |||||||||||
| Number of eyes | 262 | ||||||||||
| Age, mean (SD), range | 43.65 (12.89), 20–69 | ||||||||||
| Sex (M/F) | 135/127 | ||||||||||
| Laterality (R/L) | 133/129 | ||||||||||
| Disc Area (mm2), mean (SD) | 1.95 (0.53) | ||||||||||
| Rim area (mm2), mean (SD) | 0.89 (0.32) | ||||||||||
| Cup volume (mm3), mean (SD) | 0.26 (0.22) | ||||||||||
| Disc volume (mm3), mean (SD) | 0.11 (0.53) | ||||||||||
| Population Distribution | |||||||||||
| Age Group (N) | 20s (29) | 30s (29) | 40s (40) | 50s (31) | 60s (19) | p-Value | |||||
| Distribution Percentage (%) | 19.59% (18% §) | 19.59% (21% §) | 27.03% (24% §) | 20.95% (23% §) | 12.84% (15% §) | ||||||
| Sex | F | M | F | M | F | M | F | M | F | M | 0.904 |
| Subjects (N) | 15 | 14 | 13 | 16 | 20 | 20 | 13 | 18 | 11 | 8 | |
| Eyes (N) | 24 | 25 | 24 | 27 | 37 | 39 | 23 | 31 | 19 | 13 | |
| Age Group | RNFL Thickness (μm) | ||||
|---|---|---|---|---|---|
| Average | Superior | Nasal | Inferior | Temporal | |
| All, mean (SD) | 91.13 (13.00) | 111.85 (18.53) | 68.35 (20.03) | 110.40 (19.90) | 73.93 (10.89) |
| 20–29, mean (SD) | 92.35 (10.24) | 114.74 (15.27) | 68.74 (20.62) | 111.30 (17.26) | 74.62 (11.14) |
| 30–39, mean (SD) | 93.39 (15.50) | 114.68 (22.63) | 67.75 (21.14) | 115.75 (25.45) | 75.36 (9.10) |
| 40–49, mean (SD) | 95.69 (10.32) | 116.87 (13.20) | 73.89 (20.85) | 115.48 (16.33) | 76.51 (10.31) |
| 50–59, mean (SD) | 88.04 (10.89) | 105.98 (15.93) | 67.22 (17.65) | 106.24 (17.06) | 72.73 (10.24) |
| 60–69, mean (SD) | 80.07 (14.32) | 100.91 (24.04) | 57.44 (14.60) | 95.46 (17.72) | 66.47 (12.50) |
| Age Group | Clock Hour Sector | RNFL Thickness (μm), Mean (SD) | Clock Hour Sector | RNFL Thickness (μm), Mean (SD) |
|---|---|---|---|---|
| All | 12 | 112.02 (25.07) | 6 | 115.88 (27.48) |
| 1 | 98.00 (23.82) | 7 | 129.82 (21.35) | |
| 2 | 72.20 (23.62) | 8 | 71.50 (13.27) | |
| 3 | 73.18 (28.48) | 9 | 64.75 (10.05) | |
| 4 | 59.66 (19.12) | 10 | 85.53 (16.05) | |
| 5 | 85.51 (22.76) | 11 | 125.54 (22.67) | |
| 20–29 | 12 | 113.54 (22.86) | 6 | 116.65 (24.83) |
| 1 | 102.54 (23.36) | 7 | 131.85 (20.95) | |
| 2 | 74.56 (22.24) | 8 | 71.45 (11.52) | |
| 3 | 71.91 (28.46) | 9 | 66.30 (10.00) | |
| 4 | 59.74 (20.96) | 10 | 86.11 (16.81) | |
| 5 | 85.40 (20.46) | 11 | 128.13 (19.35) | |
| 30–39 | 12 | 113.95 (30.98) | 6 | 120.68 (34.15) |
| 1 | 101.86 (28.66) | 7 | 133.89 (24.28) | |
| 2 | 72.13 (26.15) | 8 | 75.01 (12.99) | |
| 3 | 71.98 (29.51) | 9 | 64.15 (8.51) | |
| 4 | 59.15 (20.67) | 10 | 86.92 (12.33) | |
| 5 | 92.66 (29.68) | 11 | 128.23 (21.83) | |
| 40–49 | 12 | 115.23 (23.31) | 6 | 121.06 (24.37) |
| 1 | 102.37 (18.35) | 7 | 134.59 (18.81) | |
| 2 | 77.71 (23.25) | 8 | 72.85 (13.31) | |
| 3 | 79.36 (30.54) | 9 | 66.56 (10.32) | |
| 4 | 64.61 (18.91) | 10 | 90.11 (14.91) | |
| 5 | 90.79 (19.42) | 11 | 133.02 (18.82) | |
| 50–59 | 12 | 106.22 (20.85) | 6 | 113.91 (25.8) |
| 1 | 90.42 (22.98) | 7 | 125.72 (16.61) | |
| 2 | 68.82 (22.45) | 8 | 69.71 (13.31) | |
| 3 | 75.60 (27.31) | 9 | 64.15 (10.04) | |
| 4 | 57.25 (17.47) | 10 | 84.34 (14.71) | |
| 5 | 79.10 (19.03) | 11 | 121.29 (20.38) | |
| 60–69 | 12 | 108.75 (27.82) | 6 | 98.07 (22.55) |
| 1 | 87.30 (23.82) | 7 | 115.78 (23.61) | |
| 2 | 61.34 (20.80) | 8 | 65.82 (14.46) | |
| 3 | 58.32 (17.31) | 9 | 60.01 (10.57) | |
| 4 | 52.65 (14.14) | 10 | 73.58 (19.36) | |
| 5 | 72.52 (19.06) | 11 | 106.68 (29.18) |
| Quadrant Sector | Correlation Coefficient with Age (p-Value) | Clock Hour Sector | Correlation Coefficient with Age (p-Value) |
|---|---|---|---|
| Average | −0.27 (<0.001) | 12 (Superior) | −0.08 (0.195) |
| Superior | −0.23 (<0.001) | 1 (Superior-Nasal) | −0.22 (<0.001) |
| Nasal | −0.12 (0.061) | 2 (Nasal-Superior) | −0.14 (0.02) |
| Inferior | −0.26 (<0.001) | 3 (Nasal) | −0.07 (0.29) |
| temporal | −0.20 (0.001) | 4 (Nasal-Inferior) | −0.09 (0.154) |
| 5 (Inferior-Nasal) | −0.23 (<0.001) | ||
| 6 (Inferior) | −0.20 (0.001) | ||
| 7 (Inferior-Temporal) | −0.24 (<0.001) | ||
| 8 (Temporal-Inferior) | −0.16 (0.011) | ||
| 9 (Temporal) | −0.14 (0.022) | ||
| 10 (Temporal-Superior) | −0.20 (0.001) | ||
| 11 (Superior-Temporal) | −0.25 (<0.001) |
| Sector | Macular Thickness (μm), Mean (SD) | ||||||
|---|---|---|---|---|---|---|---|
| All | 20–29 | 30–39 | 40–49 | 50–59 | 60–69 | ||
| Center | 243.70 (19.25) | 245.21 (17.89) | 241.61 (12.48) | 244.99 (19.63) | 247.62 (22.07) | 235.01 (22.12) | |
| Inner ring | Superior | 318.39 (14.72) | 316.10 (14.70) | 317.31 (14.25) | 321.69 (15.58) | 321.47 (13.73) | 310.59 (11.66) |
| Nasal | 321.76 (15.03) | 319.72 (15.34) | 321.40 (12.85) | 324.40 (16.11) | 324.55 (14.52) | 314.45 (13.84) | |
| Inferior | 318.02 (13.86) | 315.73 (13.46) | 319.46 (14.64) | 319.32 (14.17) | 319.97 (13.27) | 312.86 (12.47) | |
| Temporal | 305.12 (14.11) | 302.05 (14.21) | 303.94 (13.56) | 307.30 (15.30) | 308.64 (13.27) | 300.61 (11.34) | |
| Outer ring | Superior | 277.09 (13.05) | 273.83 (11.50) | 277.82 (14.62) | 280.29 (14.42) | 277.45 (10.50) | 272.73 (11.44) |
| Nasal | 297.01 (14.58) | 294.40 (12.26) | 297.52 (15.29) | 300.67 (15.01) | 298.09 (13.11) | 289.69 (15.47) | |
| Inferior | 263.90 (13.38) | 260.48 (11.46) | 264.56 (16.28) | 266.06 (13.57) | 264.74 (12.48) | 261.54 (11.26) | |
| Temporal | 253.34 (12.17) | 249.64 (11.92) | 254.97 (13.75) | 255.10 (12.66) | 254.71 (10.87) | 249.95 (9.08) | |
| Layer | Sector | All | 20–29 | 30–39 | 40–49 | 50–59 | 60–69 |
|---|---|---|---|---|---|---|---|
| GCC (μm), mean (SD) | Average | 111.70 (7.47) | 110.11 (6.94) | 112.86 (7.29) | 113.42 (8.14) | 111.19 (7.11) | 109.06 (6.51) |
| Superior | 115.76 (8.47) | 114.29 (8.31) | 116.26 (8.15) | 118.24 (9.07) | 115.13 (7.61) | 112.35 (7.71) | |
| S_N | 118.61 (8.46) | 118.27 (8.27) | 119.55 (7.54) | 120.41 (9.05) | 117.99 (8.14) | 114.41 (8.06) | |
| N_I | 118.21 (8.20) | 117.52 (7.26) | 119.94 (7.82) | 119.80 (8.98) | 117.49 (7.76) | 113.92 (7.53) | |
| Inferior | 114.08 (8.26) | 112.27 (6.63) | 116.17 (8.30) | 115.28 (9.54) | 113.27 (7.51) | 112.04 (7.61) | |
| I_T | 103.02 (7.75) | 100.33 (6.85) | 104.34 (7.83) | 104.19 (8.31) | 102.84 (8.04) | 102.56 (6.24) | |
| T_S | 100.52 (7.62) | 97.98 (7.21) | 100.87 (7.16) | 102.58 (8.25) | 100.44 (7.95) | 99.08 (5.48) | |
| IPL (μm), mean (SD) | Average | 111.79 (7.49) | 110.18 (6.94) | 112.95 (7.32) | 113.52 (8.15) | 112.28 (7.11) | 109.17 (6.52) |
| Superior | 111.62 (7.74) | 110.17 (7.59) | 112.23 (7.29) | 113.73 (8.25) | 111.18 (7.41) | 108.63 (6.81) | |
| Inferior | 111.76 (7.62) | 110.02 (6.58) | 113.47 (7.59) | 113.08 (8.54) | 111.19 (7.21) | 109.51 (6.66) | |
| RPE (μm), mean (SD) | Average | 281.77 (11.91) | 278.84 (11.15) | 282.30 (13.22) | 284.34 (12.32) | 283.20 (10.66) | 276.87 (9.96) |
| Fovea | 196.32 (17.30) | 199.37 (16.75) | 189.76 (13.16) | 196.41 (16.28) | 201.43 (16.89) | 193.27 (23.17) | |
| Center | 243.70 (19.25) | 245.21 (17.89) | 241.61 (12.48) | 244.99 (19.63) | 247.62 (22.07) | 235.01 (22.12) | |
| Superior | 283.83 (12.32) | 281.02 (11.62) | 283.86 (12.91) | 287.00 (13.23) | 285.30 (10.61) | 278.10 (10.47) | |
| Inferior | 279.70 (12.80) | 276.68 (11.03) | 280.70 (13.83) | 281.67 (12.31) | 281.15 (11.26) | 275.61 (10.09) |
| Huvitz OCT Normative Date | Cirrus OCT Normative Data 1 | Cirrus OCT Normative Data 2 | p-Value 1 | p-Value 2 | ||
|---|---|---|---|---|---|---|
| Sample Size, Eyes, N | 262 | 295 | 302 | |||
| Age, mean (SD), range | 43.65 (12.89), 20–69 | 43.86 (10.33), 20–65 | 42.90 (16.15), 20–79 | 0.833 | 0.533 | |
| Population distribution, N (%) | 20s | 49 (18.70%) | 27 (9.15%) | 69 (22.85%) | <0.001 | 0.081 |
| 30s | 51 (19.47%) | 83 (28.14%) | 62 (20.53%) | |||
| 40s | 76 (29.01%) | 90 (30.51%) | 62 (20.53%) | |||
| 50s | 54 (20.61%) | 75 (25.42%) | 56 (18.54%) | |||
| 60s | 32 (12.21%) | 20 † (6.78%) | 53 ‡ (17.55%) | |||
| Sex (Male) N, (%) | 135 (51.53%) | 160 (54.24%) | - | 0.579 | - | |
| Laterality (OD) N, (%) | 133 (50.76%) | 147 (49.83%) | - | 0.893 | - | |
| Quadrants | RNFL thicknesses (μm) | Adjusted p-value 1 | Adjusted p-value 2 | |||
| Huvitz (N = 262) | Cirrus 1 (N = 295) | Cirrus 2 (N = 302) | ||||
| Mean average, mean (SD) | 91.13 (13.00) | 98.26 (9.27) | 95.08 (3.47) | <0.001 | <0.001 | |
| Superior, mean (SD) | 111.85 (18.53) | 124.71 (16.68) | 121.80 (5.71) | <0.001 | <0.001 | |
| Nasal, mean (SD) | 68.35 (20.03) | 69.24 (10.68) | 69.43 (1.77) | 0.521 | 0.385 | |
| Inferior, mean (SD) | 110.40 (19.90) | 128.45 (17.26) | 122.41 (4.79) | <0.001 | <0.001 | |
| Temporal, mean (SD) | 73.93 (10.89) | 70.52 (12.50) | 66.58 (2.29) | <0.001 | <0.001 | |
Disclaimer/Publisher’s Note: The statements, opinions and data contained in all publications are solely those of the individual author(s) and contributor(s) and not of MDPI and/or the editor(s). MDPI and/or the editor(s) disclaim responsibility for any injury to people or property resulting from any ideas, methods, instructions or products referred to in the content. |
© 2025 by the authors. Licensee MDPI, Basel, Switzerland. This article is an open access article distributed under the terms and conditions of the Creative Commons Attribution (CC BY) license (https://creativecommons.org/licenses/by/4.0/).
Share and Cite
Kim, H.; Park, J.E.; Choi, W. Establishment of Normative Retinal Nerve Fiber Layer Thickness in Healthy Koreans Using Huvitz Optical Coherence Tomography and Comparison with Cirrus OCT. J. Clin. Med. 2025, 14, 4258. https://doi.org/10.3390/jcm14124258
Kim H, Park JE, Choi W. Establishment of Normative Retinal Nerve Fiber Layer Thickness in Healthy Koreans Using Huvitz Optical Coherence Tomography and Comparison with Cirrus OCT. Journal of Clinical Medicine. 2025; 14(12):4258. https://doi.org/10.3390/jcm14124258
Chicago/Turabian StyleKim, Heesuk, Ji Eun Park, and Wungrak Choi. 2025. "Establishment of Normative Retinal Nerve Fiber Layer Thickness in Healthy Koreans Using Huvitz Optical Coherence Tomography and Comparison with Cirrus OCT" Journal of Clinical Medicine 14, no. 12: 4258. https://doi.org/10.3390/jcm14124258
APA StyleKim, H., Park, J. E., & Choi, W. (2025). Establishment of Normative Retinal Nerve Fiber Layer Thickness in Healthy Koreans Using Huvitz Optical Coherence Tomography and Comparison with Cirrus OCT. Journal of Clinical Medicine, 14(12), 4258. https://doi.org/10.3390/jcm14124258