
Assessing Highly Processed Food Consumption in Patients with Inflammatory Bowel Disease: Application of the German Screening Questionnaire (sQ-HPF)

 ,
,
Abstract
1. Introduction
2. Materials and Methods
2.1. Participants and Setting
2.1.1. Control Cohort
2.1.2. Terminology
2.2. Variables and Definitions
2.2.1. Data Sources/Measurements
2.2.2. Screening Questionnaire of Highly Processed Food Consumption
2.2.3. Percentage of Highly Processed Food Consumption
2.2.4. Laboratory Values
2.3. Statistical Analysis
2.3.1. Confounders and Bias
2.3.2. Sample Size
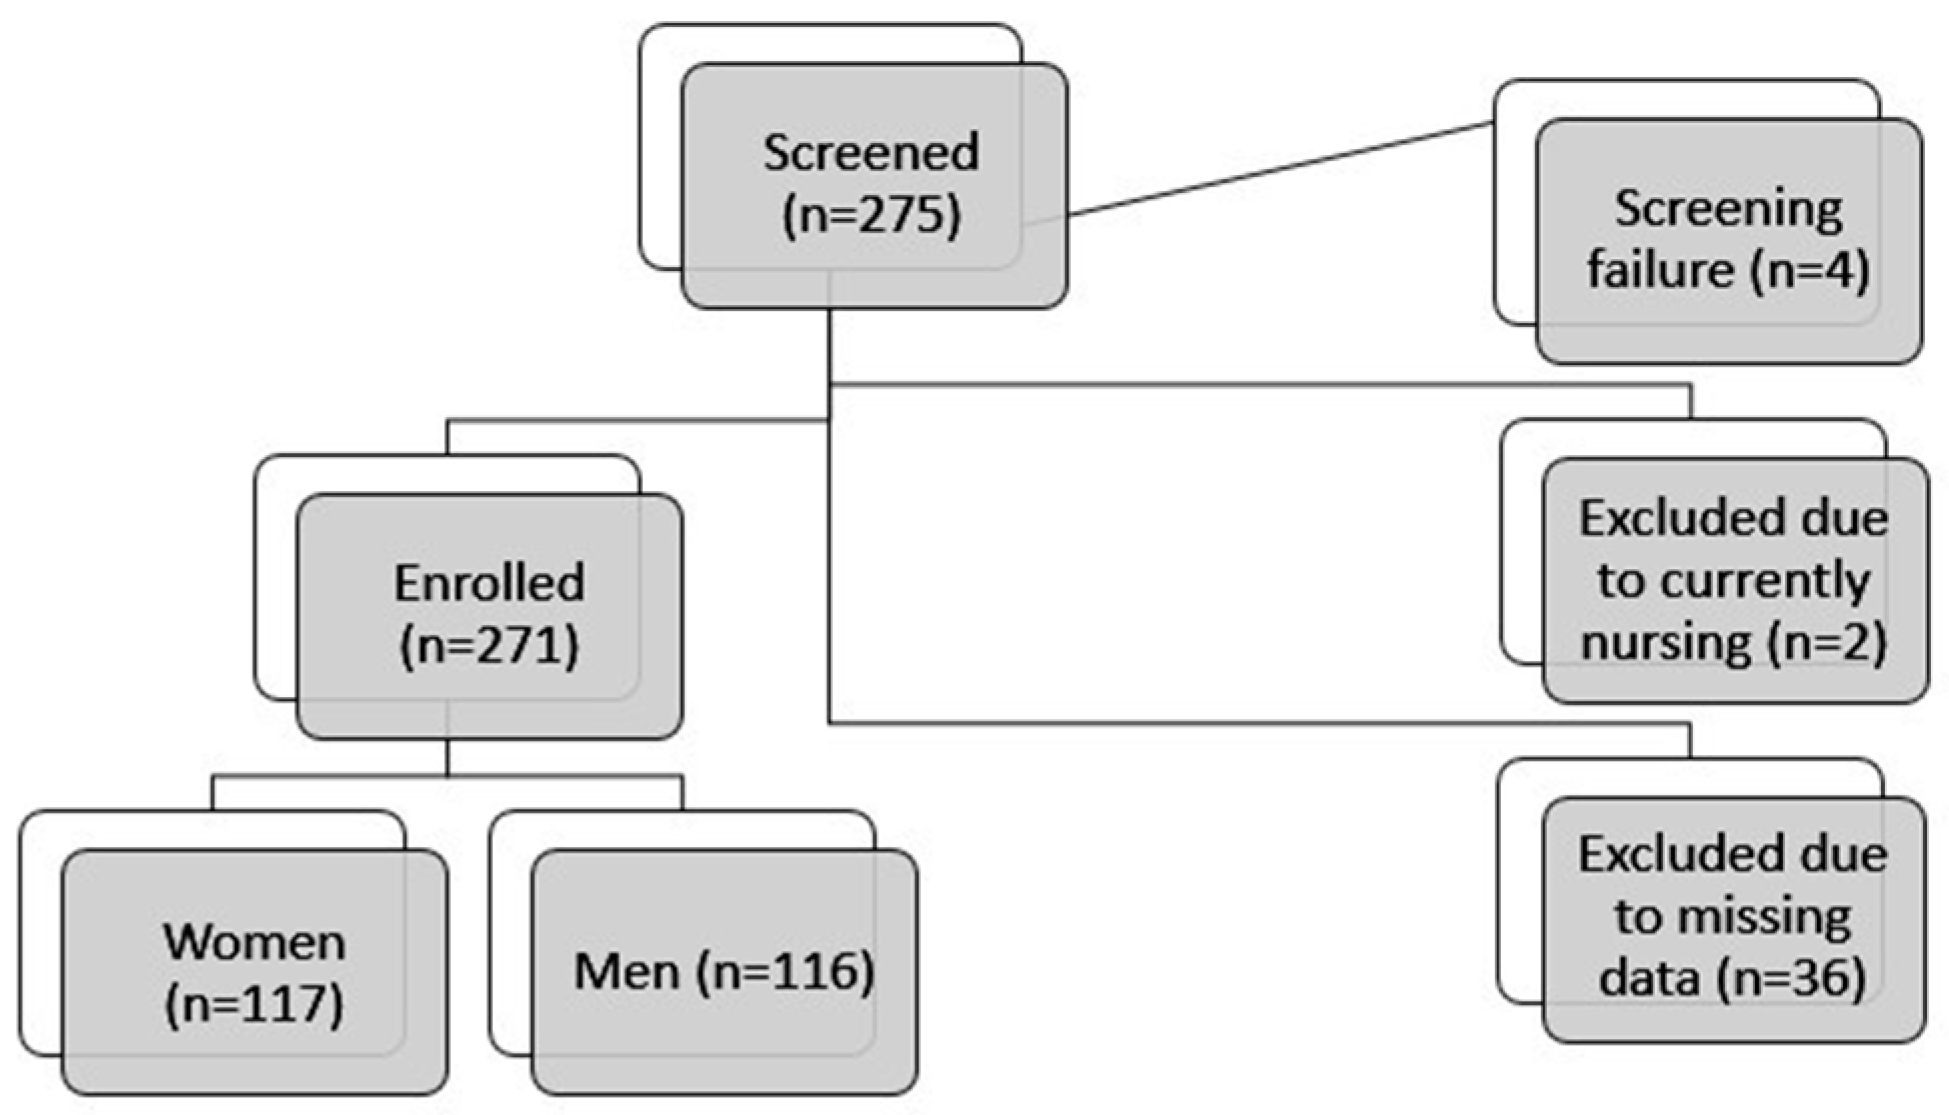
3. Results
3.1. Study Population
3.2. Demographic Data of Control Cohort
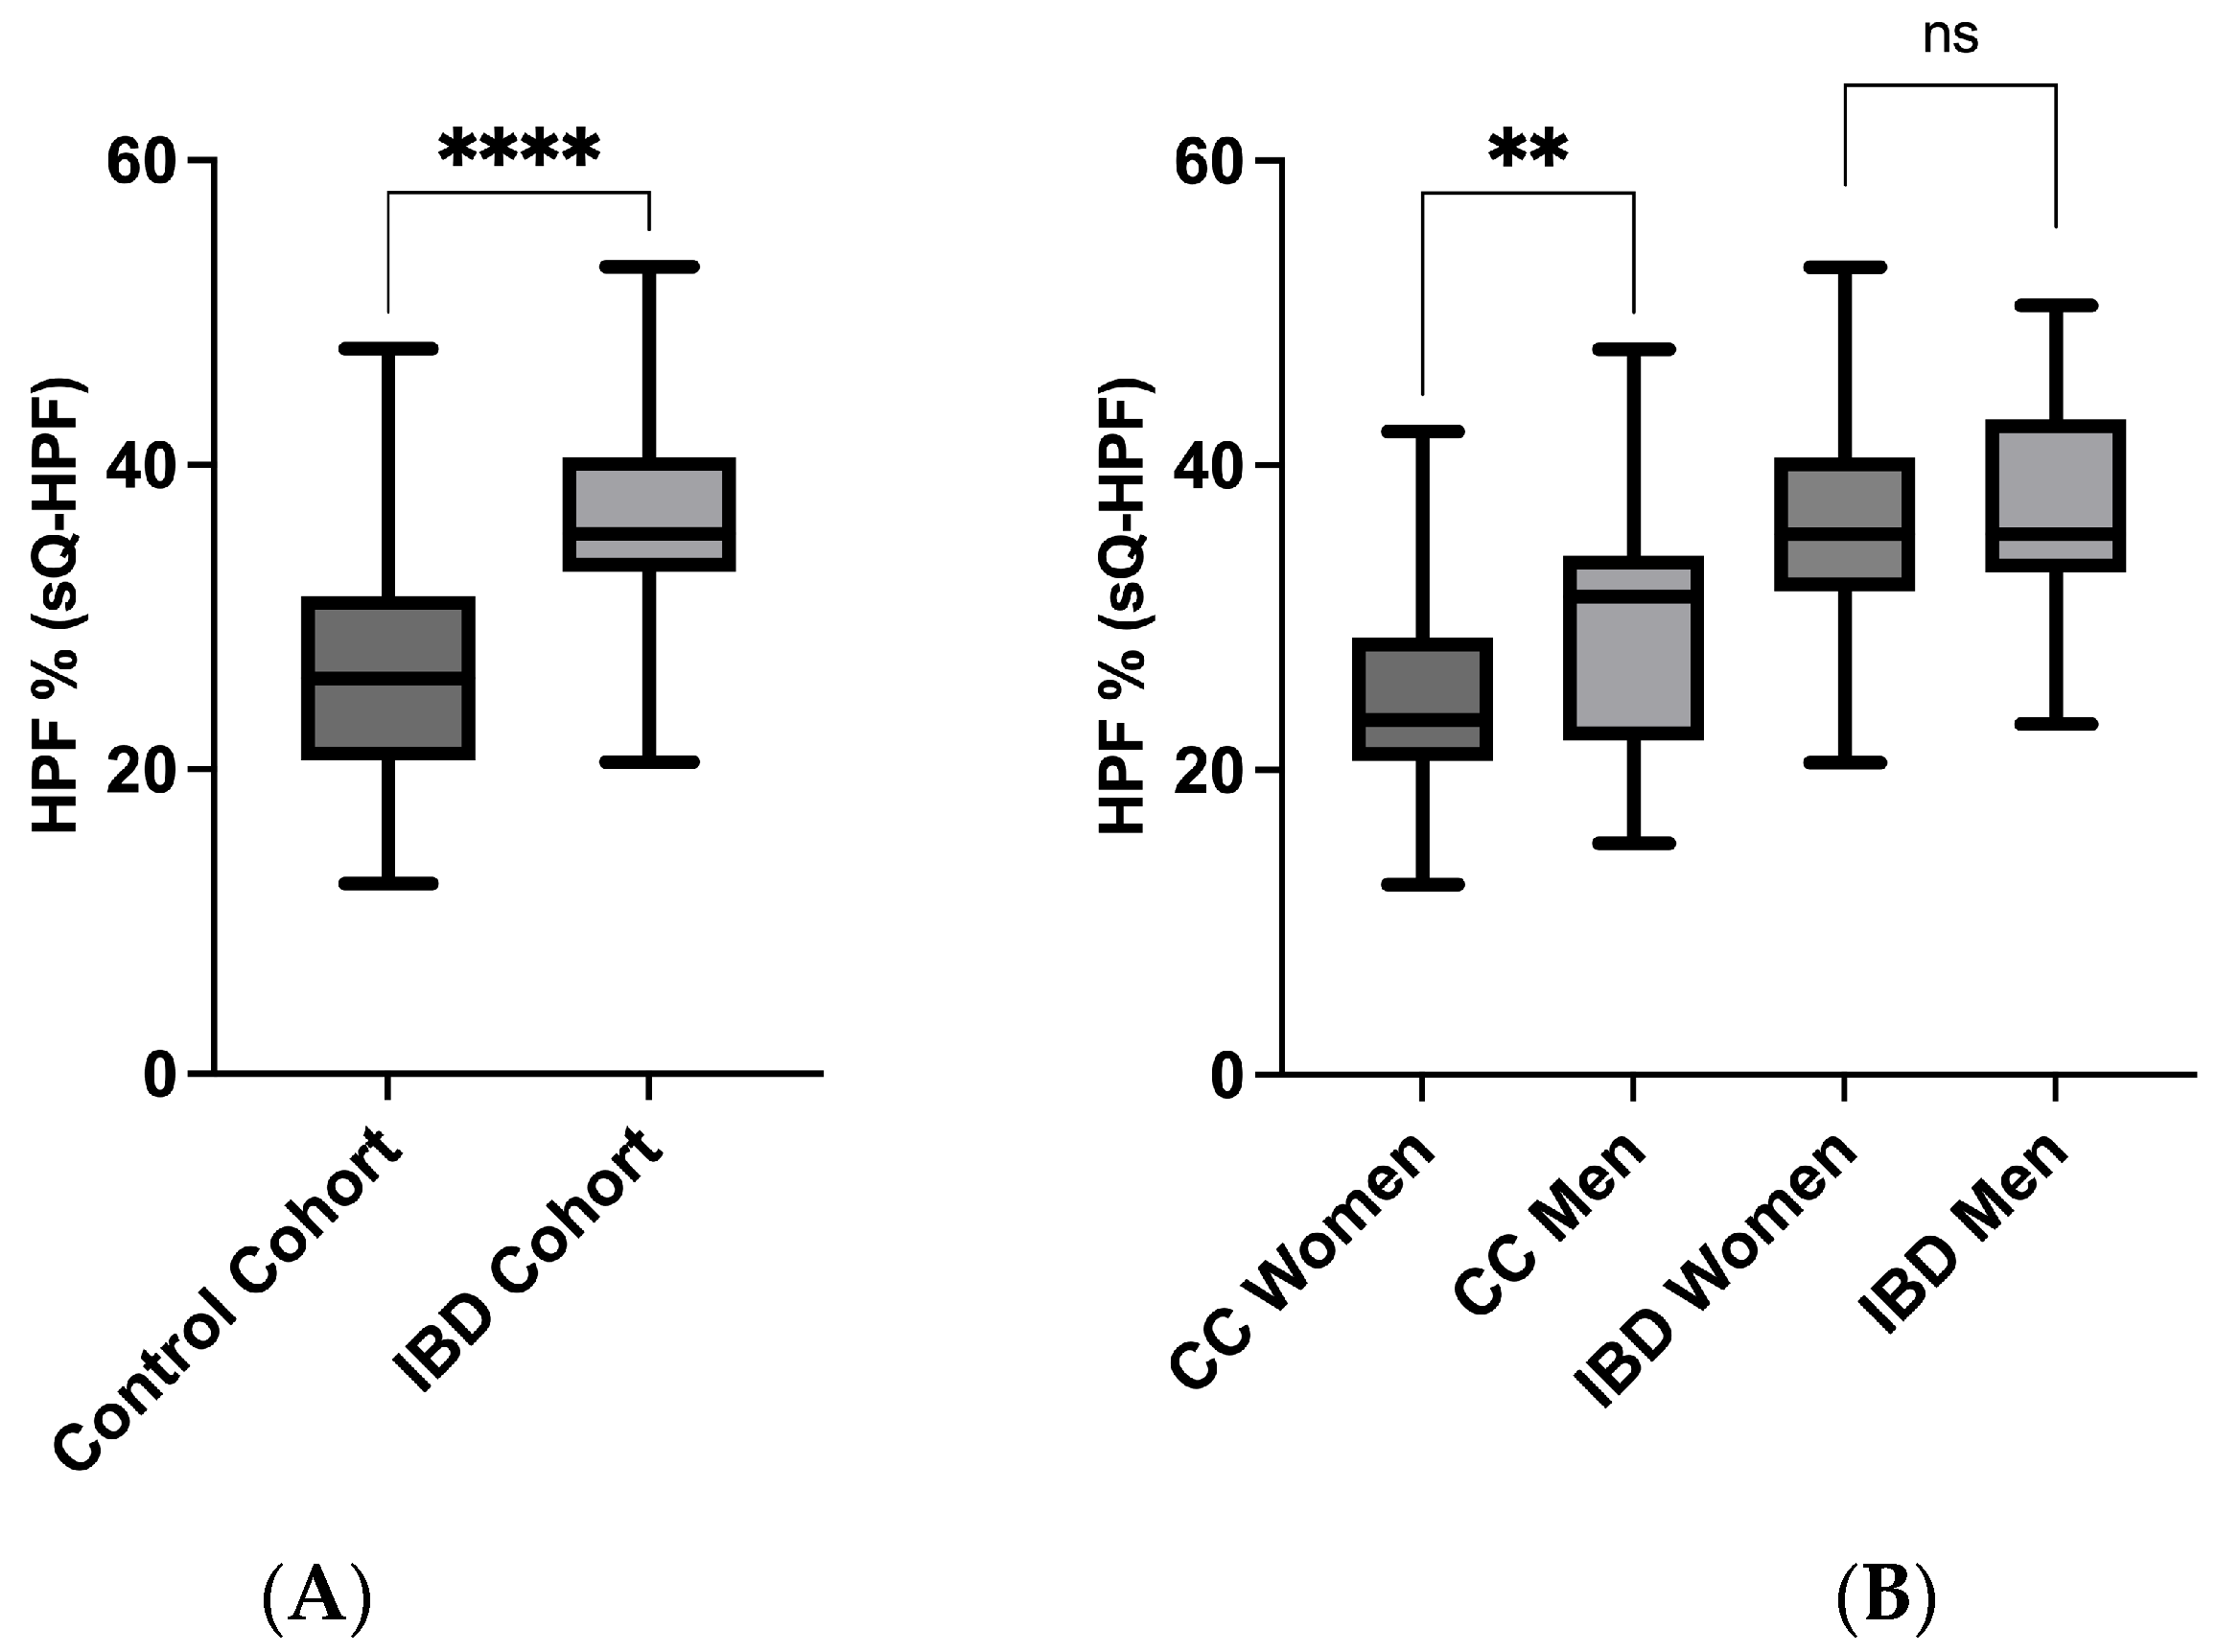
3.3. sQ-HPF Comparison of IBD and Control Cohort
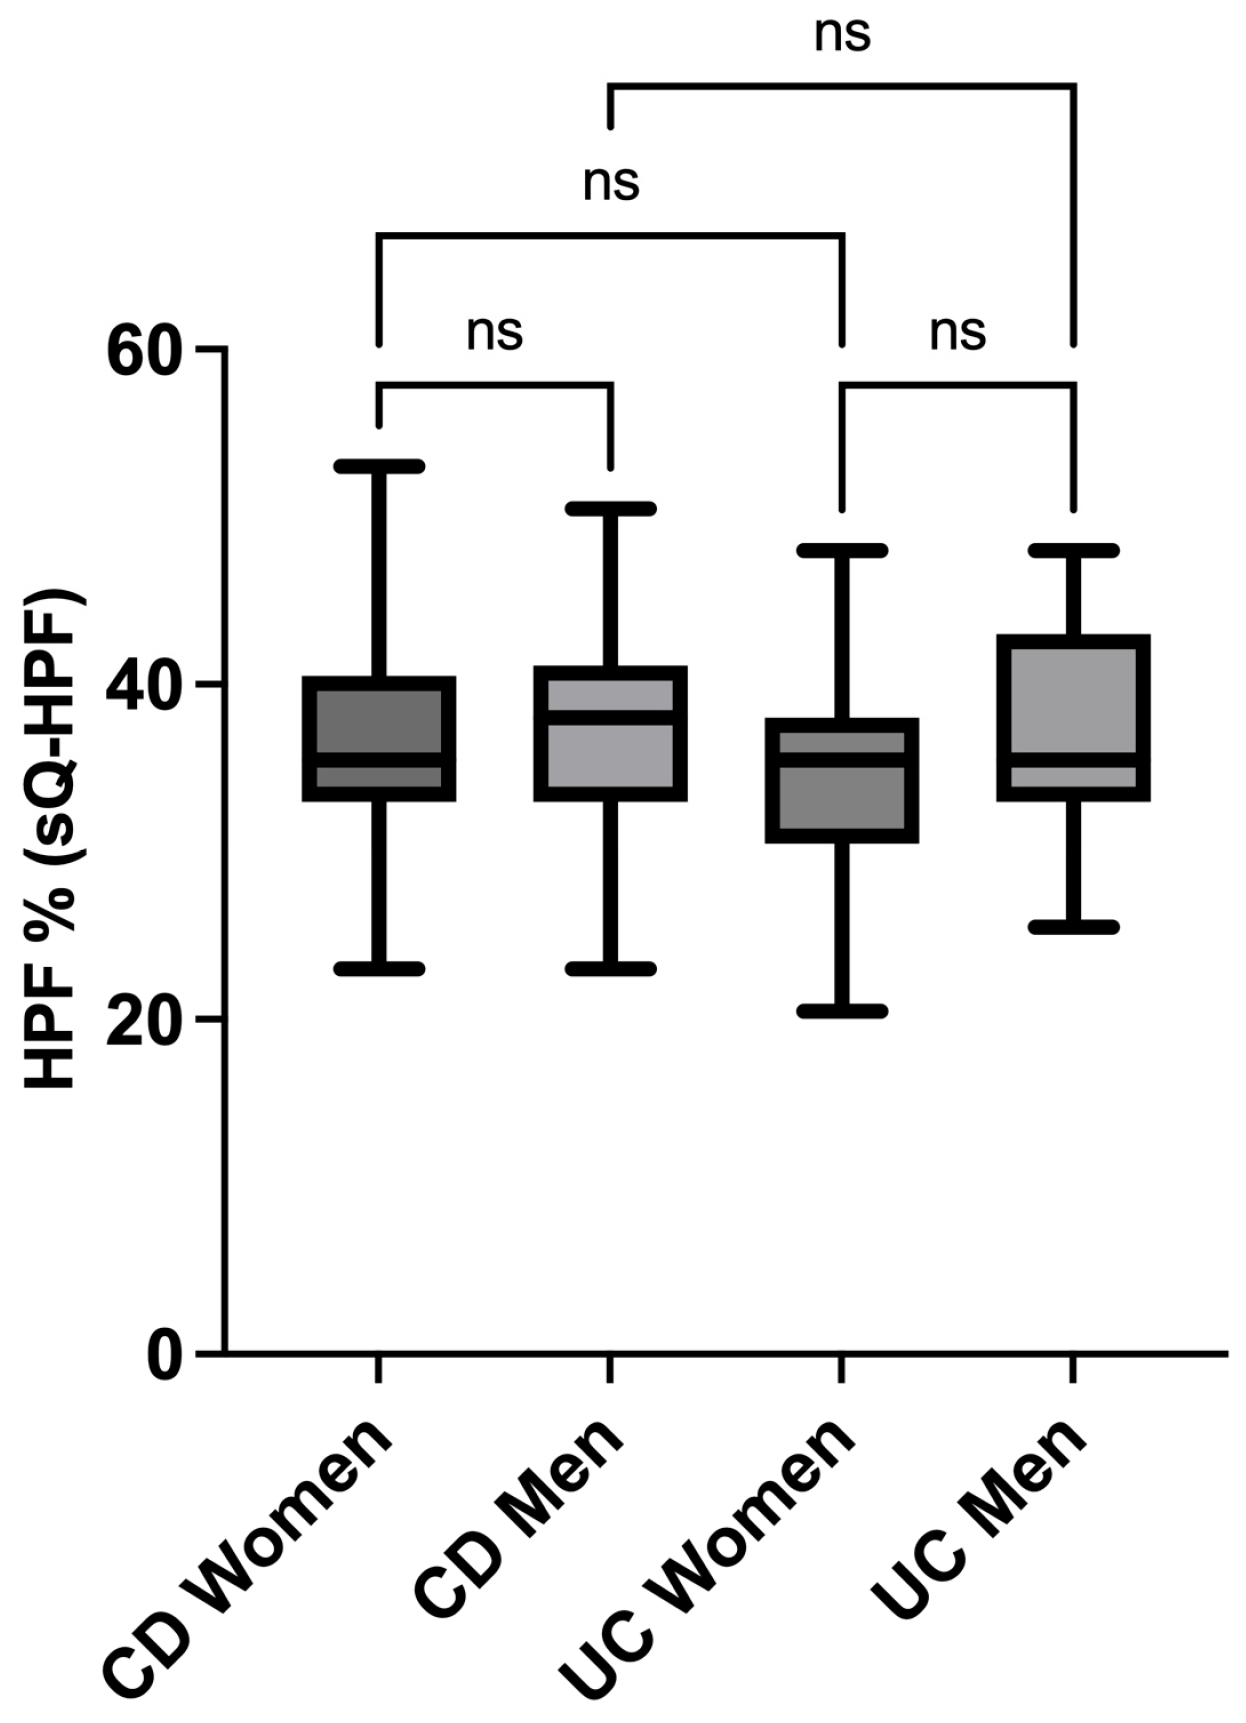
3.4. sQ-HPF Comparison of Crohn’s and Colitis Men and Women
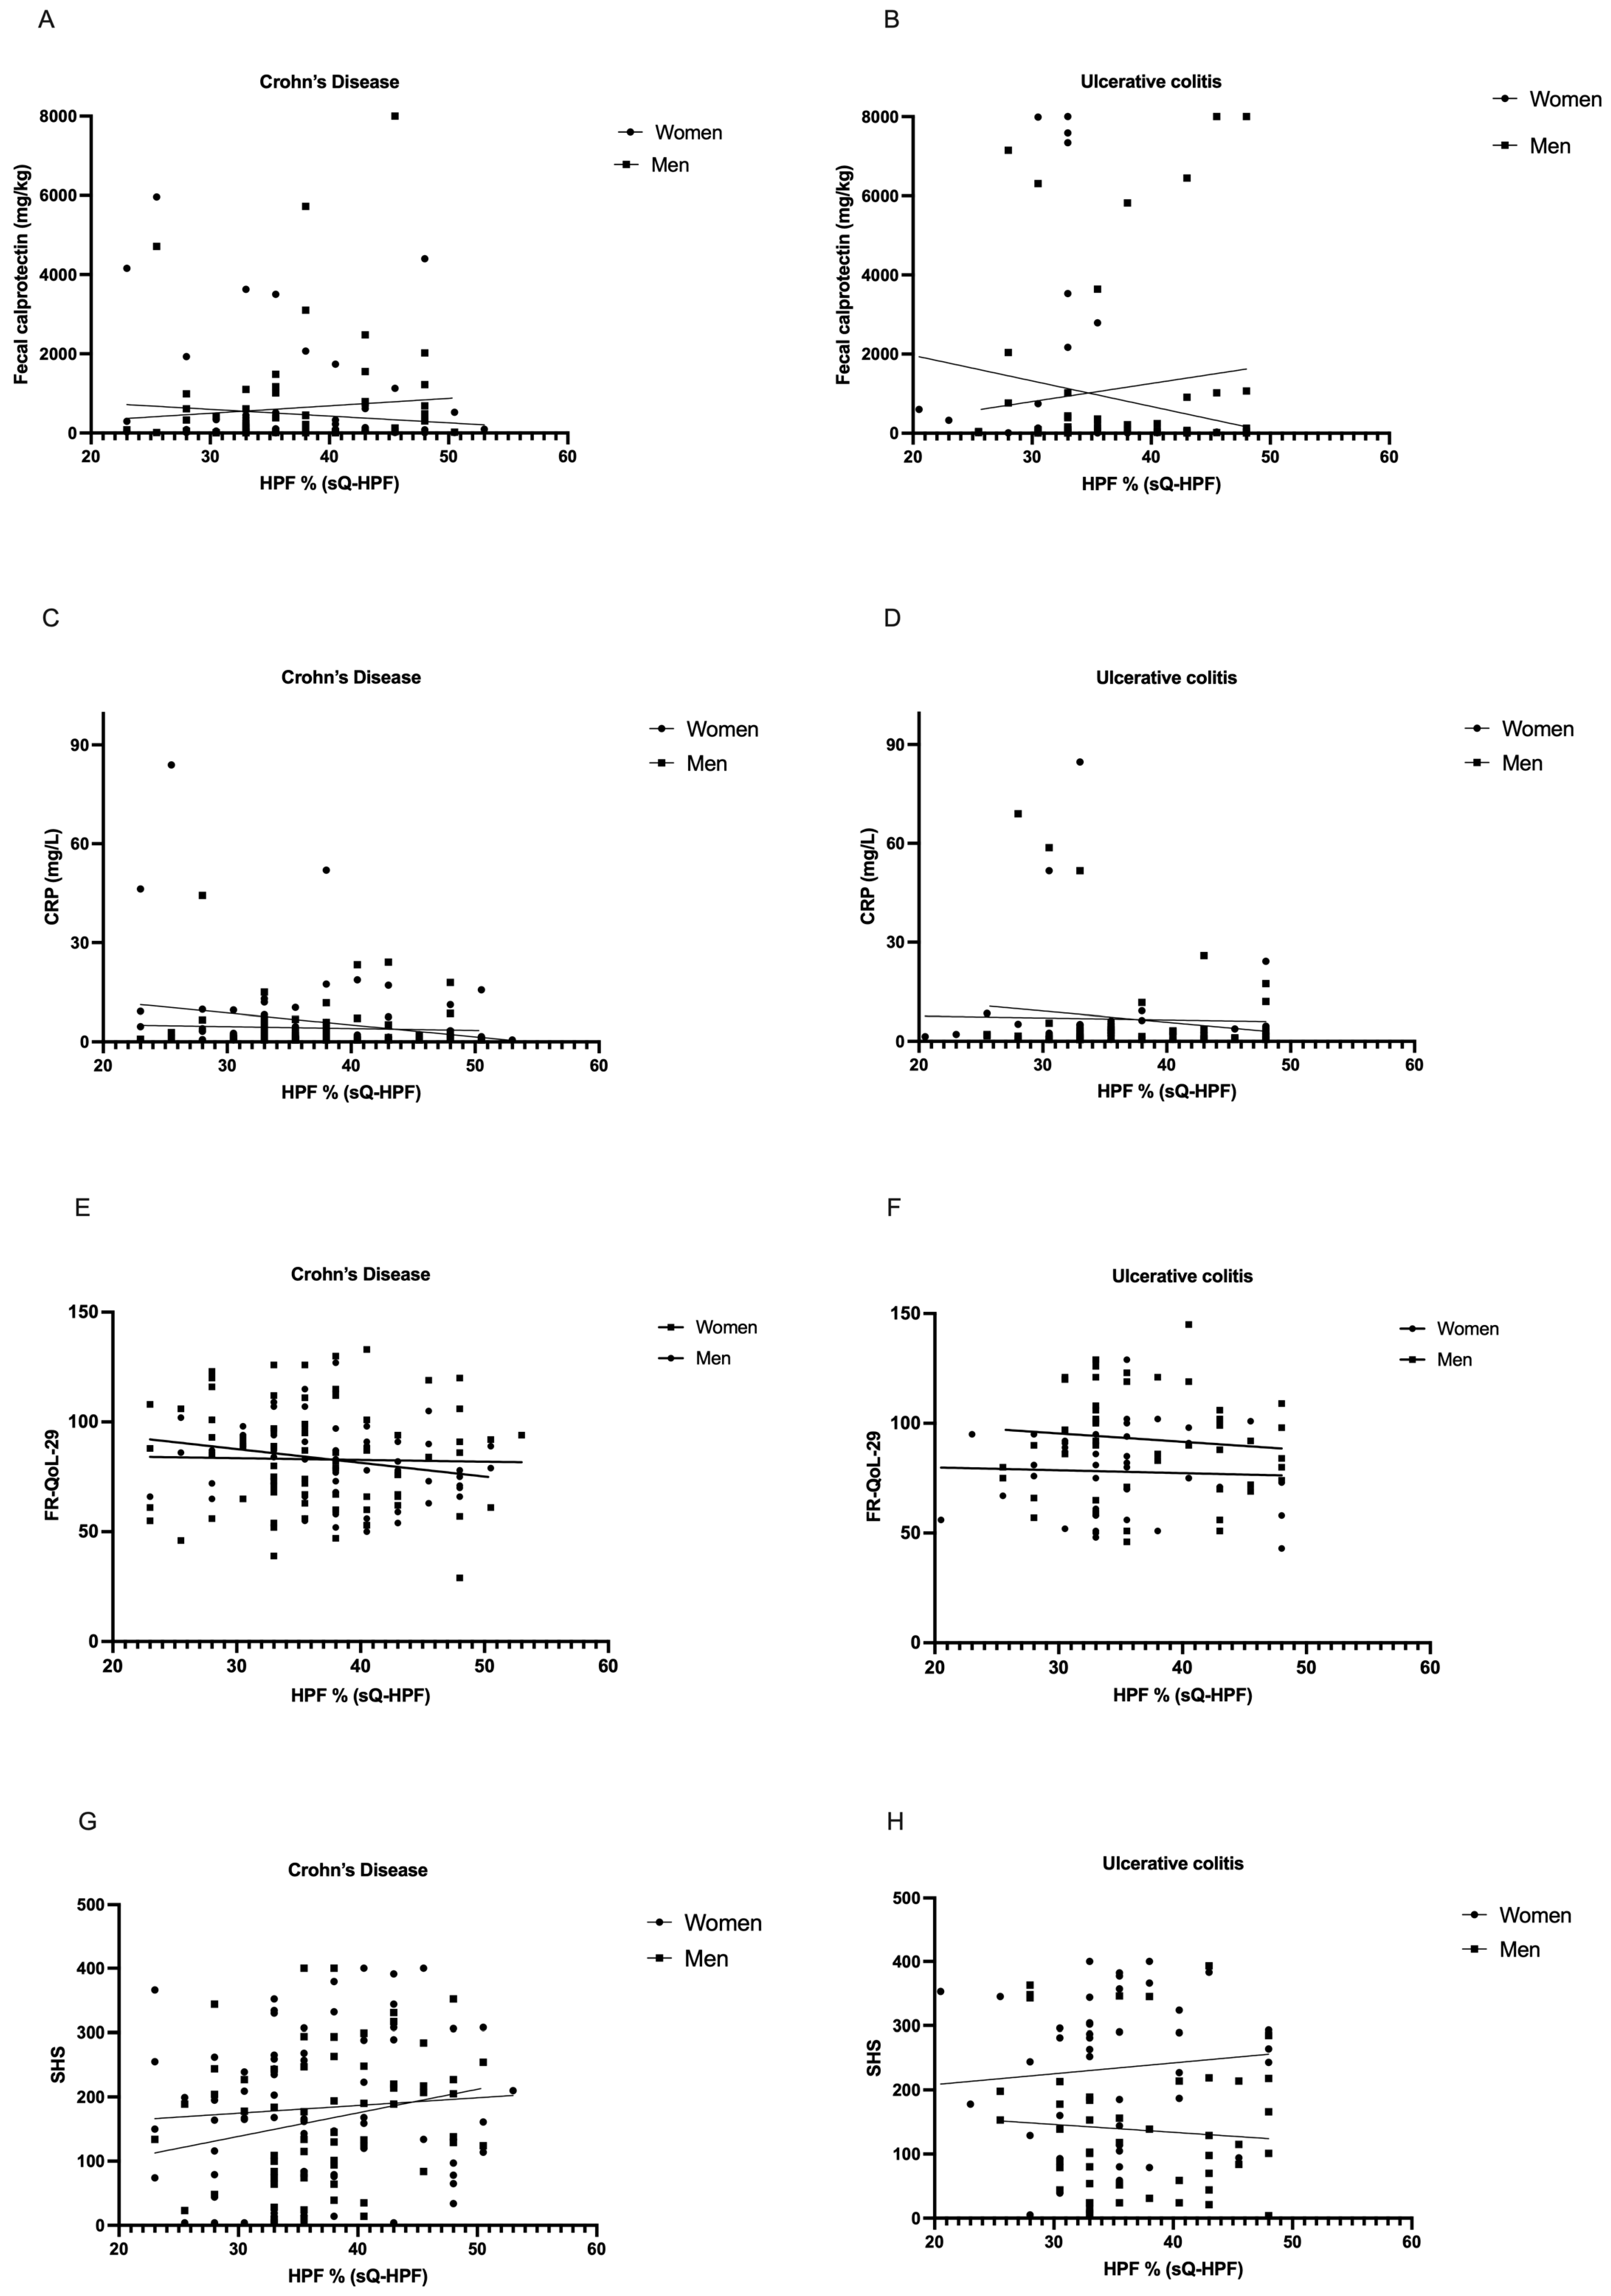
3.5. Correlation Analysis of Inflammation Parameters, Food- and Health-Related Quality of Life, and Percentual HPF Intake
4. Discussion
5. Conclusions and Limitations
Supplementary Materials
Author Contributions
Funding
Institutional Review Board Statement
Informed Consent Statement
Data Availability Statement
Acknowledgments
Conflicts of Interest
References
- Halmos, E.P.; Godny, L.; Vanderstappen, J.; Sarbagili-Shabat, C.; Svolos, V. Role of diet in prevention versus treatment of Crohn’s disease and ulcerative colitis. Frontline Gastroenterol. 2024, 15, 247–257. [Google Scholar] [CrossRef] [PubMed]
- Hou, J.K.; Abraham, B.; El-Serag, H. Dietary intake and risk of developing inflammatory bowel disease: A systematic review of the literature. Am. J. Gastroenterol. 2011, 106, 563–573. [Google Scholar] [CrossRef] [PubMed]
- Campmans-Kuijpers, M.J.E.; Dijkstra, G. Food and Food Groups in Inflammatory Bowel Disease (IBD): The Design of the Groningen Anti-Inflammatory Diet (GrAID). Nutrients 2021, 13, 1067. [Google Scholar] [CrossRef]
- de Castro, M.M.; Pascoal, L.B.; Steigleder, K.M.; Siqueira, B.P.; Corona, L.P.; Ayrizono, M.L.S.; Milanski, M.; Leal, R.F. Role of diet and nutrition in inflammatory bowel disease. World J. Exp. Med. 2021, 11, 1–16. [Google Scholar] [CrossRef] [PubMed]
- Dandona, P.; Ghanim, H.; Chaudhuri, A.; Dhindsa, S.; Kim, S.S. Macronutrient intake induces oxidative and inflammatory stress: Potential relevance to atherosclerosis and insulin resistance. Exp. Mol. Med. 2010, 42, 245–253. [Google Scholar] [CrossRef] [PubMed]
- Yan, J.; Wang, L.; Gu, Y.; Hou, H.; Liu, T.; Ding, Y.; Cao, H. Dietary Patterns and Gut Microbiota Changes in Inflammatory Bowel Disease: Current Insights and Future Challenges. Nutrients 2022, 14, 4003. [Google Scholar] [CrossRef]
- Palmela, C.; Chevarin, C.; Xu, Z.; Torres, J.; Sevrin, G.; Hirten, R.; Barnich, N.; Ng, S.C.; Colombel, J.F. Adherent-invasive Escherichia coli in inflammatory bowel disease. Gut 2018, 67, 574–587. [Google Scholar] [CrossRef]
- Faqerah, N.; Walker, D.; Gerasimidis, K. Review article: The complex interplay between diet and Escherichia coli in inflammatory bowel disease. Aliment. Pharmacol. Ther. 2023, 58, 984–1004. [Google Scholar] [CrossRef]
- Dang, Y.; Ma, C.; Chen, K.; Chen, Y.; Jiang, M.; Hu, K.; Li, L.; Zeng, Z.; Zhang, H. The Effects of a High-Fat Diet on Inflammatory Bowel Disease. Biomolecules 2023, 13, 905. [Google Scholar] [CrossRef]
- Tristan Asensi, M.; Napoletano, A.; Sofi, F.; Dinu, M. Low-Grade Inflammation and Ultra-Processed Foods Consumption: A Review. Nutrients 2023, 15, 1546. [Google Scholar] [CrossRef]
- Lane, M.M.; Gamage, E.; Du, S.; Ashtree, D.N.; McGuinness, A.J.; Gauci, S.; Baker, P.; Lawrence, M.; Rebholz, C.M.; Srour, B.; et al. Ultra-processed food exposure and adverse health outcomes: Umbrella review of epidemiological meta-analyses. BMJ 2024, 384, e077310. [Google Scholar] [CrossRef] [PubMed]
- Lane, M.M.; Lotfaliany, M.; Forbes, M.; Loughman, A.; Rocks, T.; O’Neil, A.; Machado, P.; Jacka, F.N.; Hodge, A.; Marx, W. Higher Ultra-Processed Food Consumption Is Associated with Greater High-Sensitivity C-Reactive Protein Concentration in Adults: Cross-Sectional Results from the Melbourne Collaborative Cohort Study. Nutrients 2022, 14, 3309. [Google Scholar] [CrossRef]
- Whelan, K.; Bancil, A.S.; Lindsay, J.O.; Chassaing, B. Ultra-processed foods and food additives in gut health and disease. Nat. Rev. Gastroenterol. Hepatol. 2024, 21, 406–427. [Google Scholar] [CrossRef] [PubMed]
- Song, Z.; Song, R.; Liu, Y.; Wu, Z.; Zhang, X. Effects of ultra-processed foods on the microbiota-gut-brain axis: The bread-and-butter issue. Food Res. Int. 2023, 167, 112730. [Google Scholar] [CrossRef]
- Vissers, E.; Wellens, J.; Sabino, J. Ultra-processed foods as a possible culprit for the rising prevalence of inflammatory bowel diseases. Front. Med. 2022, 9, 1058373. [Google Scholar] [CrossRef]
- Narula, N.; Wong, E.C.L.; Dehghan, M.; Mente, A.; Rangarajan, S.; Lanas, F.; Lopez-Jaramillo, P.; Rohatgi, P.; Lakshmi, P.V.M.; Varma, R.P.; et al. Association of ultra-processed food intake with risk of inflammatory bowel disease: Prospective cohort study. BMJ 2021, 374, n1554. [Google Scholar] [CrossRef]
- Sarbagili-Shabat, C.; Zelber-Sagi, S.; Isakov, N.F.; Hirsch, A.; Ron, Y.; Grinshpan, L.S.; Anbar, R.; Bromberg, A.; Thurm, T.; Maharshak, N. Ultra-Processed Foods Consumption Is Positively Associated with the Clinical Activity of Inflammatory Bowel Diseases: A Cross-Sectional Single-Center Study. Inflamm. Intest. Dis. 2024, 9, 241–251. [Google Scholar] [CrossRef] [PubMed]
- Bancil, A.; Rossi, M.; Sandall, A.; Cox, S.; Dalrymple, K.; Kelaiditis, C.; Buckley, A.; Burke, S.; Xu, Y.; Smith, L.; et al. DOP097 Emulsifier restriction is an effective therapy for active Crohn’s disease: The ADDapt trial—A multi-centre, randomised, double-blind, placebo-controlled, re-supplementation trial in 154 patients. J. Crohn’s Colitis 2025, 19, i262. [Google Scholar] [CrossRef]
- Sugihara, K.; Morhardt, T.L.; Kamada, N. The Role of Dietary Nutrients in Inflammatory Bowel Disease. Front. Immunol. 2019, 9, 3183. [Google Scholar] [CrossRef]
- Martinez-Perez, C.; Daimiel, L.; Climent-Mainar, C.; Martínez-González, M.; Salas-Salvadó, J.; Corella, D.; Schröder, H.; Martinez, J.A.; Alonso-Gómez Á, M.; Wärnberg, J.; et al. Integrative development of a short screening questionnaire of highly processed food consumption (sQ-HPF). Int. J. Behav. Nutr. Phys. Act. 2022, 19, 6. [Google Scholar] [CrossRef]
- Pueschel, L.; Nothacker, S.; Wedemeyer, H.; Lenzen, H.; Wiestler, M. Validation of the German Version of the Screening Questionnaire for Highly Processed Food Consumption (sQ-HPF). In Aktuelle Ernährungsmedizin; Thieme: New York, NY, USA, 2025. [Google Scholar] [CrossRef]
- Andersen, V.; Pingel, J.; Søfelt, H.L.; Hikmat, Z.; Johansson, M.; Pedersen, V.S.; Bertelsen, B.; Carlsson, A.; Lindh, M.; Svavarsdóttir, E.; et al. Sex and gender in inflammatory bowel disease outcomes and research. Lancet Gastroenterol. Hepatol. 2024, 9, 1041–1051. [Google Scholar] [CrossRef]
- Pueschel, L.; Nothacker, S.; Kuhn, L.; Wedemeyer, H.; Lenzen, H.; Wiestler, M. Exploring Dietary- and Disease-Related Influences on Flatulence and Fecal Odor Perception in Inflammatory Bowel Disease. J. Clin. Med. 2024, 14, 137. [Google Scholar] [CrossRef] [PubMed]
- Pueschel, L.; Hupa-Breier, K.; Wedemeyer, H.; Lenzen, H.; Wiestler, M. Food-related Quality of Life in patients with Inflammatory Bowel Disease: Translation and Validation of the German version of FR-QoL-29. Z. Gastroenterol. 2025, 63, 477–485. [Google Scholar] [CrossRef]
- Monteiro, C.A. Nutrition and health. The issue is not food, nor nutrients, so much as processing. Public. Health Nutr. 2009, 12, 729–731. [Google Scholar] [CrossRef]
- Haftenberger, M.; Heuer, T.; Heidemann, C.; Kube, F.; Krems, C.; Mensink, G.B.M. Relative validation of a food frequency questionnaire for national health and nutrition monitoring. Nutr. J. 2010, 9, 36. [Google Scholar] [CrossRef]
- Hughes, L.D.; King, L.; Morgan, M.; Ayis, S.; Direkze, N.; Lomer, M.C.; Lindsay, J.O.; Whelan, K. Food-related Quality of Life in Inflammatory Bowel Disease: Development and Validation of a Questionnaire. J. Crohns Colitis 2016, 10, 194–201. [Google Scholar] [CrossRef] [PubMed]
- Harvey, R.F.; Bradshaw, J.M. A simple index of Crohn’s-disease activity. Lancet 1980, 1, 514. [Google Scholar] [CrossRef] [PubMed]
- Schroeder, K.W.; Tremaine, W.J.; Ilstrup, D.M. Coated oral 5-aminosalicylic acid therapy for mildly to moderately active ulcerative colitis. A randomized study. N. Engl. J. Med. 1987, 317, 1625–1629. [Google Scholar] [CrossRef]
- Satsangi, J.; Silverberg, M.S.; Vermeire, S.; Colombel, J.-F. The Montreal classification of inflammatory bowel disease: Controversies, consensus, and implications. Gut 2006, 55, 749–753. [Google Scholar] [CrossRef]
- Pueschel, L.; Kockelmann, F.; Kueck, M.; Tegtbur, U.; Attaran-Bandarabadi, M.; Bachmann, O.; Wedemeyer, H.; Lenzen, H.; Wiestler, M. Patients with Inflammatory Bowel Disease Show Fewer Sex-Related Differences in Their Dietary Behavior Than the General Population: A Qualitative Analysis. Nutrients 2024, 16, 2954. [Google Scholar] [CrossRef]
- Black, A.E.; Goldberg, G.R.; Jebb, S.A.; Livingstone, M.B.; Cole, T.J.; Prentice, A.M. Critical evaluation of energy intake data using fundamental principles of energy physiology: 2. Evaluating the results of published surveys. Eur. J. Clin. Nutr. 1991, 45, 583–599. [Google Scholar]
- Christensen, C.; Knudsen, A.; Arnesen, E.K.; Hatlebakk, J.G.; Sletten, I.S.; Fadnes, L.T. Diet, Food, and Nutritional Exposures and Inflammatory Bowel Disease or Progression of Disease: An Umbrella Review. Adv. Nutr. 2024, 15, 100219. [Google Scholar] [CrossRef]
- Godala, M.; Gaszyńska, E.; Zatorski, H.; Małecka-Wojciesko, E. Dietary Interventions in Inflammatory Bowel Disease. Nutrients 2022, 14, 4261. [Google Scholar] [CrossRef] [PubMed]
- Vasseur, P.; Dugelay, E.; Benamouzig, R.; Savoye, G.; Lan, A.; Srour, B.; Hercberg, S.; Touvier, M.; Hugot, J.P.; Julia, C.; et al. Dietary Patterns, Ultra-processed Food, and the Risk of Inflammatory Bowel Diseases in the NutriNet-Santé Cohort. Inflamm. Bowel Dis. 2021, 27, 65–73. [Google Scholar] [CrossRef]
- Chen, J.; Wellens, J.; Kalla, R.; Fu, T.; Deng, M.; Zhang, H.; Yuan, S.; Wang, X.; Theodoratou, E.; Li, X.; et al. Intake of Ultra-processed Foods Is Associated with an Increased Risk of Crohn’s Disease: A Cross-sectional and Prospective Analysis of 187 154 Participants in the UK Biobank. J. Crohns Colitis 2023, 17, 535–552. [Google Scholar] [CrossRef] [PubMed]
- Feraco, A.; Armani, A.; Amoah, I.; Guseva, E.; Camajani, E.; Gorini, S.; Strollo, R.; Padua, E.; Caprio, M.; Lombardo, M. Assessing gender differences in food preferences and physical activity: A population-based survey. Front. Nutr. 2024, 11, 1348456. [Google Scholar] [CrossRef] [PubMed]
- Lombardo, M.; Feraco, A.; Armani, A.; Camajani, E.; Gorini, S.; Strollo, R.; Padua, E.; Caprio, M.; Bellia, A. Gender differences in body composition, dietary patterns, and physical activity: Insights from a cross-sectional study. Front. Nutr. 2024, 11, 1414217. [Google Scholar] [CrossRef]
- Blumenstein, I.; Sonnenberg, E. Sex- and gender-related differences in inflammatory bowel diseases. Front. Gastroenterol. 2023, 2, 1199687. [Google Scholar] [CrossRef]
- Godala, M.; Gaszyńska, E.; Durko, Ł.; Małecka-Wojciesko, E. Dietary Behaviors and Beliefs in Patients with Inflammatory Bowel Disease. J. Clin. Med. 2023, 12, 3455. [Google Scholar] [CrossRef]
- Guthrie, E.; Jackson, J.; Shaffer, J.; Thompson, D.; Tomenson, B.; Creed, F. Psychological disorder and severity of inflammatory bowel disease predict health-related quality of life in ulcerative colitis and Crohn’s disease. Am. J. Gastroenterol. 2002, 97, 1994–1999. [Google Scholar] [CrossRef]
- Sarwan, N.; Jurawan, R.; Singh, R.; Chattu, V.K. An Exploratory Study of Inflammatory Bowel Disease and the Psychosocial Factors Affecting Health-Related Quality of Life. Med. Sci. 2019, 7, 18. [Google Scholar] [CrossRef] [PubMed]
- Zallot, C.; Quilliot, D.; Chevaux, J.B.; Peyrin-Biroulet, C.; Guéant-Rodriguez, R.M.; Freling, E.; Collet-Fenetrier, B.; Williet, N.; Ziegler, O.; Bigard, M.A.; et al. Dietary beliefs and behavior among inflammatory bowel disease patients. Inflamm. Bowel Dis. 2013, 19, 66–72. [Google Scholar] [CrossRef]
- Limdi, J.K.; Aggarwal, D.; McLaughlin, J.T. Dietary Practices and Beliefs in Patients with Inflammatory Bowel Disease. Inflamm. Bowel Dis. 2016, 22, 164–170. [Google Scholar] [CrossRef] [PubMed]
- Levine, A.; Sigall Boneh, R.; Wine, E. Evolving role of diet in the pathogenesis and treatment of inflammatory bowel diseases. Gut 2018, 67, 1726–1738. [Google Scholar] [CrossRef]
- Wabich, J.; Bellaguarda, E.; Joyce, C.; Keefer, L.; Kinsinger, S. Disordered Eating, Body Dissatisfaction, and Psychological Distress in Patients with Inflammatory Bowel Disease (IBD). J. Clin. Psychol. Med. Settings 2020, 27, 310–317. [Google Scholar] [CrossRef]
- Pueschel, L.; Wedemeyer, H.; Lenzen, H.; Wiestler, M. Sex Differences Outweigh Dietary Factors in Food-Related Quality of Life in Patients with Inflammatory Bowel Disease. Nutrients 2025, 17, 1114. [Google Scholar] [CrossRef] [PubMed]
- Ribaudi, E.; Amato, S.; Becherucci, G.; Carillo, S.; Covello, C.; Mora, V.; Mentella, M.C.; Scaldaferri, F.; Gasbarrini, A.; Fanali, C.; et al. Addressing Nutritional Knowledge Gaps in Inflammatory Bowel Disease: A Scoping Review. Nutrients 2025, 17, 833. [Google Scholar] [CrossRef]
- Casanova, M.J.; Chaparro, M.; Molina, B.; Merino, O.; Batanero, R.; Dueñas-Sadornil, C.; Robledo, P.; Garcia-Albert, A.M.; Gómez-Sánchez, M.B.; Calvet, X.; et al. Prevalence of Malnutrition and Nutritional Characteristics of Patients with Inflammatory Bowel Disease. J. Crohns Colitis 2017, 11, 1430–1439. [Google Scholar] [CrossRef]
- Levine, A.; Rhodes, J.M.; Lindsay, J.O.; Abreu, M.T.; Kamm, M.A.; Gibson, P.R.; Gasche, C.; Silverberg, M.S.; Mahadevan, U.; Boneh, R.S.; et al. Dietary Guidance from the International Organization for the Study of Inflammatory Bowel Diseases. Clin. Gastroenterol. Hepatol. 2020, 18, 1381–1392. [Google Scholar] [CrossRef]
- Schudok, A.; Russ, J. Praktische Empfehlungen zur Ernährung bei CED. CME 2025, 22, 35. [Google Scholar] [CrossRef]

| Women | Men | |||
|---|---|---|---|---|
| (n = 117) | (n = 116) | p | ||
| Crohn’s disease [n(%)] | 75 (64.1%) | 66 (56.9%) | 0.285 | |
| Current advanced drug therapy [n (%)] | 65 (57%) | 65 (57%) | 0.999 | |
| Disease Activity [n (%)] | Remission | 58 (52.7%) | 59 (53.2%) | 0.999 |
| Location of Crohn’s [n (%)] | L1: ileal | 17 (22.7%) | 18 (27.3%) | 0.999 |
| L2: colonic | 18 (24%) | 7 (10.6%) | 0.302 | |
| L3: ileocolonic | 32 (42.7%) | 35 (53%) | 0.999 | |
| L4: isolated upper disease | 8 (10.7%) | 6 (9.1%) | 0.999 | |
| Crohn’s behavior [n (%)] | B1: nonstricturing, nonpenetrating | 31 (41.3%) | 20 (30.3%) | 0.999 |
| B2: stricturing | 34 (45.3%) | 32 (48.5%) | 0.999 | |
| B3: penetrating | 10 (13.3%) | 14 (21.2%) | 0.999 | |
| UC Montreal classification [n (%)] | Proctitis | 3 (7.1%) | 3 (6%) | 0.999 |
| left-sided colitis | 14 (33.3%) | 18 (36%) | 0.999 | |
| pancolitis | 25 (59.5%) | 29 (58%) | 0.999 | |
| Disease duration [median (IQR)] (years) | 12 [7–20] | 13 [7–19] | 0.679 | |
| Surgery [n (%)] | 39 (33.3%) | 46 (39.7%) | 0.343 | |
| Calprotectin [median (IQR)] (mg/kg) | 82.3 [24.7–334] | 129 [30.8–795] | 0.438 | |
| C-reactive protein [median (IQR)] (mg/L) | 2.1 [0.9–5.5] | 1.4 [0.6–3.7] | 0.514 | |
| Age [median (IQR)] (years) | 38 [30–50] | 40 [29–53] | 0.843 | |
| MUST [n (%)] | low risk | 57 (48.7%) | 71 (61.2%) | 0.332 |
| medium risk | 27 (23.1%) | 22 (19%) | 0.999 | |
| high risk | 33 (28.2%) | 23 (19.8%) | 0.808 | |
| Education [n (%)] | Highschool Diploma or higher | 53 (45.3%) | 64 (55.2%) | 0.150 |
| Work status [n (%)] | Currently employed/working | 90 (76.9%) | 98 (84.5%) | 0.184 |
| Vitamin D3 25-OH [median (IQR)] (ng/mL) | 30 [21.8–37.1] | 24.6 [20.8–34] | 0.364 | |
| Handgrip strength [median (IQR)] | 28.9 [23.3–33.4] | 46.8 [38.6–54.4] | <0.001 | |
| EEI [median (IQR)] (kJ/d) | 6433 [4770–8952] | 7951 [5797–11,100] | 0.004 | |
| BMI [median (IQR)] (kg/m2) | 23.8 [21.5–28] | 24.4 [21.2–27.8] | 0.895 | |
Disclaimer/Publisher’s Note: The statements, opinions and data contained in all publications are solely those of the individual author(s) and contributor(s) and not of MDPI and/or the editor(s). MDPI and/or the editor(s) disclaim responsibility for any injury to people or property resulting from any ideas, methods, instructions or products referred to in the content. |
© 2025 by the authors. Licensee MDPI, Basel, Switzerland. This article is an open access article distributed under the terms and conditions of the Creative Commons Attribution (CC BY) license (https://creativecommons.org/licenses/by/4.0/).
Share and Cite
Pueschel, L.; Nothacker, S.; Kuhn, L.; Wedemeyer, H.; Lenzen, H.; Wiestler, M. Assessing Highly Processed Food Consumption in Patients with Inflammatory Bowel Disease: Application of the German Screening Questionnaire (sQ-HPF). J. Clin. Med. 2025, 14, 3819. https://doi.org/10.3390/jcm14113819
Pueschel L, Nothacker S, Kuhn L, Wedemeyer H, Lenzen H, Wiestler M. Assessing Highly Processed Food Consumption in Patients with Inflammatory Bowel Disease: Application of the German Screening Questionnaire (sQ-HPF). Journal of Clinical Medicine. 2025; 14(11):3819. https://doi.org/10.3390/jcm14113819
Chicago/Turabian StylePueschel, Lea, Sonja Nothacker, Leonie Kuhn, Heiner Wedemeyer, Henrike Lenzen, and Miriam Wiestler. 2025. "Assessing Highly Processed Food Consumption in Patients with Inflammatory Bowel Disease: Application of the German Screening Questionnaire (sQ-HPF)" Journal of Clinical Medicine 14, no. 11: 3819. https://doi.org/10.3390/jcm14113819
APA StylePueschel, L., Nothacker, S., Kuhn, L., Wedemeyer, H., Lenzen, H., & Wiestler, M. (2025). Assessing Highly Processed Food Consumption in Patients with Inflammatory Bowel Disease: Application of the German Screening Questionnaire (sQ-HPF). Journal of Clinical Medicine, 14(11), 3819. https://doi.org/10.3390/jcm14113819