
Comparison of Executive Function Skills between Patients with Cerebral Palsy and Typically Developing Populations: A Systematic Review and Meta-Analysis

 , , , ,
Abstract
1. Introduction
2. Materials and Methods
2.1. Data Sources and Search Strategy
2.2. Selection and Eligibility
2.3. Data Extraction
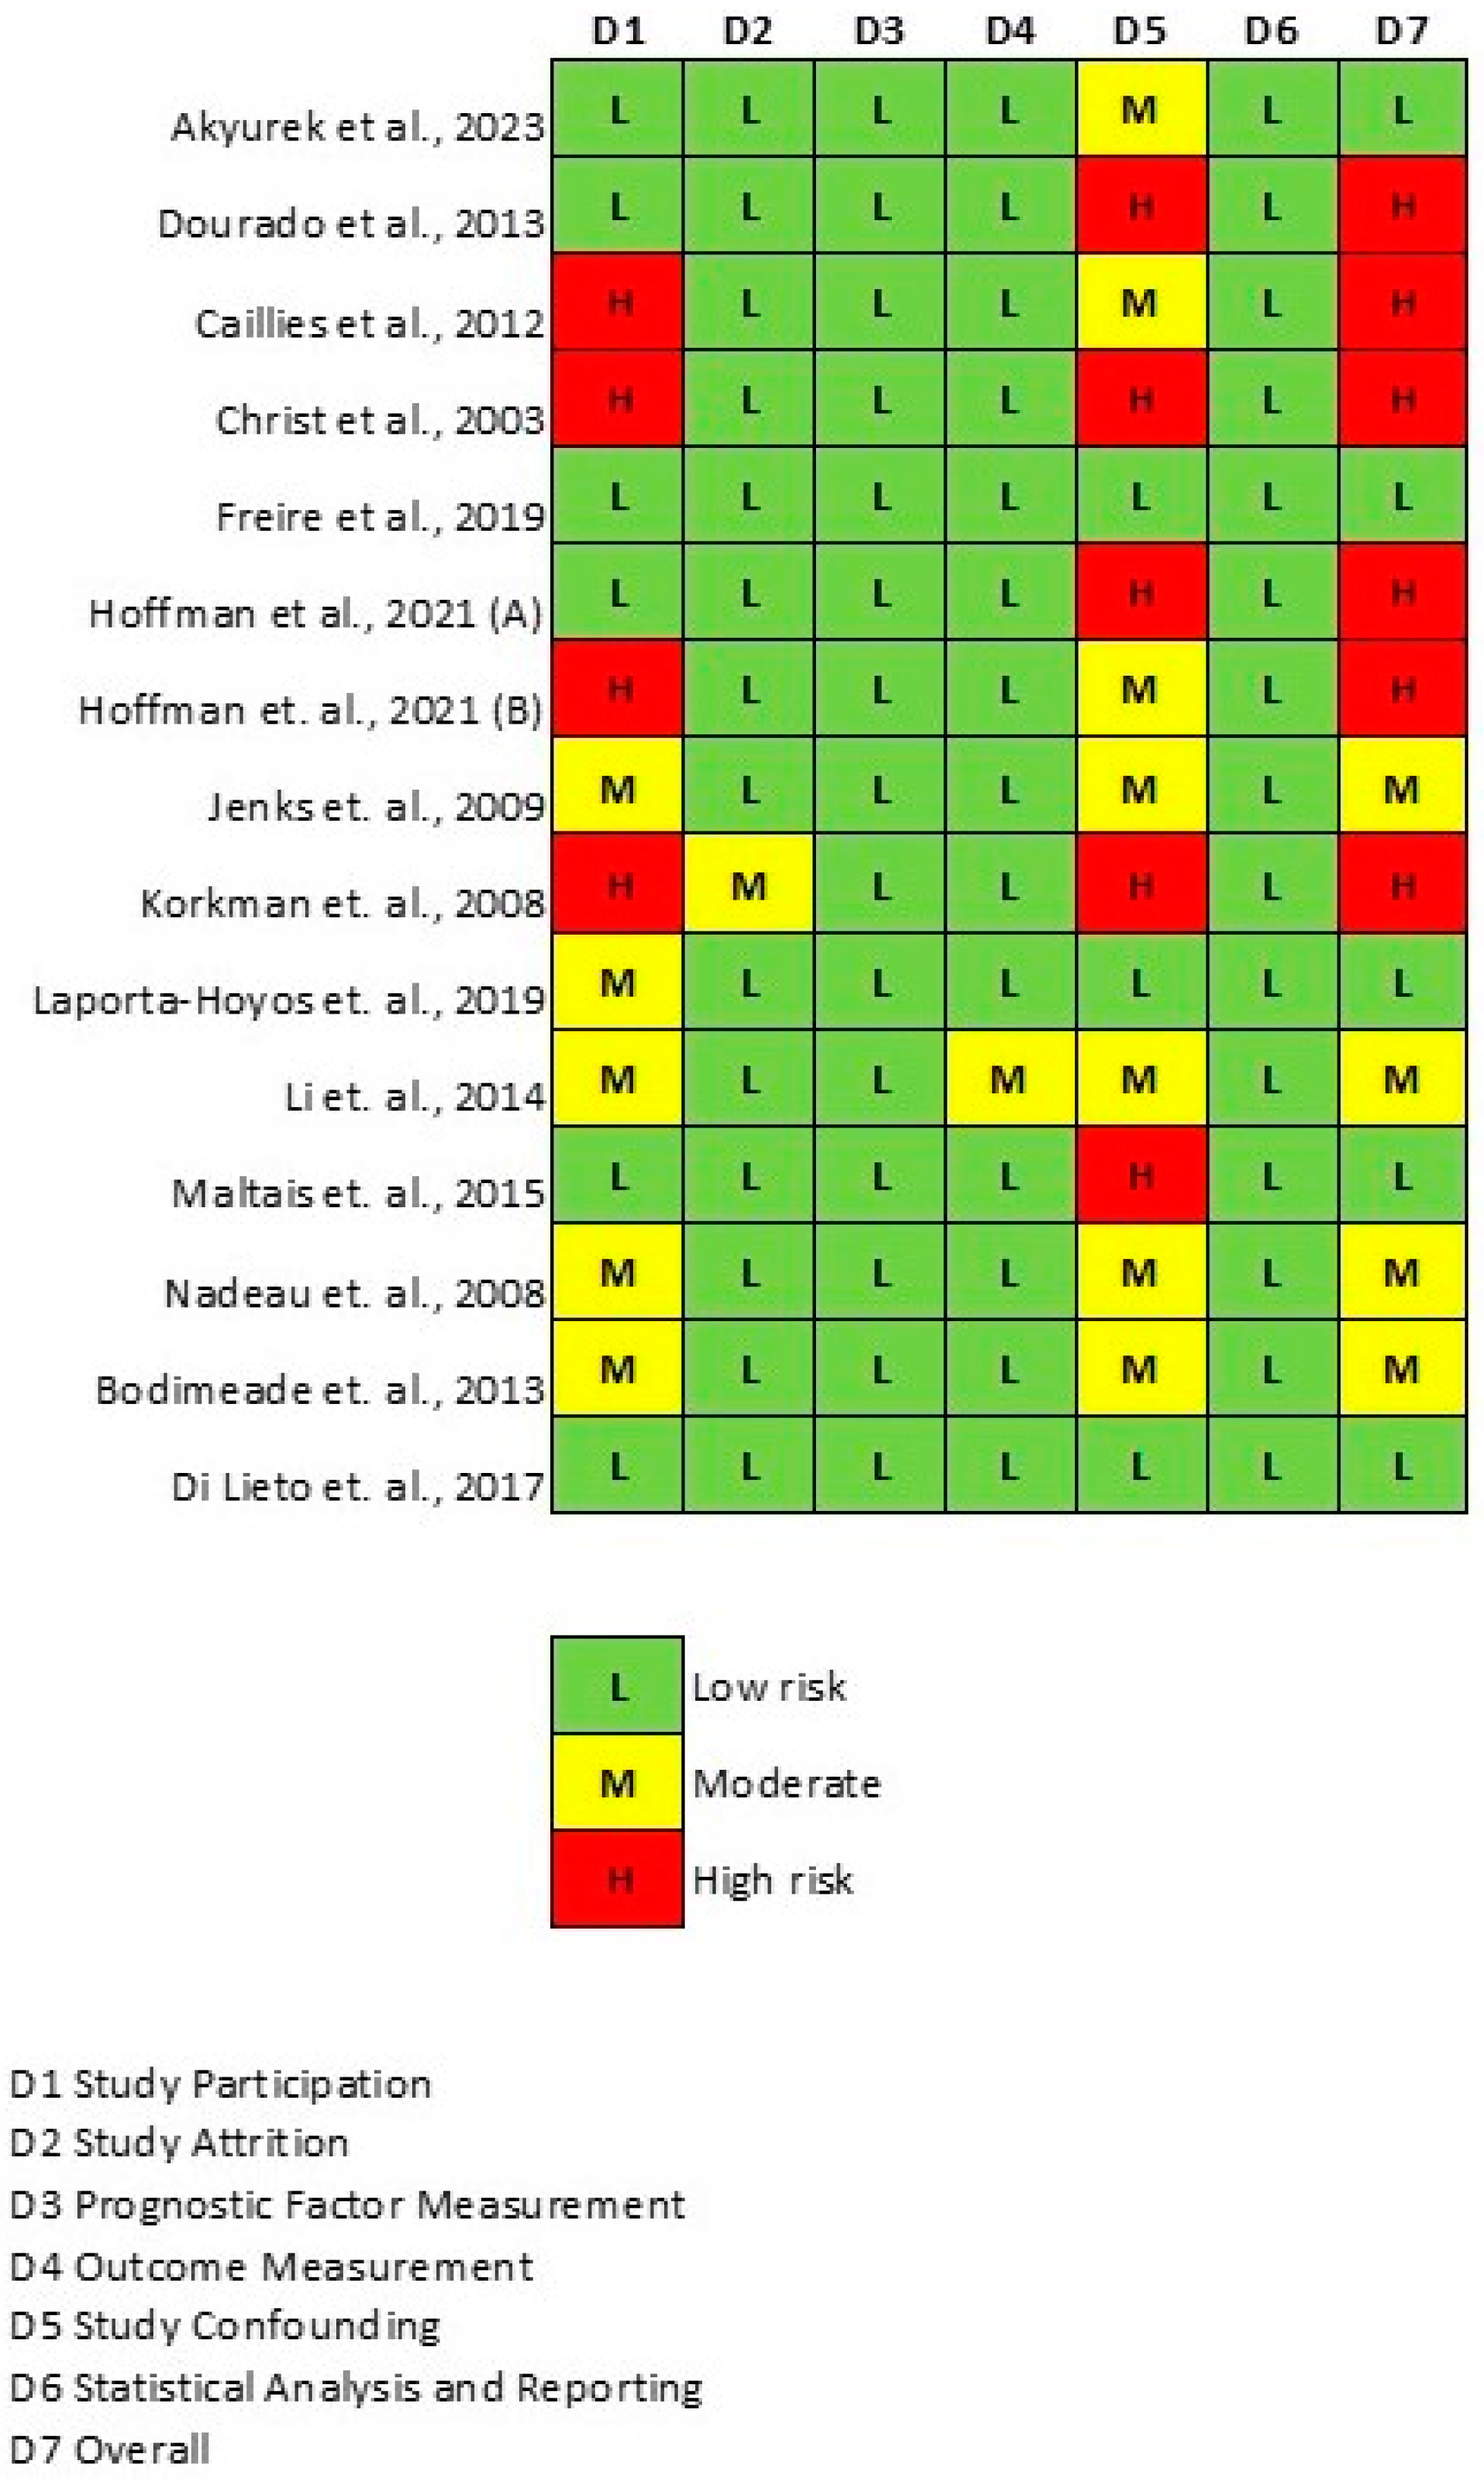
2.4. Quality Assessment
2.5. Statistical Analysis
2.6. Subgroup and Meta-Regression Analyses
3. Results
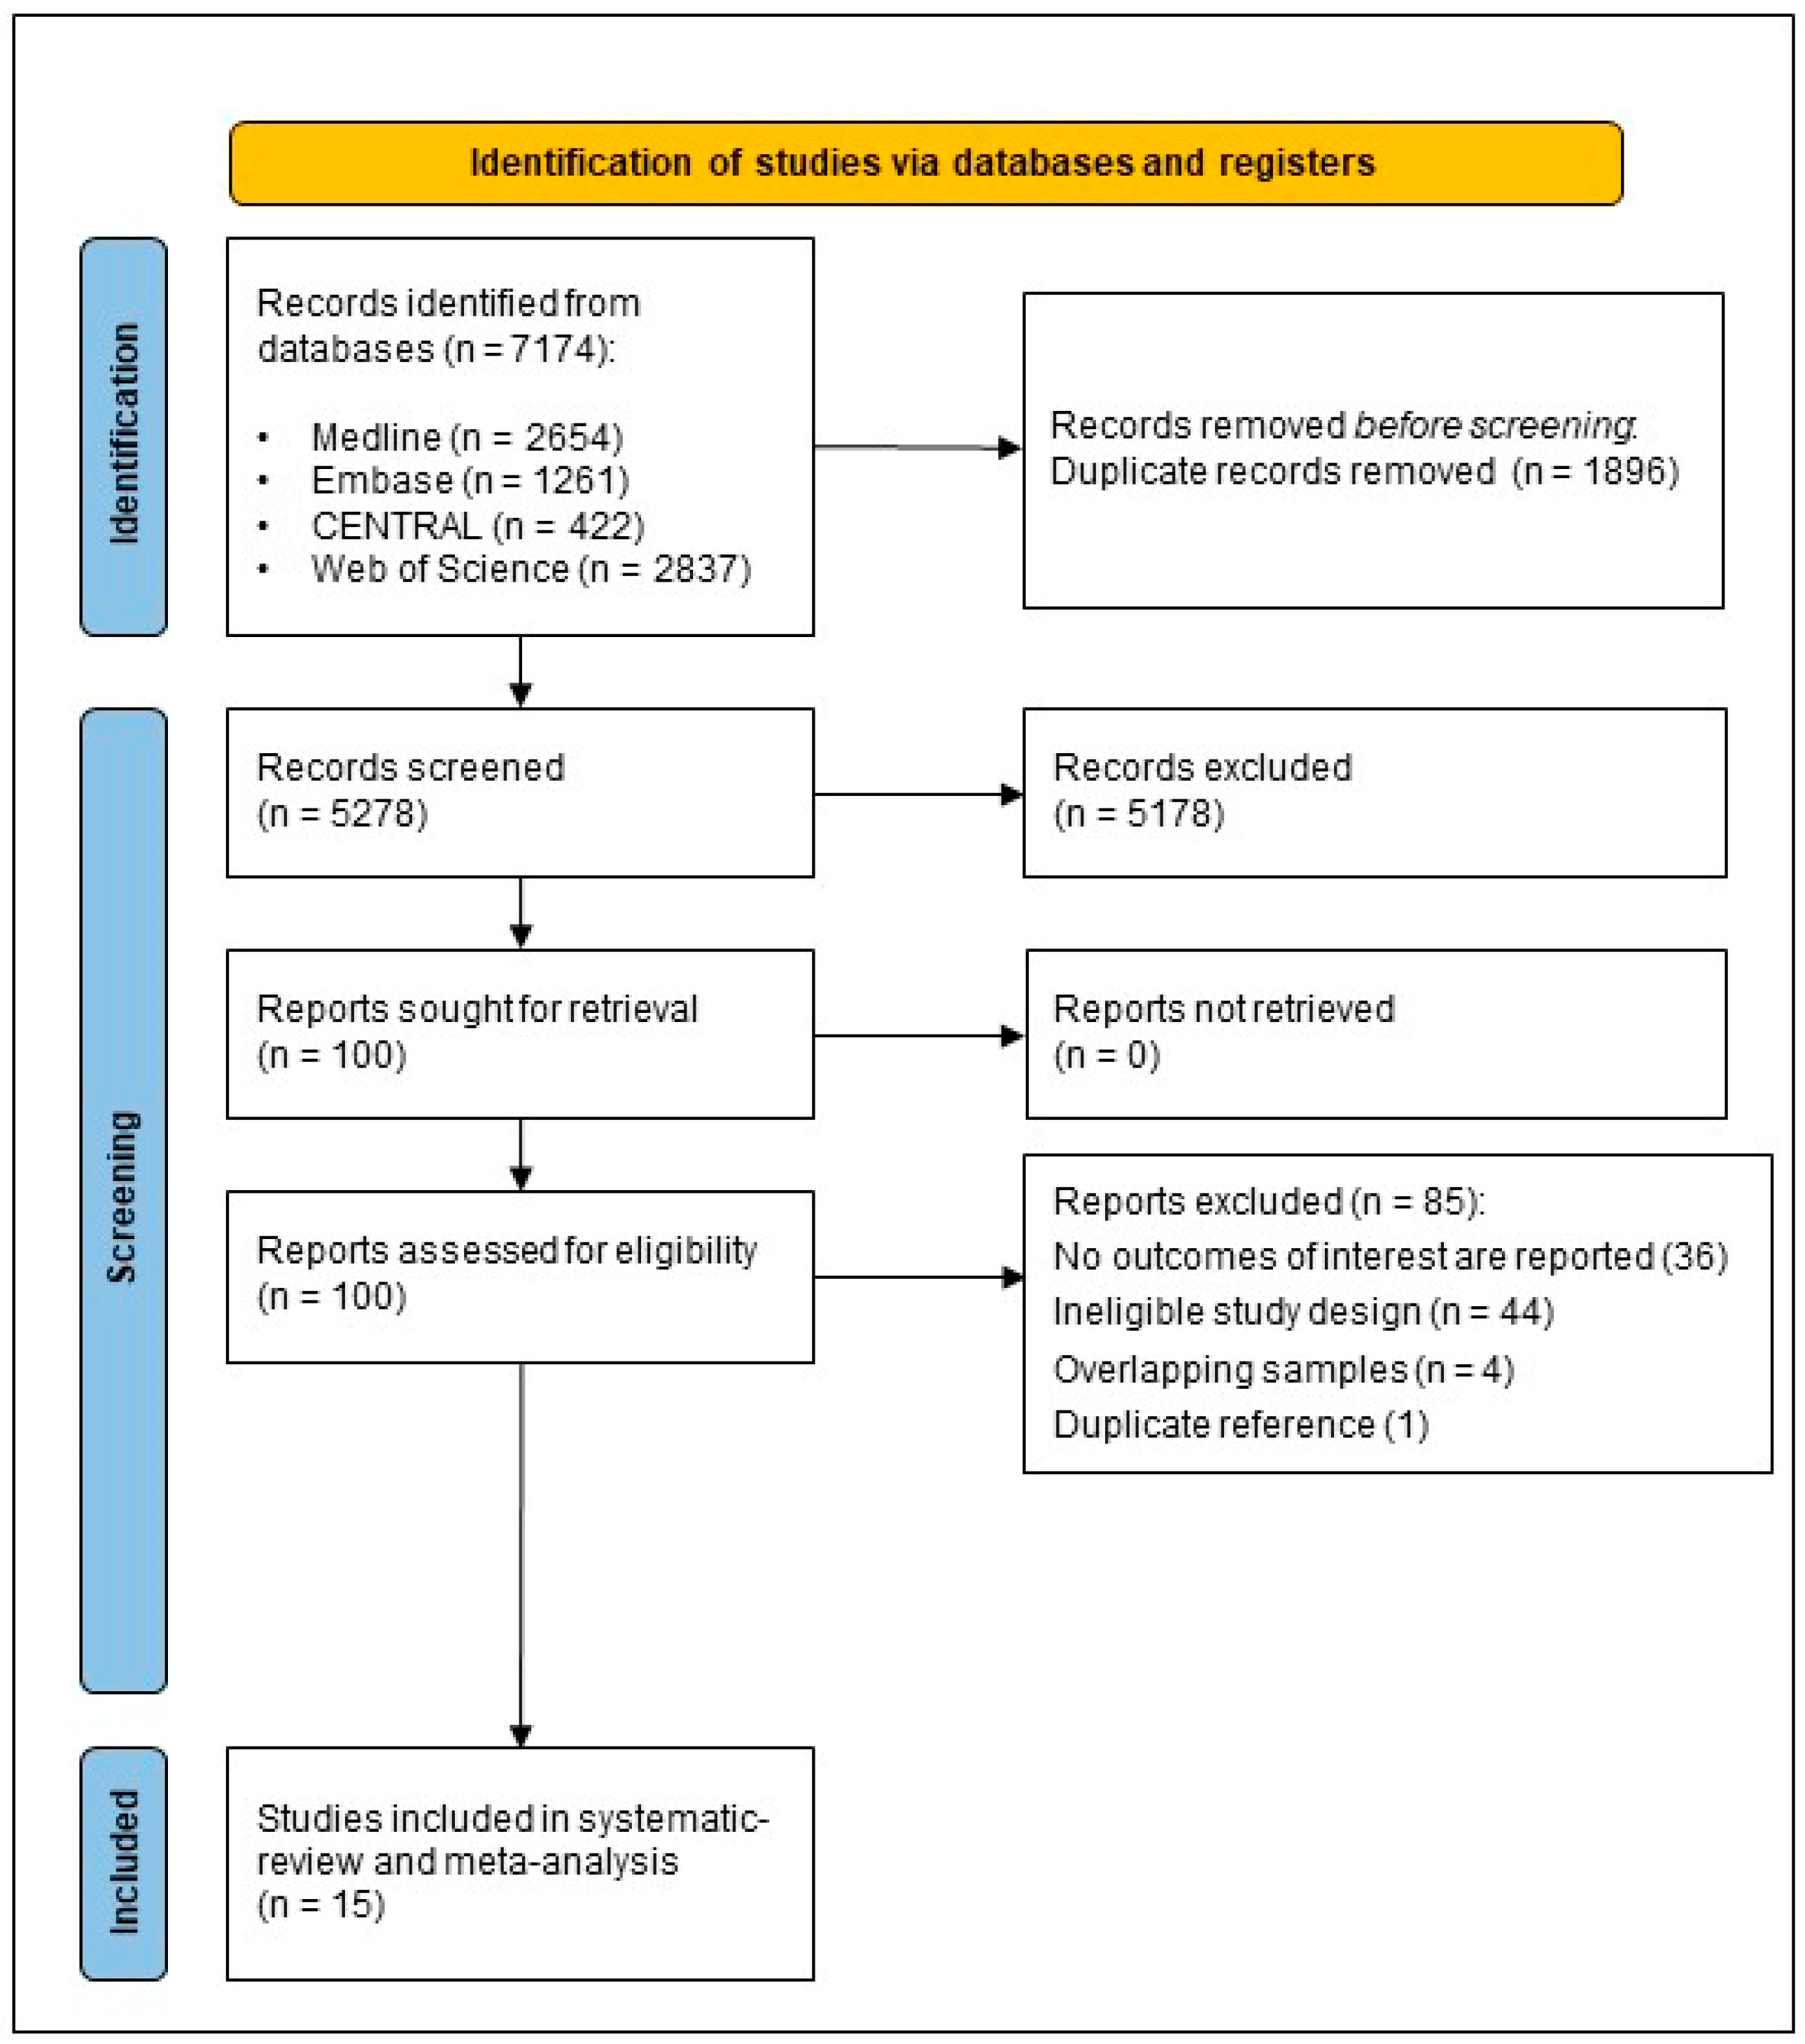
3.1. Search Results
3.2. Characteristics of the Studies Included
3.3. Results of Meta-Analysis
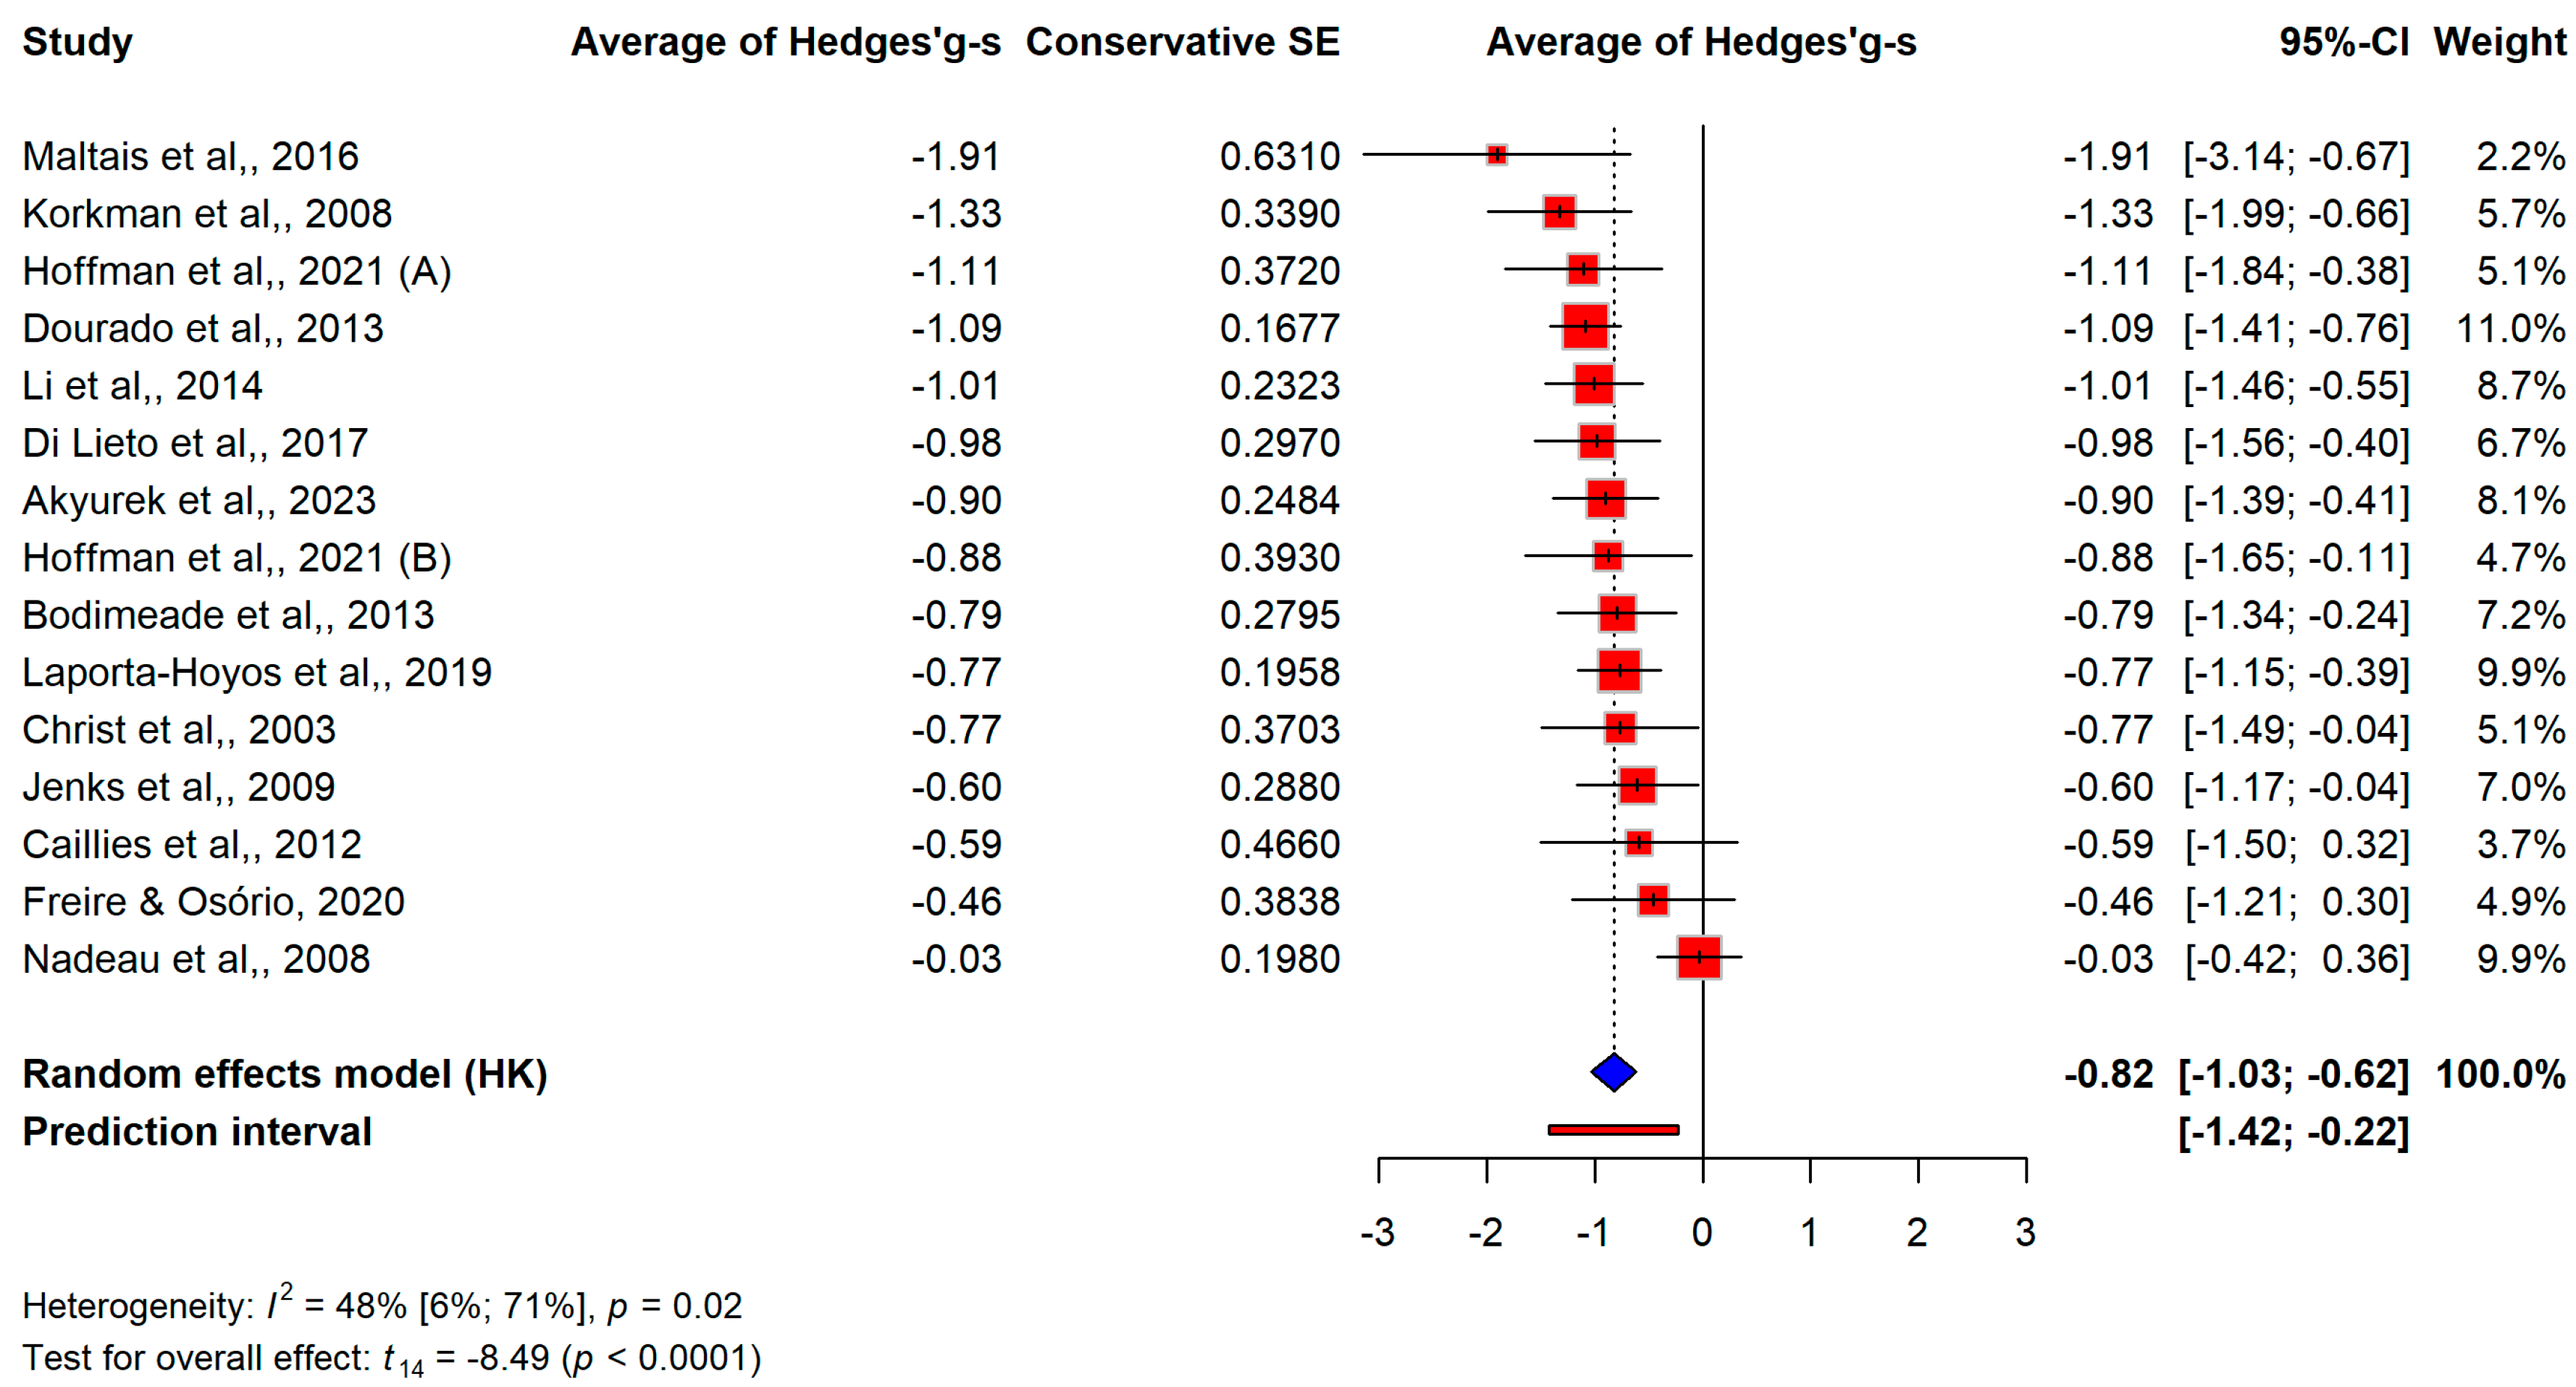
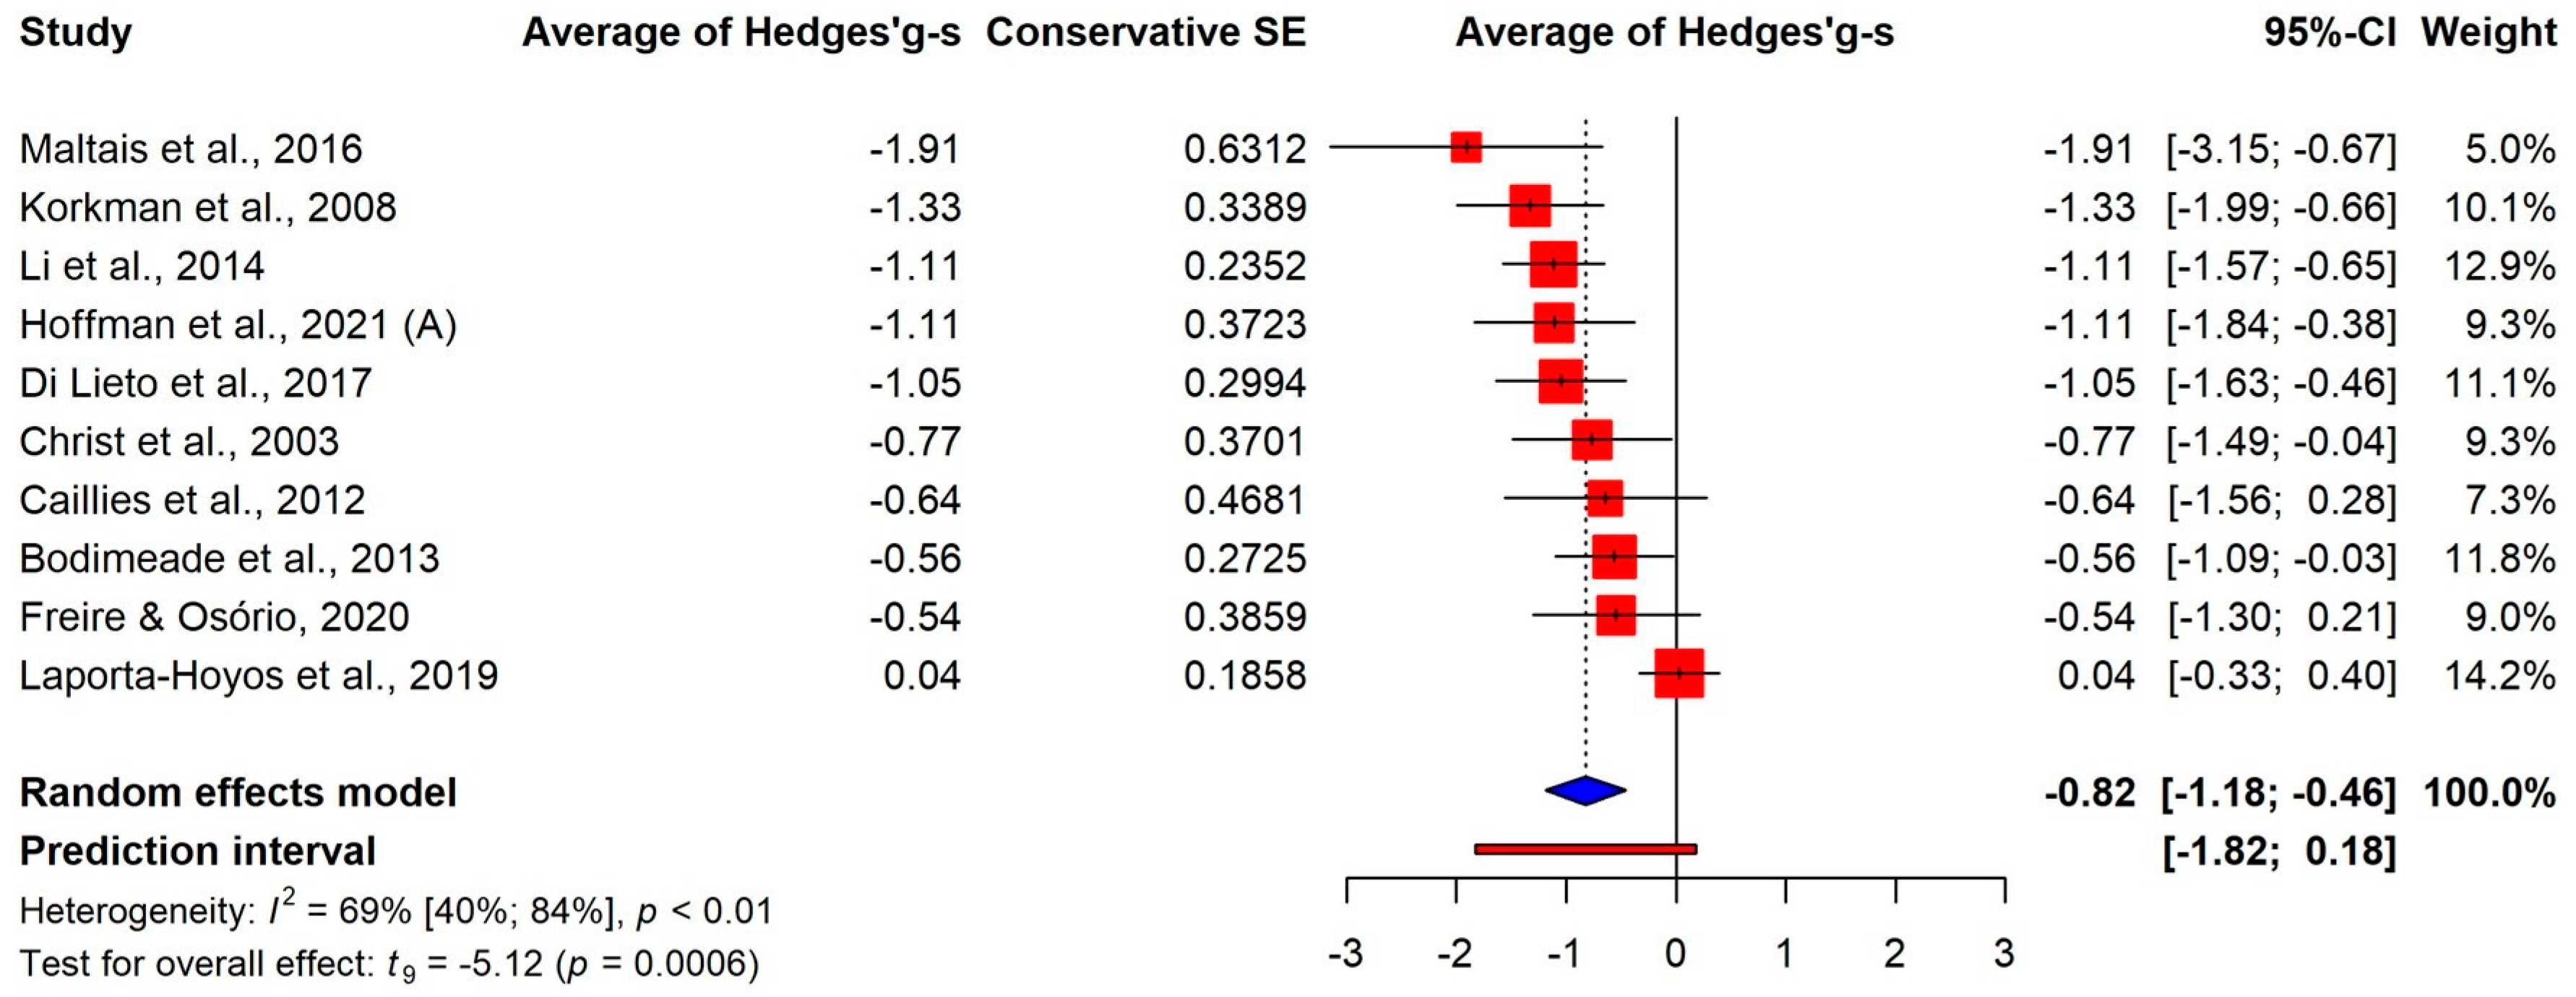
3.3.1. Overall Differences
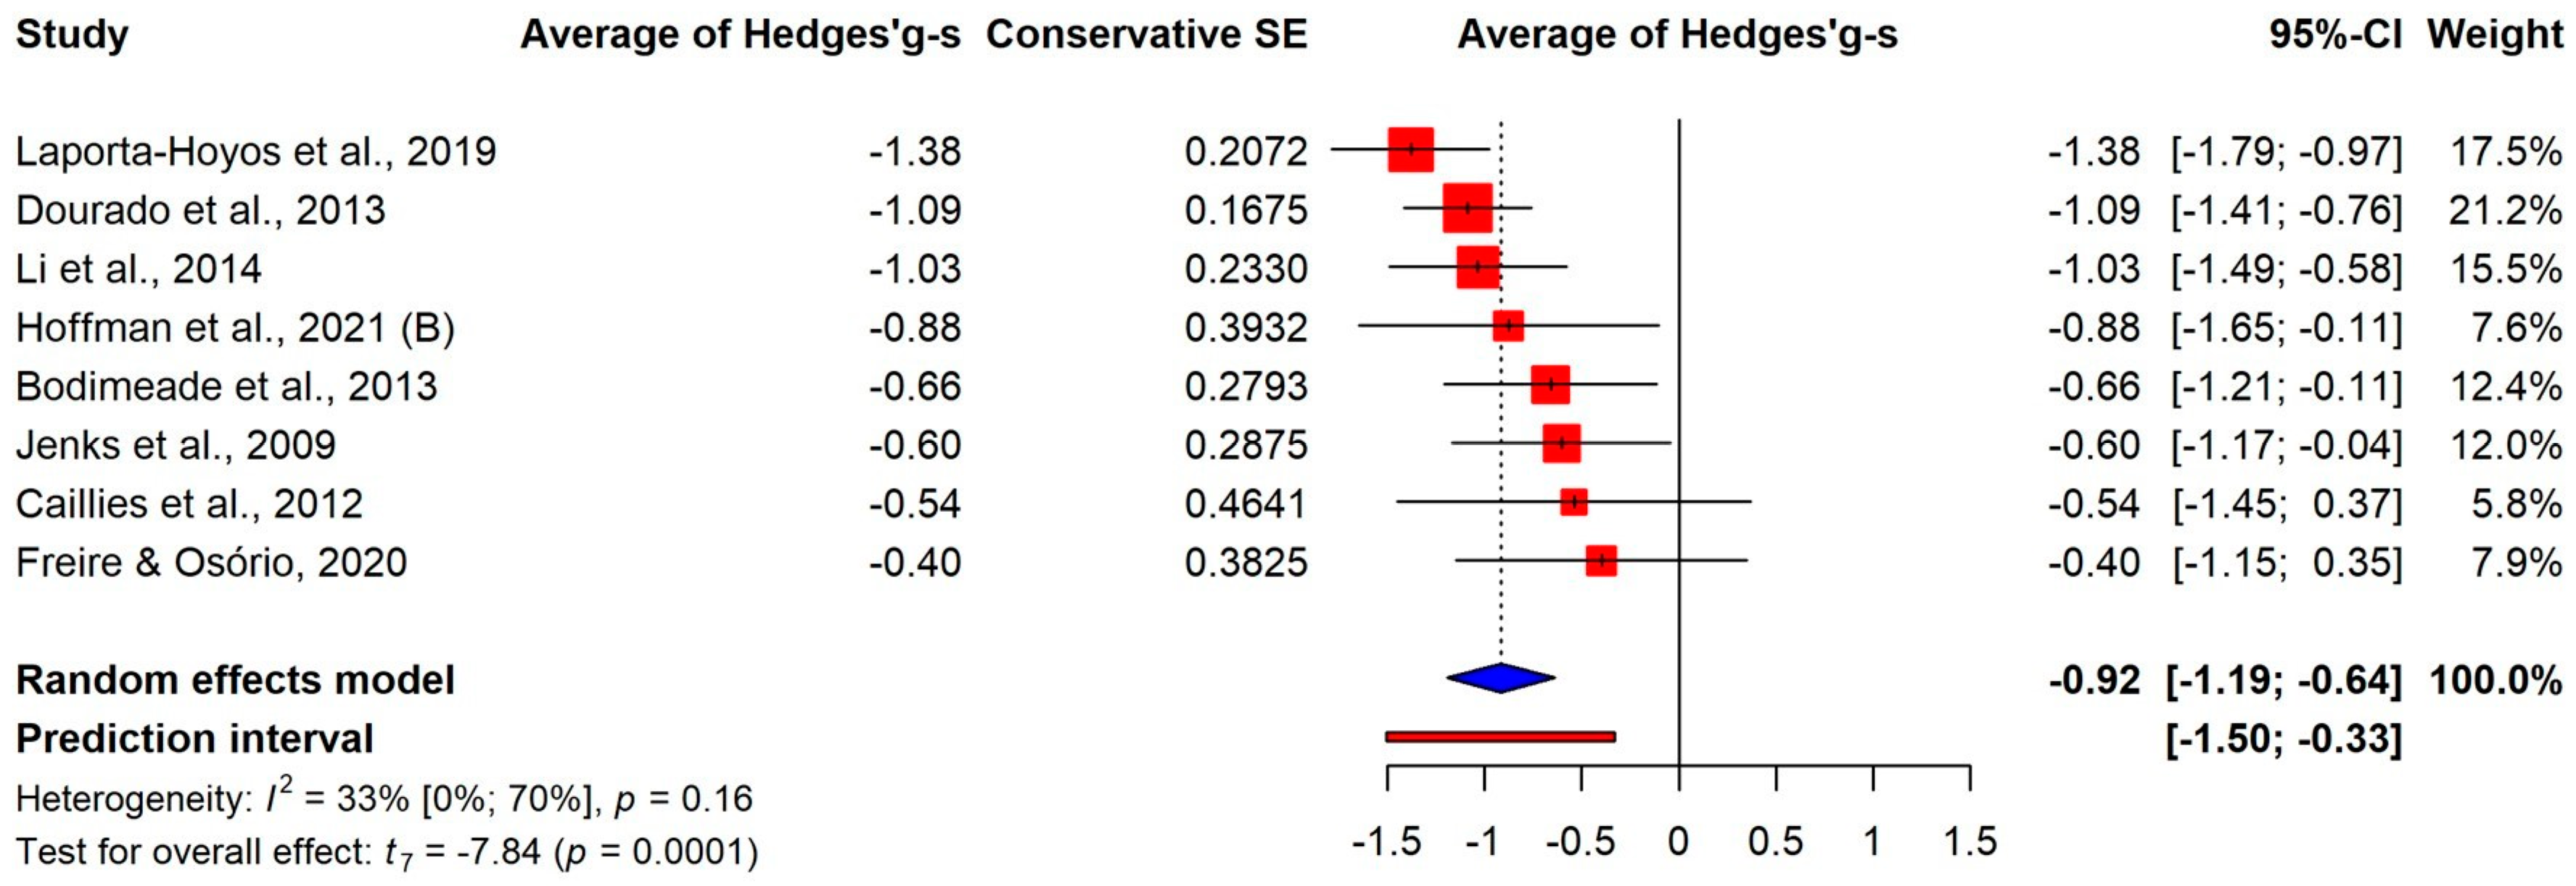
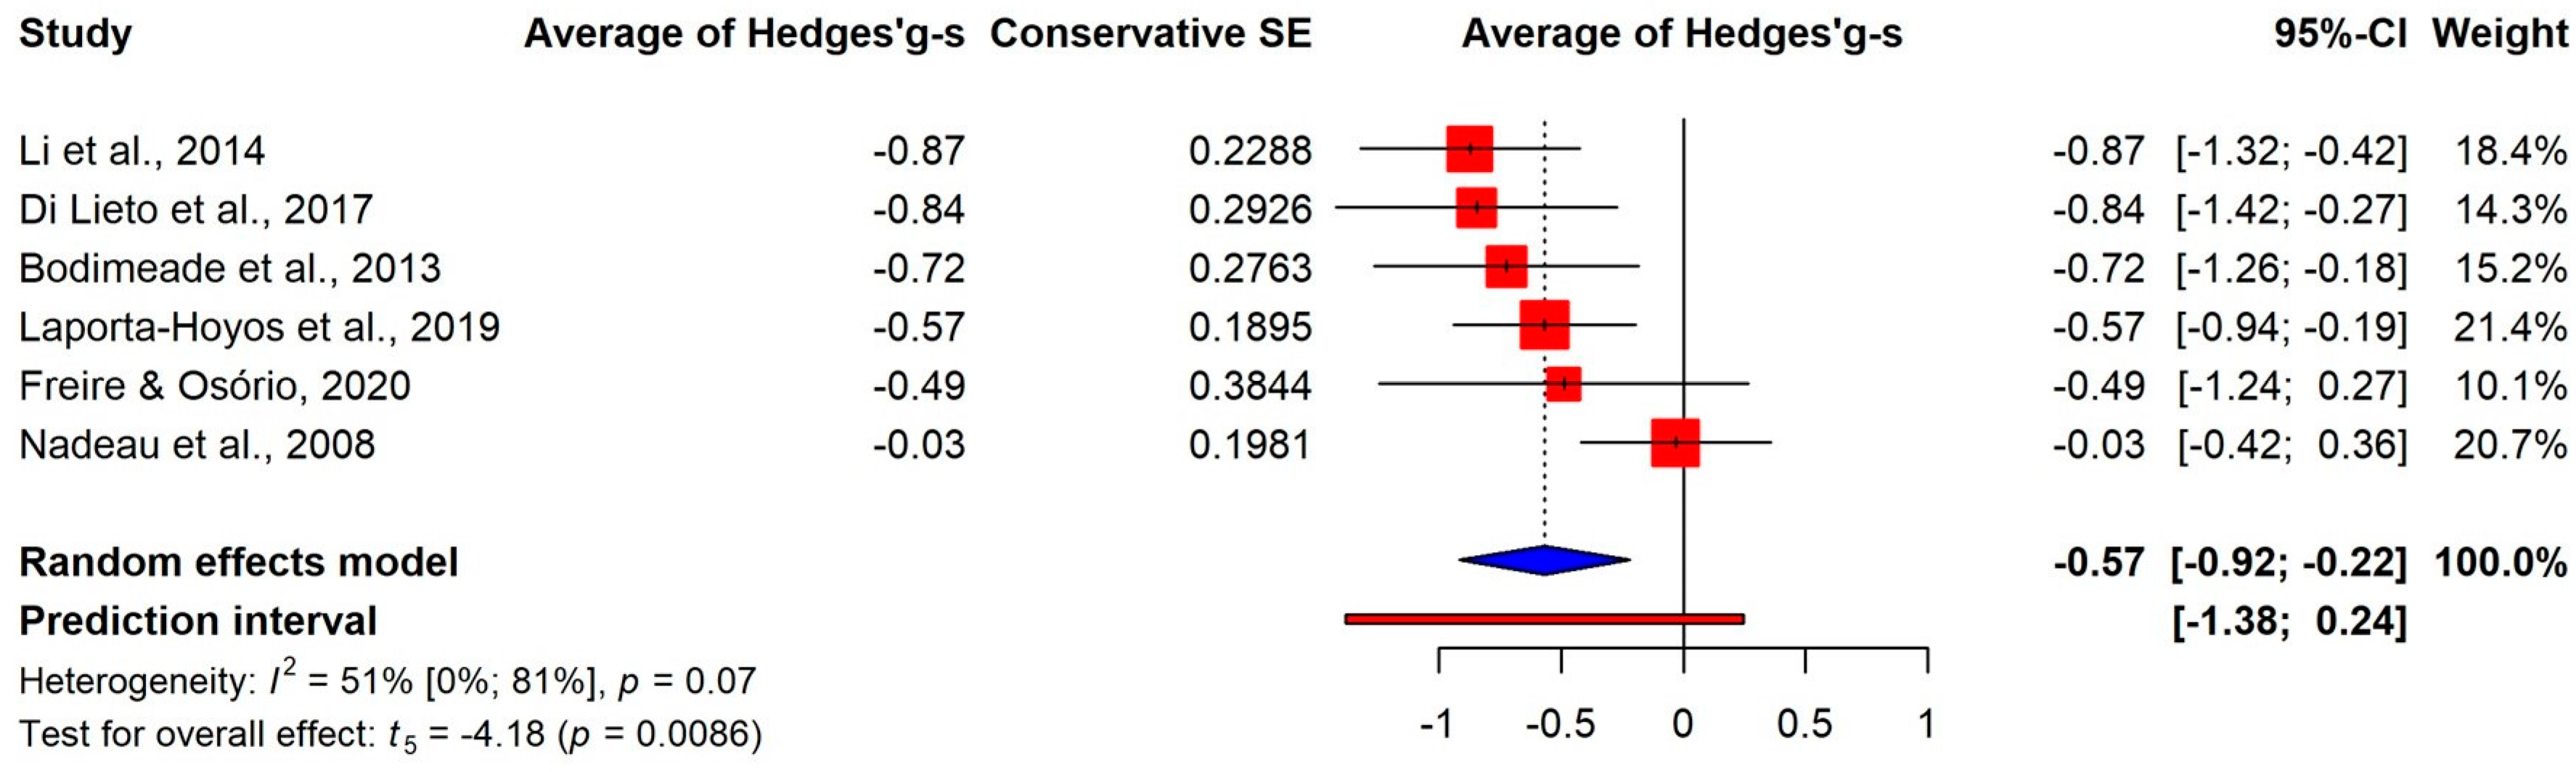
3.3.2. Differences on the Components
3.3.3. Permanent Deficit or Developmental Delay
3.3.4. Further Moderator Analyses
3.4. Publication Bias and Quality Assessment
4. Discussion
4.1. Strengths and Limitations
4.2. Implication for Practice
4.3. Implication for Research
5. Conclusions
Supplementary Materials
Author Contributions
Funding
Institutional Review Board Statement
Informed Consent Statement
Data Availability Statement
Acknowledgments
Conflicts of Interest
References
- Sellier, E.; Platt, M.J.; Andersen, G.L.; Krägeloh-Mann, I.; De La Cruz, J.; Cans, C.; Surveillance of Cerebral Palsy Network. Decreasing prevalence in cerebral palsy: A multi-site European population-based study, 1980 to 2003. Dev. Med. Child. Neurol. 2016, 58, 85–92. [Google Scholar] [CrossRef] [PubMed]
- Van Naarden Braun, K.; Doernberg, N.; Schieve, L.; Christensen, D.; Goodman, A.; Yeargin-Allsopp, M. Birth Prevalence of Cerebral Palsy: A Population-Based Study. Pediatrics 2016, 137, e20152872. [Google Scholar] [CrossRef] [PubMed]
- Rosenbaum, P.; Paneth, N.; Leviton, A.; Goldstein, M.; Bax, M.; Damiano, D.; Dan, B.; Jacobsson, B. A report: The definition and classification of cerebral palsy April 2006. Dev. Med. Child Neurol. 2007, 109, 8–14. [Google Scholar]
- Piscitelli, D.; Ferrarello, F.; Ugolini, A.; Verola, S.; Pellicciari, L. Measurement properties of the Gross Motor Function Classification System, Gross Motor Function Classification System-Expanded & Revised, Manual Ability Classification System, and Communication Function Classification System in cerebral palsy: A systematic review with meta-analysis. Dev. Med. Child. Neurol. 2021, 63, 1251–1261. [Google Scholar] [PubMed]
- Diamond, A. Executive functions. Annu. Rev. Psychol. 2013, 64, 135–168. [Google Scholar] [CrossRef] [PubMed]
- Allan, N.P.; Hume, L.E.; Allan, D.M.; Farrington, A.L.; Lonigan, C.J. Relations between inhibitory control and the development of academic skills in preschool and kindergarten: A meta-analysis. Dev. Psychol. 2014, 50, 2368–2379. [Google Scholar] [CrossRef]
- Jacob, R.; Parkinson, J. The potential for school-based interventions that target executive function to improve academic achievement: A review. Rev. Educ. Res. 2015, 85, 512–552. [Google Scholar] [CrossRef]
- Spiegel, J.A.; Goodrich, J.M.; Morris, B.M.; Osborne, C.M.; Lonigan, C.J. Relations between executive functions and academic outcomes in elementary school children: A meta-analysis. Psychol. Bull. 2021, 147, 329–351. [Google Scholar] [CrossRef]
- Rhoades, B.L.; Greenberg, M.T.; Domitrovich, C.E. The contribution of inhibitory control to preschoolers’ social–emotional competence. J. Appl. Dev. Psychol. 2009, 30, 310–320. [Google Scholar] [CrossRef]
- Li, Q.; Liu, P.; Yan, N.; Feng, T. Executive Function Training Improves Emotional Competence for Preschool Children: The Roles of Inhibition Control and Working Memory. Front. Psychol. 2020, 11, 347. [Google Scholar] [CrossRef]
- Hughes, C.; Ensor, R. Does executive function matter for preschoolers’ problem behaviors? J. Abnorm. Child. Psychol. 2008, 36, 1–14. [Google Scholar] [CrossRef] [PubMed]
- Miyake, A.; Friedman, N.P.; Emerson, M.J.; Witzki, A.H.; Howerter, A.; Wager, T.D. The unity and diversity of executive functions and their contributions to complex “Frontal Lobe” tasks: A latent variable analysis. Cogn. Psychol. 2000, 41, 49–100. [Google Scholar] [CrossRef] [PubMed]
- Bottcher, L. Children with spastic cerebral palsy, their cognitive functioning, and social participation: A review. Child. Neuropsychol. 2010, 16, 209–228. [Google Scholar] [CrossRef] [PubMed]
- Pereira, A.; Lopes, S.; Magalhães, P.; Sampaio, A.; Chaleta, E.; Rosário, P. How Executive Functions Are Evaluated in Children and Adolescents with Cerebral Palsy? A Systematic Review. Front. Psychol. 2018, 9, 21. [Google Scholar] [CrossRef] [PubMed]
- Straub, K.; Obrzut, J.E. Effects of cerebral palsy on neuropsychological function. J. Dev. Phys. Disabil. 2009, 21, 153–167. [Google Scholar] [CrossRef]
- Weierink, L.; Vermeulen, R.J.; Boyd, R.N. Brain structure and executive functions in children with cerebral palsy: A systematic review. Res. Dev. Disabil. 2013, 34, 1678–1688. [Google Scholar] [CrossRef] [PubMed]
- Best, J.R.; Miller, P.H. A developmental perspective on executive function. Child. Dev. 2010, 81, 1641–1660. [Google Scholar] [CrossRef] [PubMed]
- Moher, D.; Liberati, A.; Tetzlaff, J.; Altman, D.G.; PRISMA Group. Preferred reporting items for systematic reviews and meta-analyses: The PRISMA statement. PLoS Med. 2009, 6, e1000097. [Google Scholar] [CrossRef]
- Alloway, T.P.; Alloway, R.G. Investigating the predictive roles of working memory and IQ in academic attainment. J. Exp. Child. Psychol. 2010, 106, 20–29. [Google Scholar] [CrossRef]
- Hayden, J.A.; van der Windt, D.A.; Cartwright, J.L.; Côté, P.; Bombardier, C. Assessing bias in studies of prognostic factors. Ann. Intern. Med. 2013, 158, 280–286. [Google Scholar] [CrossRef]
- Harrer, M.; Cuijpers, P.; Furukawa, T.A.; Ebert, D.D. Doing Meta-Analysis with R: A Hands-On Guide; Chapman & Hall/CRC Press: New York, NY, USA, 2021. [Google Scholar]
- Higgins, J.P.T.; Thomas, J.; Chandler, J.; Cumpston, M.; Li, T.; Page, M.J.; Welch, V.A. Cochrane Handbook for Systematic ReViews of Interventions Version 6.3 (updated February 2022). Cochrane. 2022. Available online: www.training.cochrane.org/handbook (accessed on 24 February 2024).
- Pustejovsky, J.E.; Tipton, E. Meta-analysis with Robust Variance Estimation: Expanding the Range of Working Models. Prev. Sci. 2022, 23, 425–438. [Google Scholar] [CrossRef]
- Gleser, L.J.; Olkin, I. Stochastically dependent effect sizes. In The Handbook of Research Synthesis and Meta-Analysis, 2nd ed.; Cooper, H., Hedges, L.V., Valentine, J.C., Eds.; Russell Sage Foundation: New York, NY, USA, 2009; pp. 357–376. [Google Scholar]
- Akyurek, G.; Gurbuz, D.; Irmak, D. Comparison of the Executive Functions, Occupational Performance and Perceived Occupational Proficiency in Children with Neurodevelopmental Disorder. J. Occup. Ther. Sch. 2023, 1–18. [Google Scholar] [CrossRef]
- Bodimeade, H.L.; Whittingham, K.; Lloyd, O.; Boyd, R.N. Executive function in children and adolescents with unilateral cerebral palsy. Dev. Med. Child. Neurol. 2013, 55, 926–933. [Google Scholar] [CrossRef]
- Caillies, S.; Hody, A.; Calmus, A. Theory of mind and irony comprehension in children with cerebral palsy. Res. Dev. Disabil. 2012, 33, 1380–1388. [Google Scholar] [CrossRef]
- Christ, S.E.; White, D.A.; Brunstrom, J.E.; Abrams, R.A. Inhibitory control following perinatal brain injury. Neuropsychology 2003, 17, 171–178. [Google Scholar] [CrossRef]
- Di Lieto, M.C.; Brovedani, P.; Pecini, C.; Chilosi, A.M.; Belmonti, V.; Fabbro, F.; Urgesi, C.; Fiori, S.; Guzzetta, A.; Perazza, S.; et al. Spastic diplegia in preterm-born children: Executive function impairment and neuroanatomical correlates. Res. Dev. Disabil. 2017, 61, 116–126. [Google Scholar] [CrossRef]
- Dourado, M.R.; Andrade, P.M.; Ramos-Jorge, M.L.; Moreira, R.N.; Oliveira-Ferreira, F. Association between executive/attentional functions and caries in children with cerebral palsy. Res. Dev. Disabil. 2013, 34, 2493–2499. [Google Scholar] [CrossRef] [PubMed]
- Freire, T.C.; Osório, A. Executive functions and drawing in young children with cerebral palsy: Comparisons with typical development. Child. Neuropsychol. 2020, 26, 635–648. [Google Scholar] [CrossRef]
- Hoffman, R.M.; Embury, C.M.; Lew, B.J.; Heinrichs-Graham, E.; Wilson, T.W.; Kurz, M.J. Cortical oscillations that underlie visual selective attention are abnormal in adolescents with cerebral palsy. Sci. Rep. 2021, 11, 4661. [Google Scholar] [CrossRef] [PubMed]
- Hoffman, R.M.; Trevarrow, M.P.; Bergwell, H.R.; Embury, C.M.; Heinrichs-Graham, E.; Wilson, T.W.; Kurz, M.J. Cortical oscillations that underlie working memory are altered in adults with cerebral palsy. Clin. Neurophysiol. 2021, 132, 938–945. [Google Scholar] [CrossRef] [PubMed]
- Jenks, K.M.; de Moor, J.; van Lieshout, E.C. Arithmetic difficulties in children with cerebral palsy are related to executive function and working memory. J. Child. Psychol. Psychiatry 2009, 50, 824–833. [Google Scholar] [CrossRef]
- Korkman, M.; Mikkola, K.; Ritari, N.; Tommiska, V.; Salokorpi, T.; Haataja, L.; Tammela, O.; Pääkkönen, L.; Olsén, P.; Fellman, V. Neurocognitive test profiles of extremely low birth weight five-year-old children differ according to neuromotor status. Dev. Neuropsychol. 2008, 33, 637–655. [Google Scholar] [CrossRef] [PubMed]
- Laporta-Hoyos, O.; Ballester-Plané, J.; Leiva, D.; Ribas, T.; Miralbell, J.; Torroja-Nualart, C.; Russi, M.E.; Toro-Tamargo, E.; Meléndez-Plumed, M.; Gimeno, F.; et al. Executive function and general intellectual functioning in dyskinetic cerebral palsy: Comparison with spastic cerebral palsy and typically developing controls. Eur. J. Paediatr. Neurol. 2019, 23, 546–559. [Google Scholar] [CrossRef] [PubMed]
- Li, X.; Wang, K.; Wu, J.; Hong, Y.; Zhao, J.; Feng, X.; Xu, M.; Wang, M.; Ndasauka, Y.; Zhang, X. The link between impaired theory of mind and executive function in children with cerebral palsy. Res. Dev. Disabil. 2014, 35, 1686–1693. [Google Scholar] [CrossRef] [PubMed]
- Maltais, D.B.; Gane, C.; Dufour, S.K.; Wyss, D.; Bouyer, L.J.; McFadyen, B.J.; Zabjek, K.; Andrysek, J.; Voisen, J.I. Acute Physical Exercise Affects Cognitive Functioning in Children With Cerebral Palsy. Pediatr. Exerc. Sci. 2016, 28, 304–311. [Google Scholar] [CrossRef]
- Nadeau, L.; Routhier, M.E.; Tessier, R. The performance profile on the Wisconsin Card Sorting Test of a group of children with cerebral palsy aged between 9 and 12. Dev. Neurorehabil. 2008, 11, 134–140. [Google Scholar] [CrossRef]


| Author, Publication Year | Country | Age M (Year) | Type of CP | No. of CP’s Patients | GMFCS * | MACS ** | Outcome Measure |
|---|---|---|---|---|---|---|---|
| Akyurek et. al., 2023 [25] | Turkey | 8.5 | Spastic | 22 | mild | mix | Executive Function (mix): 1. Executive Function and Occupational Routines Scale (EFFORTS) |
| Bodimeade et al., 2013 [26] | Australia | 11.09 | Spastic | 46 | mild | mild | Working memory (4 measures): 1. Digit span (backward) 2. Rey/Osterrieth ComplexFigure task 3. Code transmission test 4. Verbal fluency Inhibitory control (1 measure): 1. Stroop Cognitive flexibility (2 measures): 1. Tower of London 2. Stroop Executive functions (mix): 1. Behavior Rating Inventory of Executive Function (BRIEF) |
| Caillies et al., 2012 [27] | France | 9.3 | Spastic | 10 | no data | no data | Working memory (2 measures): 1. Digit span (backward) 2. Letter–Number Sequencing Inhibitory control (2 measures): 1. Stroop 2. Knock–Tap |
| Christ et al., 2003 [28] | USA | 13.9 | Spastic | 13 | no data | no data | Inhibitory control (3 measures): 1. Stroop 2. Stimulus–response reversal task 3. Antisaccade task |
| Di Lieto et al., 2017 [29] | Italy | 8.58 | Spastic | 19 | mix | mild | Inhibitory control (1 measure): 1. NEPSY Statue and Auditory Attention and Response Set subtest, part A Cognitive flexibility (1 measure): 1. NEPSY Statue and Auditory Attention and Response Set subtest, part A |
| Dourado et.al., 2013 [30] | Brazil | 8.9 | Spastic | 76 | mild | no data | Working memory (3 measures): 1. Corsi Blocktapping Test (backward) 2. Digit span (backward) 3. Rey/Osterrieth ComplexFigure task |
| Freire et al., 2019 [31] | Brazil | 4.97 | Spastic | 14 | mild | mild | Working memory (2 measures): 1. Reverse words Inhibitory control (1 measure): 1. Stroop Cognitive flexibility (1 measure): 1. Trail-making Test |
| Hoffman et al. (A), 2021 [32] | USA | 15.7 | Spastic | 14 | mild | mix | Inhibitory control (1 measure): 1. Eriksen Flanker task |
| Hoffman et al. (B), 2021 [33] | USA | 34.2 | Spastic | 13 | mix | no data | Working memory (2 measure): 1. Sternberg-type working memory task |
| Jenks et al., 2009 [34] | Netherlands | 7.0 | Spastic | 57 | no data | no data | Working memory (1 measure): 1. Digit span (backward) |
| Korkman et al., 2008 [35] | Finland | 5.82 | Spastic | 12 | no data | no data | Inhibitory control (1 measure): 1. NEPSY Statue and Auditory Attention and Response Set subtest, part A |
| Laporta-Hoyos et al., 2019 [36] | Spain | 20.5 | Spastic | 52 | mix | mix | Working memory (2 measures): 1. Corsi Blocktapping Test (backward) 2. Digit span (backward) Inhibitory control (1 measure): 1. Stop Signal task Cognitive flexibility (2 measures): 1. Wisconsin Card Sorting Test (WCST) 2. Stockings of Cambridge (SOC) test from the CANTAB. |
| 20.5 | Dyskinetic | 20 | mix | mix | |||
| Li et al., 2014 [37] | China | 10.40 | Spastic | 42 | no data | no data | Working memory (1 measure): 1. Running Memory Inhibitory control (1 measure): 1. Day-night task Cognitive flexibility (1 measure): 1. Plus–minus task |
| Maltais et al., 2015 [38] | Canada | 11.4 | Spastic | 8 | mild | no data | Inhibitory control (1 measure): 1. Stroop |
| Nadeau et al., 2008 [39] | Canada | 11.4 | Spastic | 52 | mild | no data | Cognitive flexibility (1 measure): 1. Wisconsin Card Sorting Test (WCST) |
Disclaimer/Publisher’s Note: The statements, opinions and data contained in all publications are solely those of the individual author(s) and contributor(s) and not of MDPI and/or the editor(s). MDPI and/or the editor(s) disclaim responsibility for any injury to people or property resulting from any ideas, methods, instructions or products referred to in the content. |
© 2024 by the authors. Licensee MDPI, Basel, Switzerland. This article is an open access article distributed under the terms and conditions of the Creative Commons Attribution (CC BY) license (https://creativecommons.org/licenses/by/4.0/).
Share and Cite
Zimonyi, N.; Kói, T.; Dombrádi, V.; Imrei, M.; Nagy, R.; Pulay, M.Á.; Lang, Z.; Hegyi, P.; Takacs, Z.K.; Túri, I. Comparison of Executive Function Skills between Patients with Cerebral Palsy and Typically Developing Populations: A Systematic Review and Meta-Analysis. J. Clin. Med. 2024, 13, 1867. https://doi.org/10.3390/jcm13071867
Zimonyi N, Kói T, Dombrádi V, Imrei M, Nagy R, Pulay MÁ, Lang Z, Hegyi P, Takacs ZK, Túri I. Comparison of Executive Function Skills between Patients with Cerebral Palsy and Typically Developing Populations: A Systematic Review and Meta-Analysis. Journal of Clinical Medicine. 2024; 13(7):1867. https://doi.org/10.3390/jcm13071867
Chicago/Turabian StyleZimonyi, Nóra, Tamás Kói, Viktor Dombrádi, Marcell Imrei, Rita Nagy, Márk Ágoston Pulay, Zsolt Lang, Péter Hegyi, Zsofia K. Takacs, and Ibolya Túri. 2024. "Comparison of Executive Function Skills between Patients with Cerebral Palsy and Typically Developing Populations: A Systematic Review and Meta-Analysis" Journal of Clinical Medicine 13, no. 7: 1867. https://doi.org/10.3390/jcm13071867
APA StyleZimonyi, N., Kói, T., Dombrádi, V., Imrei, M., Nagy, R., Pulay, M. Á., Lang, Z., Hegyi, P., Takacs, Z. K., & Túri, I. (2024). Comparison of Executive Function Skills between Patients with Cerebral Palsy and Typically Developing Populations: A Systematic Review and Meta-Analysis. Journal of Clinical Medicine, 13(7), 1867. https://doi.org/10.3390/jcm13071867