

The Sum of the Leg Length Discrepancy and the Difference in Global Femoral Offset Is Equal to That of the Contralateral Intact Side and Improves Postoperative Outcomes after Total Hip Arthroplasty: A Three-Dimensional Analysis

 ,
,
Abstract
1. Introduction
2. Materials and Methods
2.1. Patients
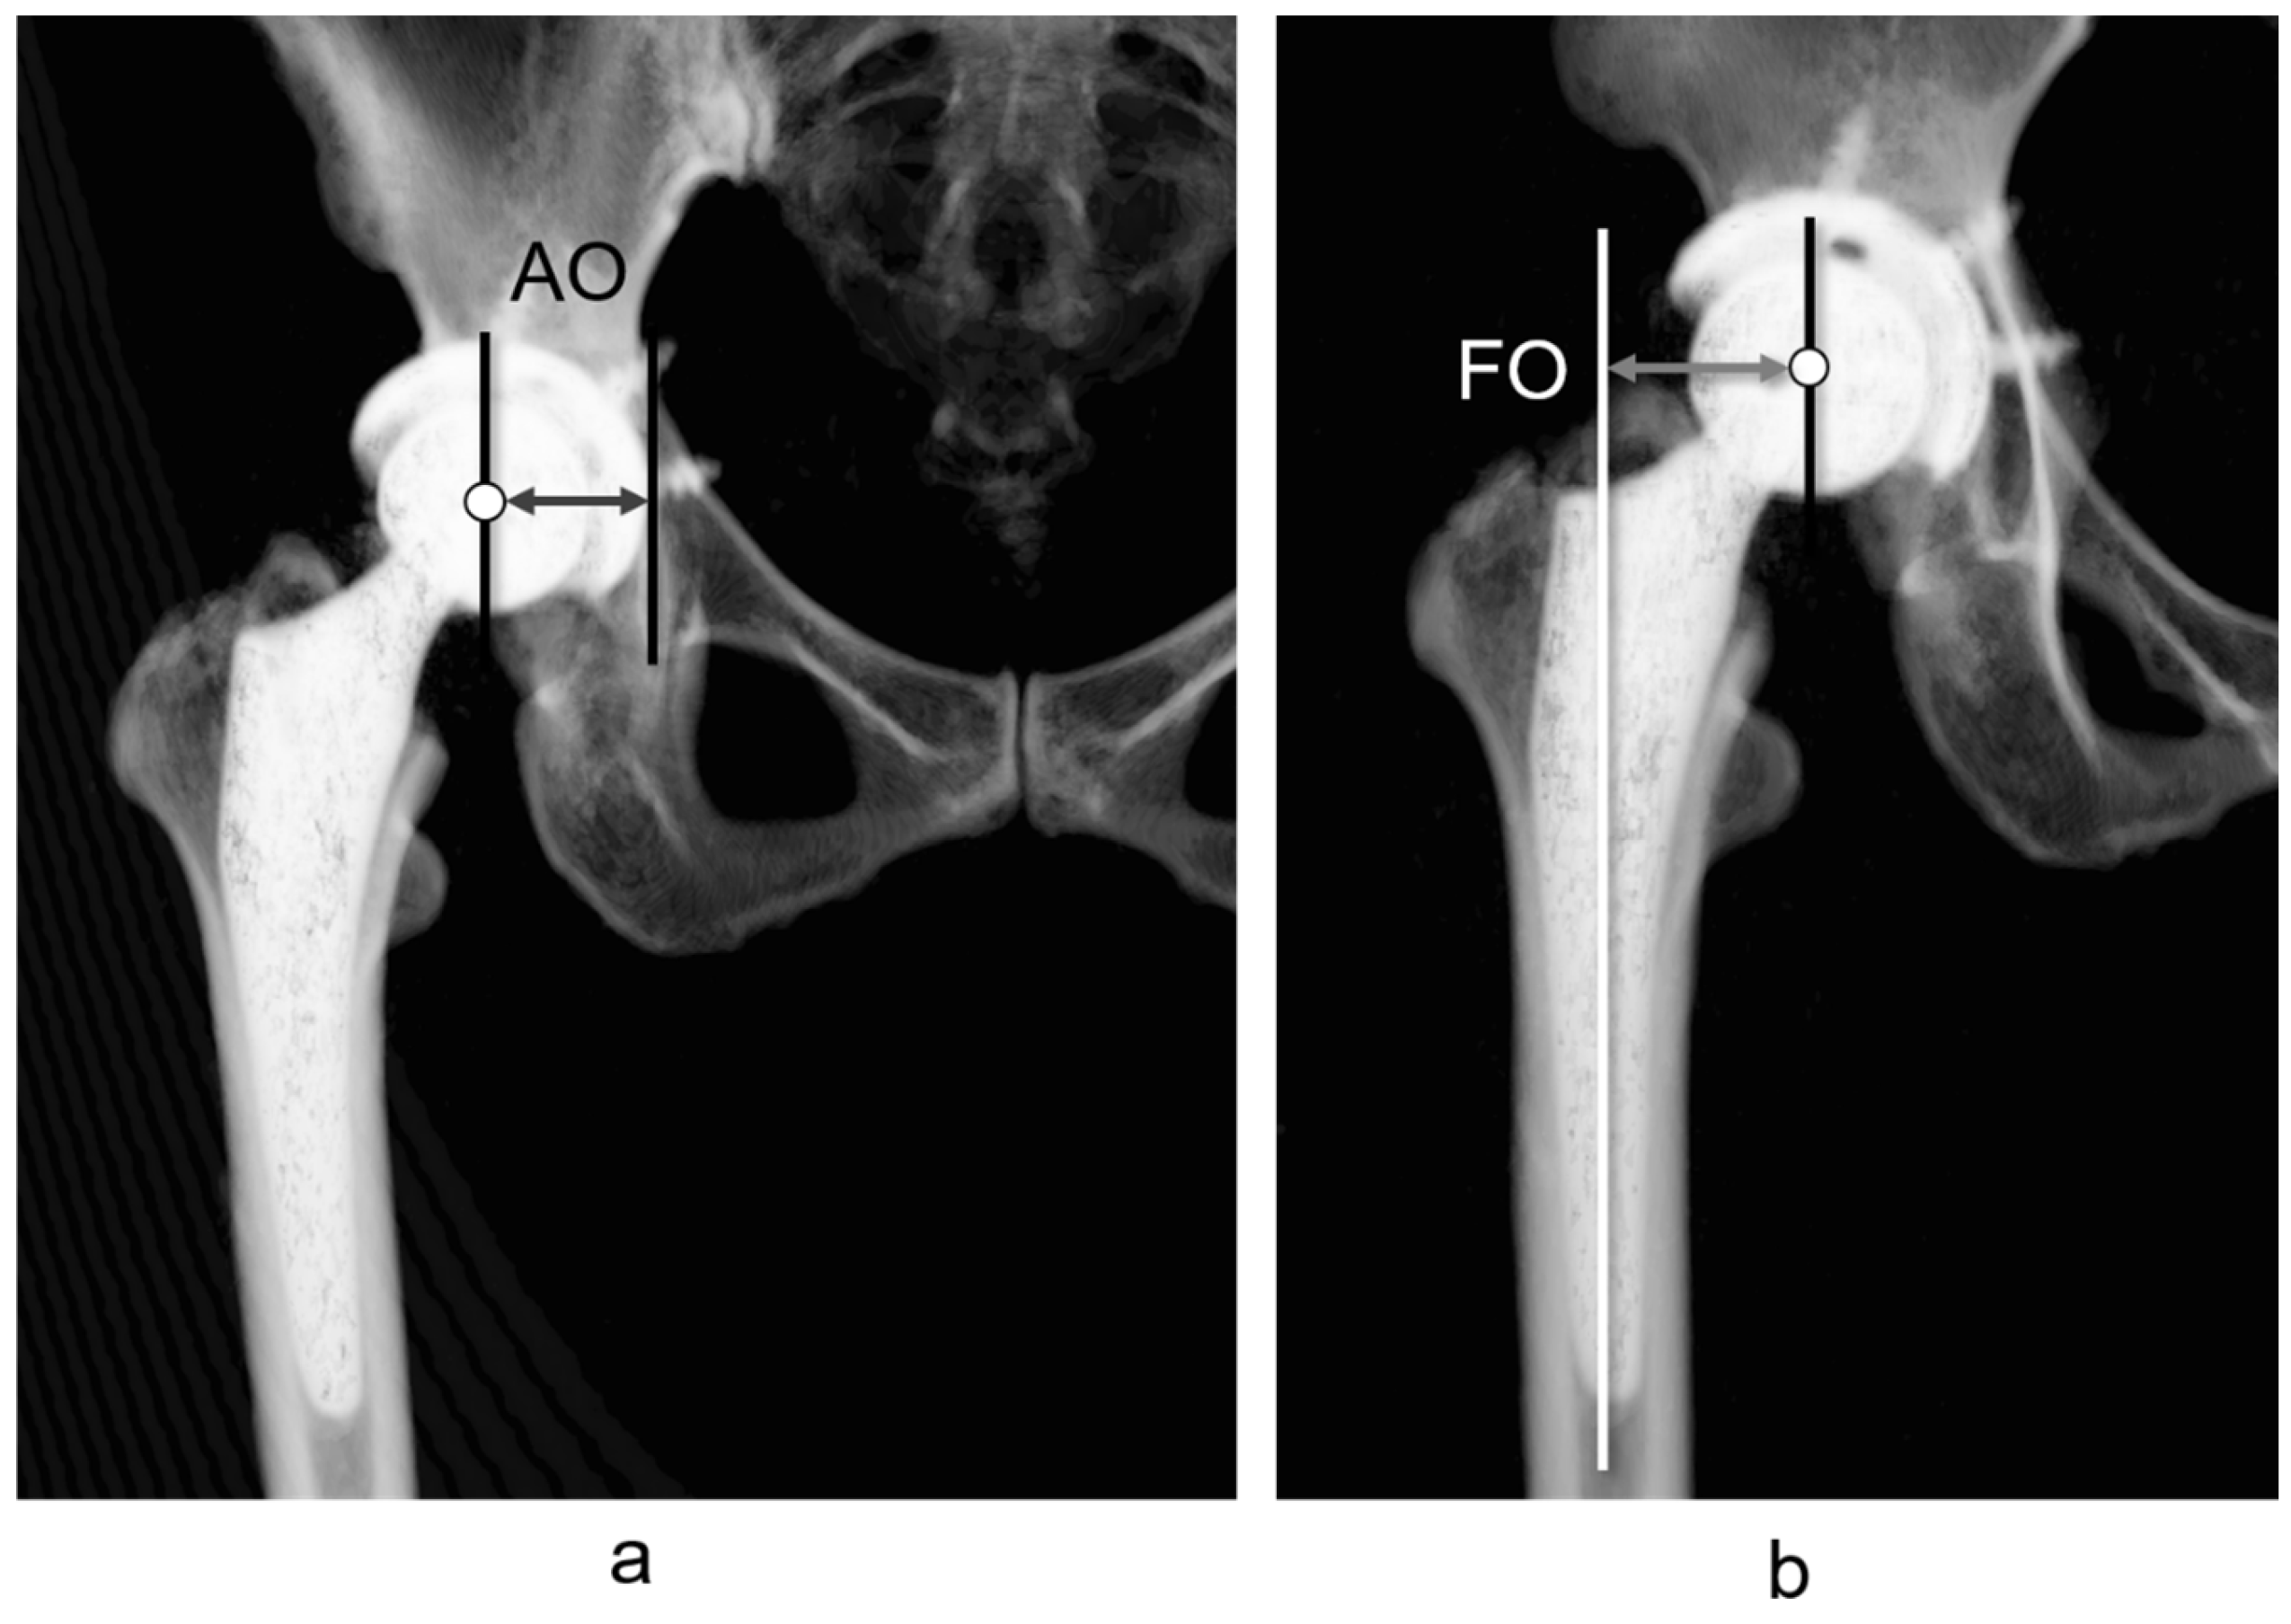
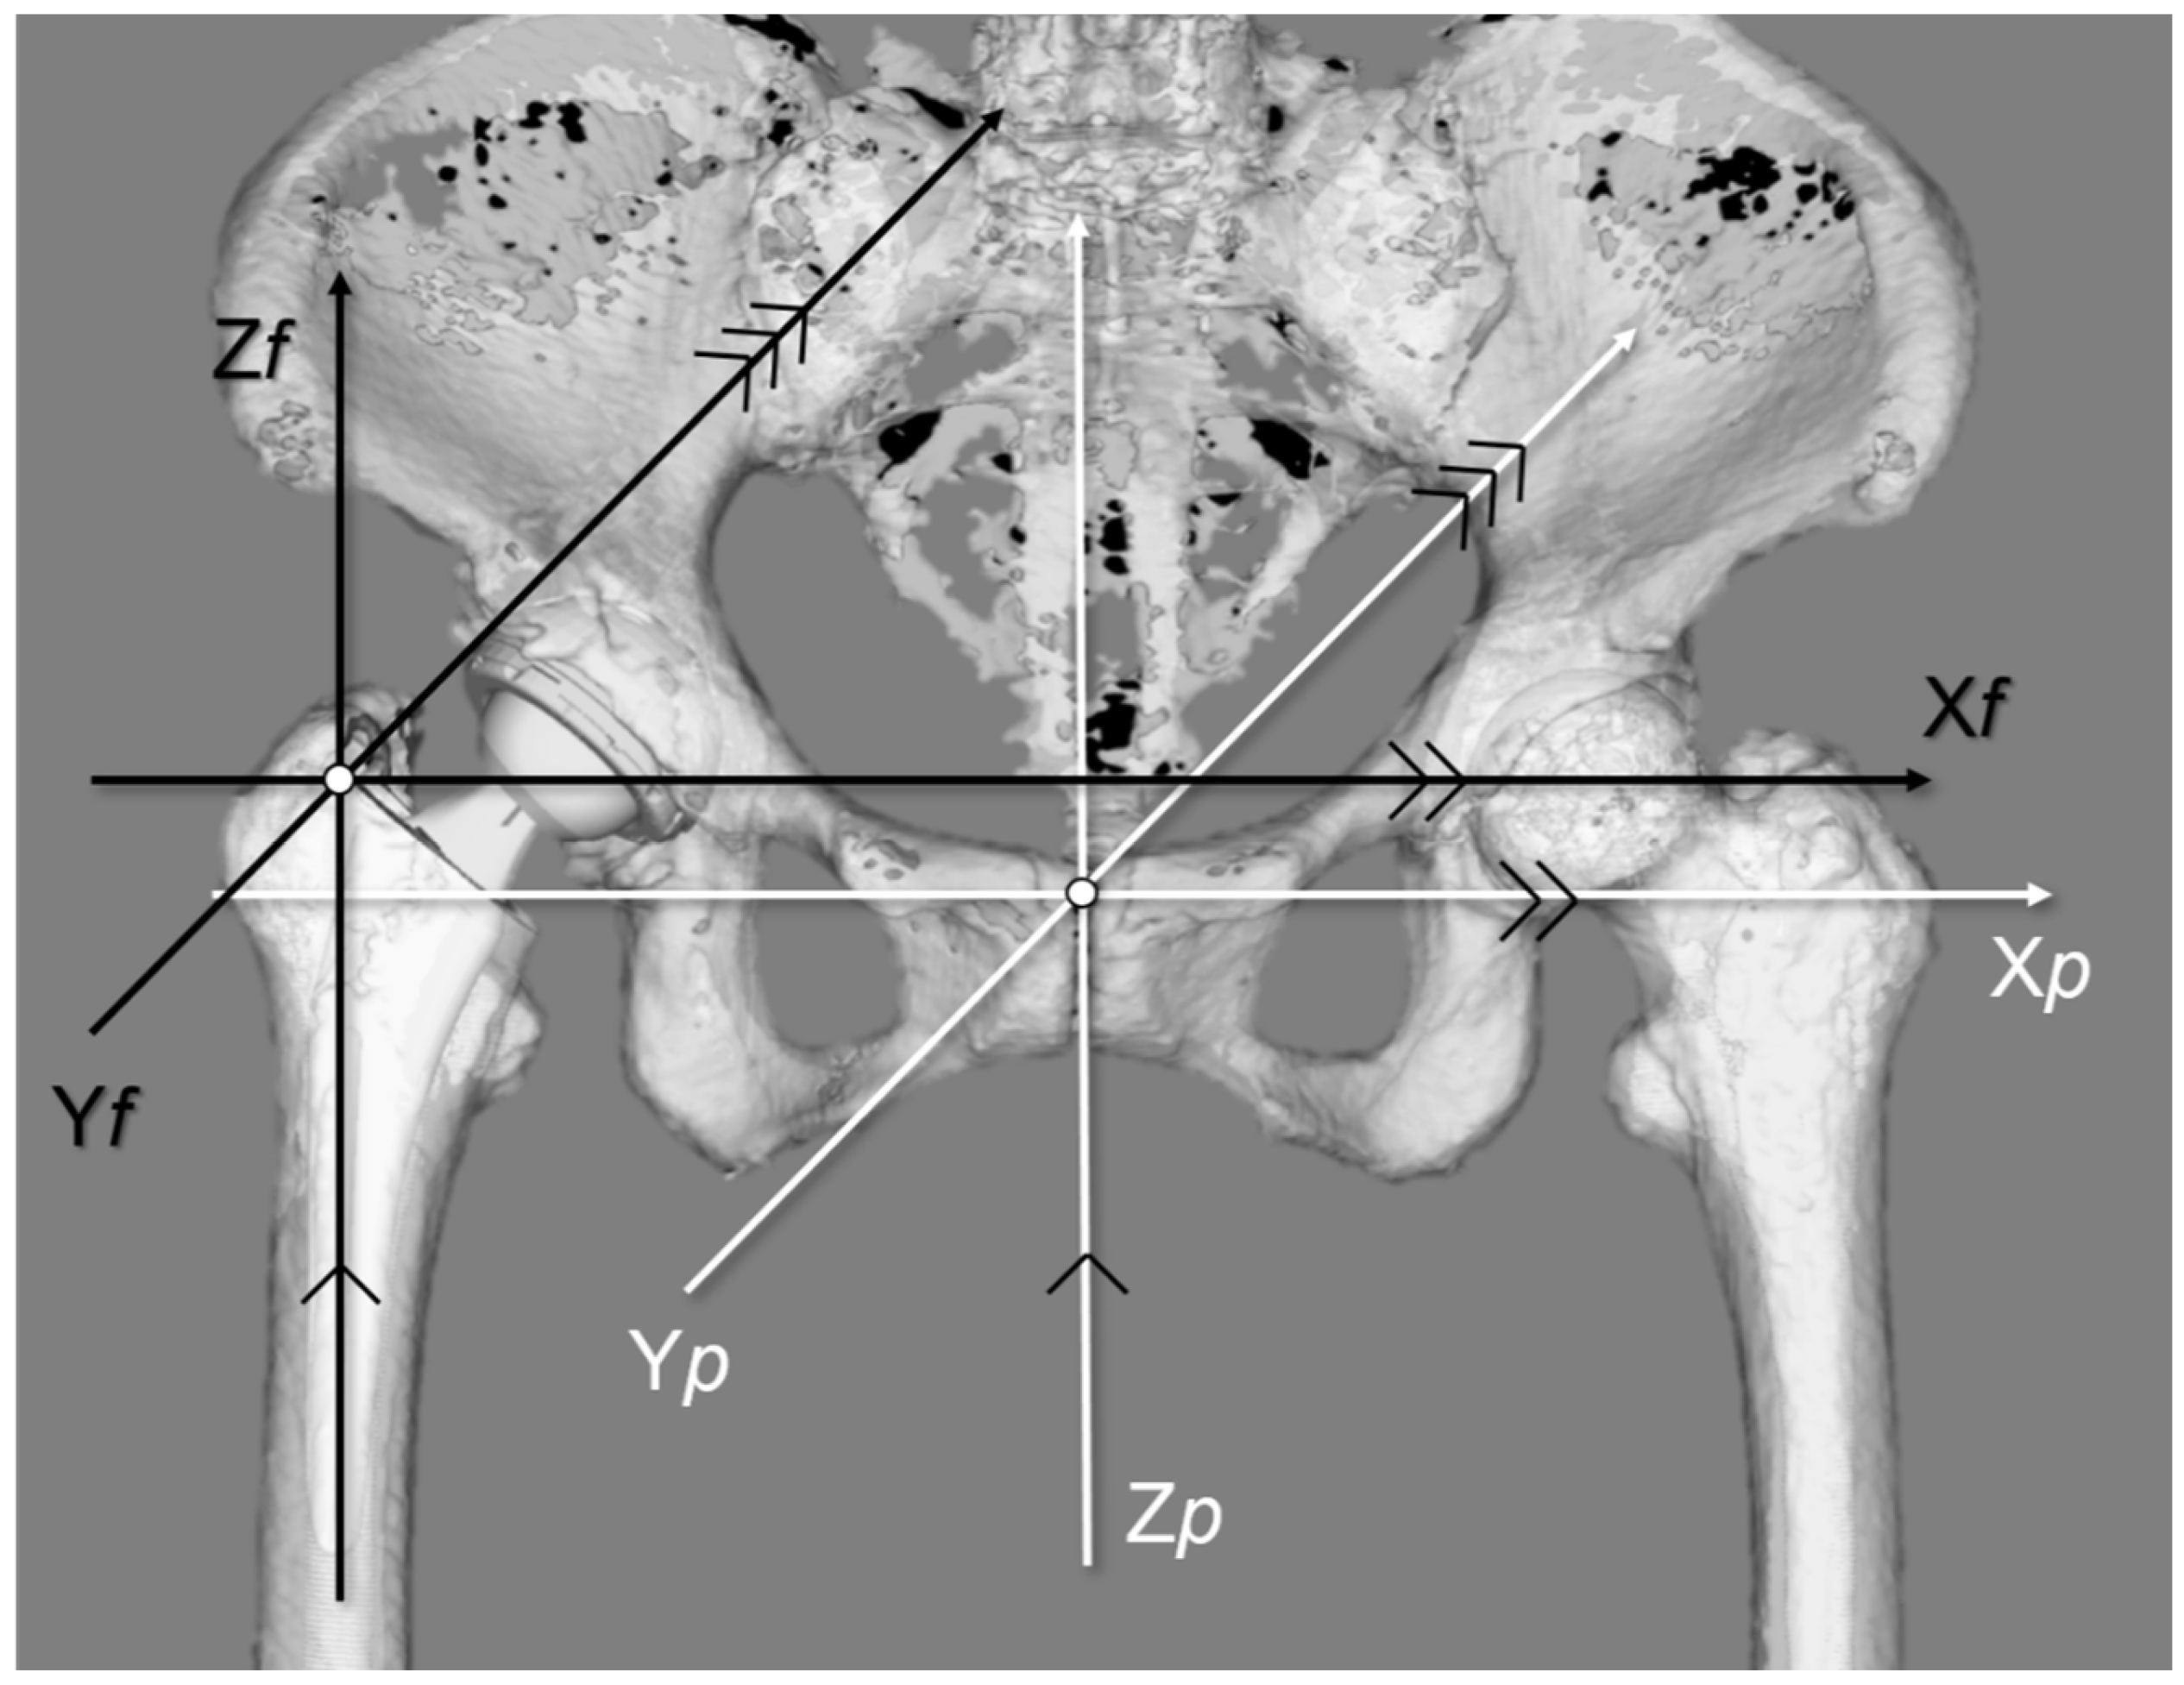
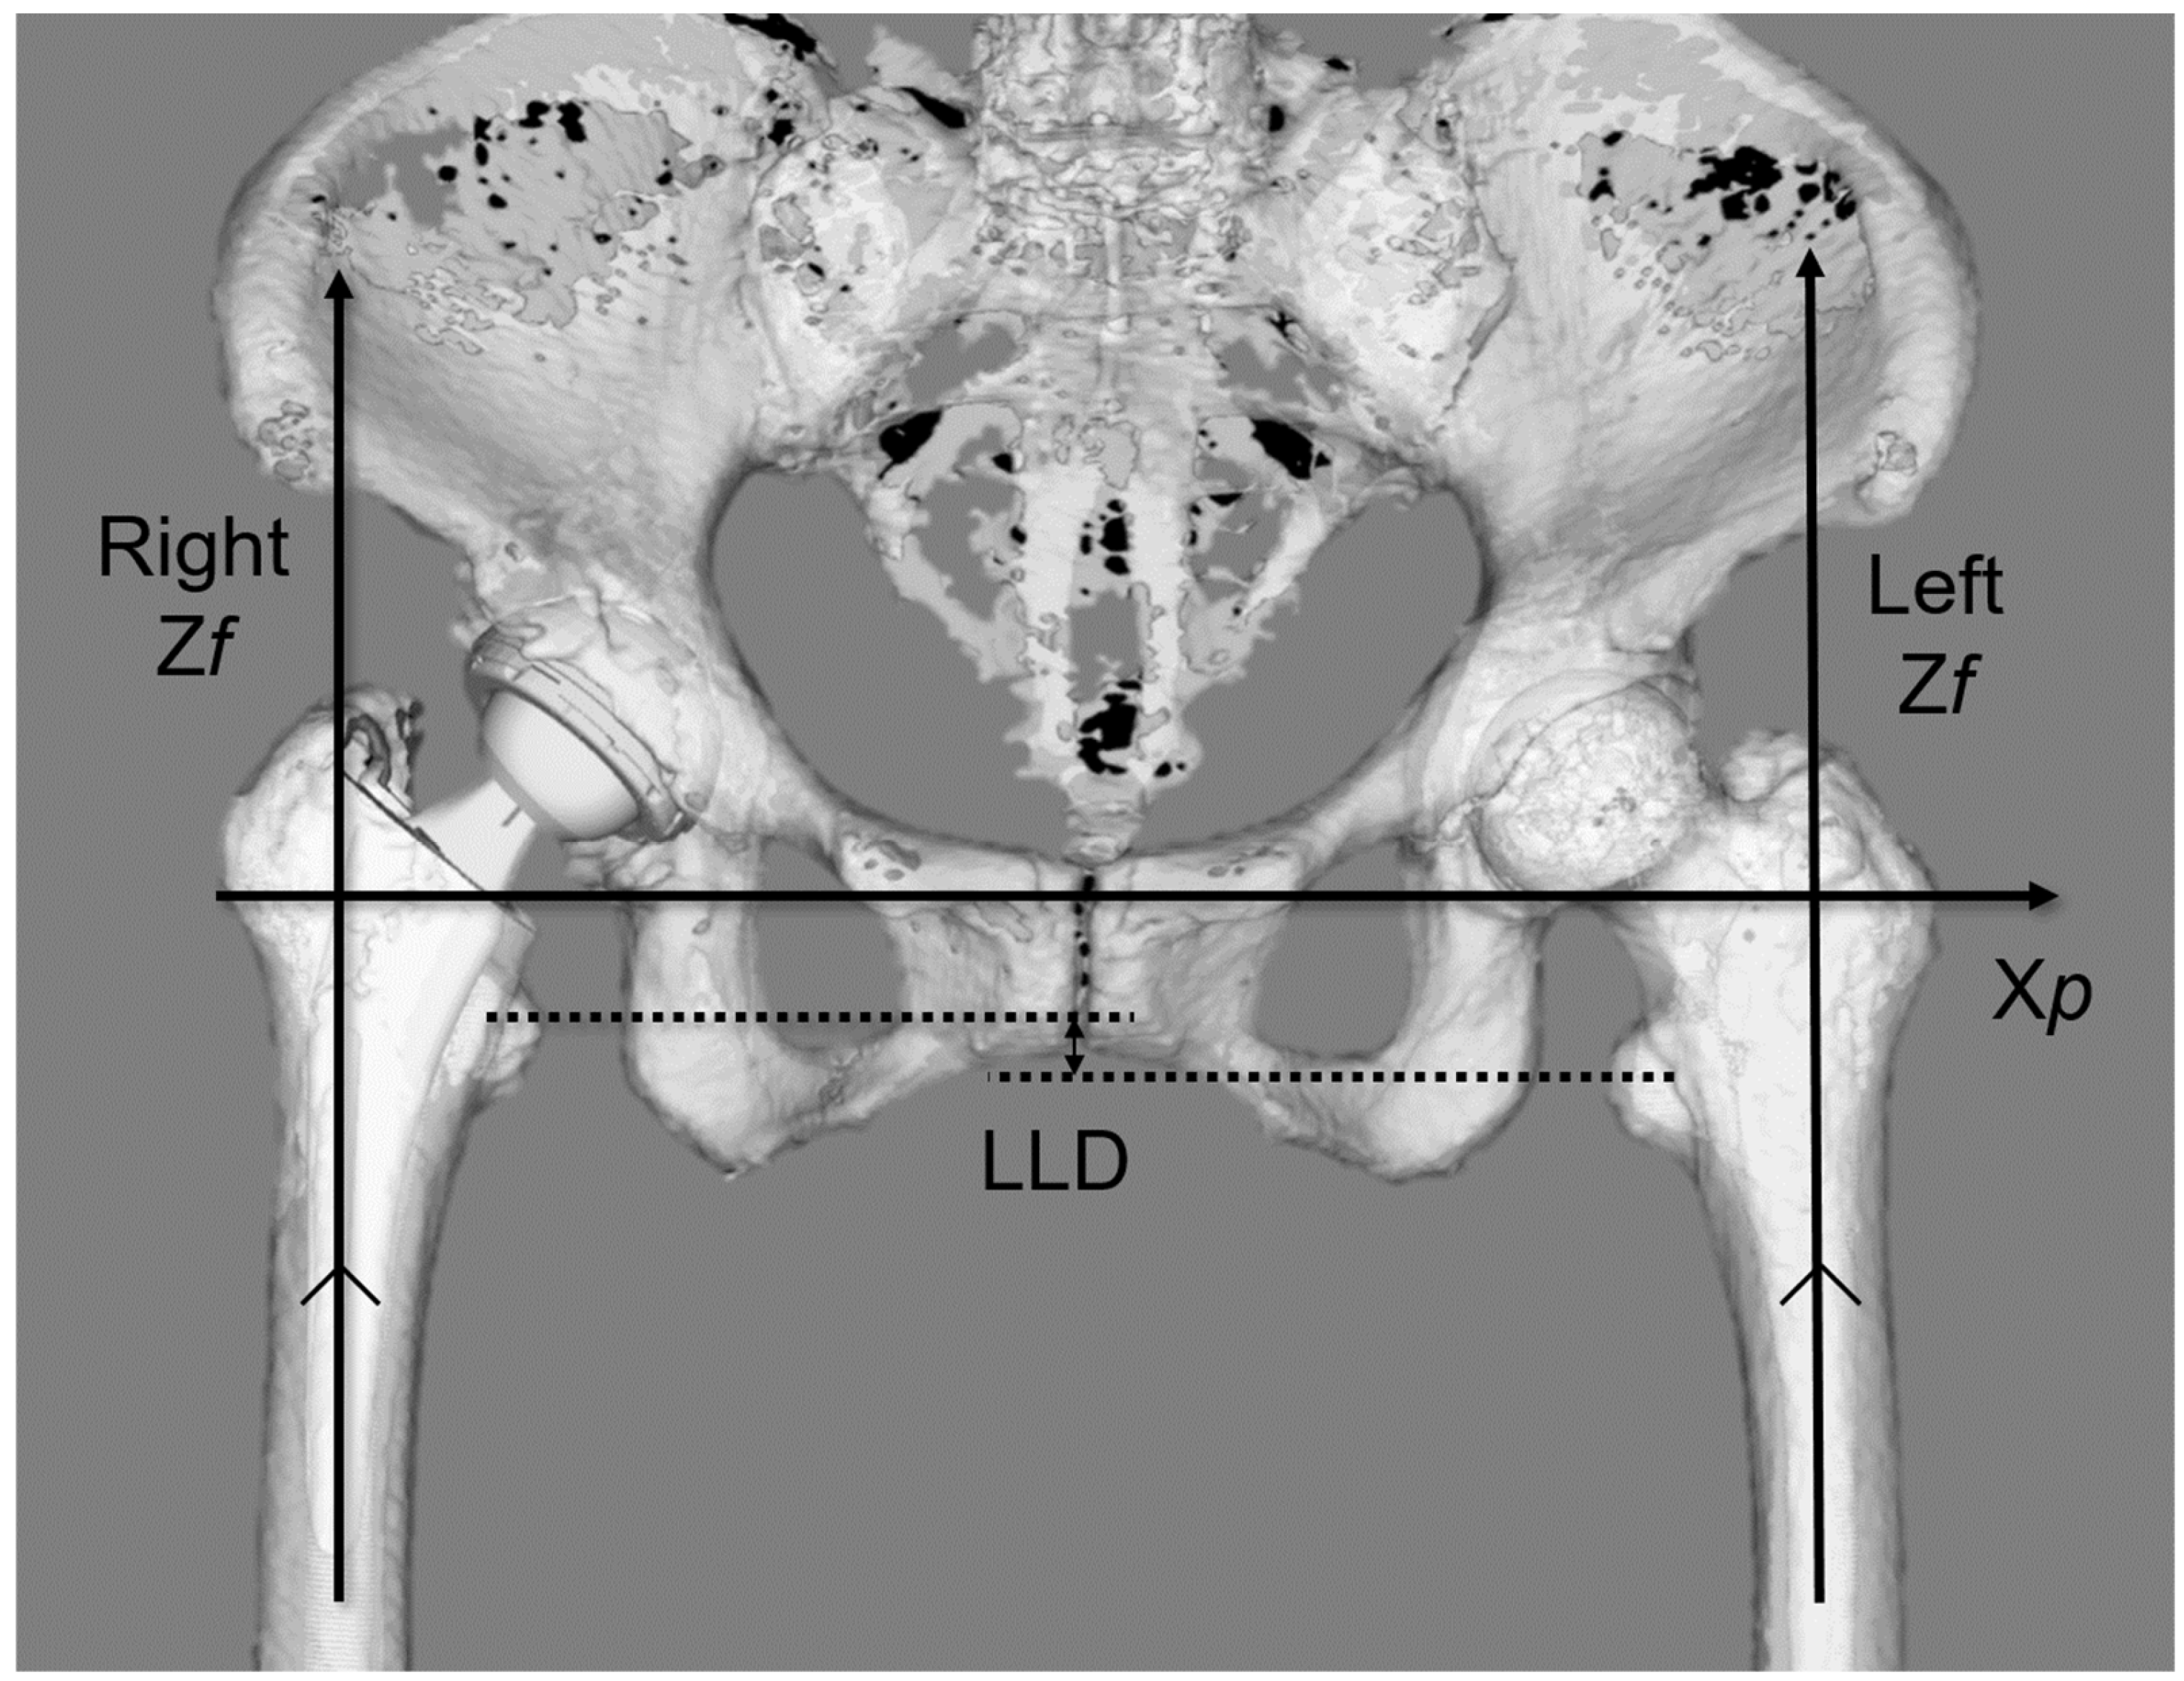
2.2. Measurement
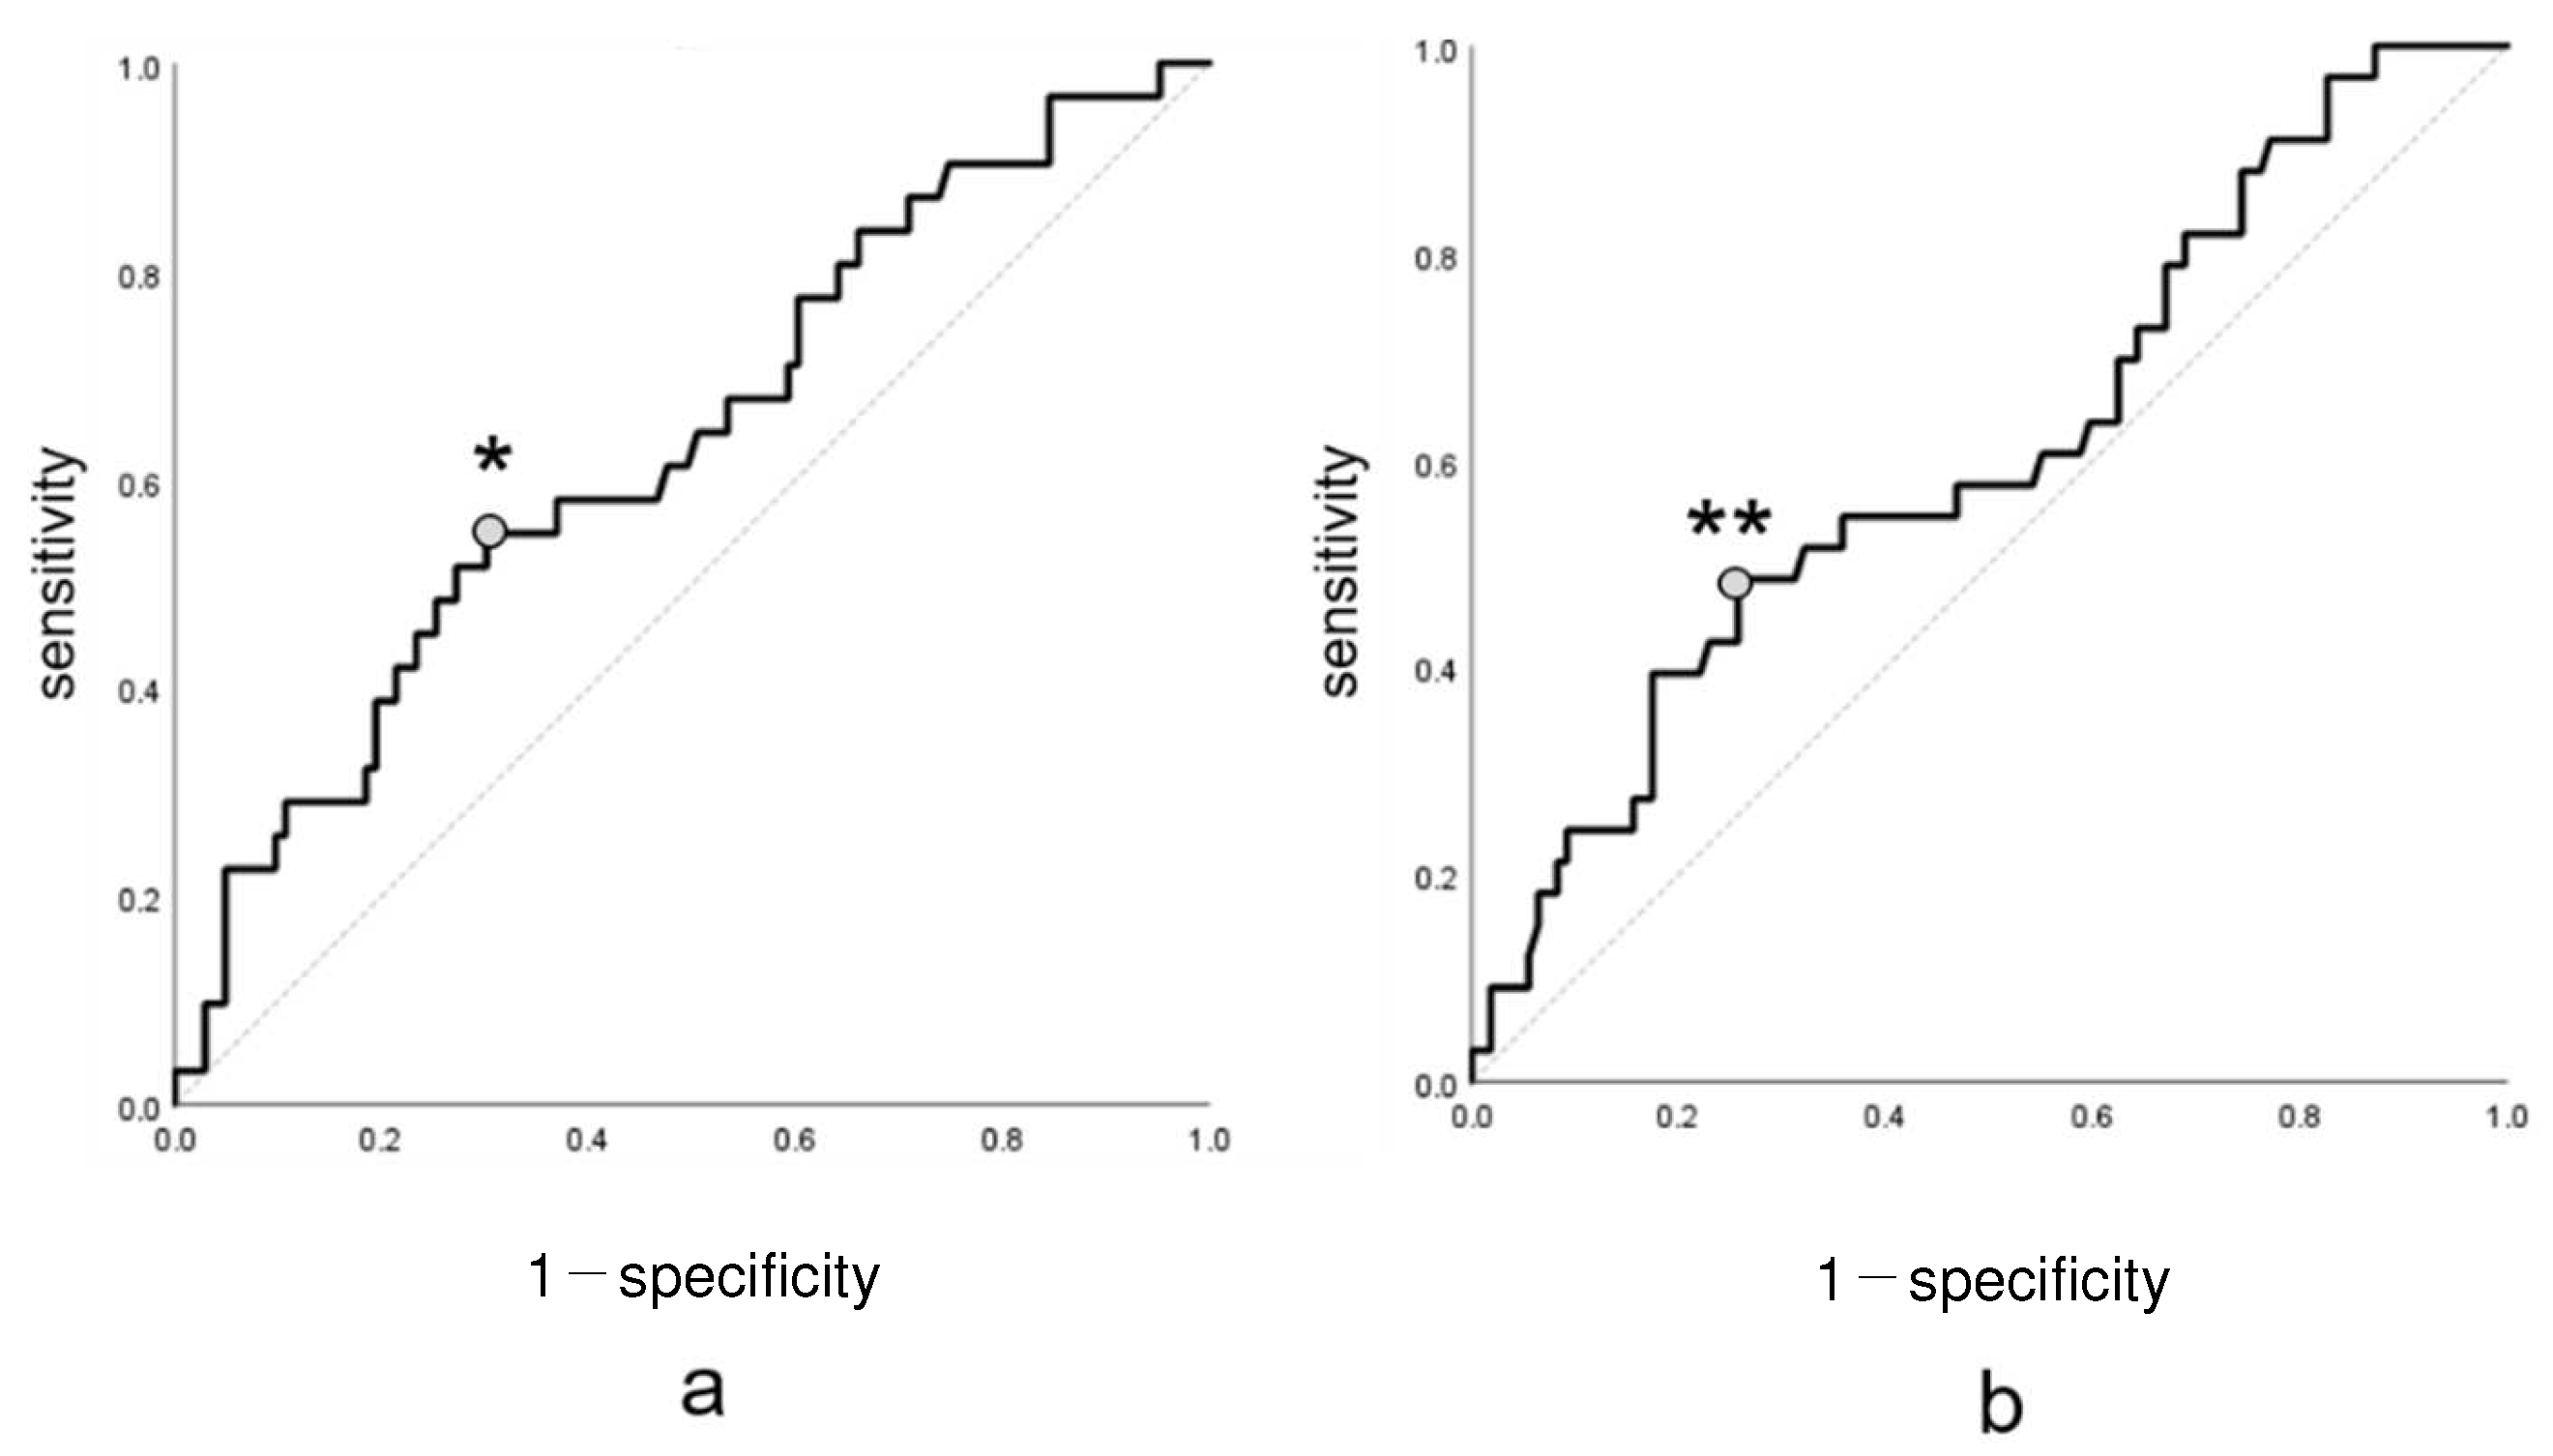
2.3. Statistical Analysis
3. Results
4. Discussion
5. Conclusions
Author Contributions
Funding
Institutional Review Board Statement
Informed Consent Statement
Data Availability Statement
Conflicts of Interest
References
- Mahmood, S.S.; Mukka, S.S.; Crnalic, S.; Wretenberg, P.; Sayed-Noor, A.S. Association between changes in global femoral offset after total hip arthroplasty and function, quality of life, and abductor muscle strength. A prospective cohort study of 222 patients. Acta Orthop. 2016, 87, 36–41. [Google Scholar] [CrossRef] [PubMed]
- Cassidy, K.A.; Noticewala, M.S.; Macaulay, W.; Lee, J.H.; Geller, J.A. Effect of femoral offset on pain and function after total hip arthroplasty. J. Arthroplast. 2012, 27, 1863–1869. [Google Scholar] [CrossRef] [PubMed]
- Esbjörnsson, A.C.; Kiernan, S.; Mattsson, L.; Flivik, G. Geometrical restoration during total hip arthroplasty is related to change in gait pattern—A study based on computed tomography and three-dimensional gait analysis. BMC Musculoskelet. Disord. 2021, 22, 369. [Google Scholar] [CrossRef] [PubMed]
- Bonnin, M.P.; Archbold, P.H.; Basiglini, L.; Selmi, T.A.; Beverland, D.E. Should the acetabular cup be medialised in total hip arthroplasty. HIP Int. 2011, 21, 428–435. [Google Scholar] [CrossRef]
- Weber, M.; Woerner, M.L.; Springorum, H.R.; Hapfelmeier, A.; Grifka, J.; Renkawitz, T.F. Plain radiographs fail to reflect femoral offset in total hip arthroplasty. J. Arthroplast. 2014, 29, 1661–1665. [Google Scholar] [CrossRef] [PubMed]
- Hirano, Y.; Imai, N.; Nozaki, A.; Horigome, Y.; Suzuki, H.; Kawashima, H. The association of postoperative global femoral offset with total hip arthroplasty outcomes. Sci. Rep. 2023, 13, 1621. [Google Scholar] [CrossRef] [PubMed]
- Li, J.; McWilliams, A.B.; Jin, Z.; Fisher, J.; Stone, M.H.; Redmond, A.C.; Stewart, T.D. Unilateral total hip replacement patients with symptomatic leg length inequality have abnormal hip biomechanics during walking. Clin. Biomech. 2015, 30, 513–519. [Google Scholar] [CrossRef] [PubMed]
- Kawakami, T.; Imagama, T.; Matsuki, Y.; Okazaki, T.; Kaneoka, T.; Sakai, T. Forgotten joint score is worse when the affected leg perceived longer than shorter after total hip arthroplasty. BMC Musculoskelet. Disord. 2023, 24, 440. [Google Scholar] [CrossRef]
- Ranawat, C.S.; Rodriguez, J.A. Functional leg-length inequality following total hip arthroplasty. J. Arthroplast. 1997, 12, 359–364. [Google Scholar] [CrossRef]
- Röder, C.; Vogel, R.; Burri, L.; Dietrich, D.; Staub, L.P. Total hip arthroplasty: Leg length inequality impairs functional outcomes and patient satisfaction. BMC Musculoskelet. Disord. 2012, 13, 95. [Google Scholar] [CrossRef]
- Worlicek, M.; Messmer, B.; Grifka, J.; Renkawitz, T.; Weber, M. Restoration of leg length and offset correlates with trochanteric pain syndrome in total hip arthroplasty. Sci. Rep. 2020, 10, 7107. [Google Scholar] [CrossRef] [PubMed]
- Bertin, K.C.; Röttinger, H. Anterolateral mini-incision hip replacement surgery: A modified Watson-Jones approach. Clin. Orthop. Relat. Res. 2004, 429, 248–255. [Google Scholar] [CrossRef]
- Stolarczyk, A.; Stolarczyk, M.; Stępiński, P.; Dorocińska, M.K.; Świercz, M.; Szymczak, J.; Żarnovsky, K.; Żuchniewicz, A.; Maciąg, B.M. The direct anterior approach to primary total hip replacement: Radiological analysis in comparison to other approaches. J. Clin. Med. 2021, 10, 2246. [Google Scholar] [CrossRef] [PubMed]
- Ohta, Y.; Sugama, R.; Minoda, Y.; Mizokawa, S.; Takahashi, S.; Ikebuchi, M.; Nakatsuchi, T.; Nakamura, H. Is the anterolateral or posterolateral approach more effective for early postoperative recovery after minimally invasive total hip arthroplasty? J. Clin. Med. 2022, 12, 139. [Google Scholar] [CrossRef]
- Ukai, T.; Ebihara, G.; Watanabe, M. Comparison of short-term outcomes of anterolateral supine approach and posterolateral approach for primary total hip arthroplasty: A retrospective study. J. Orthop. Traumatol. 2021, 22, 6. [Google Scholar] [CrossRef] [PubMed]
- Cho, E.; Hisatome, T.; Oda, S.; Fujimaki, H.; Nakanishi, K. Accuracy of acetabular cup placement during anterolateral supine total hip arthroplasty using intraoperative fluoroscopy: A retrospective study. J. Orthop. Surg. Res. 2022, 17, 523. [Google Scholar] [CrossRef]
- Murray, D.W. The definition and measurement of acetabular orientation. J. Bone Jt. Surg. Br. 1993, 75, 228–232. [Google Scholar] [CrossRef] [PubMed]
- Suda, K.; Ito, T.; Miyasaka, D.; Imai, N.; Minato, I.; Endo, N. Cup implantation accuracy using the HipCOMPASS mechanical intraoperative support device. SpringerPlus 2016, 5, 784. [Google Scholar] [CrossRef]
- Imai, N.; Takubo, R.; Suzuki, H.; Shimada, H.; Miyasaka, D.; Tsuchiya, K.; Endo, N. Accuracy of acetabular cup placement using CT-based navigation in total hip arthroplasty: Comparison between obese and non-obese patients. J. Orthop. Sci. 2019, 24, 482–487. [Google Scholar] [CrossRef]
- Matsubayashi, S.; Isobe, Y.; Chiba, K.; Tsujimoto, R.; Osaki, M.; Imamura, T.; Tsurumoto, T. Measurement of femoral axial offset. J. Orthop. Res. 2021, 39, 1383–1389. [Google Scholar] [CrossRef]
- Dorr, L.D.; Malik, A.; Dastane, M.; Wan, Z. Combined anteversion technique for total hip arthroplasty. Clin. Orthop. Relat. Res. 2009, 467, 119–127. [Google Scholar] [CrossRef] [PubMed]
- Widmer, K.H.; Zurfluh, B. Compliant positioning of total hip components for optimal range of motion. J. Orthop. Res. 2004, 22, 815–821. [Google Scholar] [CrossRef] [PubMed]
- Nozaki, A.; Imai, N.; Funayama, K.; Horigome, Y.; Suzuki, H.; Minato, I.; Kobayashi, K.; Kawashima, H. Accuracy of ZedView, the software for three-dimensional measurement and preoperative planning: A basic study. Medicina 2023, 59, 1030. [Google Scholar] [CrossRef] [PubMed]
- Imai, N.; Suzuki, H.; Nozaki, A.; Miyasaka, D.; Tsuchiya, K.; Ito, T.; Minato, I.; Endo, N. Evaluation of anatomical pelvic parameters between normal, healthy men and women using three-dimensional computed tomography: A cross-sectional study of sex-specific and age-specific differences. J. Orthop. Surg. Res. 2019, 14, 126. [Google Scholar] [CrossRef] [PubMed]
- Lecerf, G.; Fessy, M.H.; Philippot, R.; Massin, P.; Giraud, F.; Flecher, X.; Girard, J.; Mertl, P.; Marchetti, E.; Stindel, E. Femoral offset: Anatomical concept, definition, assessment, implications for preoperative templating and hip arthroplasty. Orthop. Traumatol. Surg. Res. 2009, 95, 210–219. [Google Scholar] [CrossRef] [PubMed]
- Harris, W.H. Traumatic arthritis of the hip after dislocation and acetabular fractures: Treatment by mold arthroplasty. An end-result study using a new method of result evaluation. J. Bone Jt. Surg. Am. 1969, 51, 737–755. [Google Scholar] [CrossRef]
- Söderman, P.; Malchau, H. Is the Harris hip score system useful to study the outcome of total hip replacement? Clin. Orthop. Relat. Res. 2001, 384, 189–197. [Google Scholar] [CrossRef]
- Sariali, E.; Klouche, S.; Mouttet, A.; Pascal-Moussellard, H. The effect of femoral offset modification on gait after total hip arthroplasty. Acta Orthop. 2014, 85, 123–127. [Google Scholar] [CrossRef]
- Nakashima, Y.; Hirata, M.; Akiyama, M.; Itokawa, T.; Yamamoto, T.; Motomura, G.; Ohishi, M.; Hamai, S.; Iwamoto, Y. Combined anteversion technique reduced the dislocation in cementless total hip arthroplasty. Int. Orthop. 2014, 38, 27–32. [Google Scholar] [CrossRef]
- Amuwa, C.; Dorr, L.D. The combined anteversion technique for acetabular component anteversion. J. Arthroplast. 2008, 23, 1068–1070. [Google Scholar] [CrossRef]
- Tone, S.; Hasegawa, M.; Naito, Y.; Wakabayashi, H.; Sudo, A. Comparison between two- and three-dimensional methods for offset measurements after total hip arthroplasty. Sci. Rep. 2022, 12, 12644. [Google Scholar] [CrossRef] [PubMed]
- Speers, C.J.; Bhogal, G.S. Greater trochanteric pain syndrome: A review of diagnosis and management in general practice. Br. J. Gen. Pract. 2017, 67, 479–480. [Google Scholar] [CrossRef] [PubMed]
- Williams, B.S.; Cohen, S.P. Greater trochanteric pain syndrome: A review of anatomy, diagnosis and treatment. Anesth. Analg. 2009, 108, 1662–1670. [Google Scholar] [CrossRef] [PubMed]
- Sun, C.; Lee, W.G.; Ma, Q.; Zhang, X.; Zhao, Z.; Cai, X. Does intraoperative fluoroscopy improve acetabular component positioning and limb-length discrepancy during direct anterior total hip arthroplasty? A meta-analysis. J. Orthop. Surg. Res. 2023, 18, 586. [Google Scholar] [CrossRef] [PubMed]
- Manzo, M.A.; Lex, J.R.; Rodriguez-Elizalde, S.R.; Perlus, R.; Cayen, B.; Chang, J.S. Fluoroscopy versus imageless optical navigation in direct anterior approach total hip arthroplasty. J. Am. Acad. Orthop. Surg. 2023, 32, e284–e292. [Google Scholar] [CrossRef]


| Sex (male/female) | 41/131 |
| Age (years) * | 61.3 ± 10.4 (30–80) |
| Surgical side (right/left) | 93/79 |
| Primary disease | DDH: 129 Idiopathic osteonecrosis of the femoral head: 32 Rapidly distractive arthropathy: 6 Primary HOA: 5 |
| Surgical Side | Non-Surgical Side | Difference between the Surgical and Non-Surgical Sides | |
|---|---|---|---|
| AO (mm) * | 18.7 ± 2.4 (11.7–25.7) † | 20.0 ± 1.8 (14.2–24.8) † | −1.3 ± 2.6 (−7.3 to 5.6) |
| FO (mm) * | 22.0 ± 3.9 (11.5–32.3) † | 21.0 ± 3.6 (10.6–29.1) † | 1.0 ± 3.6 (−8.5 to 10.4) |
| GFO (mm) * | 40.7 ± 4.8 (27.8–52.4) | 41.0 ± 4.3 (25.0–50.6) | 0.3 ± 4.2 (−11.4 to 10.2) |
| AFO (mm) * | 23.0 ± 4.7 (10.5–36.7) | 22.10 ± 4.3 (9.0–36.2) | 0.9 ± 5.4 (−14.3 to 13.7) |
| LLD (mm) * | −0.5 ± 3.4 (−9.0 to 10.1) | ||
| SGL (mm) * | −0.3 ± 5.5 (−16.3 to 15.7) |
| Formula | Correlation Coefficient | |
|---|---|---|
| * | y = −0.0726x2 + 0.1442x + 90.673 | r = 0.221 |
| ** | y = −0.0298x2 + 0.0110x + 90.096 | r = 0.207 |
| Intra-Observer Reliability | Inter-Observer Reliability | |||
|---|---|---|---|---|
| Mean Absolute Error | ICC | Mean Absolute Error | ICC | |
| AO (mm) | 1.7 ± 1.2 (0.1–3.9) † | 0.915, <0.001 (0.879–0.940) * | 2.0 ± 1.2 (0.1–4.2) † | 0.881, <0.001 (0.829–0.916) * |
| FO (mm) | 2.1 ± 1.2 (0.2–3.9) † | 0.872, <0.001 (0.815–0.918) * | 2.6 ± 1.3 (0.2–4.9) † | 0.848, <0.001 (0.792–0.897 * |
| GFO (mm) | 2.5 ± 156 (0.0–5.1) † | 0.844, <0.001 (0.638–0.932) * | 2.9 ± 1.8 (0.0–6.4) † | 0.828, <0.001 (0.624–0.923) * |
| AFO (mm) | 1.5 ± 1.1 (0.1–3.4) † | 0.932, <0.001 (0.902–0.952) * | 1.8 ± 1.2 (0.1–4.0) † | 0.889, <0.001 (0.843–0.921) * |
| LLD (mm) | 2.0 ± 1.5 (0.0–5.6) † | 0.884, <0.001 (0.852–0.916) * | 2.7 ± 1.6 (0.0–6.7) † | 0.857, <0.001 (0.810–0.899) * |
Disclaimer/Publisher’s Note: The statements, opinions and data contained in all publications are solely those of the individual author(s) and contributor(s) and not of MDPI and/or the editor(s). MDPI and/or the editor(s) disclaim responsibility for any injury to people or property resulting from any ideas, methods, instructions or products referred to in the content. |
© 2024 by the authors. Licensee MDPI, Basel, Switzerland. This article is an open access article distributed under the terms and conditions of the Creative Commons Attribution (CC BY) license (https://creativecommons.org/licenses/by/4.0/).
Share and Cite
Imai, N.; Hirano, Y.; Endo, Y.; Horigome, Y.; Suzuki, H.; Kawashima, H. The Sum of the Leg Length Discrepancy and the Difference in Global Femoral Offset Is Equal to That of the Contralateral Intact Side and Improves Postoperative Outcomes after Total Hip Arthroplasty: A Three-Dimensional Analysis. J. Clin. Med. 2024, 13, 1698. https://doi.org/10.3390/jcm13061698
Imai N, Hirano Y, Endo Y, Horigome Y, Suzuki H, Kawashima H. The Sum of the Leg Length Discrepancy and the Difference in Global Femoral Offset Is Equal to That of the Contralateral Intact Side and Improves Postoperative Outcomes after Total Hip Arthroplasty: A Three-Dimensional Analysis. Journal of Clinical Medicine. 2024; 13(6):1698. https://doi.org/10.3390/jcm13061698
Chicago/Turabian StyleImai, Norio, Yuki Hirano, Yuki Endo, Yoji Horigome, Hayato Suzuki, and Hiroyuki Kawashima. 2024. "The Sum of the Leg Length Discrepancy and the Difference in Global Femoral Offset Is Equal to That of the Contralateral Intact Side and Improves Postoperative Outcomes after Total Hip Arthroplasty: A Three-Dimensional Analysis" Journal of Clinical Medicine 13, no. 6: 1698. https://doi.org/10.3390/jcm13061698
APA StyleImai, N., Hirano, Y., Endo, Y., Horigome, Y., Suzuki, H., & Kawashima, H. (2024). The Sum of the Leg Length Discrepancy and the Difference in Global Femoral Offset Is Equal to That of the Contralateral Intact Side and Improves Postoperative Outcomes after Total Hip Arthroplasty: A Three-Dimensional Analysis. Journal of Clinical Medicine, 13(6), 1698. https://doi.org/10.3390/jcm13061698