
Vitamin D—A New Therapeutic Target in the Management of Type 2 Diabetes Patients


Abstract
1. Introduction
2. Materials and Methods
2.1. Study Design and Patients
2.2. Patients Medical Assessments
2.3. Statistical Analysis
3. Results
4. Discussion
5. Conclusions
Author Contributions
Funding
Institutional Review Board Statement
Informed Consent Statement
Data Availability Statement
Acknowledgments
Conflicts of Interest
References
- International Diabetes Federation. IDF Diabetes Atlas, 10th ed.; International Diabetes Federation: Brussels, Belgium, 2021; Available online: https://www.diabetesatlas.org (accessed on 6 December 2023).
- Olson, J.M.A.M.; Goyal, A. Vitamin A Toxicity; StatPearls Publishing: Treasure Island, FL, USA, 2024. Available online: https://www.ncbi.nlm.nih.gov/books/NBK532916/ (accessed on 2 September 2023).
- Roseland, J.M.; Phillips, K.M.; Patterson, K.Y.; Pehrsson, P.R.; Taylor, C.L. Chapter 60—Vitamin D in Foods: An Evolution of Knowledge. In Vitamin D, 4th ed.; Feldman, D., Ed.; Academic Press: Cambridge, MA, USA, 2018; pp. 41–77. [Google Scholar]
- Calogiuri, G. Hypersensitivity to Vitamins; Bentham Science Publishers: Sharjah, United Arab Emirates, 2021. [Google Scholar]
- Nair, R.; Maseeh, A. Vitamin D: The “sunshine” vitamin. J. Pharmacol. Pharmacother. 2012, 3, 118–126. [Google Scholar]
- Norman, A.W. From vitamin D to hormone D: Fundamentals of the vitamin D endocrine system essential for good health. Am. J. Clin. Nutr. 2008, 88, 491S–499S. [Google Scholar] [CrossRef] [PubMed]
- Hossein-nezhad, A.; Spira, A.; Holick, M.F. Influence of vitamin D status and vitamin D3 supplementation on genome wide expression of white blood cells: A randomized double-blind clinical trial. PLoS ONE 2013, 8, e58725. [Google Scholar] [CrossRef] [PubMed]
- Meyer, M.B.; Goetsch, P.D.; Pike, J.W. Genome-wide analysis of the VDR/RXR cistrome in osteoblast cells provides new mechanistic insight into the actions of the vitamin D hormone. J. Steroid Biochem. Mol. Biol. 2010, 121, 136–141. [Google Scholar] [CrossRef]
- Danik, J.S.; Manson, J.E. Vitamin D and Cardiovascular Disease. Curr. Treat. Options Cardiovasc. Med. 2012, 14, 414–424. [Google Scholar] [CrossRef] [PubMed]
- Gardner, D.G.; Chen, S.; Glenn, D.J. Vitamin D and the heart. Am. J. Physiol. Regul. Integr. Comp. Physiol. 2013, 305, R969–R977. [Google Scholar] [CrossRef] [PubMed]
- Sizar, O.; Khare, S.; Goyal, A.; Givler, A. Vitamin D Deficiency. In StatPearls; StatPearls Publishing: Treasure Island, FL, USA, 2023. [Google Scholar]
- Tk, M.; Kanyal Butola, L.; Mujawar, A. Effect of glycemic control on vitamin b12 status in type 2 diabetes mellitus. Indian J. Basic Appl. Med. Res. 2019, 9, 7–17. [Google Scholar]
- Butler, A.E.; Dargham, S.R.; Latif, A.; Mokhtar, H.R.; Robay, A.; Chidiac, O.M.; Jayyousi, A.; Al Suwaidi, J.; Crystal, R.G.; Khalil, C.A.; et al. Association of vitamin D(3) and its metabolites in patients with and without type 2 diabetes and their relationship to diabetes complications. Ther. Adv. Chronic. Dis. 2020, 11, 2040622320924159. [Google Scholar] [CrossRef] [PubMed]
- Walsh, J.S.; Bowles, S.; Evans, A.L. Vitamin D in obesity. Curr. Opin. Endocrinol. Diabetes Obes. 2017, 24, 389–394. [Google Scholar] [CrossRef]
- Carrelli, A.; Bucovsky, M.; Horst, R.; Cremers, S.; Zhang, C.; Bessler, M.; Schrope, B.; Evanko, J.; Blanco, J.; Silverberg, S.J.; et al. Vitamin D Storage in Adipose Tissue of Obese and Normal Weight Women. J. Bone Miner. Res. 2017, 32, 237–242. [Google Scholar] [CrossRef]
- Wamberg, L.; Christiansen, T.; Paulsen, S.K.; Fisker, S.; Rask, P.; Rejnmark, L.; Richelsen, B.; Pedersen, S.B. Expression of vitamin D-metabolizing enzymes in human adipose tissue—The effect of obesity and diet-induced weight loss. Int. J. Obes. 2013, 37, 651–657. [Google Scholar] [CrossRef]
- Esmaeili, S.A.; Mohammadian, S.; Radbakhsh, S.; Momtazi-Borojeni, A.A.; Kheirmand Parizi, P.; Atabati, H.; Mardani, F.; Saburi, E.; Moghaddam, A.S. Evaluation of vitamin D(3) deficiency: A population-based study in northeastern Iran. J. Cell. Biochem. 2019, 120, 10337–10341. [Google Scholar] [CrossRef] [PubMed]
- Holick, M.F.; Binkley, N.C.; Bischoff-Ferrari, H.A.; Gordon, C.M.; Hanley, D.A.; Heaney, R.P.; Murad, M.H.; Weaver, C.M. Evaluation, treatment, and prevention of vitamin D deficiency: An Endocrine Society clinical practice guideline. J. Clin. Endocrinol. Metab. 2011, 96, 1911–1930. [Google Scholar] [CrossRef]
- Spiro, A.; Buttriss, J.L. Vitamin D: An overview of vitamin D status and intake in Europe. Nutr. Bull. 2014, 39, 322–350. [Google Scholar] [CrossRef] [PubMed]
- Holick, M.F. Vitamin D deficiency. N. Engl. J. Med. 2007, 357, 266–281. [Google Scholar] [CrossRef]
- McPherson, R.A.; Pincus, M.R.; Henry, J.B. Biochemical markers of bone metabolism. In Henry’s Clinical Diagnosis and Management by Laboratory Methods, 21st ed.; Saunders Elsevier: Wynnewood, PA, USA, 2007; Volume xxi, pp. 175–176. [Google Scholar]
- Ginde, A.A.; Liu, M.C.; Camargo, C.A., Jr. Demographic differences and trends of vitamin D insufficiency in the US population, 1988–2004. Arch. Intern. Med. 2009, 169, 626–632. [Google Scholar] [CrossRef] [PubMed]
- Mitchell, D.M.; Henao, M.P.; Finkelstein, J.S.; Burnett-Bowie, S.A. Prevalence and predictors of vitamin D deficiency in healthy adults. Endocr Pract. 2012, 18, 914–923. [Google Scholar] [CrossRef]
- Mogire, R.M.; Mutua, A.; Kimita, W.; Kamau, A.; Bejon, P.; Pettifor, J.M.; Adeyemo, A.; Williams, T.N.; Atkinson, S.H. Prevalence of vitamin D deficiency in Africa: A systematic review and meta-analysis. Lancet Glob. Health 2020, 8, e134–e142. [Google Scholar] [CrossRef]
- Al Zarooni, A.A.R.; Al Marzouqi, F.I.; Al Darmaki, S.H.; Prinsloo, E.A.M.; Nagelkerke, N. Prevalence of vitamin D deficiency and associated comorbidities among Abu Dhabi Emirates population. BMC Res. Notes 2019, 12, 503. [Google Scholar] [CrossRef]
- Gannagé-Yared, M.H.; Maalouf, G.; Khalife, S.; Challita, S.; Yaghi, Y.; Ziade, N.; Chalfoun, A.; Norquist, J.; Chandler, J. Prevalence and predictors of vitamin D inadequacy amongst Lebanese osteoporotic women. Br. J. Nutr. 2009, 101, 487–491. [Google Scholar] [CrossRef]
- Parva, N.R.; Tadepalli, S.; Singh, P.; Qian, A.; Joshi, R.; Kandala, H.; Nookala, V.K.; Cheriyath, P. Prevalence of Vitamin D Deficiency and Associated Risk Factors in the US Population (2011–2012). Cureus 2018, 10, e2741. [Google Scholar] [CrossRef]
- Shafinaz, I.S.; Moy, F.M. Vitamin D level and its association with adiposity among multi-ethnic adults in Kuala Lumpur, Malaysia: A cross sectional study. BMC Public Health 2016, 16, 232. [Google Scholar] [CrossRef]
- Wakayo, T.; Belachew, T.; Vatanparast, H.; Whiting, S.J. Vitamin D deficiency and its predictors in a country with thirteen months of sunshine: The case of school children in central Ethiopia. PLoS ONE 2015, 10, e0120963. [Google Scholar] [CrossRef]
- Pan, T.; Banerjee, R.; Dasgupta, A.; Paul, B. Vitamin D status among women aged 40 years and above in a rural area of West Bengal: A community-based study. J. Fam. Med. Prim. Care 2018, 7, 1263–1267. [Google Scholar]
- Pereira-Santos, M.; Costa, P.R.; Assis, A.M.; Santos, C.A.; Santos, D.B. Obesity and vitamin D deficiency: A systematic review and meta-analysis. Obes. Rev. 2015, 16, 341–349. [Google Scholar] [CrossRef] [PubMed]
- De Oliveira, L.F.; de Azevedo, L.G.; da Mota Santana, J.; de Sales, L.P.C.; Pereira-Santos, M. Obesity and overweight decreases the effect of vitamin D supplementation in adults: Systematic review and meta-analysis of randomized controlled trials. Rev. Endocr. Metab. Disord. 2020, 21, 67–76. [Google Scholar] [CrossRef] [PubMed]
- Vitezova, A.; Muka, T.; Zillikens, M.C.; Voortman, T.; Uitterlinden, A.G.; Hofman, A.; Rivadeneira, F.; Kiefte-de Jong, J.C.; Franco, O.H. Vitamin D and body composition in the elderly. Clin. Nutr. 2017, 36, 585–592. [Google Scholar] [CrossRef] [PubMed]
- Suryanarayana, P.; Arlappa, N.; Sai Santhosh, V.; Balakrishna, N.; Lakshmi Rajkumar, P.; Prasad, U.; Raju, B.B.; Shivakeseva, K.; Shoshanni, K.D.; Seshacharyulu, M.; et al. Prevalence of vitamin D deficiency and its associated factors among the urban elderly population in Hyderabad metropolitan city, South India. Ann. Hum. Biol. 2018, 45, 133–139. [Google Scholar] [CrossRef] [PubMed]
- Chirita-Emandi, A.; Socolov, D.; Haivas, C.; Calapiș, A.; Gheorghiu, C.; Puiu, M. Vitamin D Status: A Different Story in the Very Young versus the Very Old Romanian Patients. PLoS ONE 2015, 10, e0128010. [Google Scholar] [CrossRef] [PubMed]
- Timiș, C.J. Plan de Amenajare a Teritoriului Județului Timiș; Consiliul Județean Timiș: Timișoara, Romania, 2013. [Google Scholar]
- Ln, V.R.; Mihuț, C.; Duma-Copcea, A. Formation and Characterisation of Soils Influenced by Groundwater and Improvement Measures. Res. J. Agric. Sci. 2016, 48, 4. [Google Scholar]
- Qu, G.B.; Wang, L.L.; Tang, X.; Wu, W.; Sun, Y.H. The association between vitamin D level and diabetic peripheral neuropathy in patients with type 2 diabetes mellitus: An update systematic review and meta-analysis. J. Clin. Transl. Endocrinol. 2017, 9, 25–31. [Google Scholar] [CrossRef]
- Luo, B.A.; Gao, F.; Qin, L.L. The Association between Vitamin D Deficiency and Diabetic Retinopathy in Type 2 Diabetes: A Meta-Analysis of Observational Studies. Nutrients 2017, 9, 307. [Google Scholar] [CrossRef]
- Lu, Q.; Wan, Z.; Guo, J.; Liu, L.; Pan, A.; Liu, G. Association between serum 25-hydroxyvitamin D concentrations and mortality among adults with prediabetes. J. Clin. Endocrinol. Metab. 2021, 106, e4039–e4048. [Google Scholar] [CrossRef]
- Albai, O.; Frandes, M.; Timar, B.; Paun, D.L.; Roman, D.; Timar, R. Long-term Risk of Malignant Neoplastic Disorders in Type 2 Diabetes Mellitus Patients with Metabolic Syndrome. Diabetes Metab. Syndr. Obes. 2020, 13, 1317–1326. [Google Scholar] [CrossRef]
- Tamez, H.; Kalim, S.; Thadhani, R.I. Does vitamin D modulate blood pressure? Curr. Opin. Nephrol. Hypertens. 2013, 22, 204–209. [Google Scholar] [CrossRef]
- Bikle, D.D. Vitamin D metabolism, mechanism of action, and clinical applications. Chem. Biol. 2014, 21, 319–329. [Google Scholar] [CrossRef]
- Ullah, M.I.; Uwaifo, G.I.; Nicholas, W.C.; Koch, C.A. Does vitamin d deficiency cause hypertension? Current evidence from clinical studies and potential mechanisms. Int. J. Endocrinol. 2010, 2010, 579640. [Google Scholar] [CrossRef]
- Chen, S.; Sun, Y.; Agrawal, D.K. Vitamin D deficiency and essential hypertension. J. Am. Soc. Hypertens. 2015, 9, 885–901. [Google Scholar] [CrossRef]
- Giovannucci, E.; Liu, Y.; Hollis, B.W.; Rimm, E.B. 25-hydroxyvitamin D and risk of myocardial infarction in men: A prospective study. Arch. Intern. Med. 2008, 168, 1174–1180. [Google Scholar] [CrossRef]
- Wang, T.J.; Pencina, M.J.; Booth, S.L.; Jacques, P.F.; Ingelsson, E.; Lanier, K.; Benjamin, E.J.; D’Agostino, R.B.; Wolf, M.; Vasan, R.S. Vitamin D deficiency and risk of cardiovascular disease. Circulation 2008, 117, 503–511. [Google Scholar] [CrossRef]
- Farahmand, M.A.; Daneshzad, E.; Fung, T.T.; Zahidi, F.; Muhammadi, M.; Bellissimo, N.; Azadbakht, L. What is the impact of vitamin D supplementation on glycemic control in people with type-2 diabetes: A systematic review and meta-analysis of randomized controlled trails. BMC Endocr. Disord. 2023, 23, 15. [Google Scholar] [CrossRef]
- Morrissey, R.L.; Bucci, T.J.; Empson, R.N.; Lufkin, E.G. Calcium binding protein: Its cellular localization in jejunum, kidney and pancreas. Proc. Soc. Exp. Biol. Med. 1975, 149, 56–60. [Google Scholar] [CrossRef]
- Ishida, H.; Norman, A.W. Demonstation of high affinity receptor for 1,25-dihydroxyvitamin D3 in rat pancreas. Mol. Cell. Endocrinol. 1988, 60, 109–117. [Google Scholar] [CrossRef]
- Iyengar, S.; Hamman, R.F.; Marschall, J.A.; Majumder, P.P.; Ferrell, R.E. On the role of vitamin D binding globulin in glucose homeostatis: Results from the San Luis Valley Diabetes Study. Genet. Epidemiol. 1989, 6, 691–698. [Google Scholar] [CrossRef]
- Inomata, S.; Kadowaki, S.; Yamatani, T.; Fukase, M.; Fujita, T. Effect of 1 α(OH)-vitamin D3 on insulin secretion in diabetes mellitus. Bone Miner. 1986, 1, 187–192. [Google Scholar]
- Orwoll, E.; Riddle, M.; Prince, M. Effects of vitamin D on insulin and glucagon secretion in non-insulin-dependent diabetes mellitus. Am. J. Clin. Nutr. 1994, 59, 1083–1087. [Google Scholar] [CrossRef]
- Ismail, A.; Namala, R. Impaired glucose tolerance in vitamin D deficiency can be corrected by calcium. J. Nutr. Biochem. 2000, 11, 170–175. [Google Scholar] [CrossRef]
- Assy, M.H.; Draz, N.A.; Fathy, S.E.; Hamed, M.G. Impact of vitamin D level in diabetic people with peripheral neuropathy. Egypt. J. Neurol. Psychiatry Neurosurg. 2021, 57, 117. [Google Scholar] [CrossRef]
- Putz, Z.; Tordai, D.; Hajdú, N.; Vági, O.E.; Kempler, M.; Békeffy, M.; Körei, A.E.; Istenes, I.; Horváth, V.; Stoian, A.P.; et al. Vitamin D in the Prevention and Treatment of Diabetic Neuropathy. Clin. Ther. 2022, 44, 813–823. [Google Scholar] [CrossRef]
- Al Ali, T.; Ashfaq, A.; Saheb Sharif-Askari, N.; Abusnana, S.; Mussa, B.M. Investigating the Association between Diabetic Neuropathy and Vitamin D in Emirati Patients with Type 2 Diabetes Mellitus. Cells 2023, 12, 198. [Google Scholar] [CrossRef]
- Argano, C.; Mirarchi, L.; Amodeo, S.; Orlando, V.; Torres, A.; Corrao, S. The Role of Vitamin D and Its Molecular Bases in Insulin Resistance, Diabetes, Metabolic Syndrome, and Cardiovascular Disease: State of the Art. Int. J. Mol. Sci. 2023, 24, 15485. [Google Scholar] [CrossRef]
- Lin, L.; Zhang, L.; Li, C.; Gai, Z.; Li, Y. Vitamin D and Vitamin D Receptor: New Insights in the Treatment of Hypertension. Curr. Protein Pept. Sci. 2019, 20, 984–995. [Google Scholar] [CrossRef]
- Vaidya, A.; Forman, J.P. Vitamin D and hypertension: Current evidence and future directions. Hypertension 2010, 56, 774–779. [Google Scholar] [CrossRef]
- Fleet, J.C.; DeSmet, M.; Johnson, R.; Li, Y. Vitamin D and cancer: A review of molecular mechanisms. Biochem. J. 2012, 441, 61–76. [Google Scholar] [CrossRef] [PubMed]
- Fernandes de Abreu, D.A.; Eyles, D.; Feron, F. Vitamin D, a neuro-immunomodulator: Implications for neurodegenerative and autoimmune diseases. Psychoneuroendocrinology 2009, 34 (Suppl. S1), S265–S277. [Google Scholar] [CrossRef] [PubMed]
- Schindowski, K.; Belarbi, K.; Buee, L. Neurotrophic factors in Alzheimer’s disease: Role of axonal transport. Genes Brain Behav. 2008, 7 (Suppl. S1), 43–56. [Google Scholar] [CrossRef] [PubMed]
- Taniura, H.; Ito, M.; Sanada, N.; Kuramoto, N.; Ohno, Y.; Nakamichi, N.; Yoneda, Y. Chronic vitamin D3 treatment protects against neurotoxicity by glutamate in association with upregulation of vitamin D receptor mRNA expression in cultured rat cortical neurons. J. Neurosci. Res. 2006, 83, 1179–1189. [Google Scholar] [CrossRef]


| Number | Total | Women | Men | p-Value * |
|---|---|---|---|---|
| % (number) c | 100% (160) | 49.3 (79) | 50.7 (81) | 0.8 |
| Age (years) b | 57 [37; 69] | 55 | 61 | 0.4 |
| T2DM duration (years) b | 9.5 [5; 15] | 9 | 10 | 0.8 |
| Weight (kg) a | 86.1 ± 17.5 | 77.9 ± 15.8 | 94 ± 15.2 | <0.0001 ** |
| BMI (kg/m2) b | 30.2 [24.7; 34] | 28.8 | 31.31 | 0.001 ** |
| HbA1c (%) b | 8.3 [7.2; 8.6] | 7.9 | 8.5 | 0.3 |
| FG (mg/dL) b | 172 [142.5; 201] | 168 | 176 | 0.2 |
| PPG (mg/dL) b | 197 [166; 216] | 194 | 197 | 0.1 |
| Hb (g/dL) b | 14,1 [12.5; 14.8] | 13.5 | 14.40 | <0.0001 ** |
| Iron (µg/dL) b | 65.9 [52.6; 88.1] | 68.2 | 65 | 0.6 |
| TSH (mU/L) b | 2 [1.3; 2.9] | 2 | 2 | 0.9 |
| eGFR (mL/min) b | 83 [54.5; 103] | 72 | 87 | 0.03 ** |
| 25(OH)D b | 17.3 [14.5; 27] | 18.2 | 17 | 0.4 |
| Variable | Optimal 25 (OH)D | 25(OH)D Insufficiency | 25(OH)D Deficiency | p a | |||
|---|---|---|---|---|---|---|---|
| Median | Average Rank | Median | Average Rank | Median | Average Rank | ||
| Age (years) | 40 | 47 | 41 | 53.1 | 65.5 | 97.3 | <0.0001 |
| DM duration (years) | 13 | 97.8 | 9 | 84.2 | 9 | 75.5 | 0.1 |
| Weight (kg) | 70 | 42.7 | 73 | 51.9 | 94.8 | 98.6 | <0.0001 |
| BMI (kg/m2) | 24 | 37.9 | 24.7 | 50.3 | 30.1 | 100.1 | <0.0001 |
| HbA1c (%) | 7 | 32.9 | 7.1 | 37.5 | 9.2 | 105.8 | <0.0001 |
| FG (mg/dL) | 142 | 35.1 | 135 | 37.5 | 192 | 105.4 | <0.0001 |
| PPG (mg/dL) | 160 | 43 | 161 | 42.2 | 210 | 102 | <0.0001 |
| eGFR (mL/min) | 98 | 101 | 94 | 99.3 | 71 | 69.4 | 0.0003 |
| Hb (g/dL) | 14.1 | 94.8 | 14.2 | 95.9 | 13.5 | 71.9 | 0.008 |
| Iron (µg/dL) | 74.1 | 93.7 | 72.6 | 96.7 | 63.3 | 71.8 | 0.007 |
| TSH (mU/L) | 1.6 | 82.4 | 2.3 | 86.6 | 1.9 | 77.8 | 0.6 |
| Parameter | Coefficient | Standard Error | Coefficient of Determination R2 | t | p |
|---|---|---|---|---|---|
| Age (years) | −0.16 | 0.02 | 0.19 | −6.19 | <0.0001 |
| T2DM duration (years) | 0.15 | 0.07 | 0.02 | 2.13 | 0.0339 |
| FG (mg/dL) | −0.10 | 0.00 | 0.53 | −13.52 | <0.0001 |
| PPG (mg/dL) | −0.10 | 0.00 | 0.39 | −10.16 | <0.0001 |
| HbA1c (%) | −3.08 | 0.21 | 0.57 | −14.47 | <0.0001 |
| Weight (kg) | −0.21 | 0.02 | 0.29 | −8.06 | <0.0001 |
| BMI (kg/m2) | −0.74 | 0.08 | 0.34 | −9.13 | <0.0001 |
| Hb (g/dL) | 0.92 | 0.34 | 0.04 | 2.68 | 0.0080 |
| Iron (µg/dL) | 0.05 | 0.02 | 0.05 | 2.99 | 0.0032 |
| eGFR (mL/min) | 0.06 | 0.01 | 0.06 | 3.31 | 0.0011 |
| Independent Variables | Coefficient | Standard Error | t | p | rpartial | rsemipartial |
|---|---|---|---|---|---|---|
| (Constant) | 48.0796 | |||||
| HbA1c | −2.8022 | 0.2234 | −12.5 | <0.0001 | −0.7 | 0.6347 |
| Age | −0.06831 | 0.02069 | −3.3 | 0.001 | −0.2 | 0.1670 |
| Comorbidity | With Disease | Without Disease | |||||
|---|---|---|---|---|---|---|---|
| n | Median | Average Rank | n | Median | Average Rank | p a | |
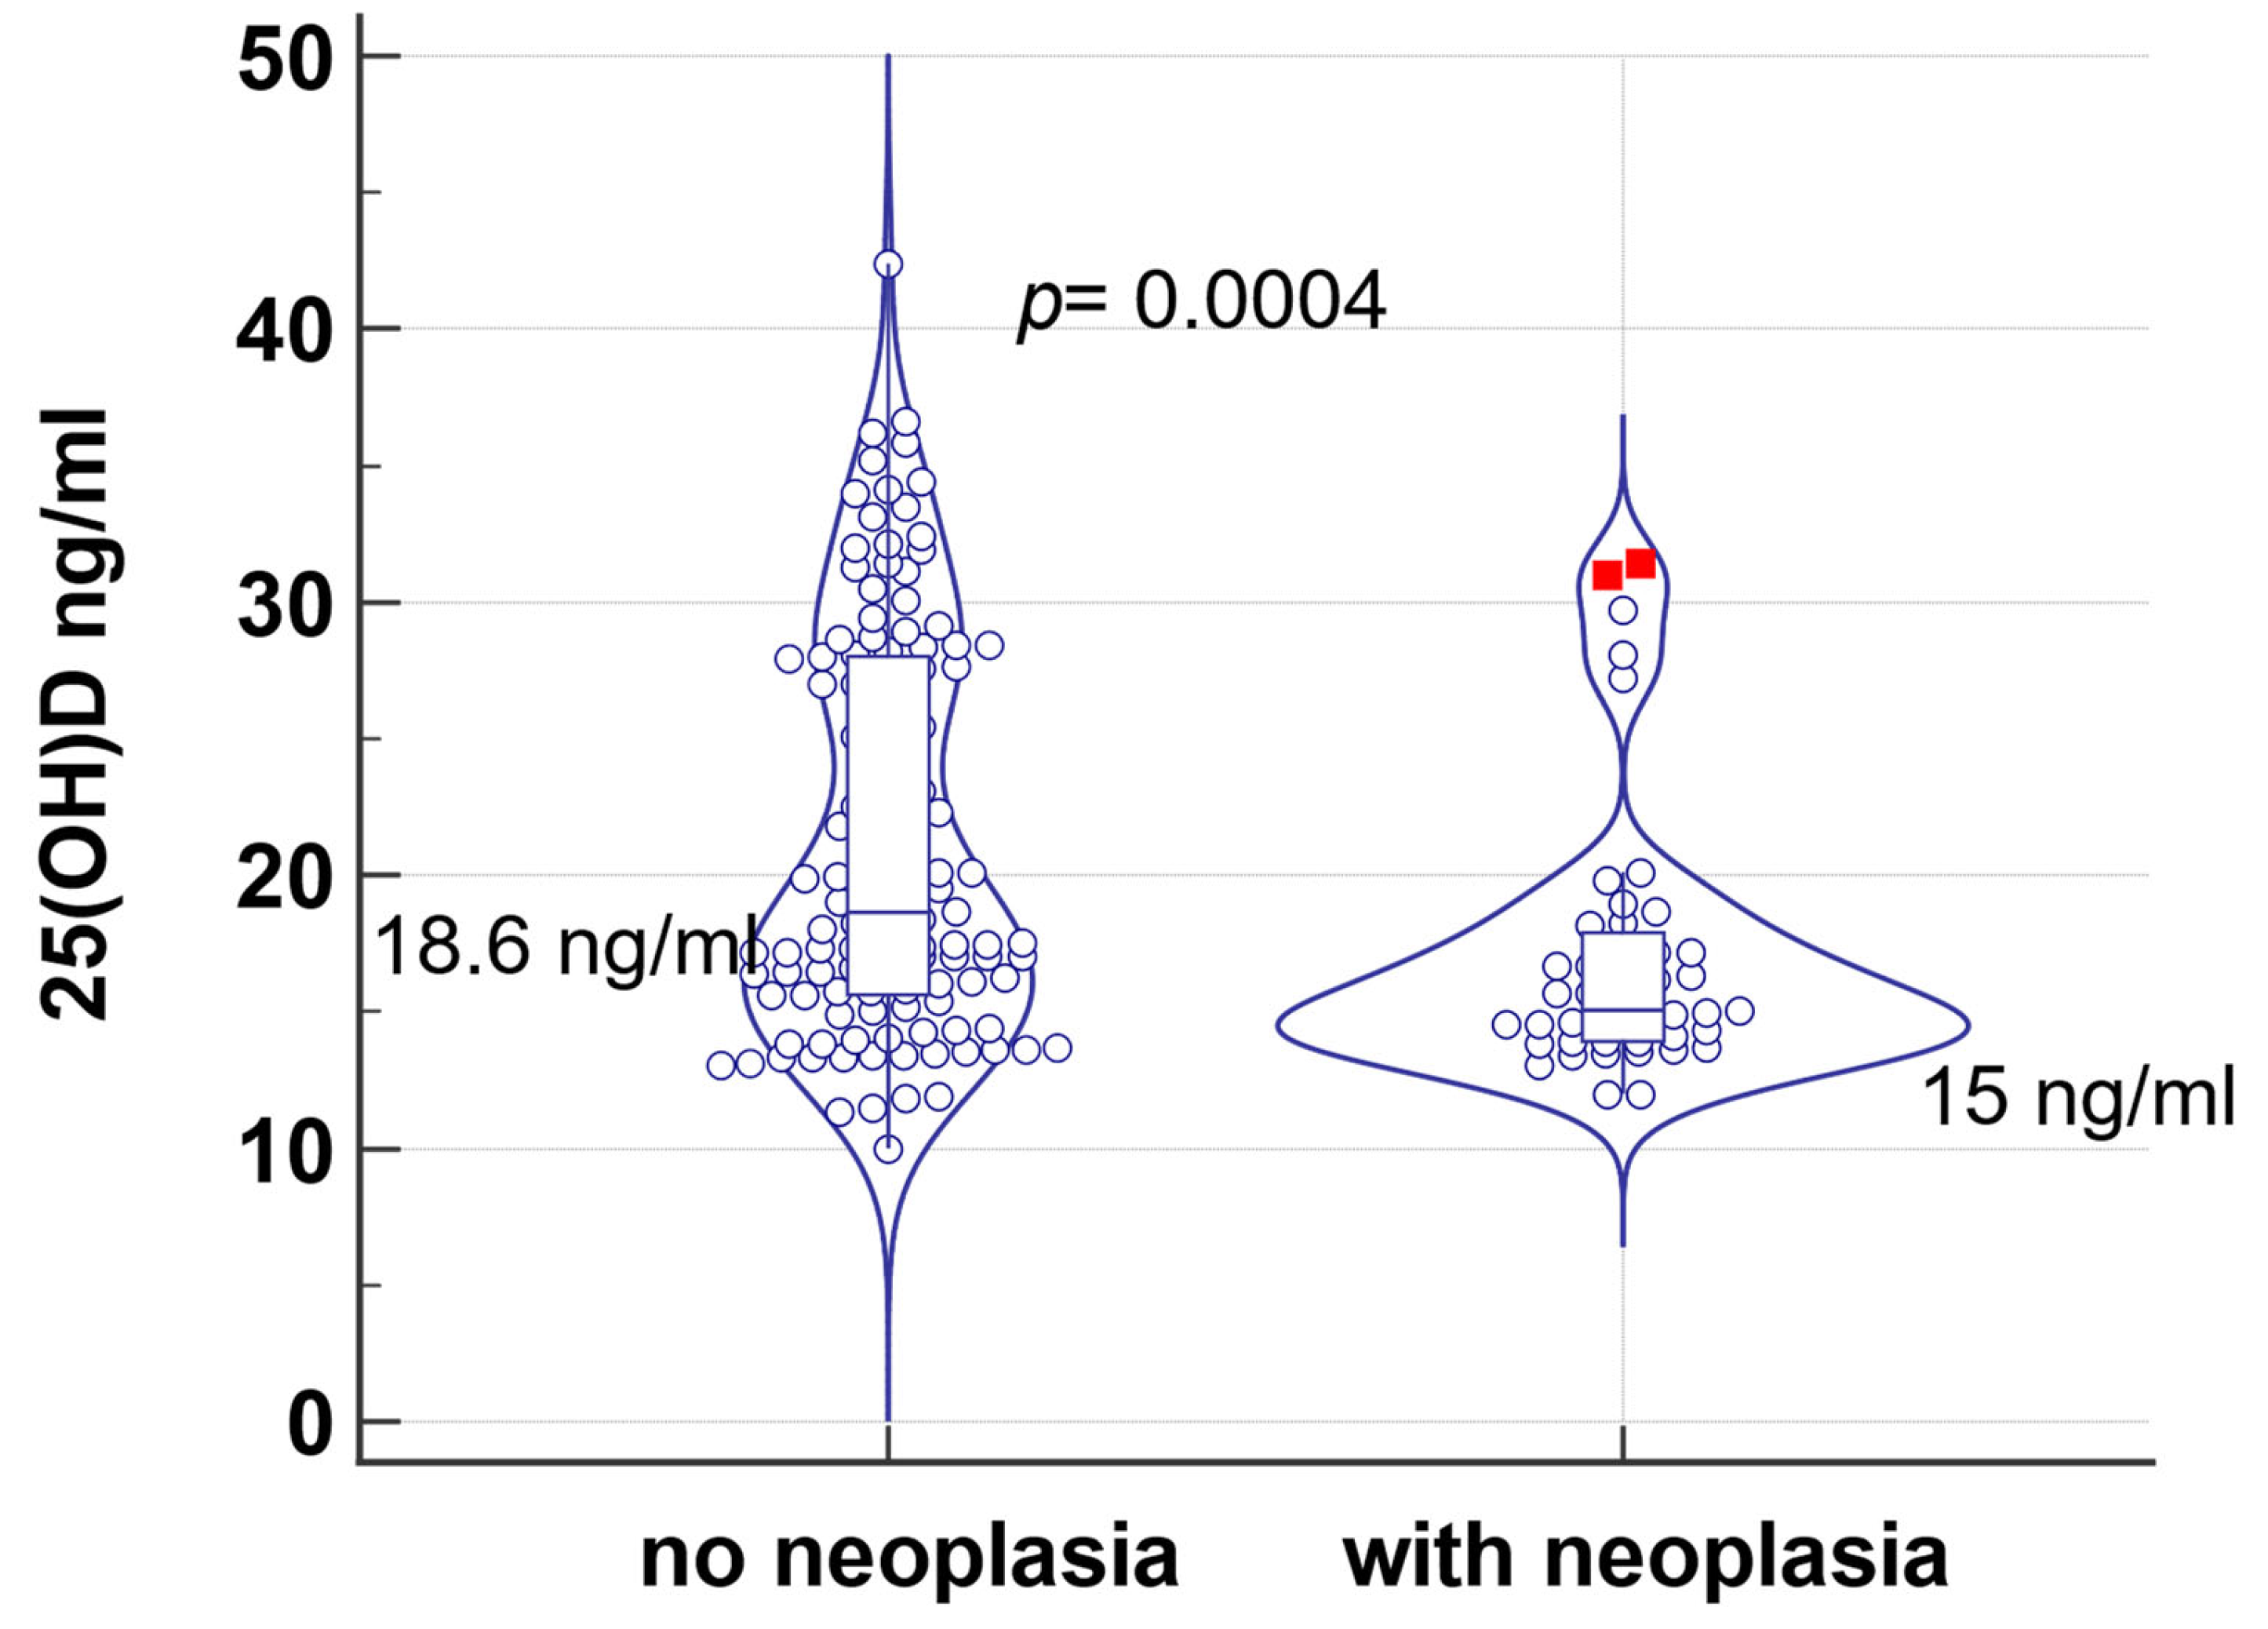
| Neoplasia * | 43 | 15 | 59.2 | 117 | 18.6 | 88.3 | 0.0004 |
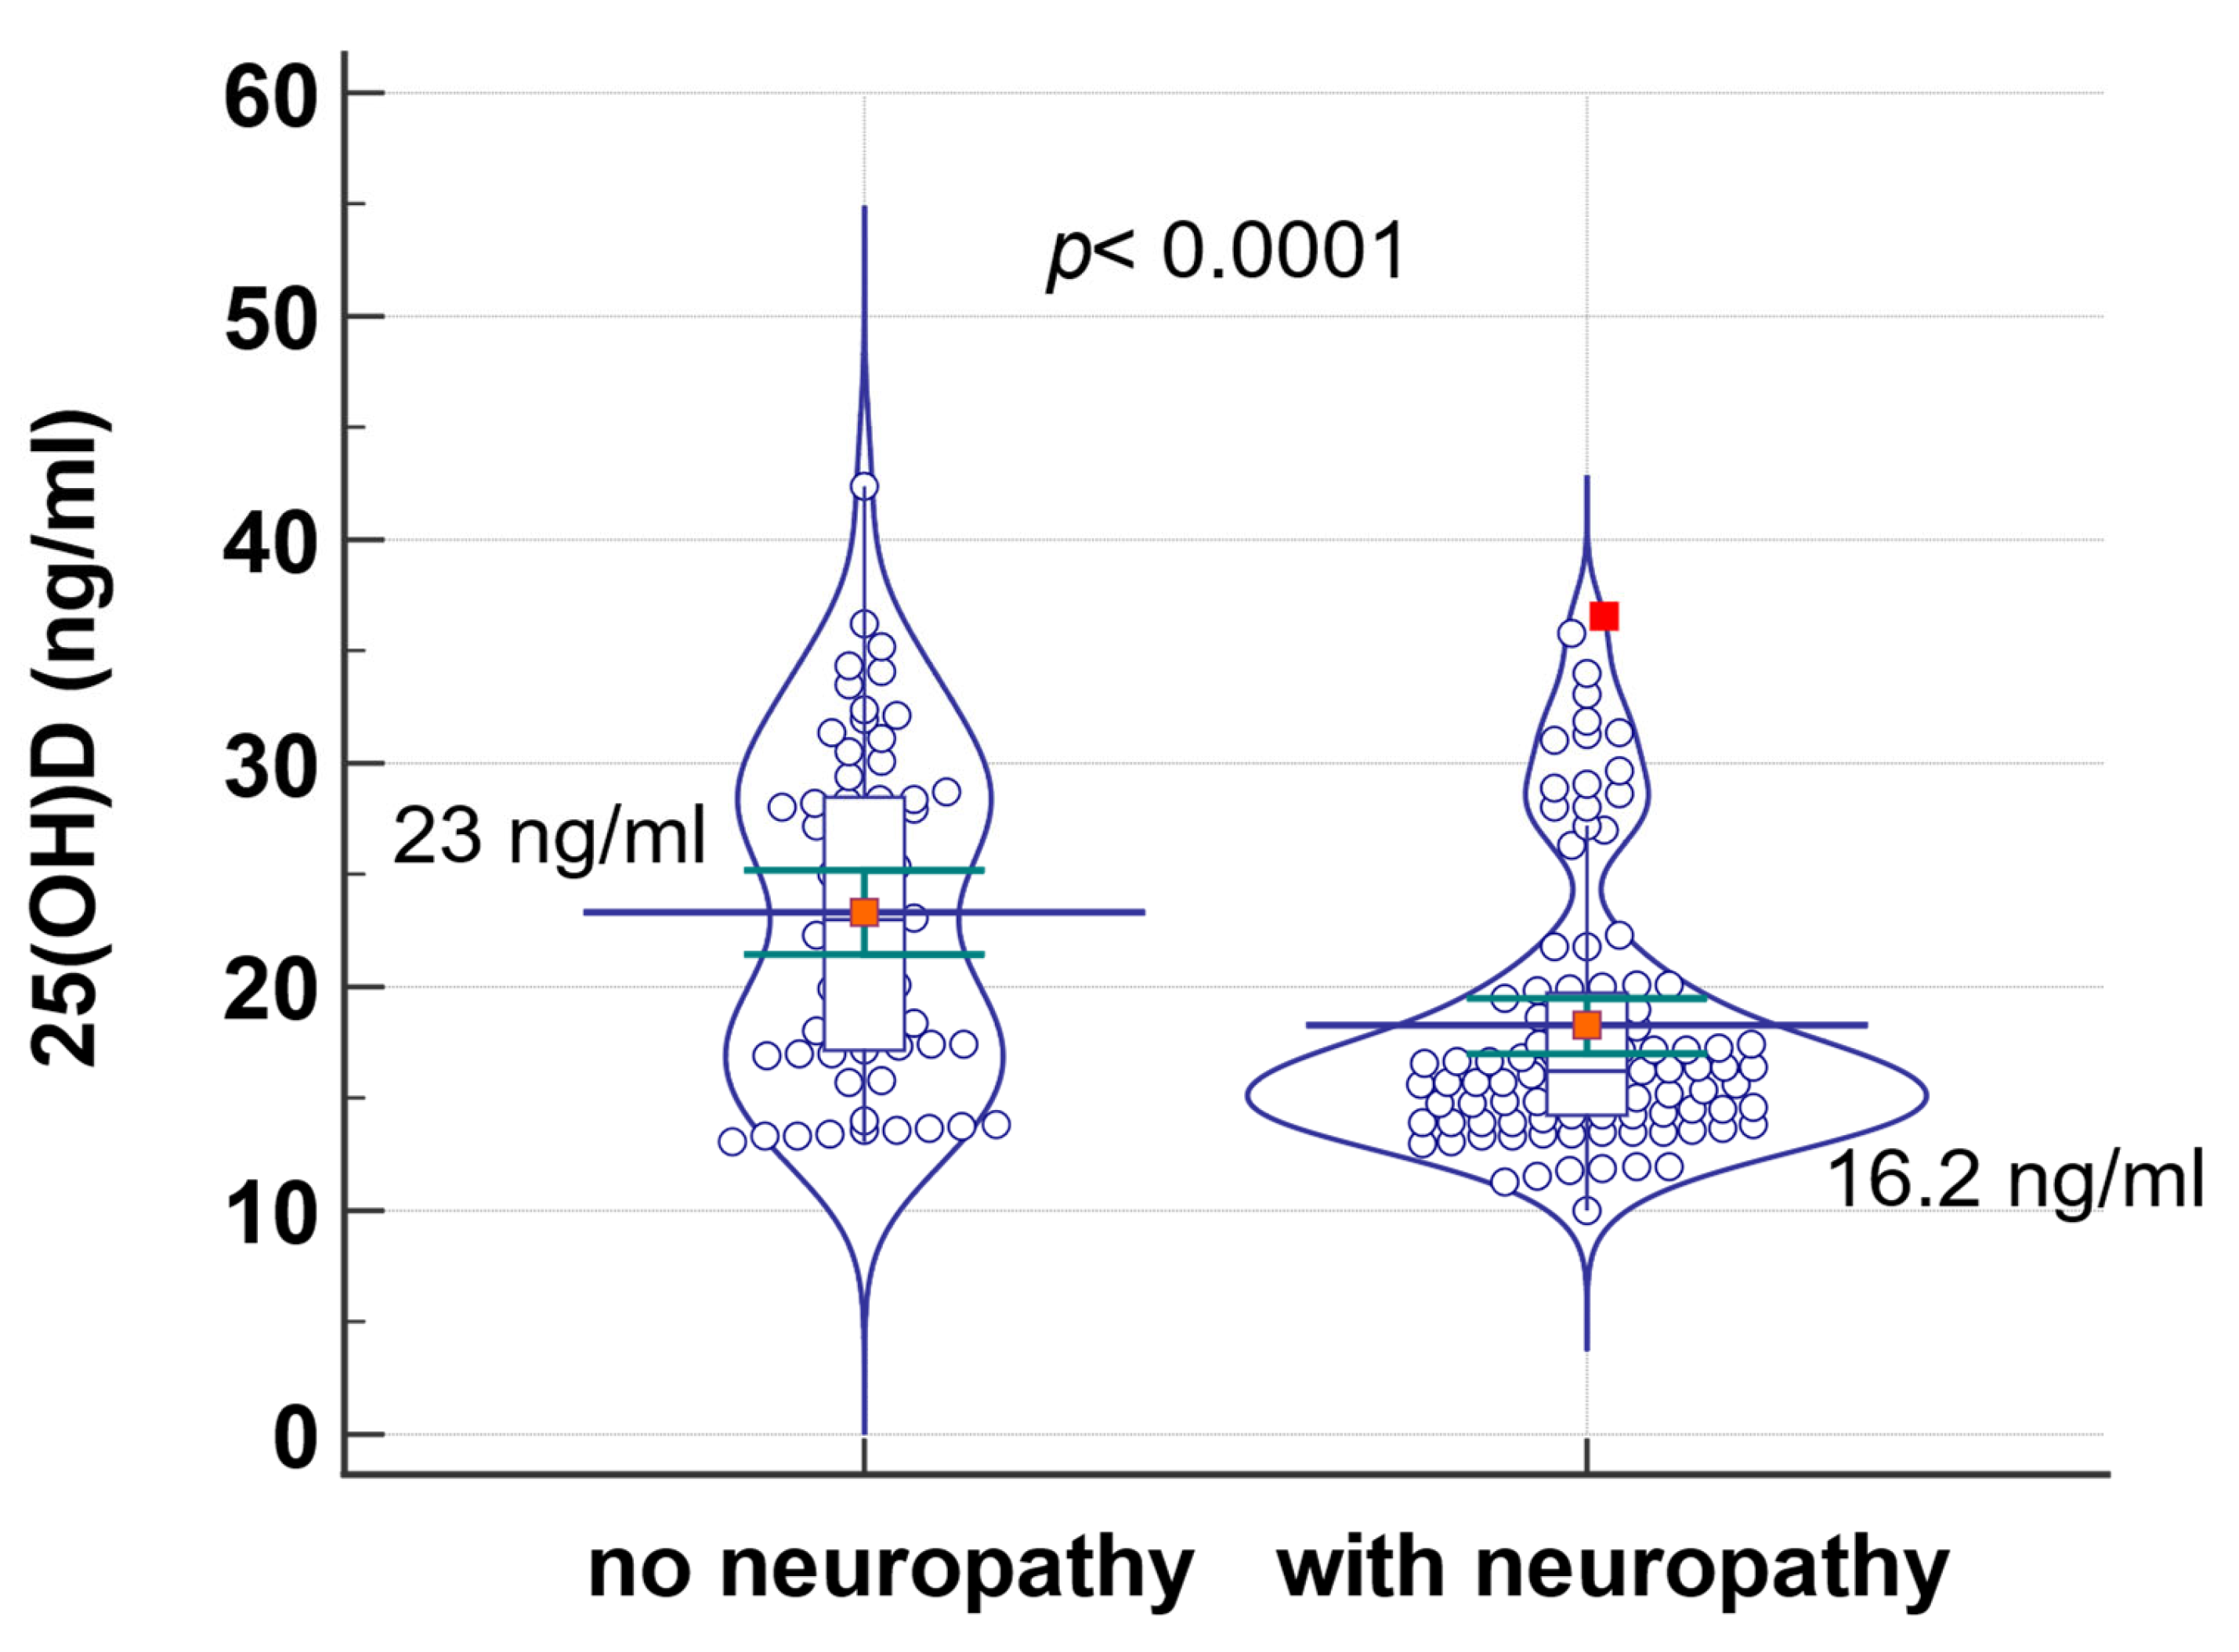
| Diabetic neuropathy * | 99 | 16.2400 | 68.0253 | 61 | 23.0000 | 100.7459 | <0.0001 |
| CVD * | 74 | 15.7 | 60.8 | 86 | 20.9 | 60.8 | <0.0001 |
| Dementia * | 29 | 15.7 | 60.2 | 131 | 18.2 | 84.9 | 0.009 |
| Stroke * | 33 | 16.2 | 62.9 | 127 | 18.3 | 85 | 0.01 |
Disclaimer/Publisher’s Note: The statements, opinions and data contained in all publications are solely those of the individual author(s) and contributor(s) and not of MDPI and/or the editor(s). MDPI and/or the editor(s) disclaim responsibility for any injury to people or property resulting from any ideas, methods, instructions or products referred to in the content. |
© 2024 by the authors. Licensee MDPI, Basel, Switzerland. This article is an open access article distributed under the terms and conditions of the Creative Commons Attribution (CC BY) license (https://creativecommons.org/licenses/by/4.0/).
Share and Cite
Albai, O.; Braha, A.; Timar, B.; Golu, I.; Timar, R. Vitamin D—A New Therapeutic Target in the Management of Type 2 Diabetes Patients. J. Clin. Med. 2024, 13, 1390. https://doi.org/10.3390/jcm13051390
Albai O, Braha A, Timar B, Golu I, Timar R. Vitamin D—A New Therapeutic Target in the Management of Type 2 Diabetes Patients. Journal of Clinical Medicine. 2024; 13(5):1390. https://doi.org/10.3390/jcm13051390
Chicago/Turabian StyleAlbai, Oana, Adina Braha, Bogdan Timar, Ioana Golu, and Romulus Timar. 2024. "Vitamin D—A New Therapeutic Target in the Management of Type 2 Diabetes Patients" Journal of Clinical Medicine 13, no. 5: 1390. https://doi.org/10.3390/jcm13051390
APA StyleAlbai, O., Braha, A., Timar, B., Golu, I., & Timar, R. (2024). Vitamin D—A New Therapeutic Target in the Management of Type 2 Diabetes Patients. Journal of Clinical Medicine, 13(5), 1390. https://doi.org/10.3390/jcm13051390