
Enhancing Pulmonary Embolism Mortality Risk Stratification Using Machine Learning: The Role of the Neutrophil-to-Lymphocyte Ratio

 , and
, and
Abstract
1. Introduction
2. Materials and Methods
2.1. Study Design and Data Collection
- PESI:
- ○
- Very low risk: ≤65 points
- ○
- Low risk: 66–85 points
- ○
- Intermediate risk: 86–105 points.
- ○
- High risk: 106–125 points
- ○
- Very high risk: >125 points
- sPESI
- ○
- Low risk: 0 points
- ○
- High risk: ≥1 point(s)
2.2. Data Processing
2.2.1. Bivariate Analysis
2.2.2. Multivariate Logistic Regression and ROC Curve Comparison
2.2.3. Machine Learning Algorithms
3. Results
3.1. Bivariate Analysis
3.2. Multivariate Binary Logistic Regression and ROC Curves
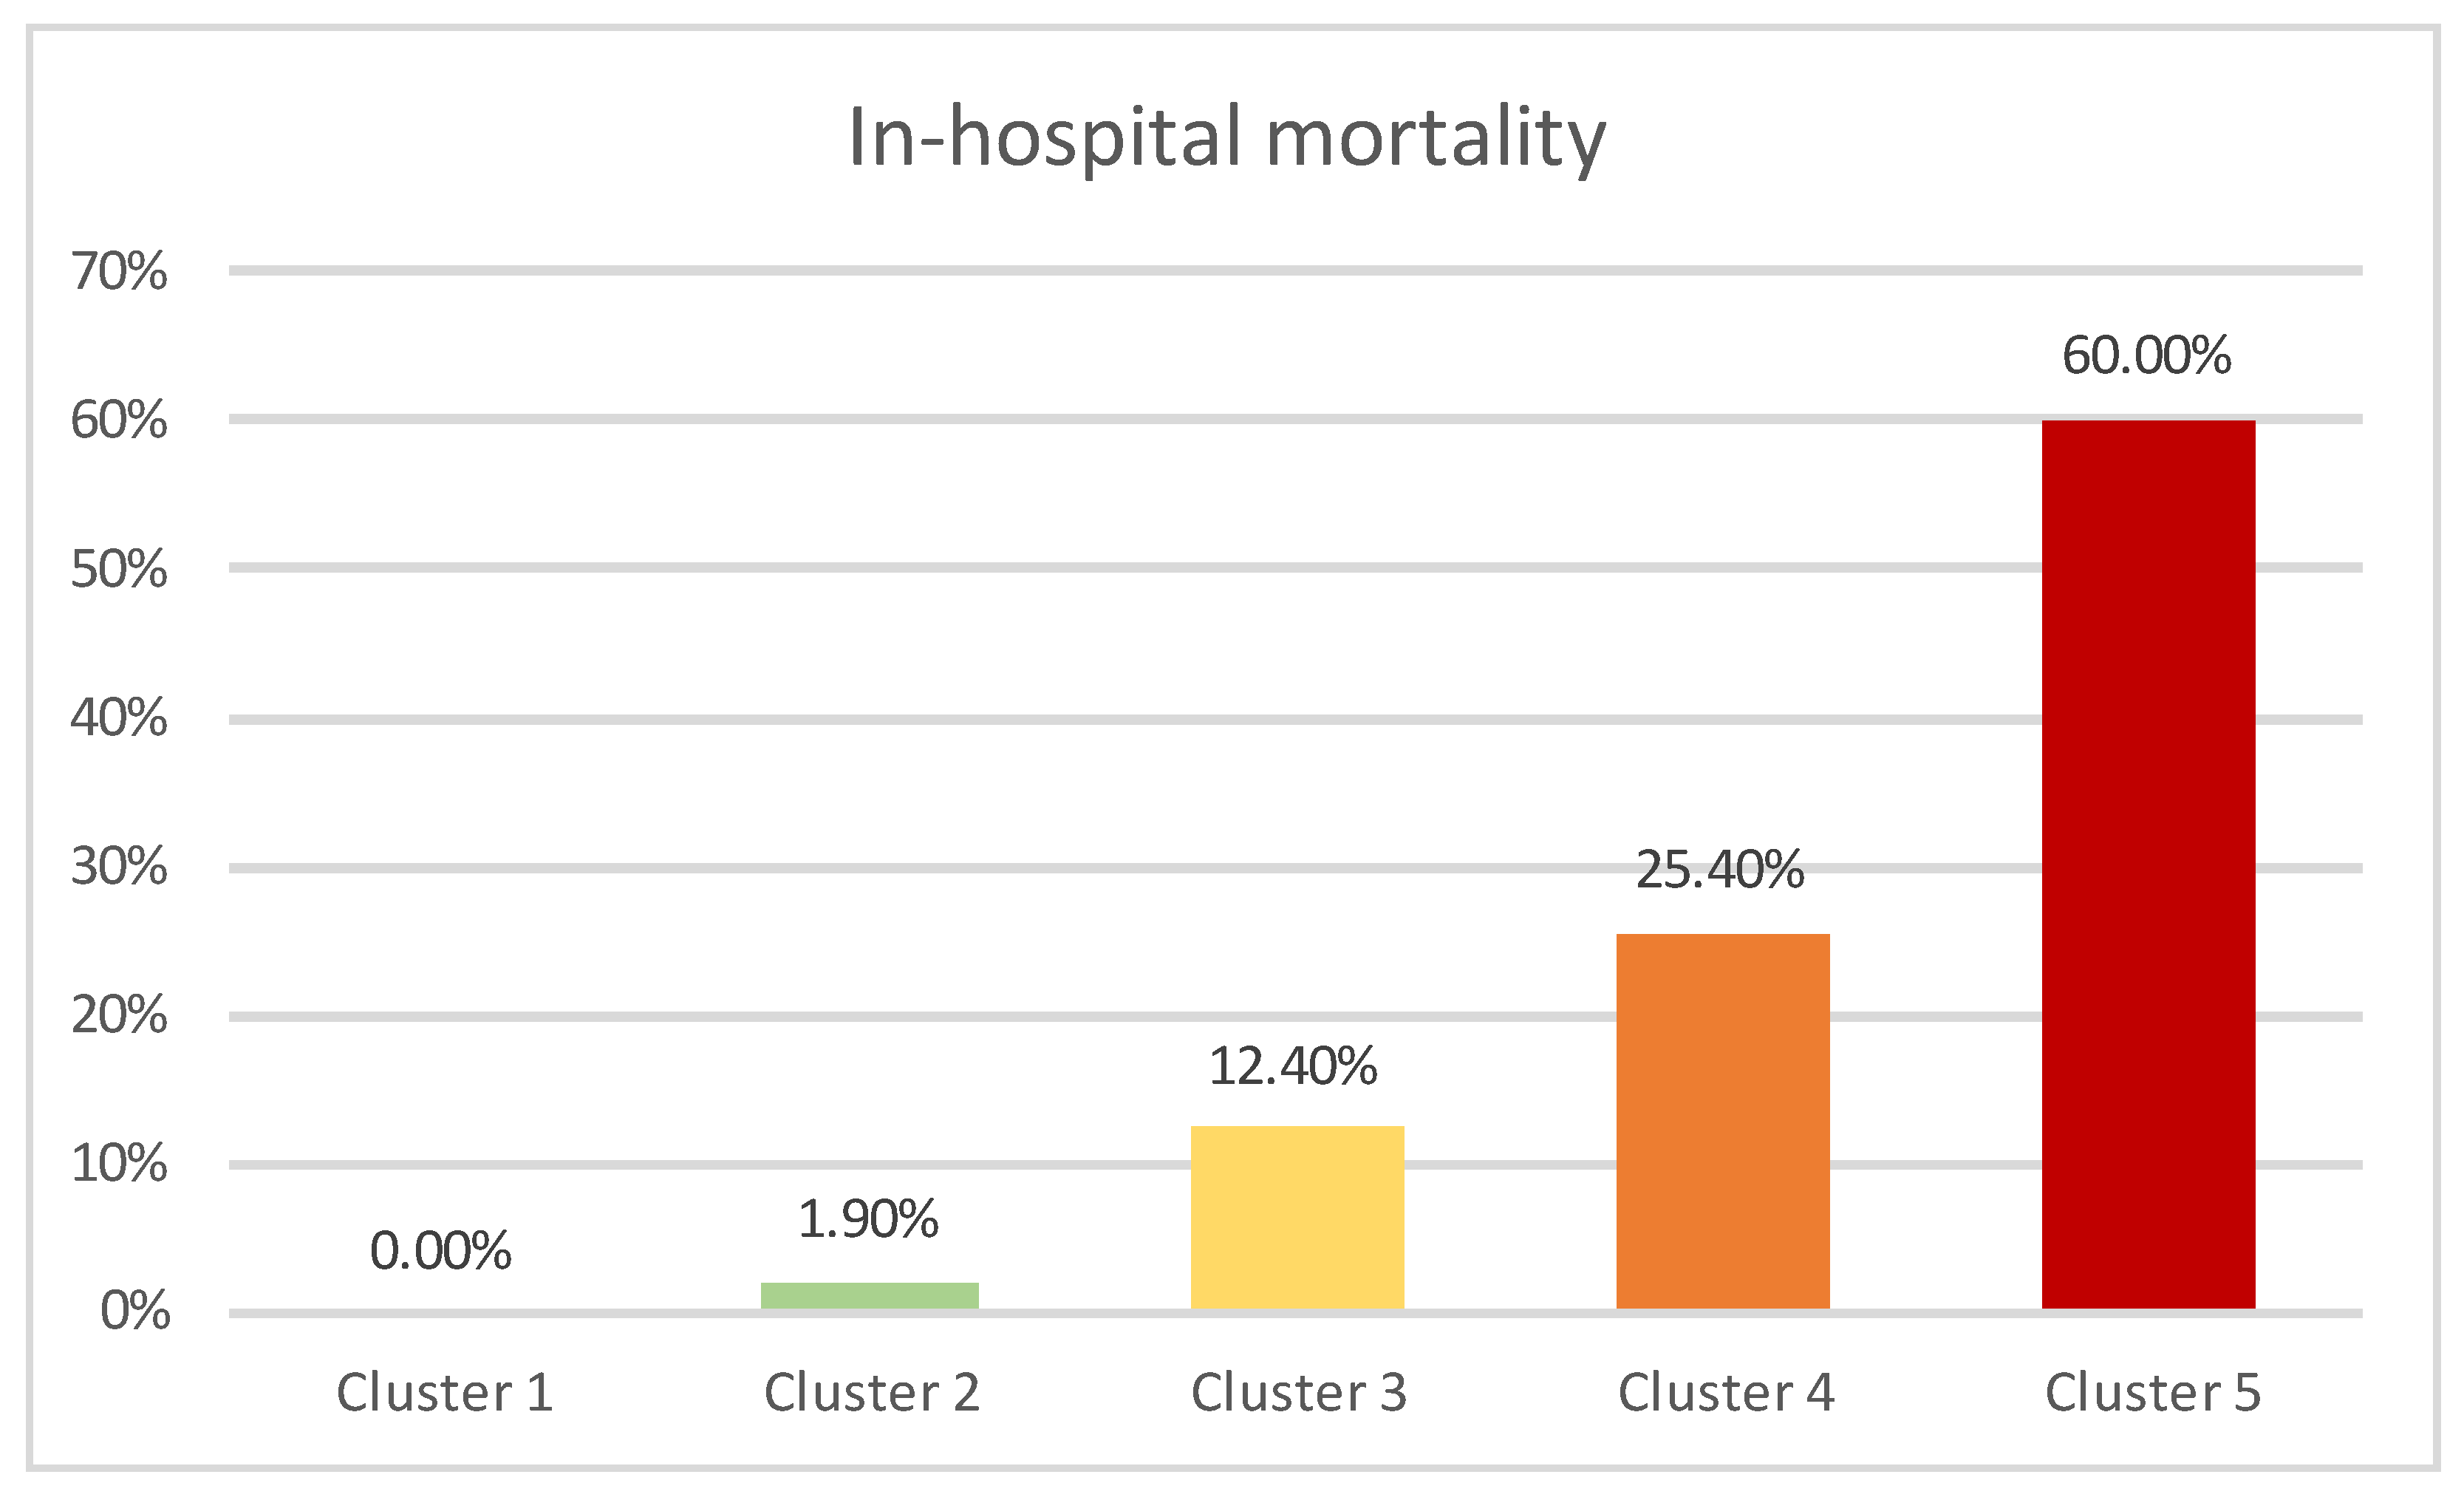
3.3. Two-Step Cluster Analysis
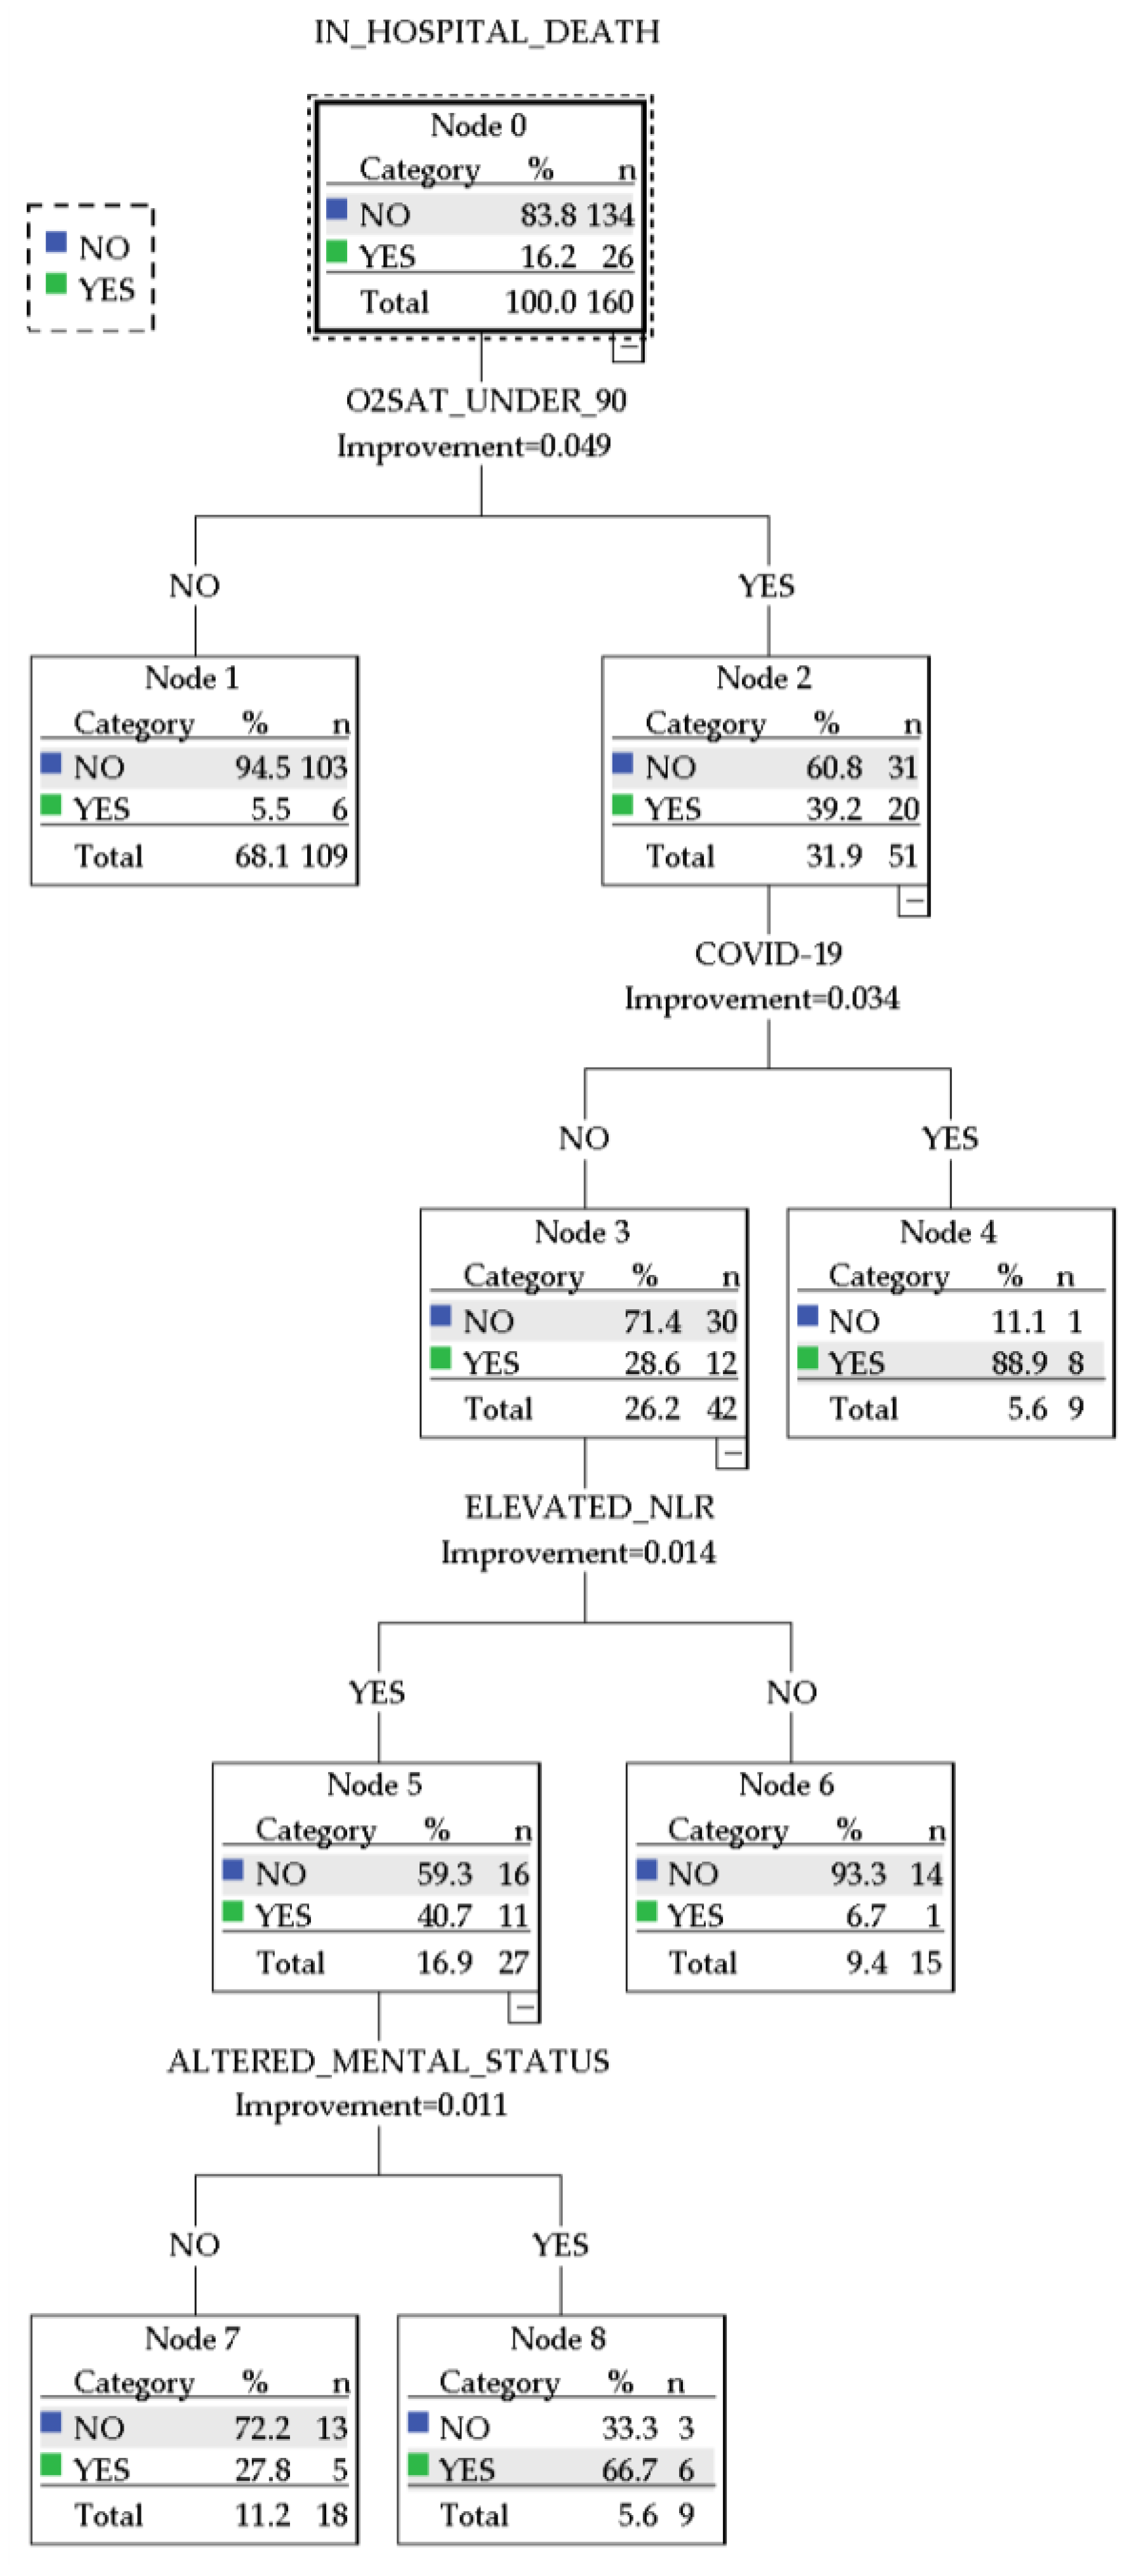
3.4. CART Decision Tree
- A group of 9 patients with arterial oxyhemoglobin saturation <90% infected with COVID-19, with an 88.9% prediction chance of in-hospital mortality
- A group of 9 patients without COVID-19 presented with altered mental status, arterial oxyhemoglobin saturation <90%, and elevated NLR and had a 66.7% prediction chance of in-hospital mortality.
- A group of 18 patients without COVID-19 who presented with arterial oxyhemoglobin saturation <90% and elevated NLR and had a 27.8% prediction chance of in-hospital mortality
- A group of 15 patients without COVID-19 who presented with arterial oxyhemoglobin saturation <90% but did not have elevated NLR. These patients had a 6.7% chance of predicted in-hospital mortality.
- A group of 109 patients who presented with normal arterial oxyhemoglobin saturation. These patients were not further stratified and had a 5.5% predicted chance of in-hospital mortality.
- A group of 5 patients infected with COVID-19 and a PESI score above 131 with a 100% prediction chance of in-hospital mortality.
- A group of 3 patients without COVID-19 who presented with a WBC count above 18.975 × 10³/µL and an NLR above 14.525 with a 100% prediction chance of in-hospital mortality.
- A group of 4 patients without COVID-19 who had a WBC count up to 18.975 × 10³/µL and an NLR up to 14.525 but presented a PESI score above 189. In this group, the predicted chance of in-hospital mortality was 75%.
- A group of 6 patients without COVID-19 and with a WBC up to 18.975 × 10³/µL but with a PESI score above 131 and an NLR above 14.525. This group was predicted to have a 66.7% chance of in-hospital mortality.
- A group of 52 patients with a PESI score under 131, who had a 3.8% chance of in-hospital mortality.
- A group of 13 patients with a PESI score between 131 and 189, who had a WBC count up to 18.975 × 10³/µL and an NLR up to 14.525. This group had a 0% predicted chance of in-hospital mortality.
4. Discussion
Strengths and Limitations
5. Conclusions
Author Contributions
Funding
Institutional Review Board Statement
Informed Consent Statement
Data Availability Statement
Conflicts of Interest
References
- Raskob, G.E.; Angchaisuksiri, P.; Blanco, A.N.; Buller, H.; Gallus, A.; Hunt, B.J.; Hylek, E.M.; Kakkar, A.; Konstantinides, S.V.; McCumber, M.; et al. Thrombosis. Arterioscler. Thromb. Vasc. Biol. 2014, 34, 2363–2371. [Google Scholar] [CrossRef]
- Barco, S.; Woersching, A.L.; Spyropoulos, A.C.; Piovella, F.; Mahan, C.E. European Union-28: An Annualised Cost-of-Illness Model for Venous Thromboembolism. Thromb. Haemost. 2016, 115, 800–808. [Google Scholar] [CrossRef]
- de Miguel-Díez, J.; Jiménez-García, R.; Jiménez, D.; Monreal, M.; Guijarro, R.; Otero, R.; Hernández-Barrera, V.; Trujillo-Santos, J.; López de Andrés, A.; Carrasco-Garrido, P. Trends in Hospital Admissions for Pulmonary Embolism in Spain from 2002 to 2011. Eur. Respir. J. 2014, 44, 942–950. [Google Scholar] [CrossRef]
- Wendelboe, A.M.; Raskob, G.E. Global Burden of Thrombosis. Circ. Res. 2016, 118, 1340–1347. [Google Scholar] [CrossRef] [PubMed]
- Donzé, J.; Gal, G.; Fine, M.J.; Roy, P.-M.; Sanchez, O.; Verschuren, F.; Cornuz, J.; Meyer, G.; Perrier, A.; Righini, M.; et al. Prospective Validation of the Pulmonary Embolism Severity Index. Thromb. Haemost. 2008, 100, 943–948. [Google Scholar] [CrossRef] [PubMed]
- Jiménez, D. Simplification of the Pulmonary Embolism Severity Index for Prognostication in Patients With Acute Symptomatic Pulmonary Embolism. Arch Intern. Med. 2010, 170, 1383. [Google Scholar] [CrossRef] [PubMed]
- Cimini, L.A.; Candeloro, M.; Pływaczewska, M.; Maraziti, G.; Di Nisio, M.; Pruszczyk, P.; Agnelli, G.; Becattini, C. Prognostic Role of Different Findings at Echocardiography in Acute Pulmonary Embolism: A Critical Review and Meta-Analysis. ERJ Open Res. 2023, 9, 00641–02022. [Google Scholar] [CrossRef]
- Konstantinides, S.V.; Meyer, G.; Becattini, C.; Bueno, H.; Geersing, G.-J.; Harjola, V.-P.; Huisman, M.V.; Humbert, M.; Jennings, C.S.; Jiménez, D.; et al. 2019 ESC Guidelines for the Diagnosis and Management of Acute Pulmonary Embolism Developed in Collaboration with the European Respiratory Society (ERS). Eur. Heart J. 2020, 41, 543–603. [Google Scholar] [CrossRef] [PubMed]
- Boccatonda, A.; Campello, E.; Simion, C.; Simioni, P. Long-Term Hypercoagulability, Endotheliopathy and Inflammation Following Acute SARS-CoV-2 Infection. Expert Rev. Hematol. 2023, 16, 1035–1048. [Google Scholar] [CrossRef] [PubMed]
- Cordeanu, E.; Lambach, H.; Tousch, J.; Jambert, L.; Mirea, C.; Heitz, M.; Frantz, A.S.; Delatte, A.; Younes, W.; Woehl, B.; et al. Venous Thromboembolism Frequency in Patients Hospitalized for SARS-CoV-2 Infection. Arch. Cardiovasc. Dis. Suppl. 2021, 13, 106. [Google Scholar] [CrossRef]
- Mumoli, N.; Dentali, F.; Conte, G.; Colombo, A.; Capra, R.; Porta, C.; Rotiroti, G.; Zuretti, F.; Cei, M.; Tangianu, F.; et al. Upper Extremity Deep Vein Thrombosis in COVID-19: Incidence and Correlated Risk Factors in a Cohort of Non-ICU Patients. PLoS ONE 2022, 17, e0262522. [Google Scholar] [CrossRef]
- Tripolino, C.; Pizzini, A.M.; Zaccaroni, S.; Cicognani, C.; Dapporto, S.; Cipollini, M.L.; Giannone, C.; Cavoli, C.; Silingardi, M. Is SARS-CoV-2 Infection an Emerging Risk Factor for Splanchnic Venous Thrombosis? Clin. Hemorheol. Microcirc. 2021, 79, 347–355. [Google Scholar] [CrossRef]
- Arbănași, E.M.; Mureșan, A.V.; Arbănași, E.M.; Kaller, R.; Cojocaru, I.I.; Coșarcă, C.M.; Russu, E. The Neutrophil-to-Lymphocyte Ratio’s Predictive Utility in Acute Pulmonary Embolism: Systematic Review. J. Cardiovasc. Emergencies 2022, 8, 25–30. [Google Scholar] [CrossRef]
- Efros, O.; Beit Halevi, T.; Meisel, E.; Soffer, S.; Barda, N.; Cohen, O.; Kenet, G.; Lubetsky, A. The Prognostic Role of Neutrophil-to-Lymphocyte Ratio in Patients Hospitalized with Acute Pulmonary Embolism. J. Clin. Med. 2021, 10, 4058. [Google Scholar] [CrossRef] [PubMed]
- Buonacera, A.; Stancanelli, B.; Colaci, M.; Malatino, L. Neutrophil to Lymphocyte Ratio: An Emerging Marker of the Relationships between the Immune System and Diseases. Int. J. Mol. Sci. 2022, 23, 3636. [Google Scholar] [CrossRef] [PubMed]
- Song, M.; Graubard, B.I.; Rabkin, C.S.; Engels, E.A. Neutrophil-to-Lymphocyte Ratio and Mortality in the United States General Population. Sci. Rep. 2021, 11, 464. [Google Scholar] [CrossRef]
- Bhat, T.; Teli, S.; Rijal, J.; Bhat, H.; Raza, M.; Khoueiry, G.; Meghani, M.; Akhtar, M.; Costantino, T. Neutrophil to Lymphocyte Ratio and Cardiovascular Diseases: A Review. Expert Rev. Cardiovasc. Ther. 2013, 11, 55–59. [Google Scholar] [CrossRef] [PubMed]
- Afari, M.E.; Bhat, T. Neutrophil to Lymphocyte Ratio (NLR) and Cardiovascular Diseases: An Update. Expert Rev. Cardiovasc. Ther. 2016, 14, 573–577. [Google Scholar] [CrossRef] [PubMed]
- Fest, J.; Ruiter, T.R.; Groot Koerkamp, B.; Rizopoulos, D.; Ikram, M.A.; van Eijck, C.H.J.; Stricker, B.H. The Neutrophil-to-Lymphocyte Ratio Is Associated with Mortality in the General Population: The Rotterdam Study. Eur. J. Epidemiol. 2019, 34, 463–470. [Google Scholar] [CrossRef] [PubMed]
- Balta, S.; Celik, T.; Mikhailidis, D.P.; Ozturk, C.; Demirkol, S.; Aparci, M.; Iyisoy, A. The Relation Between Atherosclerosis and the Neutrophil–Lymphocyte Ratio. Clin. Appl. Thromb./Hemost. 2016, 22, 405–411. [Google Scholar] [CrossRef]
- Buyukkaya, E.; Karakaş, M.F.; Karakaş, E.; Akçay, A.B.; Tanboga, I.H.; Kurt, M.; Sen, N. Correlation of Neutrophil to Lymphocyte Ratio With the Presence and Severity of Metabolic Syndrome. Clin. Appl. Thromb./Hemost. 2014, 20, 159–163. [Google Scholar] [CrossRef]
- Caillon, A.; Trimaille, A.; Favre, J.; Jesel, L.; Morel, O.; Kauffenstein, G. Role of Neutrophils, Platelets, and Extracellular Vesicles and Their Interactions in COVID-19-associated Thrombopathy. J. Thromb. Haemost. 2022, 20, 17–31. [Google Scholar] [CrossRef]
- Hobohm, L.; Sagoschen, I.; Barco, S.; Farmakis, I.T.; Fedeli, U.; Koelmel, S.; Gori, T.; Espinola-Klein, C.; Münzel, T.; Konstantinides, S.; et al. COVID-19 Infection and Its Impact on Case Fatality in Patients with Pulmonary Embolism. Eur. Respir. J. 2023, 61, 2200619. [Google Scholar] [CrossRef]
- Lüthi-Corridori, G.; Giezendanner, S.; Kueng, C.; Boesing, M.; Leuppi-Taegtmeyer, A.B.; Mbata, M.K.; Schuetz, P.; Leuppi, J.D. Risk Factors for Hospital Outcomes in Pulmonary Embolism: A Retrospective Cohort Study. Front. Med. 2023, 10. [Google Scholar] [CrossRef]
- Afzal, A.; Noor, H.A.; Gill, S.A.; Brawner, C.; Stein, P.D. Leukocytosis in Acute Pulmonary Embolism. Chest 1999, 115, 1329–1332. [Google Scholar] [CrossRef]
- Lang, R.M.; Badano, L.P.; Mor-Avi, V.; Afilalo, J.; Armstrong, A.; Ernande, L.; Flachskampf, F.A.; Foster, E.; Goldstein, S.A.; Kuznetsova, T.; et al. Recommendations for Cardiac Chamber Quantification by Echocardiography in Adults: An Update from the American Society of Echocardiography and the European Association of Cardiovascular Imaging. Eur. Heart J. Cardiovasc. Imaging 2015, 16, 233–271. [Google Scholar] [CrossRef]
- Neamtu, B.; Negrea, M.O.; Neagu, I. Predicting Glycemic Control in a Small Cohort of Children with Type 1 Diabetes Using Machine Learning Algorithms. Mathematics 2023, 11, 4388. [Google Scholar] [CrossRef]
- Kim, H.-I.; Lim, H.; Moon, A. Sex Differences in Cancer: Epidemiology, Genetics and Therapy. Biomol. Ther. 2018, 26, 335–342. [Google Scholar] [CrossRef] [PubMed]
- Varmaghani, M.; Dehghani, M.; Heidari, E.; Sharifi, F.; Saeedi Moghaddam, S.; Farzadfar, F. Global Prevalence of Chronic Obstructive Pulmonary Disease: Systematic Review and Meta-Analysis. East. Mediterr. Health J. 2019, 25, 47–57. [Google Scholar] [CrossRef] [PubMed]
- Alsaloum, M.; Zilinyi, R.S.; Madhavan, M.; Snyder, D.J.; Saleem, D.; Burton, J.B.; Rosenzweig, E.B.; Takeda, K.; Brodie, D.; Agerstrand, C.; et al. Gender Disparities in Presentation, Management, and Outcomes of Acute Pulmonary Embolism. Am. J. Cardiol. 2023, 202, 67–73. [Google Scholar] [CrossRef] [PubMed]
- Jarman, A.F.; Mumma, B.E.; Singh, K.S.; Nowadly, C.D.; Maughan, B.C. Crucial Considerations: Sex Differences in the Epidemiology, Diagnosis, Treatment, and Outcomes of Acute Pulmonary Embolism in Non-pregnant Adult Patients. J. Am. Coll. Emerg. Physicians Open 2021, 2. [Google Scholar] [CrossRef]
- Phan, T.; Brailovsky, Y.; Fareed, J.; Hoppensteadt, D.; Iqbal, O.; Darki, A. Neutrophil-to-Lymphocyte and Platelet-to-Lymphocyte Ratios Predict All-Cause Mortality in Acute Pulmonary Embolism. Clin. Appl. Thromb./Hemost. 2020, 26, 107602961990054. [Google Scholar] [CrossRef]
- Aujesky, D.; Obrosky, D.S.; Stone, R.A.; Auble, T.E.; Perrier, A.; Cornuz, J.; Roy, P.-M.; Fine, M.J. Derivation and Validation of a Prognostic Model for Pulmonary Embolism. Am. J. Respir. Crit. Care Med. 2005, 172, 1041–1046. [Google Scholar] [CrossRef] [PubMed]
- Howard, R.; Kanetsky, P.A.; Egan, K.M. Exploring the Prognostic Value of the Neutrophil-to-Lymphocyte Ratio in Cancer. Sci. Rep. 2019, 9, 19673. [Google Scholar] [CrossRef]
- Liu, Y.; Du, X.; Chen, J.; Jin, Y.; Peng, L.; Wang, H.H.X.; Luo, M.; Chen, L.; Zhao, Y. Neutrophil-to-Lymphocyte Ratio as an Independent Risk Factor for Mortality in Hospitalized Patients with COVID-19. J. Infect. 2020, 81, e6–e12. [Google Scholar] [CrossRef] [PubMed]
- Fu, Z.; Bai, G.; Song, B.; Wang, Y.; Song, H.; Ma, M.; Zhu, J.; Zhang, Z.; Kang, Q. Risk Factors and Mortality of Pulmonary Embolism in COVID-19 Patients: Evidence Based on Fifty Observational Studies. Medicine 2022, 101, e29895. [Google Scholar] [CrossRef] [PubMed]
- Mouzarou, A.; Ioannou, M.; Leonidou, E.; Chaziri, I. Pulmonary Embolism in Post-CoviD-19 Patients, a Literature Review: Red Flag for Increased Awareness? SN Compr. Clin. Med. 2022, 4, 190. [Google Scholar] [CrossRef] [PubMed]
- Wang, Q.; Ma, J.; Jiang, Z.; Ming, L. Prognostic Value of Neutrophil-to-Lymphocyte Ratio and Platelet-to-Lymphocyte Ratio in Acute Pulmonary Embolism: A Systematic Review and Meta-Analysis. Int. Angiol. 2018, 37, 4–11. [Google Scholar] [CrossRef]


| First Available CBC | Total (% of Grand Total) | Gender (% of Category) | p-Value | |
|---|---|---|---|---|
| Female | Male | |||
| <24 h | 83 (51.88%) | 39 (46.99%) | 44 (53.01%) | 0.973 |
| 24–48 h | 18 (11.25%) | 9 (50%) | 9 (50%) | |
| >48 h | 59 (36.88%) | 28 (47.56%) | 31 (52.54%) | |
| Variable | Descriptive Parameter | Whole Group | CBC < 24 h | ||||
|---|---|---|---|---|---|---|---|
| Gender | p-Value | Gender | p-Value | ||||
| Female | Male | Female | Male | ||||
| Age | Mean | 67.08 | 65.77 | 0.781 | 68.08 | 67.75 | 0.1 |
| StdDev | 15.54 | 15.13 | 16.68 | 16 | |||
| IQR | 15 | 17 | 26 | 21 | |||
| MIN | 21 | 26 | 21 | 26 | |||
| MAX | 94 | 89 | 94 | 89 | |||
| 95% CI | 63.53–70.63 | 62.49–69.06 | 62.67–73.48 | 57.89–67.61 | |||
| PESI | Mean | 108.72 | 115.1 | 0.246 | 117.69 | 122.05 | 0.690 |
| StdDev | 46.75 | 41.98 | 53.85 | 45.15 | |||
| IQR | 59.5 | 49.25 | 92 | 61.75 | |||
| MIN | 21 | 38 | 21 | 50 | |||
| MAX | 220 | 247 | 220 | 247 | |||
| 95% CI | 98.04—119.4 | 106—24.22 | 100.24–135.15 | 108.31–135.77 | |||
| SPESI | Mean | 1.55 | 1.56 | 0.823 | 1.67 | 1.75 | 0.625 |
| StdDev | 1.28 | 1.15 | 1.46 | 1.24 | |||
| IQR | 2 | 1 | 3 | 2 | |||
| MIN | 0 | 0 | 0 | 0 | |||
| MAX | 5 | 5 | 5 | 5 | |||
| 95% CI | 1.26—1.85 | 1.31—1.81 | 1.19–2.14 | 1.37–2.13 | |||
| WBC Count (103/µL) | Mean | 10.24 | 9.66 | 0.798 | 10.86 | 10.23 | 0.985 |
| StdDev | 5.32 | 3.58 | 6.27 | 4.07 | |||
| IQR | 6.17 | 5.32 | 5.74 | 6.54 | |||
| MIN | 2.57 | 3.76 | 3.66 | 4.49 | |||
| MAX | 37.06 | 19.37 | 37.06 | 19.37 | |||
| 95% CI | 8.88–12.99 | 8.89–10.44 | 8.83–12.9 | 9–11.48 | |||
| NLR | Mean | 5.92 | 6.88 | 0.727 | 7.29 | 7.94 | 1 |
| StdDev | 6.51 | 7.83 | 7.9 | 8.54 | |||
| IQR | 4.33 | 5.38 | 6.01 | 7.17 | |||
| MIN | 0.30 | 0.55 | 0.45 | 1.45 | |||
| MAX | 45.87 | 43.23 | 45.87 | 43.23 | |||
| 95% CI | 4.43—7.41 | 5.17—8.57 | 4.73—9.85 | 5.34—10.54 | |||
| Variable | Whole Group | CBC < 24 h | ||||
|---|---|---|---|---|---|---|
| Gender | p-Value | Gender | p-Value | |||
| Female | Male | Female | Male | |||
| COVID-19 (positive) | 4 (5.3%) | 12 (14.3%) | 0.057 | 2 (5.1%) | 7 (15.9%) | 0.163 |
| Cancer | 28 (36.8%) | 18 (21.4%) | 0.031 | 13 (33.3%) | 16 (34.1%) | 0.942 |
| Chronic heart failure | 20 (26.3%) | 26 (31%) | 0.518 | 10 (25.6%) | 14 (31.8%) | 0.536 |
| Chronic pulmonary disease | 12 (15.8%) | 28 (33.3%) | 0.01 | 7 (17.9%) | 16 (36.4%) | 0.061 |
| Pulse rate ≥ 110 bpm | 15 (19.7%) | 18 (21.4%) | 0.792 | 9 (23.1%) | 11 (25%) | 0.838 |
| Systolic BP < 100 mmHg | 10 (13.2%) | 13 (15.5%) | 0.676 | 9 (23.1%) | 8 (18.2%) | 0.581 |
| Respiratory rate > 30 breaths/min | 3 (3.9%) | 8 (9.5%) | 0.164 | 3 (7.7%) | 5 (11.4%) | 0.572 |
| Altered mental status | 11 (14.5%) | 15 (17.9%) | 0.562 | 7 (17.9%) | 10 (22.7%) | 0.590 |
| Arterial oxyhemoglobin Saturation < 90% | 24 (31.6%) | 27 (32.1%) | 0.939 | 13 (33.3%) | 16 (36.4%) | 0.773 |
| Elevated NLR | 40 (52.6%) | 40 (47.6%) | 0.527 | 24 (61.5%) | 25 (56.8%) | 0.663 |
| Leukocytosis | 32 (42.1%) | 31 (36.9%) | 0.501 | 18 (46.2%) | 19 (43.2%) | 0.786 |
| Concomitant DVT | 28 (36.8%) | 32 (38.1%) | 0.870 | 13 (33.3%) | 15 (34.1%) | 0.942 |
| Dilated RV | 32 (42.1%) | 53 (63.1%) | <0.01 | 19 (48.7%) | 26 (59.1%) | 0.344 |
| RV dysfunction | 3 (3.9%) | 3 (3.6%) | 0.9 | 1 (2.6%) | 2 (4.5%) | 1 |
| Dilated VCI | 5 (6.6%) | 9 (10.7%) | 0.355 | 2 (5.1%) | 4 (9.1%) | 0.679 |
| Intracavitary thrombus | 3 (3.9%) | 2 (2.4%) | 0.570 | 2 (5.1%) | 0 (0%) | 0.218 |
| In-hospital death | 13 (17.1%) | 13 (15.5%) | 0.780 | 8 (20.5%) | 9 (20.5%) | 0.995 |
| Variable | Descriptive Parameter | Whole Group | CBC < 24 h | ||||
|---|---|---|---|---|---|---|---|
| Elevated NLR (>3.7) | p-Value | Elevated NLR (>4.69) | p-Value | ||||
| No | Yes | No | Yes | ||||
| Age | Mean | 62.53 | 70.26 | <0.01 | 61.4 | 69.2 | 0.03 |
| StdDev | 16.53 | 12.92 | 16.49 | 15.61 | |||
| IQR | 22 | 15 | 25 | 20 | |||
| MIN | 21 | 28 | 21 | 28 | |||
| MAX | 86 | 94 | 87 | 94 | |||
| 95% CI | 58.85–66.2 | 67.39–73.14 | 56.27—66.54 | 64.27—74.12 | |||
| WBC Count (103/µL) | Mean | 8.16 | 11.71 | <0.01 | 8.38 | 12.74 | <0.01 |
| StdDev | 3.32 | 4.81 | 3.72 | 5.56 | |||
| IQR | 3.06 | 5.72 | 3.56 | 5.86 | |||
| MIN | 2.57 | 3.66 | 3.66 | 4.4 | |||
| MAX | 19.86 | 37.06 | 19.37 | 37.06 | |||
| 95% CI | 7.42–8.9 | 10.64–12.78 | 7.21–9.54 | 10.97–14.51 | |||
| PESI | Mean | 91.14 | 133 | <0.01 | 93.05 | 147.61 | <0.01 |
| StdDev | 32.72 | 44.6 | 34.61 | 46.74 | |||
| IQR | 46.5 | 73.25 | 42 | 81 | |||
| MIN | 65 | 21 | 21 | 65 | |||
| MAX | 247 | 166 | 207 | 247 | |||
| 95% CI | 83.86–98.42 | 123.09–142.94 | 82.26–103.83 | 132.86–162.36 | |||
| SPESI | Mean | 1.15 | 1.96 | <0.01 | 1.12 | 1.9 | <0.01 |
| StdDev | 1.06 | 1.23 | 1.09 | 1.31 | |||
| IQR | 2 | 2 | 2 | 2 | |||
| MIN | 0 | 0 | 0 | 0 | |||
| MAX | 5 | 4 | 4 | 5 | |||
| 95% CI | 0.91–1.39 | 1.69–2.24 | 0.78–1.46 | 1.9–2.73 | |||
| Variable | Values | Whole Group | CBC < 24 h | ||||
|---|---|---|---|---|---|---|---|
| Elevated NLR (>3.7) | p-Value | Elevated NLR (>4.69) | p-Value | ||||
| No | Yes | No | Yes | ||||
| COVID-19 | No | 78 (54.2%) | 66 (45.8%) | <0.01 | 41 (55.4%) | 33 (44.6%) | 0.015 |
| Yes | 2 (12.5%) | 14 (87.5%) | 1 (11.1%) | 8 (88.9%) | |||
| Cancer | No | 63 (55.3%) | 51 (44.7%) | 0.036 | 29 (52.7%) | 26 (47.3%) | 0.587 |
| Yes | 17 (37%) | 29 (63%) | 13 (46.4%) | 15 (53.6%) | |||
| Chronic heart failure | No | 59 (51.8%) | 55 (48.2%) | 0.485 | 31 (52.5%) | 28 (47.5%) | 0.579 |
| Yes | 21 (45.7%) | 25 (54.3%) | 11 (45.8%) | 13 (54.2%) | |||
| Chronic pulmonary disease | No | 63 (52.5%) | 57 (47.5%) | 0.273 | 31 (51.7%) | 29 (48.3%) | 0.754 |
| Yes | 17 (42.5%) | 23 (57.5%) | 11 (47.8%) | 12 (52.2%) | |||
| Pulse rate ≥ 110 b.p.m. | No | 66 (52%) | 61 (48%) | 0.329 | 36 (57.1%) | 27 (42.9%) | 0.034 |
| Yes | 14 (42.4%) | 19 (57.6%) | 6 (30%) | 14 (70%) | |||
| Systolic BP < 100 mmHg | No | 77 (56.2%) | 60 (43.8%) | <0.01 | 41 (62.1%) | 25 (37.9%) | <0.01 |
| Yes | 3 (13%) | 20 (87%) | 1 (5.9%) | 16 (94.1%) | |||
| Respiratory rate > 30 breaths/min | No | 77 (51.7%) | 72 (48.3%) | 0.118 | 39 (52%) | 36 (48%) | 0.483 |
| Yes | 3 (27.3%) | 8 (72.7%) | 3 (37.5%) | 5 (62.5%) | |||
| Altered mental status | No | 77 (57.5%) | 57 (42.5%) | <0.01 | 40 (60.6%) | 26 (39.4%) | <0.01 |
| Yes | 3 (11.5%) | 23 (88.5%) | 2 (11.8%) | 15 (88.2%) | |||
| Arterial oxyhemoglobin Saturation < 90% | No | 65 (59.6%) | 44 (40.4%) | <0.01 | 37 (68.5%) | 17 (31.5%) | <0.01 |
| Yes | 15 (29.4%) | 36 (70.6%) | 5 (17.2%) | 24 (82.8%) | |||
| Concomitant DVT | No | 48 (48%) | 52 (52%) | 0.514 | 28 (50.9%) | 27 (49.1%) | 0.938 |
| Yes | 32 (53.3%) | 28 (46.7%) | 14 (50%) | 14 (50%) | |||
| SPESI risk category | Low | 28 (76.5%) | 8 (23.5%) | <0.01 | 13 (81.3%) | 3 (18.8%) | <0.01 |
| High | 54 (42.9%) | 72 (57.1%) | 29 (43.3%) | 38 (56.7%) | |||
| PESI risk category | Very low | 16 (94.1%) | 1 (5.9%) | <0.01 | 8 (88.9%) | 1 (11.1%) | <0.01 |
| Low | 20 (71.4%) | 8 (28.6%) | 10 (76.9%) | 3 (23.1%) | |||
| Intermediate | 18 (47.4%) | 20 (52.6%) | 10 (58.8%) | 7 (41.2%) | |||
| High risk | 16 (57.1%) | 12 (42.9%) | 10 (83.3%) | 2 (16.7%) | |||
| Very high | 10 (20.4%) | 39 (79.6%) | 4 (12.5%) | 28 (87.5%) | |||
| Dilated RV | No | 39 (52%) | 36 (48%) | 0.635 | 18 (47.4%) | 20 (52.6%) | 0.662 |
| Yes | 41 (48.2%) | 44 (51.8%) | 24 (53.3%) | 21 (46.7%) | |||
| RV dysfunction | No | 75 (48.7%) | 79 (51.3%) | 0.210 | 40 (50%) | 40 (50%) | 1 |
| Yes | 5 (83.3%) | 1 (16.7%) | 2 (66.7%) | 1 (33.3%) | |||
| Dilated VCI | No | 70 (47.9%) | 76 (52.1%) | 0.093 | 38 (49.4%) | 39 (50.6%) | 0.676 |
| Yes | 10 (71.4%) | 4 (28.6%) | 4 (66.7%) | 2 (33.3%) | |||
| Intracavitary thrombus | No | 80 (51.6%) | 75 (48.4%) | 0.059 | 42 (51.9%) | 39 (48.1%) | 0.241 |
| Yes | 0 (0%) | 5 (100%) | 0 (0%) | 2 (100%) | |||
| Leukocytosis | No | 66 (68%) | 31 (32%) | <0.01 | 33 (71.7%) | 13 (28.3%) | <0.01 |
| Yes | 14 (22.2%) | 49 (77.8%) | 9 (24.3%) | 28 (75.7%) | |||
| In-hospital death | No | 79 (59%) | 55 (41%) | <0.01 | 40 (60.6%) | 26 (39.4%) | <0.01 |
| Yes | 1 (3.8%) | 25 (96.2%) | 2 (11.8%) | 15 (88.2%) | |||
| Variable | Descriptive Parameter | Whole Group | CBC < 24 h | ||||
|---|---|---|---|---|---|---|---|
| In Hospital Death | p-Value | In Hospital Death | p-Value | ||||
| No | Yes | No | Yes | ||||
| Age | Mean | 65.51 | 70.96 | 0.143 | 63.91 | 70.47 | 0.168 |
| StdDev | 15.61 | 12.83 | 16.59 | 15.19 | |||
| IQR | 17 | 17 | 20 | 20 | |||
| MIN | 21 | 42 | 21 | 42 | |||
| MAX | 94 | 93 | 94 | 93 | |||
| 95% CI | 62.84–68.17 | 65.78–76.15 | 59.83–67.99 | 62.66–78.28 | |||
| WBC Count (103/µL) | Mean | 9.29 | 13.24 | <0.01 | 9.84 | 13.24 | 0.136 |
| StdDev | 3.66 | 6.58 | 3.97 | 8.04 | |||
| IQR | 5.08 | 6.96 | 5.87 | 9.37 | |||
| MIN | 2.57 | 4.4 | 3.66 | 4.4 | |||
| MAX | 20.52 | 37.06 | 20.52 | 37.06 | |||
| 95% CI | 8.67–9.92 | 10.58–15.9 | 8.86–10.81 | 9.1–17.37 | |||
| NLR | Mean | 4.77 | 14.91 | <0.01 | 5.59 | 15.57 | <0.01 |
| StdDev | 4.11 | 12.36 | 4.6 | 13.22 | |||
| IQR | 3.11 | 13.29 | 5.45 | 11.35 | |||
| MIN | 0.3 | 2.80 | 0.45 | 2.8 | |||
| MAX | 20.27 | 45.87 | 19.99 | 45.87 | |||
| 95% CI | 4.07–5.47 | 9.91–19.90 | 4.46–6.72 | 8.78–22.37 | |||
| PESI | Mean | 103.11 | 158.26 | <0.01 | 106.85 | 171.06 | <0.01 |
| StdDev | 37.44 | 48.61 | 41.28 | 44.57 | |||
| IQR | 41.75 | 85.75 | 52.25 | 70.5 | |||
| MIN | 21 | 66 | 21 | 77 | |||
| MAX | 209 | 247 | 209 | 247 | |||
| 95% CI | 96.71–109.51 | 138.63–177.9 | 96.7–117 | 148.15–193.97 | |||
| SPESI | Mean | 1.34 | 2.69 | <0.01 | 1.39 | 2.94 | <0.01 |
| StdDev | 1.12 | 1.01 | 1.25 | 0.9 | |||
| IQR | 1 | 1 | 1 | 2 | |||
| MIN | 0 | 0 | 0 | 1 | |||
| MAX | 5 | 4 | 5 | 4 | |||
| 95% CI | 1.14–1.53 | 2.28–3.10 | 1.09–1.7 | 2.48–3.40 | |||
| Variable | Values | Whole Group | CBC < 24 h | ||||
|---|---|---|---|---|---|---|---|
| In-Hospital Death | p-Value | In-Hospital Death | p-Value | ||||
| No | Yes | No | Yes | ||||
| COVID-19 | No | 127 (88.2%) | 17 (11.8%) | <0.01 | 63 (85.1%) | 11 (14.9%) | <0.01 |
| Yes | 7 (43.8%) | 9 (56.3%) | 3 (33.3%) | 6 (66.7%) | |||
| Cancer | No | 95 (83.3%) | 19 (16.7%) | 0.822 | 44 (80%) | 11 (20%) | 1 |
| Yes | 39 (84.8%) | 7 (15.2%) | 22 (78.6%) | 6 (21.4%) | |||
| Chronic heart failure | No | 100 (87.7%) | 14 (12.3%) | 0.032 | 49 (83.1%) | 10 (16.9%) | 0.239 |
| Yes | 34 (73.9%) | 12 26.1%) | 17 (70.8%) | 7 (29.2%) | |||
| Chronic pulmonary disease | No | 105 (87.5%) | 15 (12.5%) | 0.026 | 50 (83.3%) | 10 (16.7%) | 0.224 |
| Yes | 29 (72.5%) | 11 (27.5%) | 16 (69.6%) | 7 (30.4%) | |||
| Pulse rate ≥ 110 b.p.m. | No | 109 (85.8%) | 18 (14.2%) | 0.162 | 52 (82.5%) | 11 (17.5%) | 0.339 |
| Yes | 25 (75.8%) | 8 (24.2%) | 14 (70%) | 6 (30%) | |||
| Systolic BP < 100 mmHg | No | 120 (87.6%) | 17 (12.4%) | <0.01 | 56 (84.8%) | 10 (15.2%) | 0.038 |
| Yes | 14 (60.9%) | 9 (31.9%) | 10 (58.8%) | 7 (41.2%) | |||
| Respiratory rate > 30 breaths/min | No | 128 (85.9%) | 21 (14.1%) | 0.018 | 62 (82.7%) | 13 (17.3%) | 0.051 |
| Yes | 6 (54.5%) | 5 (45.5%) | 4 (50%) | 4 (50%) | |||
| Altered mental status | No | 121 (90.3%) | 13 (9.7%) | <0.01 | 58 (87.9%) | 8 (12.1%) | <0.01 |
| Yes | 13 (50%) | 13 (50%) | 8 (47.1%) | 9 (52.9%) | |||
| Arterial oxyhemoglobin Saturation < 90% | No | 103 (94.5%) | 6 (5.5%) | <0.01 | 52 (96.3%) | 2 (3.7%) | <0.01 |
| Yes | 31 (60.8%) | 20 (39.2%) | 14 (48.3%) | 15 (51.7%) | |||
| Concomitant DVT | No | 81 (81%) | 19 (9%) | 0.223 | 43 (78.2%) | 12 (21.8%) | 0.672 |
| Yes | 53 (88.3%) | 7 (11.7%) | 23 (82.1%) | 5 (17.9%) | |||
| SPESI risk category | Low | 33 (97.1%) | 1 (2.9%) | 0.018 | 16 (100%) | 0 (0%) | 0.034 |
| High | 101 (80.2%) | 25 (19.8%) | 50 (74.6%) | 17 (25.4%) | |||
| PESI risk category | Very low | 17 (100%) | 0 (0%) | <0.01 | 9 (100%) | 0 (0%) | <0.01 |
| Low | 26 (92.9%) | 2 (7.1%) | 12 (92.3%) | 1 (7.7%) | |||
| Intermediate | 36 (94.7%) | 2 (5.3%) | 17 (100%) | 0 (0%) | |||
| High risk | 25 (89.3%) | 3 (10.7%) | 11 (91.7%) | 1 (8.3%) | |||
| Very high | 30 (61.2%) | 19 (38.8%) | 17 (53.1%) | 15 (46.9%) | |||
| Dilated RV | No | 62 (82.7%) | 13 (17.3%) | 0.727 | 28 (73.7%) | 10 (26.3%) | 0.226 |
| Yes | 72 (84.7%) | 13 (15.3%) | 38 (84.8%) | 7 (15.6%) | |||
| RV dysfunction | No | 128 (83.1%) | 26 (16.9%) | 0.59 | 63 (78.8%) | 17 (21.3%) | 1 |
| Yes | 6 (100%) | 0 (0%) | 3 (100%) | 0 (0%) | |||
| Dilated VCI | No | 120 (82.2%) | 26 (17.8%) | 0,129 | 60 (77.9%) | 17 (22.1%) | 0.338 |
| Yes | 14 (100%) | 0 (0%) | 6 (100%) | 0 (0%) | |||
| Intracavitary thrombus | No | 130 (83.9%) | 25 (16.1%) | 1 | 65 (80.2%) | 16 (19.8%) | 0.37 |
| Yes | 4 (80%) | 1 (20%) | 1 (50%) | 1 (50%) | |||
| Leukocytosis | No | 87 (89.7%) | 10 (10.3%) | 0.11 | 38 (82.6%) | 8 (17.4%) | 0.437 |
| Yes | 47 (74.6%) | 16 (25.4%) | 28 (75.7%) | 9 (24.3%) | |||
| Variable | β | p | BCa 95% CI for β | |
|---|---|---|---|---|
| Lower | Higher | |||
| COVID-19 | 1.68 | <0.01 | 0.01 | 19.58 |
| Altered mental status | 1.56 | <0.01 | 0.2 | 3.35 |
| Arterial oxyhemoglobin Saturation < 90% | 1.98 | <0.01 | 0.27 | 35.77 |
| Elevated NLR (>3.7) | 2.71 | 0.016 | 0.59 | 20.66 |
| Constant | −5.43 | <0.01 | −22.71 | −4.43 |
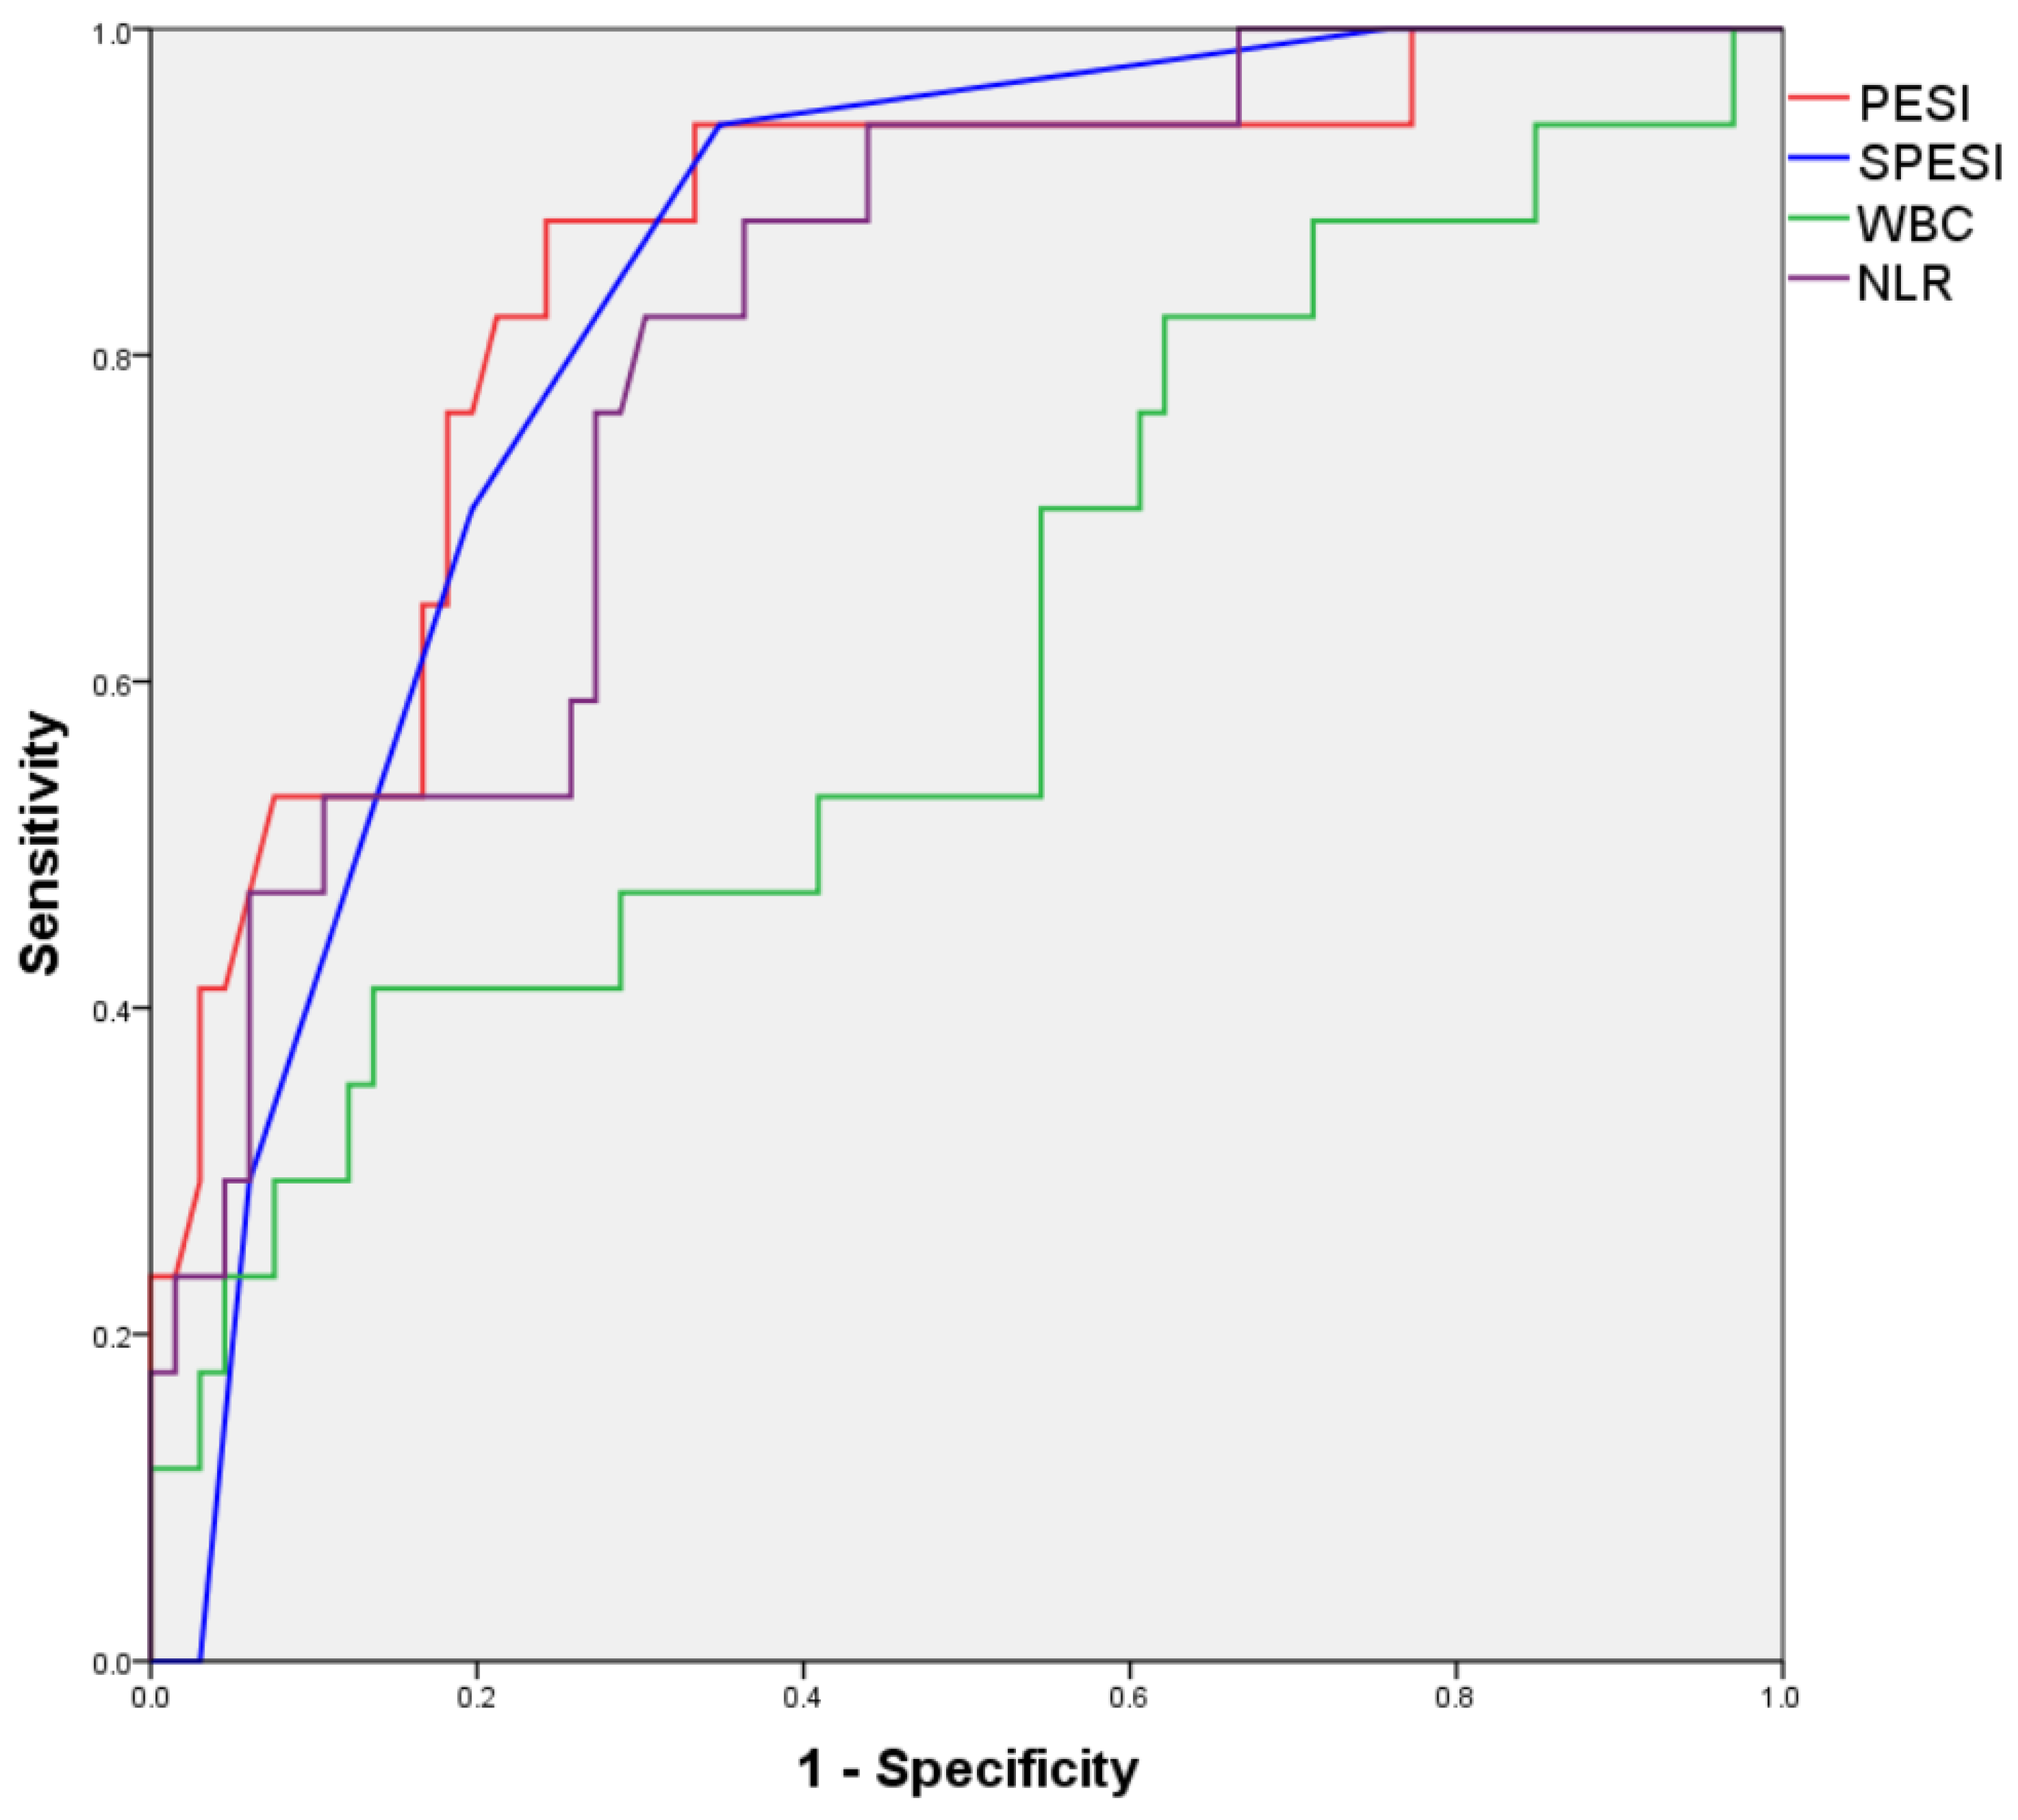
| Variable | Area under ROC Curve |
|---|---|
| NLR | 0.853 |
| WBC Count | 0.714 |
| SPESI | 0.814 |
| PESI | 0.812 |
| Variable | Area under ROC Curve |
|---|---|
| NLR | 0.812 |
| WBC Count | 0.618 |
| SPESI | 0.837 |
| PESI | 0.856 |
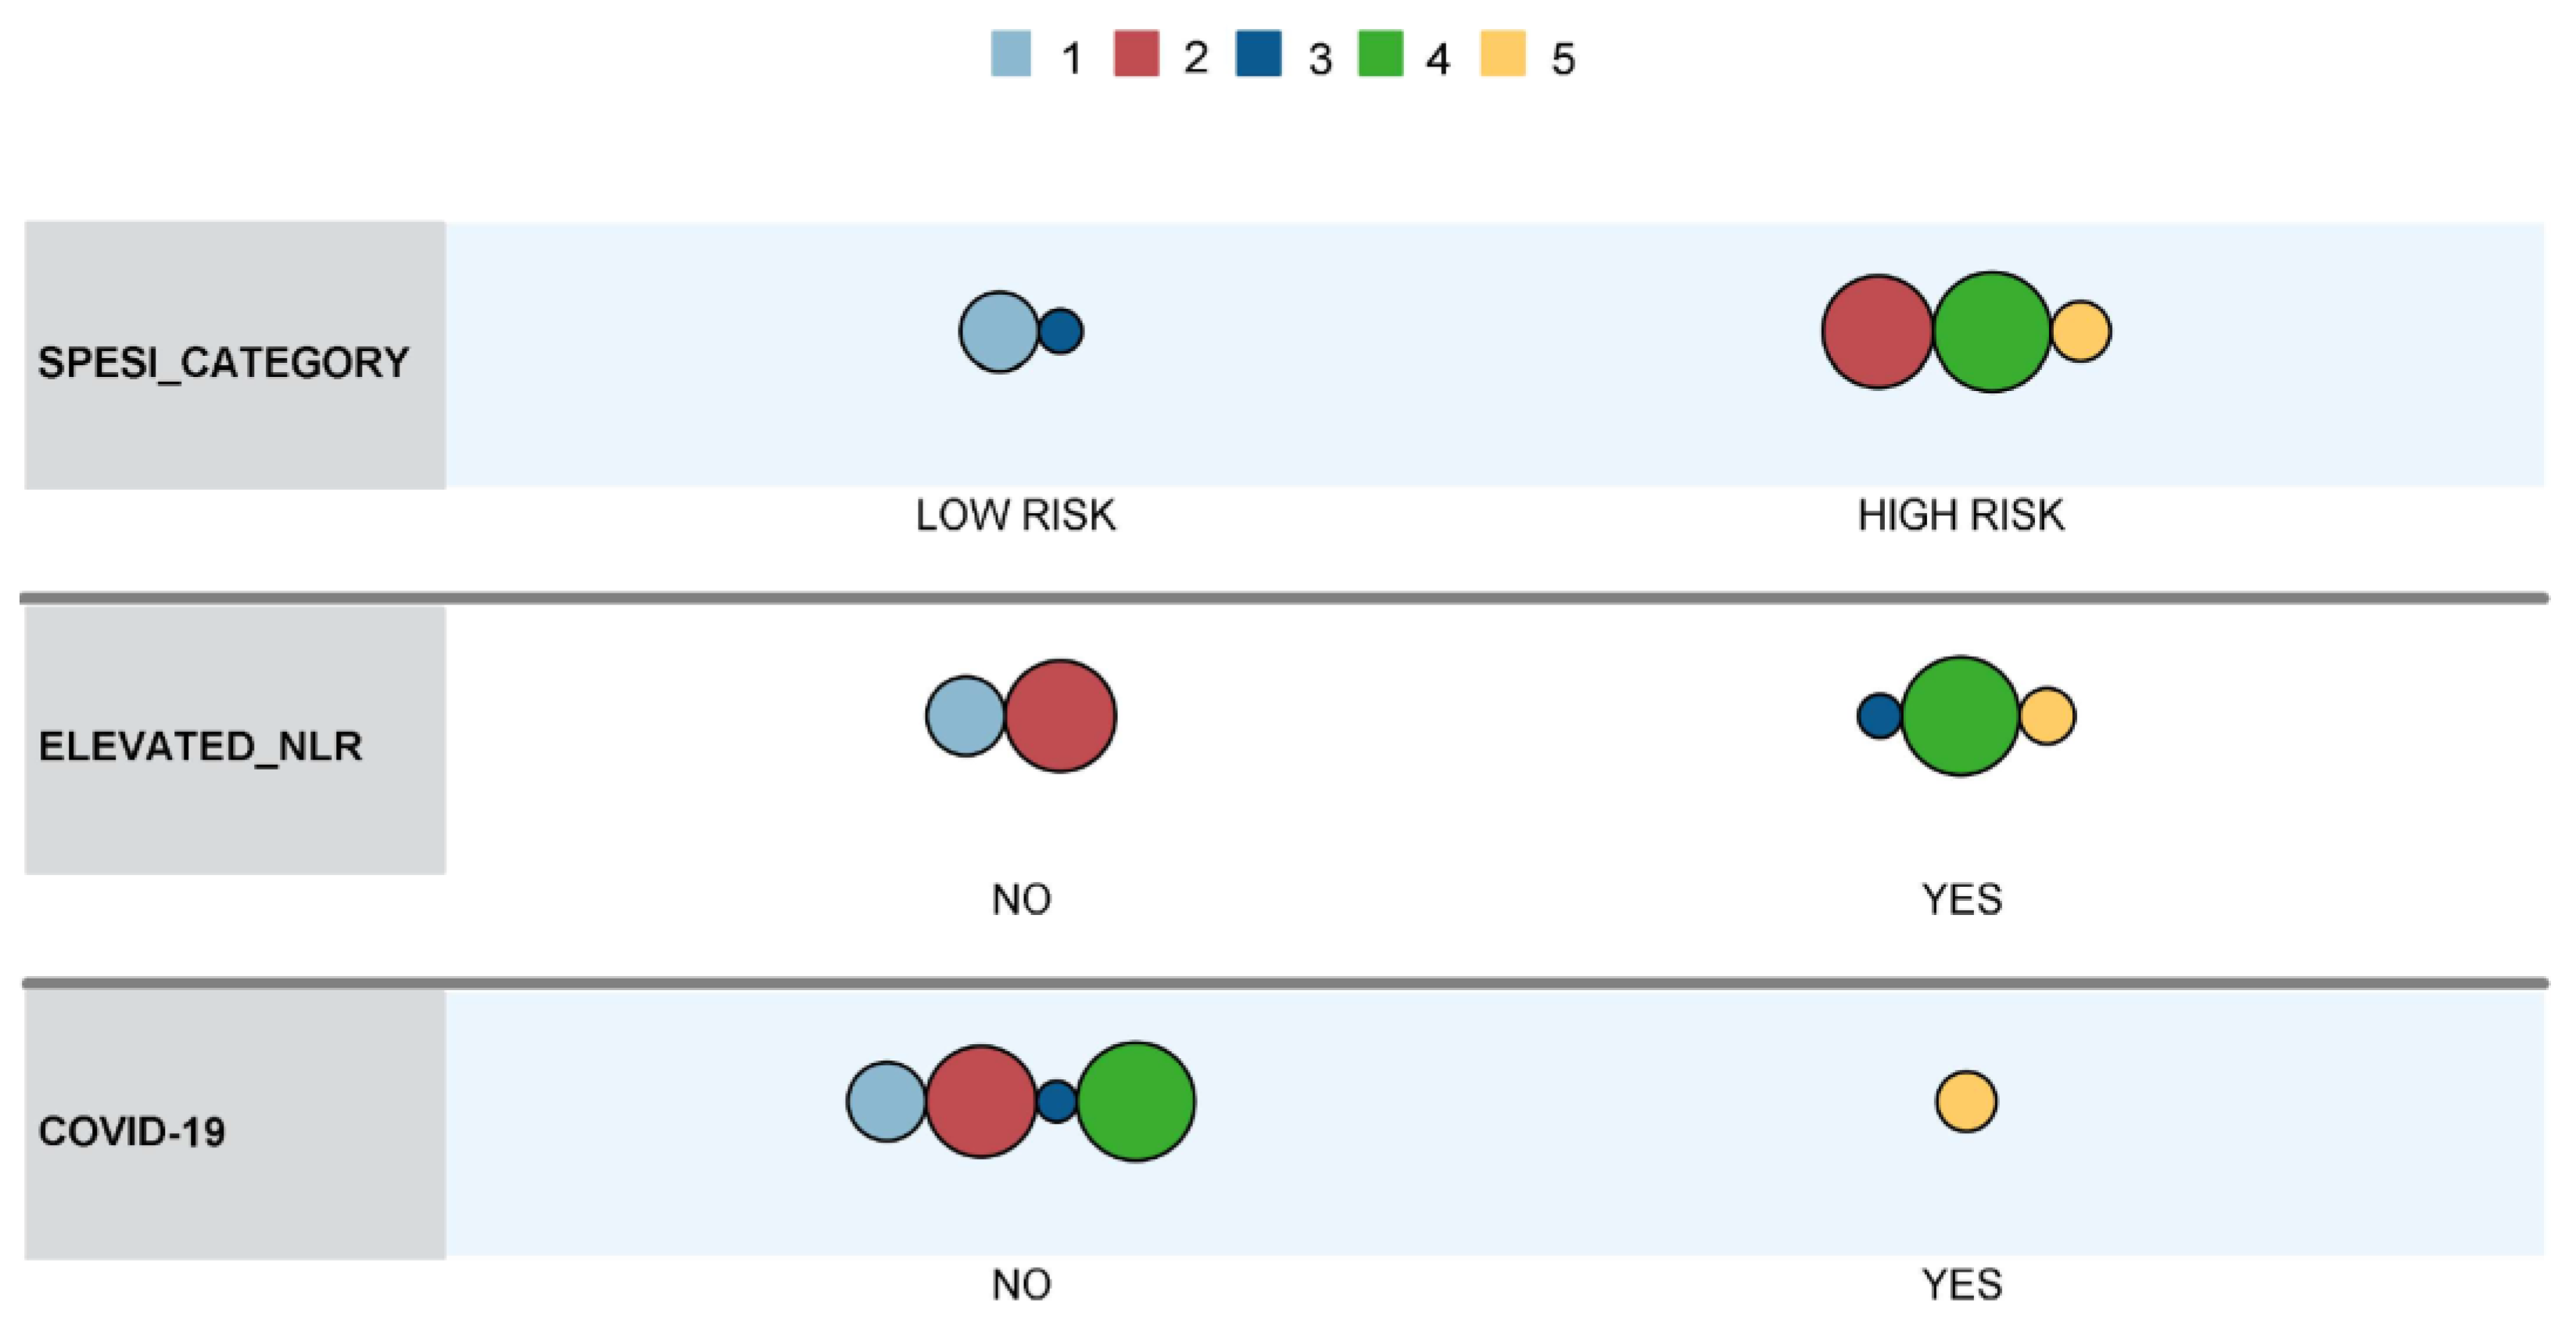
| Variable | Category | Cluster 1 | Cluster 2 | Cluster 3 | Cluster 4 | Cluster 5 | Predictor Importance |
|---|---|---|---|---|---|---|---|
| Count (% of total) | - | 26 (16.2%) | 52 (32.5%) | 8 (5%) | 59 (36.9%) | 15 (9.4%) | - |
| SPESI category | Low risk | 26 (100%) | 0 (0%) | 8 (100%) | 0 (0%) | 0 (0%) | 1.0 |
| High risk | 0 (0%) | 52 (100%) | 0 (0%) | 59 (100%) | 15 (100%) | ||
| Elevated NLR (>3.7) | No | 26 (100%) | 52 (100%) | 0 (0%) | 0 (0%) | 2 (13.3%) | 0.95 |
| Yes | 0 (0%) | 0 (0%) | 8 (100%) | 59 (100%) | 13 (86.7%) | ||
| COVID-19 | No | 26 (100%) | 52 (100%) | 7 (87.5%) | 59 (100%) | 0 (0%) | 0.94 |
| Yes | 0 (0%) | 0 (0%) | 1 (12.5%) | 0 (0%) | 15 (100%) |
| Variable | Category | Cluster 1a | Cluster 2a | Cluster 3a | Cluster 4a | Predictor Importance |
|---|---|---|---|---|---|---|
| Count (% of total) | - | 16 (19.3%) | 28 (33.7%) | 30 (36.1%) | 9 (10.8%) | - |
| sPESI category | Low-risk | 16 (100%) | 0 (0%) | 0 (0%) | 0 (0%) | 1 |
| High-risk | 0 (0%) | 28 (100%) | 30 (100%) | 9 (100%) | ||
| Elevated NLR (>4.69) | No | 13 (81.3%) | 28 (100%) | 0 (0%) | 1 (11.1%) | 0.83 |
| Yes | 3 (18.8%) | 0 (0%) | 30 (100%) | 8 (88.9%) | ||
| COVID-19 | No | 16 (100%) | 28 (100%) | 30 (100%) | 0 (0%) | 1 |
| Yes | 0 (0%) | 0 (0%) | 0 (0%) | 9 (100%) |
Disclaimer/Publisher’s Note: The statements, opinions and data contained in all publications are solely those of the individual author(s) and contributor(s) and not of MDPI and/or the editor(s). MDPI and/or the editor(s) disclaim responsibility for any injury to people or property resulting from any ideas, methods, instructions or products referred to in the content. |
© 2024 by the authors. Licensee MDPI, Basel, Switzerland. This article is an open access article distributed under the terms and conditions of the Creative Commons Attribution (CC BY) license (https://creativecommons.org/licenses/by/4.0/).
Share and Cite
Teodoru, M.; Negrea, M.O.; Cozgarea, A.; Cozma, D.; Boicean, A. Enhancing Pulmonary Embolism Mortality Risk Stratification Using Machine Learning: The Role of the Neutrophil-to-Lymphocyte Ratio. J. Clin. Med. 2024, 13, 1191. https://doi.org/10.3390/jcm13051191
Teodoru M, Negrea MO, Cozgarea A, Cozma D, Boicean A. Enhancing Pulmonary Embolism Mortality Risk Stratification Using Machine Learning: The Role of the Neutrophil-to-Lymphocyte Ratio. Journal of Clinical Medicine. 2024; 13(5):1191. https://doi.org/10.3390/jcm13051191
Chicago/Turabian StyleTeodoru, Minodora, Mihai Octavian Negrea, Andreea Cozgarea, Dragoș Cozma, and Adrian Boicean. 2024. "Enhancing Pulmonary Embolism Mortality Risk Stratification Using Machine Learning: The Role of the Neutrophil-to-Lymphocyte Ratio" Journal of Clinical Medicine 13, no. 5: 1191. https://doi.org/10.3390/jcm13051191
APA StyleTeodoru, M., Negrea, M. O., Cozgarea, A., Cozma, D., & Boicean, A. (2024). Enhancing Pulmonary Embolism Mortality Risk Stratification Using Machine Learning: The Role of the Neutrophil-to-Lymphocyte Ratio. Journal of Clinical Medicine, 13(5), 1191. https://doi.org/10.3390/jcm13051191