

CLR (C-Reactive Protein to Lymphocyte Ratio) Served as a Promising Predictive Biomarker for Cerebral Vasospasm in Aneurysmal Subarachnoid Hemorrhage (aSAH): A Retrospective Cohort Study


 , ,
, , 
Abstract
1. Introduction
2. Methods
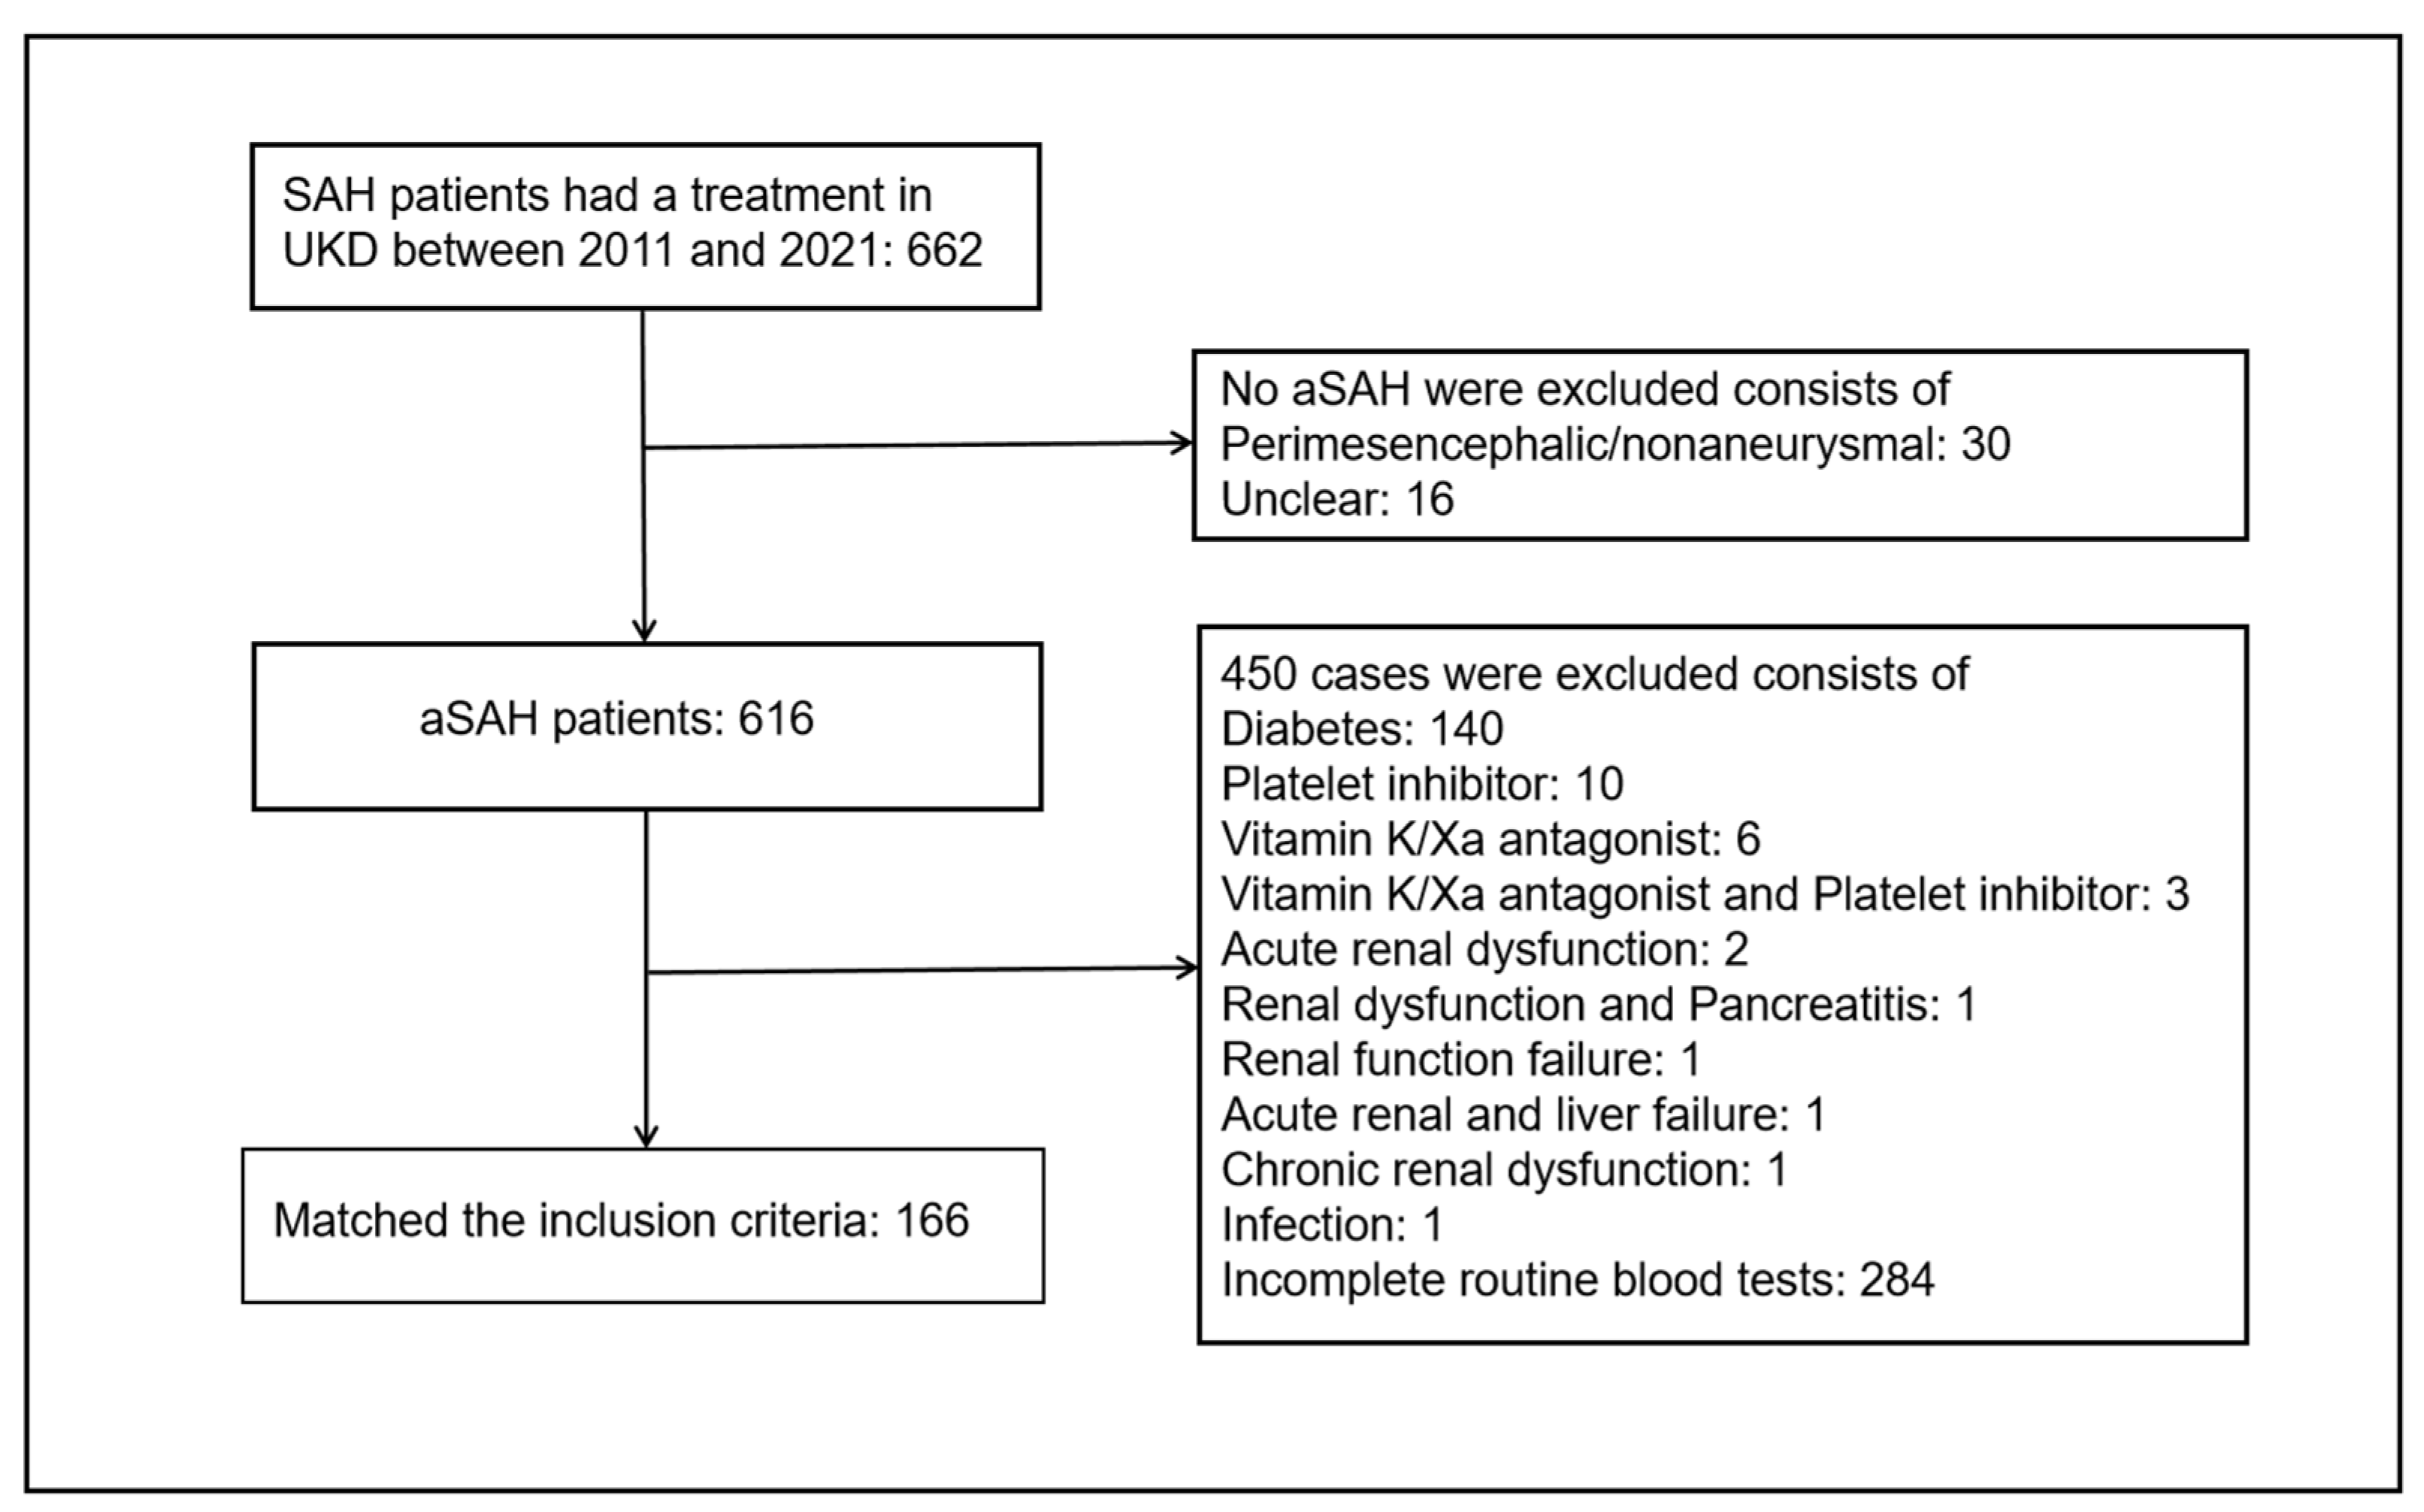
2.1. Study Design
2.2. Clinical Data Collection and Neurological Complication Evaluation
2.3. Admission Serum Biomarker Collection
2.4. Statistical Analysis
3. Results
3.1. Baseline Characteristics
3.2. Univariate Analysis on CVS, mRS (Good 0–2 vs. Poor 3–6), DCI, and CH after aSAH
3.3. Multivariate Logistic Analysis of Risk Factors for Poor Outcome (6 Months mRS 3–6), CVS, DCI, and CH
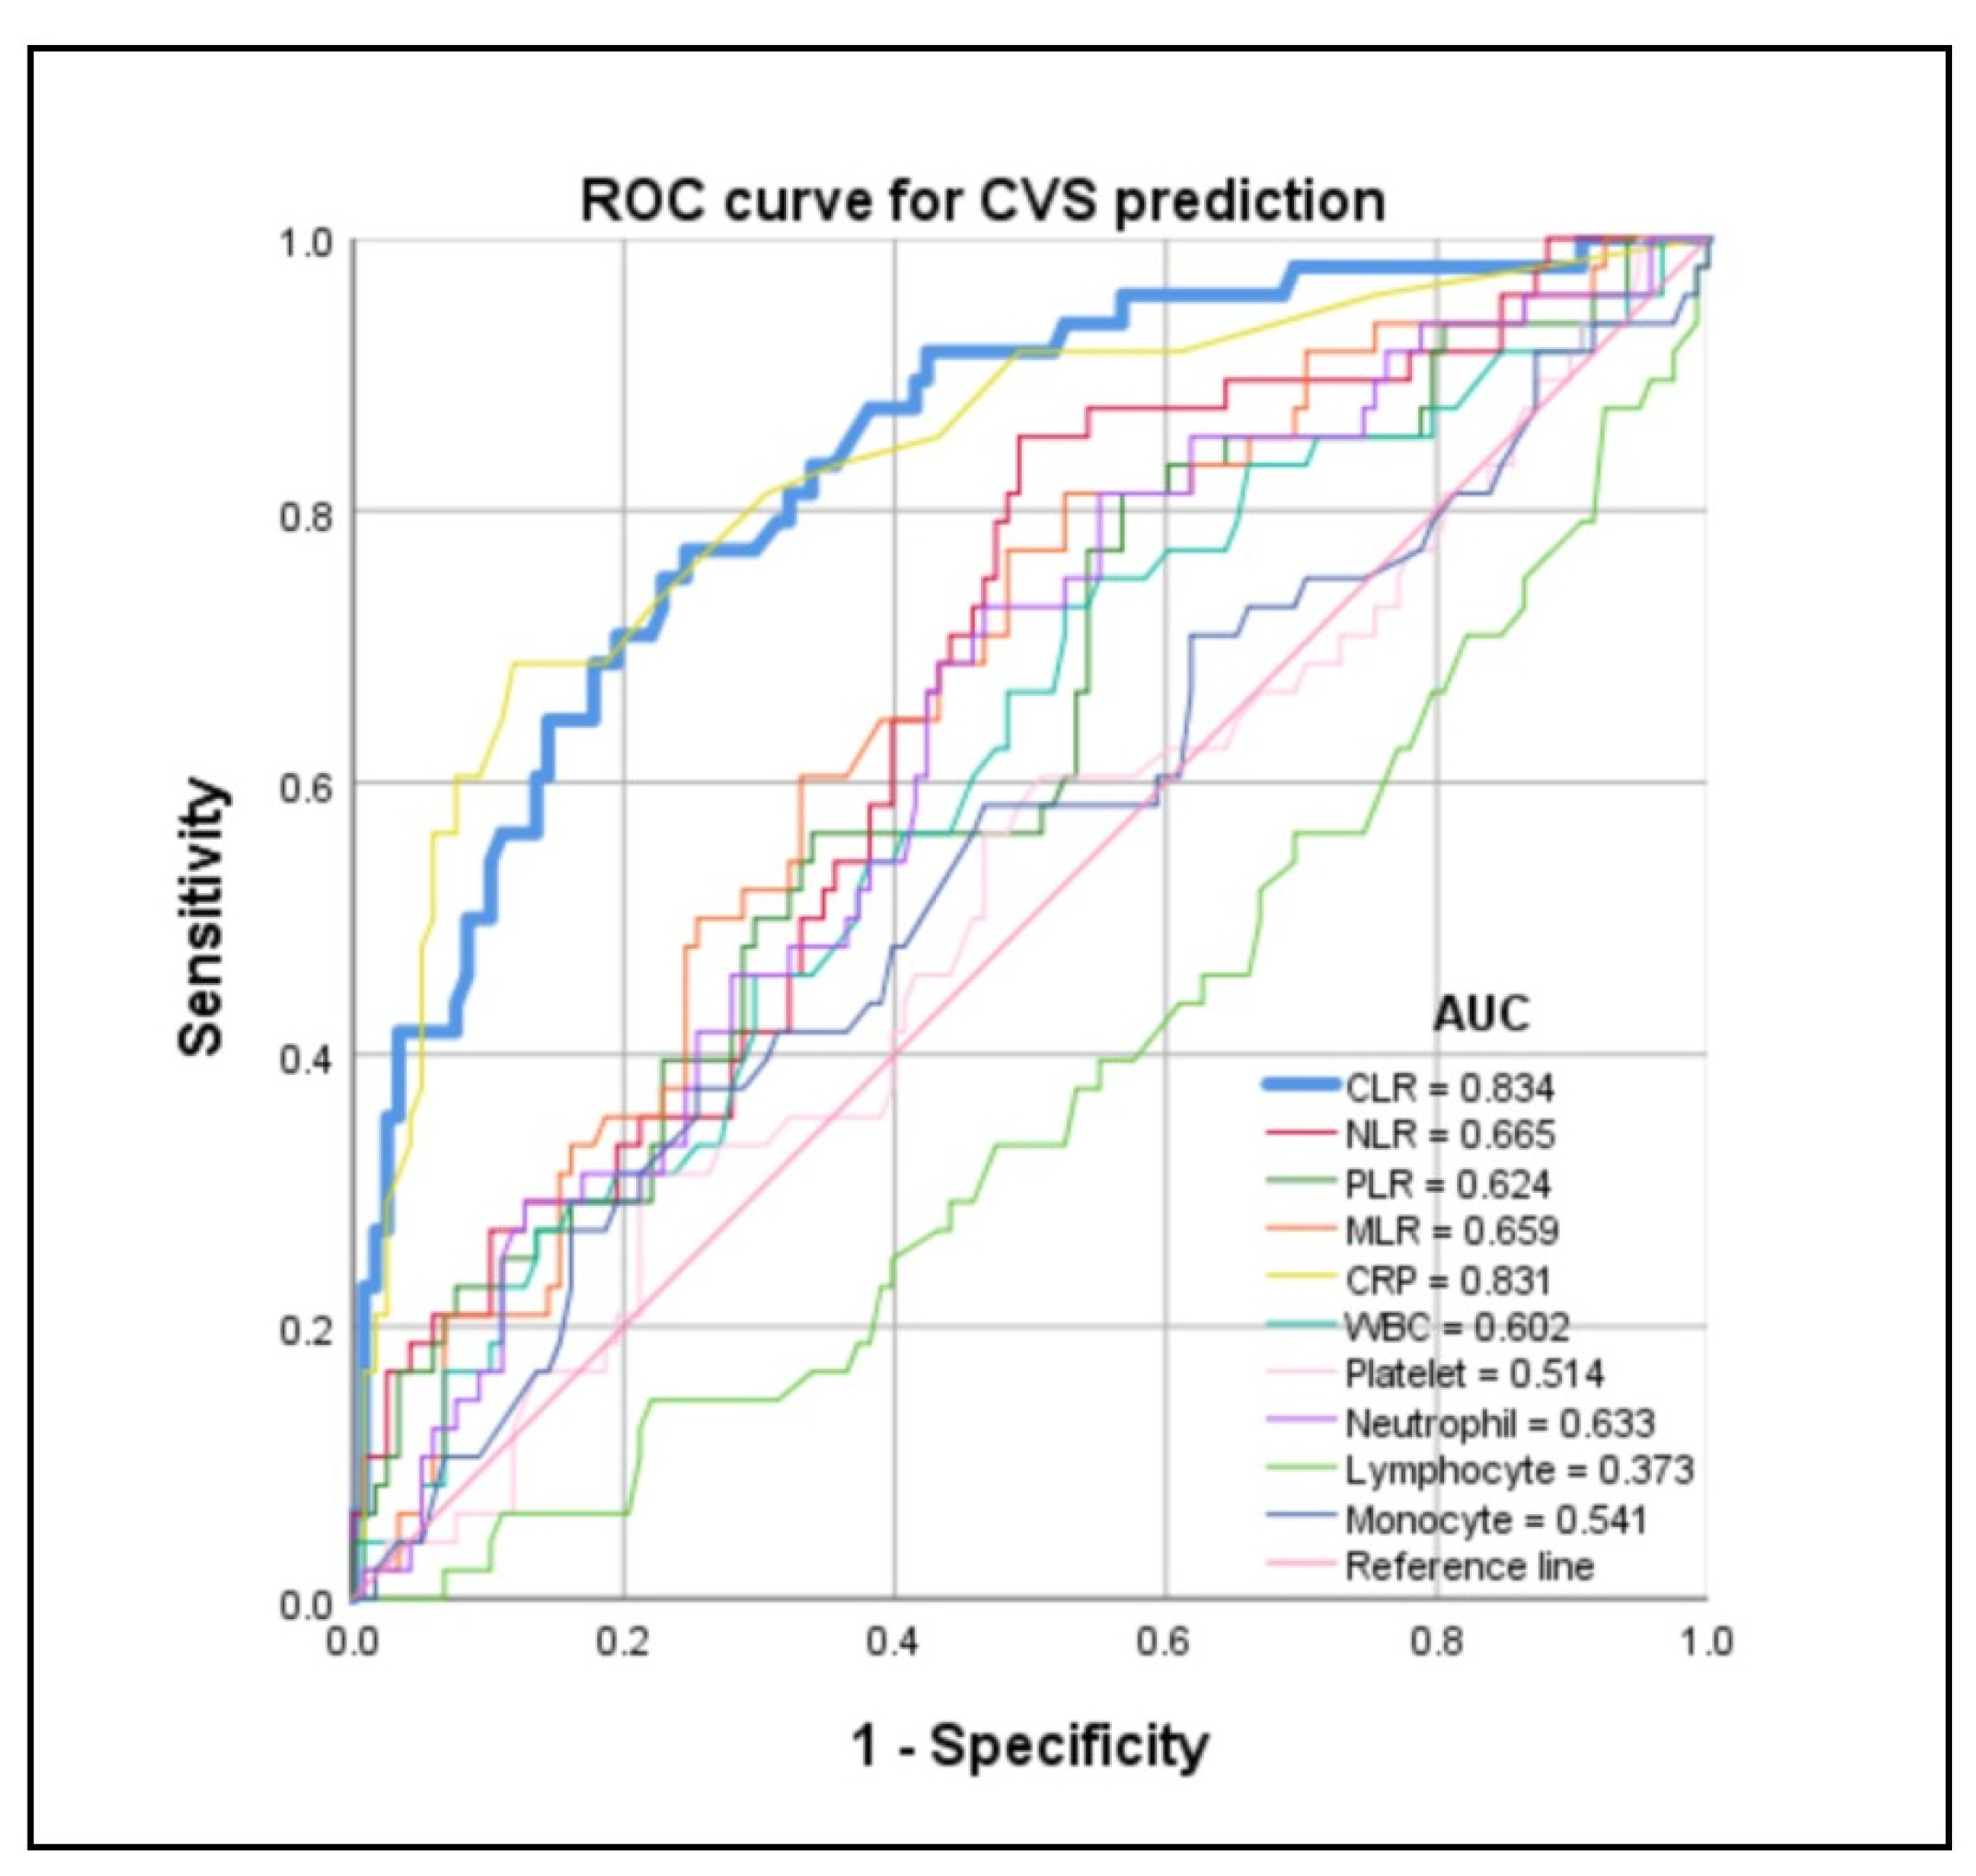
3.4. Predictive Value of CLR for CVS, DCI, Poor Outcome (6 Months mRS 3–6), and CH after aSAH
4. Discussion
5. Limitations
6. Conclusions
Supplementary Materials
Author Contributions
Funding
Institutional Review Board Statement
Informed Consent Statement
Data Availability Statement
Acknowledgments
Conflicts of Interest
Abbreviations
References
- Chung, D.Y.; Abdalkader, M.; Nguyen, T.N. Aneurysmal Subarachnoid Hemorrhage. Neurol. Clin. 2021, 39, 419–442. [Google Scholar] [CrossRef] [PubMed]
- Feigin, V.L.; Lawes, C.M.M.; Bennett, D.A.; Barker-Collo, S.L.; Parag, V. Worldwide stroke incidence and early case fatality reported in 56 population-based studies: A systematic review. Lancet Neurol. 2009, 8, 355–369. [Google Scholar] [CrossRef] [PubMed]
- Macdonald, R.L. Delay neurological deterioration after subarachnoid hemorrhage. Nat. Rev. Neurol. 2014, 10, 44–58. [Google Scholar] [CrossRef] [PubMed]
- Rosengart, A.J.; Schultheiss, K.E.; Tolentino, J.; Macdonald, R.L. Prognostic factors for outcome in patients with aneurysmal subarachnoid hemorrhage. Stroke 2007, 38, 2315–2321. [Google Scholar] [CrossRef] [PubMed]
- Connolly, E.S., Jr.; Rabinstein, A.A.; Carhuapoma, J.R.; Derdeyn, C.P.; Dion, J.; Higashida, R.T.; Hoh, B.L.; Kirkness, C.J.; Naidech, A.M.; Ogilvy, C.S.; et al. Guideline for the management of aneurysmal subarachnoid hemorrhage: A guideline for healthcare professionals from the American Heart Association/American Stroke Association. Stroke 2012, 43, 1711–1737. [Google Scholar] [CrossRef] [PubMed]
- Gallissot, F.; Lenfant, M.; Thouant, P.; Haioun, K.; Thay, A.; Ricolfi, F.; Comby, P.O. Temporal averaging angiographic reconstructions from whole-brain CT perfusion for the detection of vasospasm. J. Neuroradiol. 2023, 50, 333–340. [Google Scholar] [CrossRef] [PubMed]
- Crowley, R.W.; Medel, R.; Dumont, A.S.; Ilodigwe, D.; Kassell, N.F.; Mayer, S.A.; Ruefenacht, D.; Schmiedek, P.; Weidauer, S.; Pasqualin, A.; et al. Angiographic vasospasm is strongly correlated with cerebral infarction after subarachnoid hemorrhage. Stroke 2011, 42, 919–923. [Google Scholar] [CrossRef] [PubMed]
- Hakim, C.A.; Hakim, R.; Hakim, S. Normal-pressure hydrocephalus. Neurosurg. Clin. N. Am. 2001, 12, 761–773, ix. [Google Scholar] [CrossRef]
- Akinduro, O.O.; Vivas-Buitrago, T.G.; Haranhalli, N.; Ganaha, S.; Mbabuike, N.; Turnbull, M.T.; Tawk, R.G.; Freeman, W.D. Predictors of ventriculoperitoneal shunting following subarachnoid hemorrhage treated with external ventricular drainage. Neurocrit. Care 2020, 32, 755–764. [Google Scholar] [CrossRef]
- Giede-Jeppe, A.; Reichl, J.; Sprügel, M.I.; Lücking, H.; Hoelter, P.; Eyüpoglu, I.Y.; Kuramatsu, J.B.; Huttner, H.B.; Gerner, S.T. Neutrophil-to-lymphocyte ratio as an independent predictors for unfavorable functional outcome in aneurysmal subarachnoid hemorrhage. J. Neurosurg. 2019, 132, 400–407. [Google Scholar] [CrossRef]
- Zhang, Y.; Li, L.; Jia, L.; Li, T.; Di, Y.; Wang, P.; Deng, H.; Fan, H.; Li, Y.; Cheng, X.; et al. Neutrophil Counts as Promising Marker for Predicting In-Hospital Mortality in Aneurysmal Subarachnoid Hemorrhage. Stroke 2021, 52, 3266–3275. [Google Scholar] [CrossRef]
- Alessandro, O.; Rene, W.; Stefan, W.; Miodrag, F.; Martin, S.; Oliver, B.; Urs, P. C-reactive protein elevation predicts in-hospital deterioration after aneurysmal subarachnoid hemorrhage: A retrospective observational study. Acta Neurochir. 2022, 164, 1805–1814. [Google Scholar] [CrossRef]
- Zhang, W.; Wang, Y.; Zhang, Q.; Hou, F.; Wang, L.; Zheng, Z.; Guo, Y.; Chen, Z.; Hernesniemi, J.; Feng, G.; et al. Prognostic significance of white blood cell to platelet ratio in delayed cerebral ischemia and long-term clinical outcome after aneurysmal subarachnoid hemorrhage. Front. Neurol. 2023, 14, 1180178. [Google Scholar] [CrossRef]
- Zhang, Q.; Zhang, G.; Wang, L.; Zhang, W.; Hou, F.; Zheng, Z.; Guo, Y.; Chen, Z.; Hernesniemi, J.; Andrade-Barazarte, H.; et al. Clinical value and prognosis of C reactive protein to lymphocyte ratio in severe aneurysmal subarachnoid hemorrhage. Front. Neurol. 2022, 13, 868764. [Google Scholar] [CrossRef]
- Chaudhry, S.R.; Güresir, A.; Stoffel-Wagner, B.; Fimmers, R.; Kinfe, T.M.; Dietrich, D.; Lamprecht, A.; Vatter, H.; Güresir, E.; Muhammad, S. Systemic High-Mobility Group Box-1: A novel predictive biomarker for cerebral vasospasm in aneurysmal subarachnoid hemorrhage. Crit. Care Med. 2018, 46, e1023–e1028. [Google Scholar] [CrossRef]
- Frontera, J.A.; Fernandez, A.; Schmidt, J.M.; Claassen, J.; Wartenberg, K.E.; Badjatia, N.; Connolly, E.S.; Mayer, S.A. Defining vasospasm after subarachnoid hemorrhage: What is the most clinically relevant definition? Stroke 2009, 40, 1963–1968. [Google Scholar] [CrossRef]
- Vergouwen, M.D.I.; Vermeulen, M.; van Gijn, J.; Rinkel, G.J.E.; Wijdicks, E.F.; Muizelaar, J.P.; Mendelow, A.D.; Juvela, S.; Yonas, H.; Terbrugge, K.G.; et al. Definition of delayed cerebral ischemia after aneurysmal subarachnoid hemorrhage as an outcome event in clinical trials and observational studies: Proposal of a multidisciplinary research group. Stroke 2010, 41, 2391–2395. [Google Scholar] [CrossRef]
- Toma, A.K.; Holl, E.; Kitchen, N.D.; Watkins, L.D. Evans’ index revisited: The need for an alternative in normal pressure hydrocephalus. Neurosurgery 2011, 68, 939–944. [Google Scholar] [CrossRef] [PubMed]
- Semmelmann, A.; Baar, W.; Fellmann, N.; Isabelle Moneke, I.; Loop, T. The Impact of Postoperative Pulmonary Complications on Perioperative Outcomes in Patients Undergoing Pneumonectomy: A Multicenter Retrospective Cohort Study of the German Thorax Registry. J. Clin. Med. 2023, 13, 35. [Google Scholar] [CrossRef] [PubMed]
- Gaastra, B.; Barron, P.; Newitt, L.; Chhugani, S.; Turner, C.; Kirkpatrick, P.; MacArthur, B.; Galea, I.; Bulters, D. CRP (C-Reactive Protein) in outcome prediction after subarachnoid hemorrhage and the role of machine learning. Stroke 2021, 52, 3276–3285. [Google Scholar] [CrossRef] [PubMed]
- MacLeod, C.M.; Avery, O.T. The occurrence during acute infections of g protein not normally present in the blood. II Isolation and properties of the reactive protein. J. Exp. Med. 1941, 73, 183–190. [Google Scholar] [CrossRef]
- Fountas, K.N.; Tasiou, A.; Kapsalaki, E.Z.; Paterakis, K.N.; Grigorian, A.A.; Lee, G.P.; Robinson, J.S., Jr. Serum and cerebrospinal fluid C-reactive protein levels as predictors of vasospasm in aneurysmal subarachnoid hemorrhage. Clinical article. Neurosurg. Focus. 2009, 26, E22. [Google Scholar] [CrossRef]
- Kushner, I. The phenomenon of the acute phase response. Ann. N. Y. Acad. Sci. 1982, 389, 39–48. [Google Scholar] [CrossRef] [PubMed]
- Pathak, A.; Agrawal, A. Evolution of C-Reactive Protein. Front. Immunol. 2019, 10, 943. [Google Scholar] [CrossRef] [PubMed]
- Takizawa, T.; Tada, T.; Kitazawa, K.; Tanaka, Y.; Hongo, K.; Kameko, M.; Uemura, K.I. Inflammatory cytokine cascade released by leukocytes in cerebrospinal fluid after subarachnoid hemorrhage. Neurol. Res. 2001, 23, 724–730. [Google Scholar] [CrossRef] [PubMed]
- Romero, F.R.; Cataneo, D.C.; Cataneo, A.J.M. C-reactive protein and vasospasm after aneurysmal subarachnoid hemorrhage. Acta Cir. Bras. 2014, 29, 340–345. [Google Scholar] [CrossRef] [PubMed]
- Meisel, C.; Schwab, J.M.; Prass, K.; Meisel, A.; Dirnagl, U. Central nervous system injury-induced immune deficiency syndrome. Nat. Rev. Neurosci. 2005, 6, 775–786. [Google Scholar] [CrossRef] [PubMed]
- Frösen, J.; Piippo, A.; Paetau, A.; Kangasniemi, M.; Niemelä, M.; Hernesniemi, J.; Jääskeläinen, J. Remodeling of saccular cerebral artery aneurysm wall is associated with rupture: Histological analysis of 24 unruptured and 42 ruptured cases. Stroke 2004, 35, 2287–2293. [Google Scholar] [CrossRef] [PubMed]
- Yildirim, M.; Dasiran, F.; Angin, Y.S.; Okan, I. Lymphocyte-C-reactive protein ratio: A putative predictive factor for intestinal ischemia in strangulated abdominal wall hernias. Hernia 2021, 25, 733–739. [Google Scholar] [CrossRef] [PubMed]
- Fan, Z.Y.; Luo, G.P.; Gong, Y.; Liu, C.; Yu, X.J. ASO Author reflections: C-reactive protein/lymphocyte ratio as a promising marker for predicting survival in pancreatic cancer. Ann. Surg. Oncol. 2020, 27, 4026–4027. [Google Scholar] [CrossRef]
- Okugawa, Y.; Toiyama, Y.; Yamamoto, A.; Shigemori, T.; Ide, S.; Kitajima, T.; Fujikawa, H.; Yasuda, H.; Hiro, J.; Yoshiyama, S.; et al. Lymphocyte-C-reactive protein ratio as promising new marker for predicting surgical and oncological outcomes in colorectal cancer. Ann. Surg. 2020, 272, 342–351. [Google Scholar] [CrossRef]
- Neary, C.; McAnena, P.; McAnena, O.; Kerin, M.; Collins, C. C-reactive protein-lymphocyte ratio identifies patients at low risk for major morbidity after oesophagogastric resection for cancer. Dig. Surg. 2020, 37, 515–523. [Google Scholar] [CrossRef]
- Mantovani, A.; Allavena, P.; Sica, A.; Balkwill, F. Cancer-related inflammation. Nature 2008, 454, 436–444. [Google Scholar] [CrossRef]
- Mahta, A.; Azher, A.I.; Moody, S.; Spinney, M.; Andrews, N.; Chen, J.; Dakay, K.B.; Dai, X.; Reznik, M.E.; Thompson, B.B.; et al. Association of early white blood cell trend with outcomes in aneurysmal subarachnoid hemorrhage. World Neurosurg. 2021, 151, e803–e809. [Google Scholar] [CrossRef] [PubMed]
- Geraghty, J.R.; Lung, T.J.; Hirsch, Y.; Katz, E.A.; Cheng, T.; Saini, N.S.; Pandey, D.K.; Testai, F.D. Systemic Immune-Inflammation index predicts delayed cerebral vasospasm after aneurysmal subarachnoid hemorrhage. Neurosurgery 2021, 89, 1071–1079. [Google Scholar] [CrossRef] [PubMed]
- Hu, P.; Yang, X.; Li, Y.T.; Deng, G.; Xu, Y.; Ye, L.; Qi, Y.; Zong, Z.; Chen, Q. Predictive effects of admission white blood cell counts and hounsfield values on delayed cerebral ischemia after aneurysmal subarachnoid hemorrhage. Clin. Neurol. Neurosurg. 2022, 212, 107087. [Google Scholar] [CrossRef] [PubMed]
- Koupenova, M.; Clancy, L.; Corkrey, H.A.; Freedman, J.E. Circulating platelets as mediators of immunity, inflammation, and thrombosis. Circ. Res. 2018, 122, 337–351. [Google Scholar] [CrossRef] [PubMed]
- Wang, X.T.; Xu, Y.H. Platelet-to-serum Ca2+ ratio as a risk factor for postoperative cerebral vasospasm in surgically treated aneurysmal subarachnoid hemorrhage patients. Eur. Rev. Med. Pharmacol. Sci. 2022, 26, 1439–1449. [Google Scholar]


| Variables | Patients (n = 166) |
|---|---|
| Demographics | |
| Age, mean (SD), y | 55.58 ± 12.22 |
| Female sex, n (%) | 114 (68.7) |
| Medical history, n (%) | |
| Hypertension | 117 (70.5) |
| Admission status, median (IQR) | |
| WFNS grade | 2 (1–5) |
| GCS score | 13 (4–15) |
| Admission serum biomarkers, median (IQR) | |
| CRP, (mg/dL) | 0.50 (0.20–1.40) |
| WBC, (×109/L) | 13.35 (10.58–15.90) |
| Platelet, (×109/L) | 230.50 (196.75–278.25) |
| Neutrophil, (×109/L) | 11.17 (8.52–14.00) |
| Lymphocyte, (×109/L) | 1.05 (0.74–1.60) |
| Monocyte, (×109/L) | 0.78 (0.50–1.00) |
| CLR, (mg × 10−6) | 0.50 (0.17–1.56) |
| NLR | 11.00 (6.24–16.74) |
| PLR | 218.87 (143.57–323.11) |
| MLR | 0.63 (0.43–0.90) |
| Neuroradiological data | |
| mFisher score, median (IQR) | 4 (3–4) |
| Intracerebral hemorrhage, n (%) | 37 (22.3) |
| Subdural hemorrhage, n (%) | 14 (8.4) |
| Aneurysmal locations, n (%) | |
| ACA/ACOM | 77 (46.4) |
| MCA | 38 (22.9) |
| PCOM | 19 (11.4) |
| ICA | 9 (5.4) |
| PC | 23 (13.9) |
| Aneurysmal sizes, n (%) | |
| 0–4.9 mm | 49 (29.5) |
| 5–6.9 mm | 46 (27.7) |
| 7–9.9 mm | 21 (12.7) |
| 10–19.9 mm | 19 (11.4) |
| ≥20 mm | 6 (3.6) |
| Missing | 25 (15.1) |
| Treatment status, n (%) | |
| Coil | 46 (27.7) |
| Clip | 114 (68.7) |
| No treatment | 6 (3.6) |
| Neurological complications, n (%) | |
| CVS | 48 (28.9) |
| DCI | 53 (31.9) |
| CH | 88 (53.0) |
| Seizures | 23 (13.9) |
| Neurological functional outcome | |
| 6 months mRS, median (IQR) | 3 (1–5) |
| Variables | CVS (n = 48) | Non-CVS (n = 118) | p Value |
|---|---|---|---|
| Demographics | |||
| Age, mean (SD), y | 57.60 ± 10.40 | 54.75 ± 12.83 | 0.174 |
| Female sex, n (%) | 33 (68.8) | 81 (68.6) | 0.989 |
| Medical history, n (%) | |||
| Hypertension | 37 (77.1) | 80 (67.8) | 0.234 |
| Admission status, median (IQR) | |||
| WFNS grade | 3 (2–5) | 2 (1–5) | 0.018 * |
| GCS score | 11 (3–14) | 14 (5–15) | 0.016 * |
| Admission serum biomarkers, median (IQR) | |||
| CRP, (mg/dL) | 1.95 (0.80–3.10) | 0.30 (0.18–0.80) | <0.001 * |
| WBC, (×109/L) | 14.05 (11.68–18.33) | 12.60 (10.10–15.70) | 0.040 * |
| Platelet, (×109/L) | 237.00 (194.25–284.50) | 226.00 (199.25–274.25) | 0.781 |
| Neutrophil, (×109/L) | 11.95 (10.05–15.95) | 10.49 (7.88–13.49) | 0.007 * |
| Lymphocyte, (×109/L) | 0.93 (0.60–1.32) | 1.17 (0.80–1.62) | 0.010 * |
| Monocyte, (×109/L) | 0.80 (0.52–1.18) | 0.73 (0.50–1.00) | 0.404 |
| CLR, (mg × 10−6) | 1.83 (0.77–4.46) | 0.30 (0.12–0.76) | <0.001 * |
| NLR | 12.90 (9.80–20.59) | 8.74 (5.54–15.97) | 0.001 * |
| PLR | 262.08 (189.38–397.88) | 215.88 (135.60–294.97) | 0.012 * |
| MLR | 0.74 (0.59–1.11) | 0.58 (0.39–0.77) | 0.001 * |
| Neuroradiological data | |||
| mFisher score, median (IQR) | 4 (3–4) 3.56 ± 0.65 | 4 (3–4) 3.43 ± 0.63 | 0.151 |
| Intracerebral hemorrhage, n (%) | 12 (25.0) | 25 (21.2) | 0.592 |
| Subdural hemorrhage, n (%) | 3 (6.3) | 11 (9.3) | 0.736 |
| Aneurysmal locations, n (%) | 0.248 | ||
| ACA/ACOM | 19 (39.6) | 58 (49.2) | |
| MCA | 9 (18.8) | 29 (24.6) | |
| PCOM | 9 (18.8) | 10 (8.5) | |
| ICA | 2 (4.2) | 7 (5.9) | |
| PC | 9 (18.8) | 14 (11.9) | |
| Aneurysmal sizes, n (%) | 0.282 | ||
| 0–4.9 mm | 13 (27.1) | 36 (30.5) | |
| 5–6.9 mm | 11 (22.9) | 35 (29.7) | |
| 7–9.9 mm | 4 (8.3) | 17 (14.4) | |
| 10–19.9 mm | 9 (18.8) | 10 (8.5) | |
| ≥20 mm | 3 (6.3) | 3 (2.5) | |
| Missing | 8 (16.7) | 17 (14.4) | |
| Treatment status, n (%) | 0.903 | ||
| Coil | 14 (29.2) | 32 (27.1) | |
| Clip | 32 (66.7) | 82 (69.5) | |
| No treatment | 2 (4.2) | 4 (3.4) | |
| Neurological complications, n (%) | |||
| DCI | 27 (56.3) | 26 (22.0) | <0.001 * |
| CH | 35 (72.9) | 53 (44.9) | 0.001 * |
| Seizures | 11 (22.9) | 12 (10.2) | 0.031 * |
| Neurological functional outcome | |||
| 6 months mRS, median (IQR) | 5 (2–6) | 2 (1–5) | <0.001 * |
| Variables | CVS (n = 48) | ||
|---|---|---|---|
| OR | 95% CI | p Value | |
| CLR | 2.116 | 1.507–2.971 | <0.001 * |
| NLR | 1.007 | 0.946–1.072 | 0.830 |
| MLR | 0.843 | 0.372–1.909 | 0.682 |
| Predictive Biomarkers | AUC | 95% CI | Sensitivity (%) | Specificity (%) | Cut-Off Value | p Value |
|---|---|---|---|---|---|---|
| CLR | 0.834 | 0.767–0.901 | 77.1 | 75.4 | 0.757 mg × 10−6 | <0.001 * |
| NLR | 0.665 | 0.577–0.752 | 85.4 | 50.8 | 8.775 | 0.001 * |
| PLR | 0.624 | 0.531–0.718 | 81.3 | 43.2 | 177.312 | 0.012 * |
| MLR | 0.659 | 0.571–0.748 | 77.1 | 51.7 | 0.584 | 0.001 * |
| CRP | 0.831 | 0.758–0.903 | 68.8 | 88.1 | 1.150 mg/dL | <0.001 * |
| WBC | 0.602 | 0.508–0.697 | 72.9 | 47.5 | 12.050 × 10⁹/L | 0.040 * |
| Platelet | 0.514 | 0.416–0.612 | 31.3 | 78.8 | 280.500 × 10⁹/L | 0.781 |
| Neutrophil | 0.633 | 0.542–0.723 | 72.9 | 53.4 | 10.840 × 10⁹/L | 0.007 * |
| Lymphocyte | 0.373 | 0.280–0.465 | 100 | 0 | – | 0.010 * |
| Monocyte | 0.541 | 0.442–0.641 | 37.5 | 74.6 | 0.980 × 10⁹/L | 0.405 |
| Variables | CLR | p Value | |
|---|---|---|---|
| <0.757 mg × 10−6 (n = 100) | ≥0.757 mg × 10−6 (n = 66) | ||
| Neurological complications, n (%) | |||
| CVS | 11 (11.0) | 37 (56.1) | <0.001 * |
| DCI | 20 (20.0) | 33 (50.0) | <0.001 * |
| CH | 45 (45.0) | 43 (65.2) | 0.011 * |
| Seizures | 14 (14.0) | 9 (13.6) | 0.947 |
| Neurological functional outcome | |||
| 6 months mRS, median (IQR) | 2 (1–5) | 4 (1–6) | 0.003 * |
Disclaimer/Publisher’s Note: The statements, opinions and data contained in all publications are solely those of the individual author(s) and contributor(s) and not of MDPI and/or the editor(s). MDPI and/or the editor(s) disclaim responsibility for any injury to people or property resulting from any ideas, methods, instructions or products referred to in the content. |
© 2024 by the authors. Licensee MDPI, Basel, Switzerland. This article is an open access article distributed under the terms and conditions of the Creative Commons Attribution (CC BY) license (https://creativecommons.org/licenses/by/4.0/).
Share and Cite
Li, K.; Khan, D.; Fischer, I.; Hänggi, D.; Cornelius, J.F.; Muhammad, S. CLR (C-Reactive Protein to Lymphocyte Ratio) Served as a Promising Predictive Biomarker for Cerebral Vasospasm in Aneurysmal Subarachnoid Hemorrhage (aSAH): A Retrospective Cohort Study. J. Clin. Med. 2024, 13, 940. https://doi.org/10.3390/jcm13040940
Li K, Khan D, Fischer I, Hänggi D, Cornelius JF, Muhammad S. CLR (C-Reactive Protein to Lymphocyte Ratio) Served as a Promising Predictive Biomarker for Cerebral Vasospasm in Aneurysmal Subarachnoid Hemorrhage (aSAH): A Retrospective Cohort Study. Journal of Clinical Medicine. 2024; 13(4):940. https://doi.org/10.3390/jcm13040940
Chicago/Turabian StyleLi, Ke, Dilaware Khan, Igor Fischer, Daniel Hänggi, Jan F. Cornelius, and Sajjad Muhammad. 2024. "CLR (C-Reactive Protein to Lymphocyte Ratio) Served as a Promising Predictive Biomarker for Cerebral Vasospasm in Aneurysmal Subarachnoid Hemorrhage (aSAH): A Retrospective Cohort Study" Journal of Clinical Medicine 13, no. 4: 940. https://doi.org/10.3390/jcm13040940
APA StyleLi, K., Khan, D., Fischer, I., Hänggi, D., Cornelius, J. F., & Muhammad, S. (2024). CLR (C-Reactive Protein to Lymphocyte Ratio) Served as a Promising Predictive Biomarker for Cerebral Vasospasm in Aneurysmal Subarachnoid Hemorrhage (aSAH): A Retrospective Cohort Study. Journal of Clinical Medicine, 13(4), 940. https://doi.org/10.3390/jcm13040940