Testing the Posterior Chain: Diagnostic Accuracy of the Bunkie Test versus the Isokinetic Hamstrings/Quadriceps Measurement in Patients with Self-Reported Knee Pain and Healthy Controls

 ,
,  ,
,  and
and
Abstract
1. Introduction
2. Materials and Methods
2.1. Participants
2.2. Study Procedure
2.3. Measurement
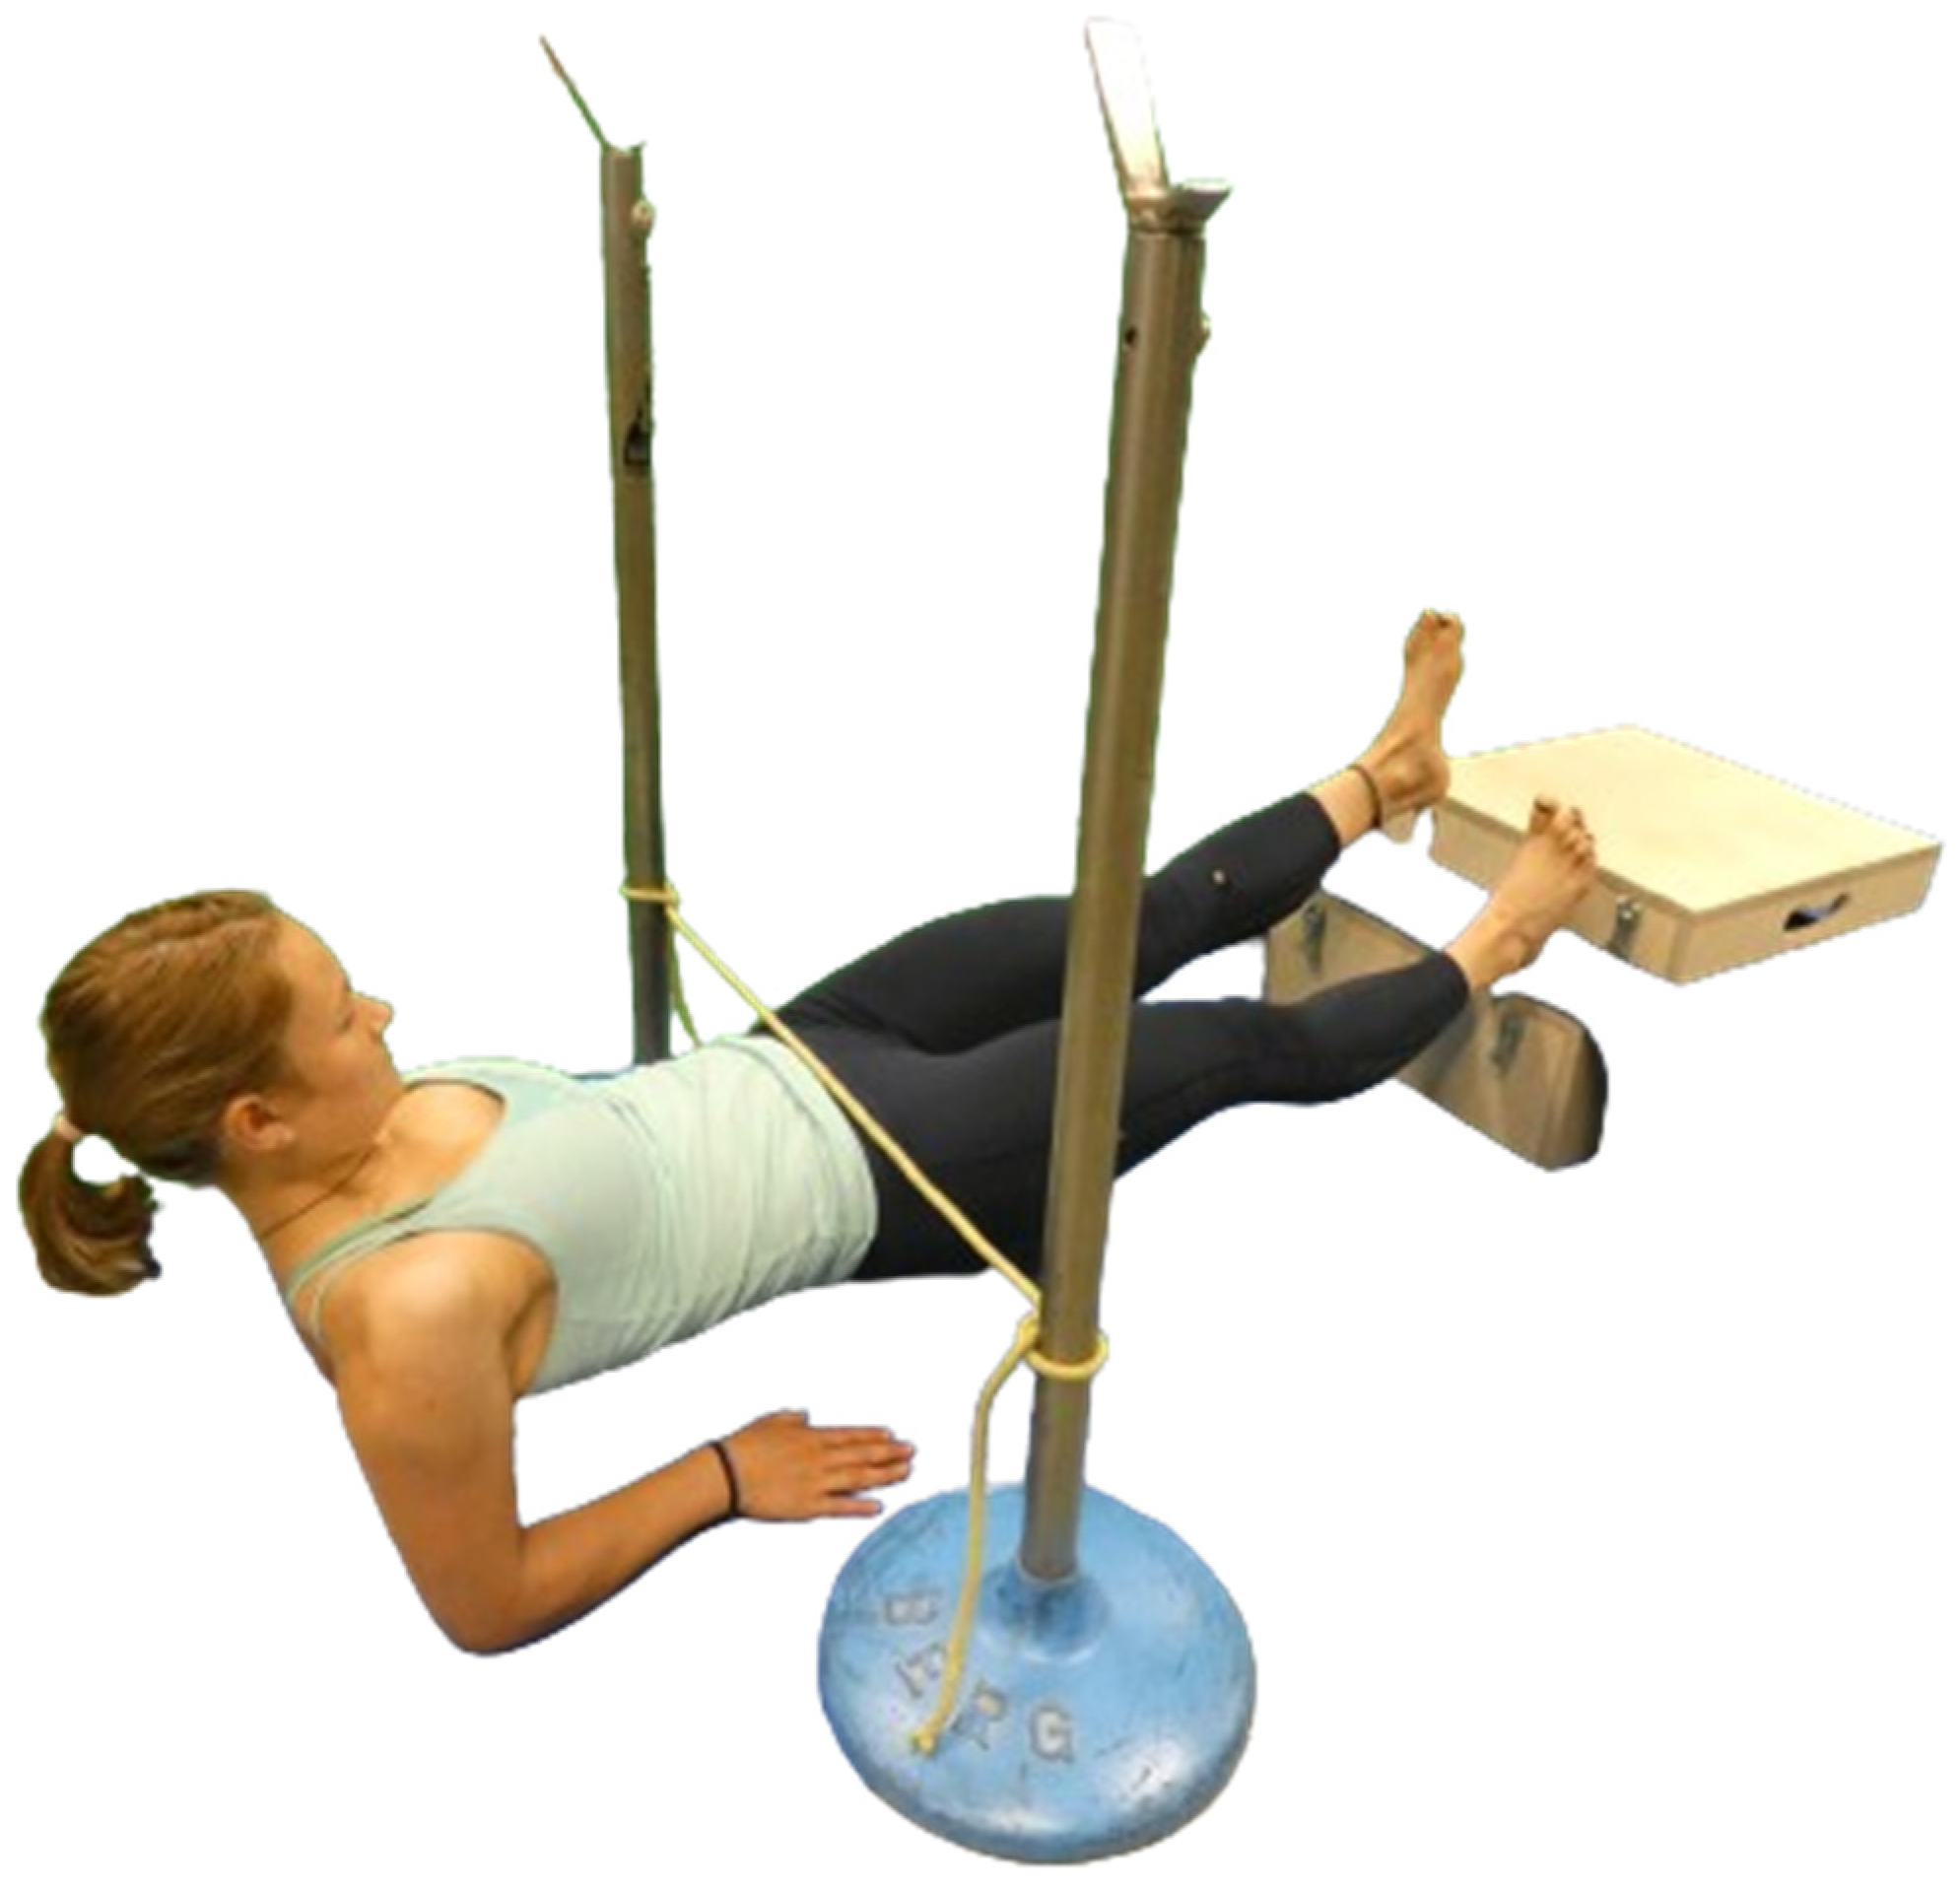
2.3.1. Bunkie Test
2.3.2. Isokinetic Testing
2.3.3. Statistical Analyses
3. Results
3.1. Participant Data
3.2. Bunkie Test
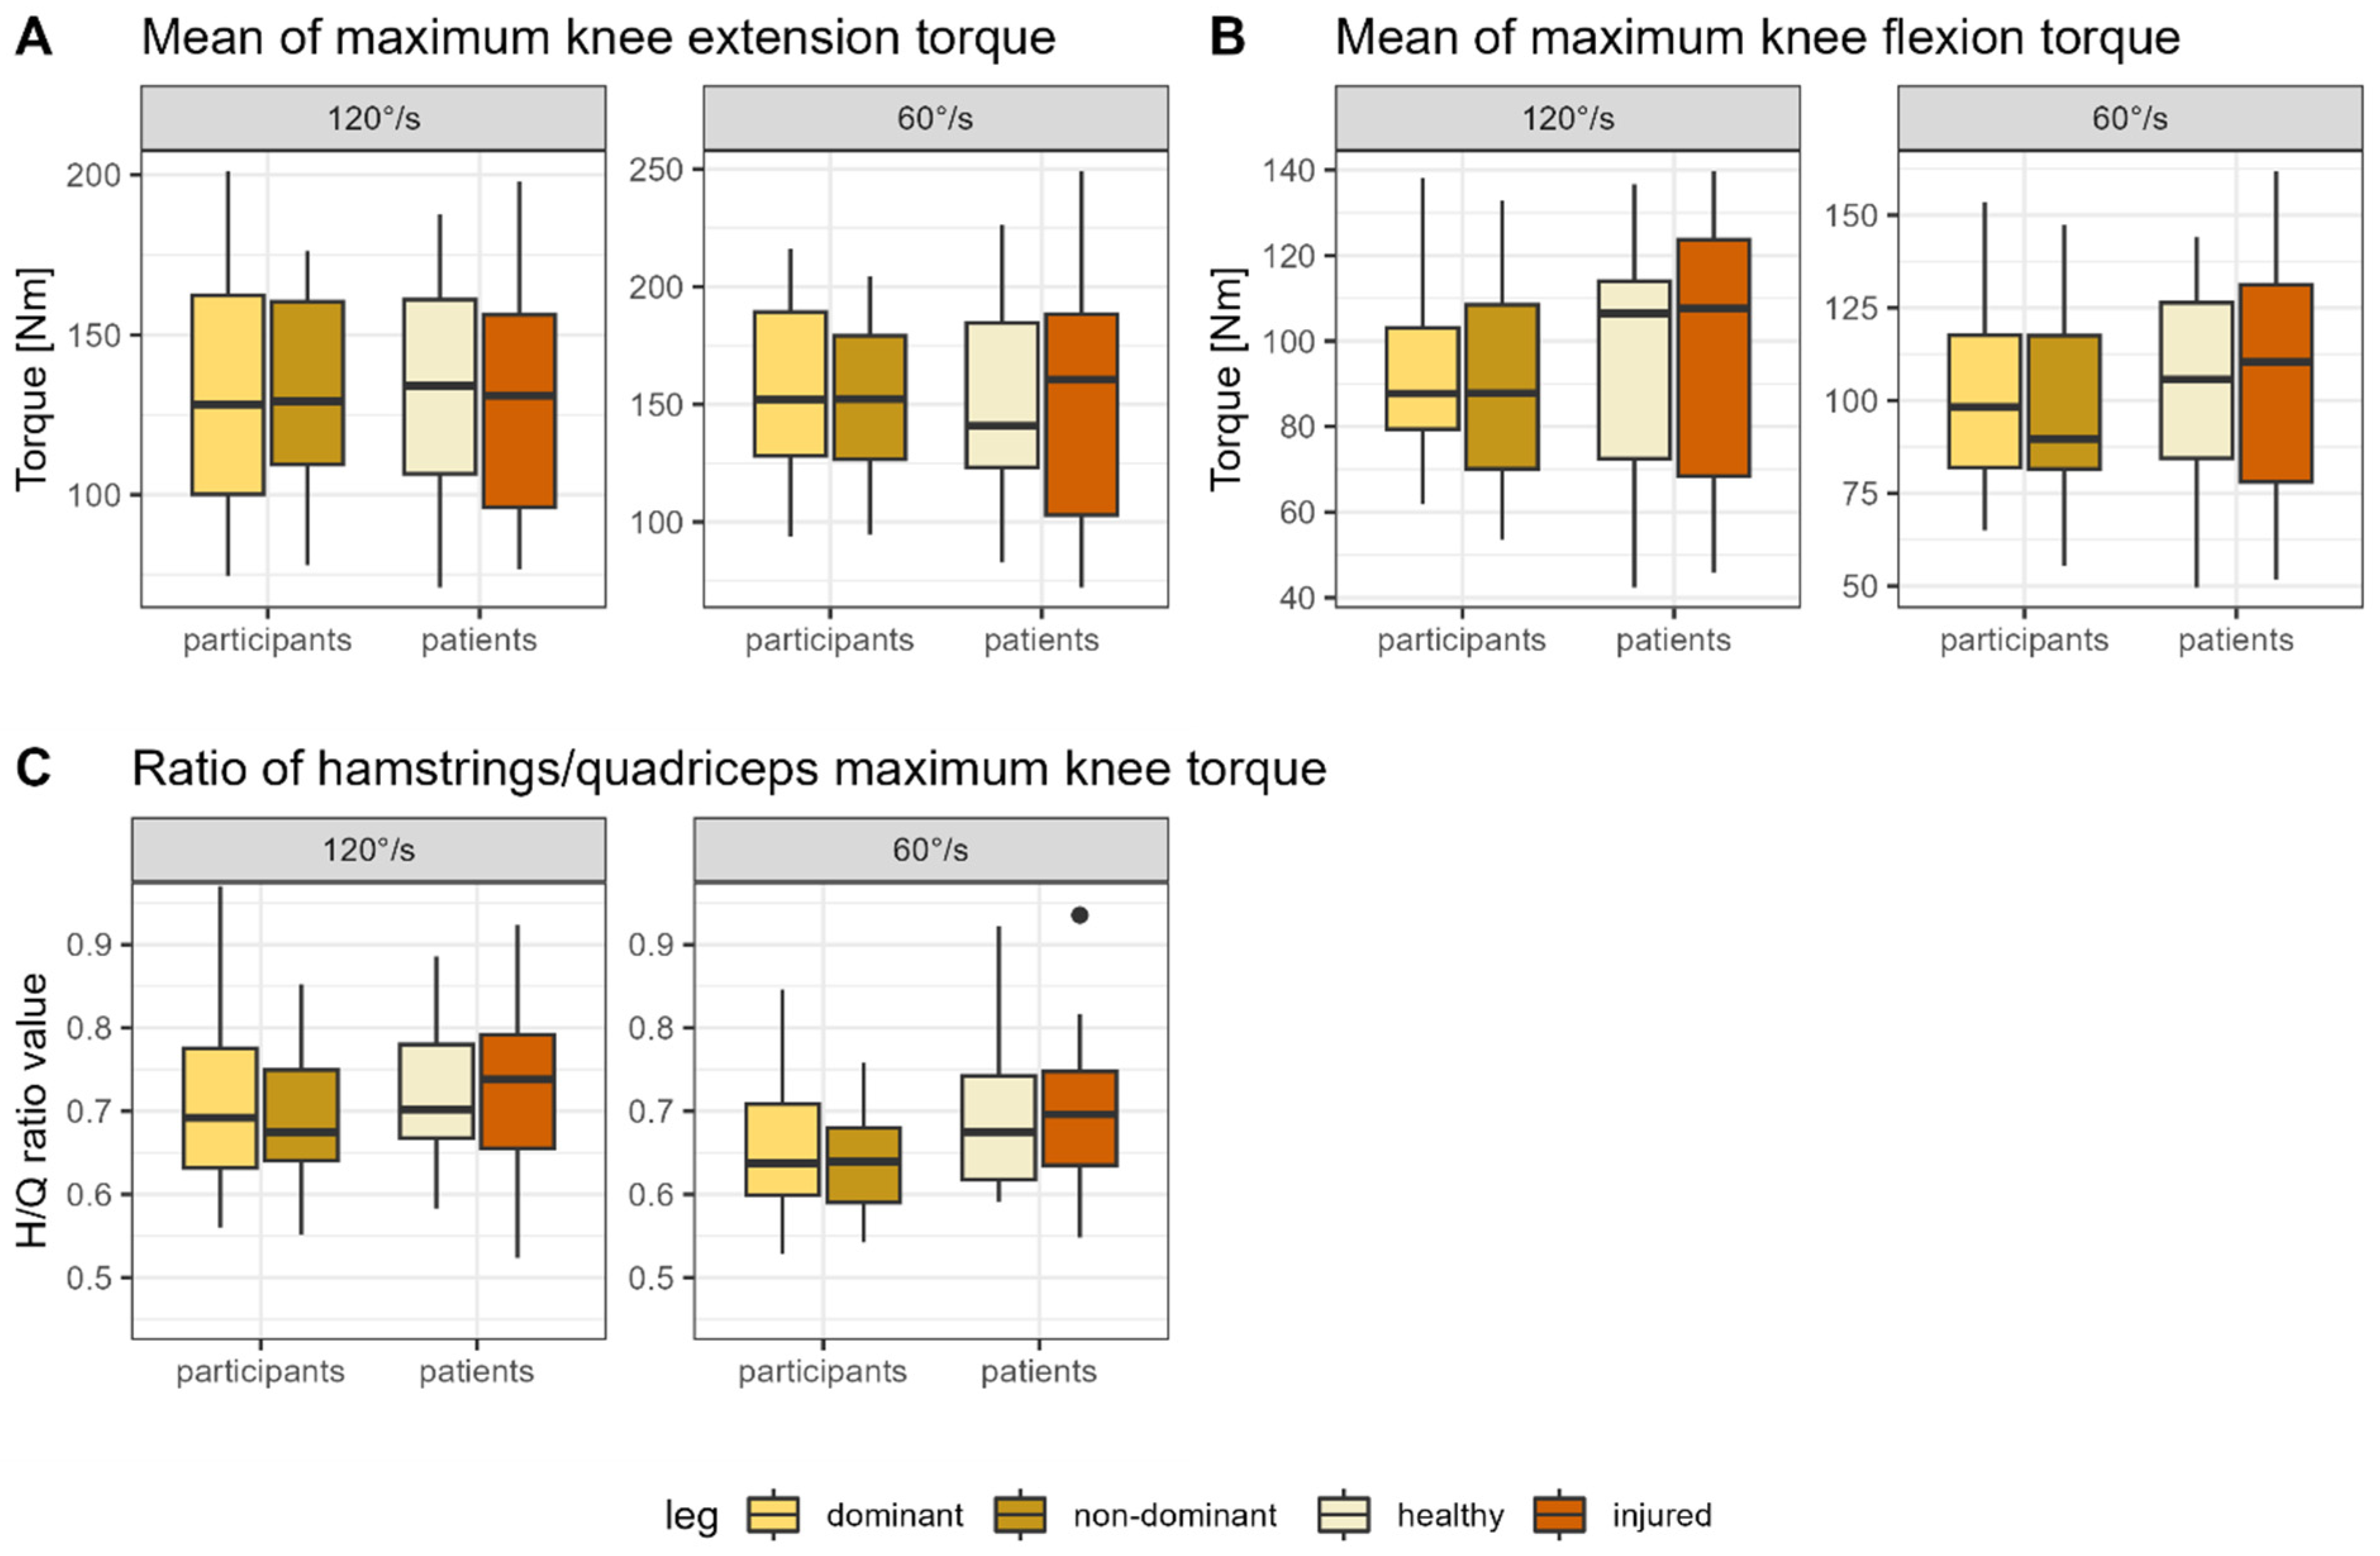
3.3. Isokinetic Measurement
4. Discussion
4.1. Diagnostic Accuracy of the Investigated Tests
4.1.1. Isokinetic Measurement
4.1.2. Bunkie Test
4.2. Reliability of the Applied Tests
4.2.1. Isokinetic Measurement
4.2.2. Bunkie Test
4.3. Comparison of the Two Applied Tests: Testing the Posterior Chain
4.4. Limitations
4.5. Clinical Implications
5. Conclusions
Author Contributions
Funding
Institutional Review Board Statement
Informed Consent Statement
Data Availability Statement
Acknowledgments
Conflicts of Interest
Appendix A

| Participant | Affected Side | Reported Pathology | Start/time of Complaints (Years) |
|---|---|---|---|
| 01 | Dominant | Pain after conservative treatment after knee cartilage injury | 1 |
| 02 | Dominant | Knee pain in the patella region after sports activity or during sitting | 5 |
| 03 | Non-dominant | Pain due to inflammation of the bone skin in the knee area | 0.5 |
| 04 | Dominant | Pain after anterior ligament rupture | 1 |
| 05 | Non-dominant | Knee pain due to restricted hip rotation | 0.5 |
| 06 | dominant | Pain medial knee joint | 6 |
| 07 | dominant | Suspected meniscal tear after slipping on ice (as child), but no assured diagnose, pain started again this year | 0.5 |
| 08 | Non-dominant | Pain due to Edema of the bone marrow in the knee | 0.5 |
| 09 | Dominant | Pain medial and lateral of patella, especially during volleyball | 0.5 |
| 10 | Dominant | Pain resulting from overload of patellar tendon | 0.5 |
| 11 | Dominant | Pain after patella luxation | 0.5 |
| 12 | Dominant | Muscle pain in the thigh (maybe strain) | 3 |
| 13 | Non-dominant | Knee pain following functional foot deformity | 3 |
| 14 | Dominant | Muscle strength deficits after anterior cruciate ligament rupture | 2 |
| 15 | Dominant | Range of motion deficit after anterior cruciate ligament rupture | 0.5 |
| 16 | Non-dominant | Problem with medial meniscus due to overload (sports) | 4 |
| 17 | Non-dominant | Functional deficits following anterior cruciate ligament rupture surgery | 6 |
| 18 | Non-dominant | Instability and pain following knee surgery (anterior cruciate ligament and meniscus) | 6 |
| 19 | Non-dominant | Pain in the patella region after accident | 2 |
| 20 | Non-dominant | Knee pain after ankle sprain | 6 |
| 21 | Non-dominant | Lateral knee pain, especially during sports | 7 |
| Group | Tested Leg | Tested Variable | 60°/s [N] | 120°/s [N] |
|---|---|---|---|---|
| Patients | Healthy | Maximum extension | 160.4 ± 48.0 | 135.18 ± 37.1 |
| Patients | Healthy | Maximum flexion | 107.6 ± 29.6 | 98.7 ± 29.3 |
| Patients | Healthy | Mean extension | 152.0 ± 45.9 | 131.5 ± 37.8 |
| Patients | Healthy | Mean Flexion | 104.5 ± 33.1 | 95.6 ± 29.0 |
| Patients | Healthy | Ratio maximum flexion/extension | 0.70 ± 0.11 | 0.73 ± 0.09 |
| Patients | Injured | Maximum extension | 235.5 ± 50.4 | 134.4 ± 39.6 |
| Patients | Injured | Maximum flexion | 105.4 ± 35.7 | 99.8 ± 33.6 |
| Patients | Injured | Mean extension | 147.8 ± 49.0 | 130.2 ± 38.9 |
| Patients | Injured | Mean Flexion | 101.8 ± 39.3 | 95.6 ± 33.0 |
| Patients | Injured | Ratio maximum flexion/extension | 0.69 ± 0.10 | 0.73 ± 0.12 |
| Participants | dominant | Maximum extension | 168.8 ± 36.3 | 141.8 ± 37.7 |
| Participants | Dominant | Maximum flexion | 109.2 ± 24.1 | 99.3 ± 21.7 |
| Participants | Dominant | Mean extension | 159.8 ± 35.9 | 136.9 ± 31.7 |
| Participants | Dominant | Mean Flexion | 104.8 ± 24.2 | 94.9 ± 22.0 |
| Participants | Dominant | Ratio maximum flexion/extension | 0.66 ± 0.08 | 0.70 ± 0.10 |
| Participants | Non-dominant | Maximum extension | 162.6 ± 36.9 | 136.0 ± 35.2 |
| Participants | Non-dominant | Maximum flexion | 102.1 ± 24.5 | 92.3 ± 22.1 |
| Participants | Non-dominant | Mean extension | 155.1 ± 34.4 | 131.8 ± 34.6 |
| Participants | Non-dominant | Mean Flexion | 98.3 ± 24.5 | 89.5 ± 22.5 |
| Participants | Non-dominant | Ratio maximum flexion/extension | 0.63 ± 0.06 | 0.69 ± 0.15 |
| Group | Comparison | °/s | Tested Variable | Result Statistical Analysis |
|---|---|---|---|---|
| Patients | Healthy/injured leg | 60° | Maximum flexion | t(21) = 0.099, p = 0.92, d = 0.031 |
| 60° | Maximum extension | t(21) = 0.007, p = 1.00, d = 0.002 | ||
| 60° | H/Q ratio | t(21) = 0.052, p = 0.96, d = 0.016 | ||
| 120° | Maximum flexion | t(21) = 0.036, p = 0.97, d = 0.011 | ||
| 120° | Maximum extension | t(21) = −0.145, p = 0.89, d = −0.045 | ||
| 120° | H/Q ratio | t(21) = −0.279, p = 0.77, d = −0.092 | ||
| Dominant/non-dominant leg | 60° | Maximum flexion | t(21) = 0.724, p = 0.47, d = 0.223 | |
| 60° | Maximum extension | t(21) = 0.542, p = 0.59, d = 0.167 | ||
| 60° | H/Q ratio | t(21) = 0.395, p = 0.70, d = 0.122 | ||
| 120° | Maximum flexion | t(21) = 0.440, p = 0.66, d = 0.136 | ||
| 120° | Maximum extension | t(21) = 0.221, p = 0.83, d = 0.068 | ||
| 120° | H/Q ratio | t(21) = 0.609, p = 0.55, d = 0.188 | ||
| Participants | Dominant/non-dominant leg | 60° | Maximum flexion | t(20) = 0.464, p = 0.65, d = 0.147 |
| 60° | Maximum extension | t(20) = 0.293, p = 0.77, d = 0.093 | ||
| 60° | H/Q ratio | t(20) = 0.715, p = 0.48, d = 0.226 | ||
| 120° | Maximum flexion | t(20) = 0.410, p = 0.68, d = 0.130 | ||
| 120° | Maximum extension | t(20) = 0.165, p = 0.87, d = 0.052 | ||
| 120° | H/Q ratio | t(20) = 0.858, p = 0.40, d = 0.271 | ||
| First-/second tested leg | 60° | Maximum flexion | t(20) = 0.845, p = 0.40, d = 0.267 | |
| 60° | Maximum extension | t(20) = 0.233, p = 0.82, d = 0.074 | ||
| 60° | H/Q ratio | t(20) = 0.994, p = 0.33, d = 0.314 | ||
| 120° | Maximum flexion | t(20) = 0.551, p = 0.59, d = 0.174 | ||
| 120° | Maximum extension | t(20) = 0.379, p = 0.71, d = 0.120 | ||
| 120° | H/Q ratio | t(20) = 0.151, p = 0.88, d = 0.048 |
References
- Brumitt, J. The Bunkie test: Descriptive data for a novel test of core muscular endurance. Rehabil. Res. Pract. 2015, 2015, 780127. [Google Scholar] [CrossRef] [PubMed]
- Manske, R.; Reiman, M. Functional performance testing for power and return to sports. Sports Health 2013, 5, 244–250. [Google Scholar] [CrossRef] [PubMed]
- Van Pletzen, D.; Venter, R.E. The relationship between the bunkie-test and physical performance in rugby union players. Int. J. Sports Sci. Coach. 2012, 7, 543–553. [Google Scholar] [CrossRef]
- Kivlan, B.R.; Martin, R.L. Functional performance testing of the hip in athletes: A systematic review for reliability and validity. Int. J. Sports Phys. Ther. 2012, 7, 402. [Google Scholar] [PubMed]
- Gissis, I.; Papadopoulos, C.; Kalapotharakos, V.I.; Sotiropoulos, A.; Komsis, G.; Manolopoulos, E. Strength and speed characteristics of elite, subelite, and recreational young soccer players. Res. Sports Med. 2006, 14, 205–214. [Google Scholar] [CrossRef] [PubMed]
- Manolopoulos, E.; Katis, A.; Manolopoulos, K.; Kalapotharakos, V.; Kellis, E. Effects of a 10-week resistance exercise program on soccer kick biomechanics and muscle strength. J. Strength Cond. Res. 2013, 27, 3391–3401. [Google Scholar] [CrossRef] [PubMed]
- De Witt, B.; Venter, R. The ‘Bunkie’test: Assessing functional strength to restore function through fascia manipulation. J. Bodyw. Mov. Ther. 2009, 13, 81–88. [Google Scholar] [CrossRef] [PubMed]
- Kellis, E.; Sahinis, C.; Baltzopoulos, V. Is hamstrings-to-quadriceps torque ratio useful for predicting anterior cruciate ligament and hamstring injuries? A systematic and critical review. J. Sport Health Sci. 2022, 12, 343–358. [Google Scholar] [CrossRef] [PubMed]
- Gabriel, A.; Paternoster, F.K.; Konrad, A.; Horstmann, T.; Pohl, T. Comparison between the Original-and a Standardized Version of a Physical Assessment Test for the Dorsal Chain-A Cohort-Based Cross Sectional Study. J. Sports Sci. Med. 2022, 21, 182–190. [Google Scholar] [CrossRef] [PubMed]
- Wilke, J.; Krause, F.; Vogt, L.; Banzer, W. What is evidence-based about myofascial chains: A systematic review. Arch. Phys. Med. Rehabil. 2016, 97, 454–461. [Google Scholar] [CrossRef] [PubMed]
- Krause, F.; Wilke, J.; Vogt, L.; Banzer, W. Intermuscular force transmission along myofascial chains: A systematic review. J. Anat. 2016, 228, 910–918. [Google Scholar] [CrossRef] [PubMed]
- Villafane, J.H.; Gobbo, M.; Peranzoni, M.; Naik, G.; Imperio, G.; Cleland, J.A.; Negrini, S. Validity and everyday clinical applicability of lumbar muscle fatigue assessment methods in patients with chronic non-specific low back pain: A systematic review. Disabil. Rehabil. 2016, 38, 1859–1871. [Google Scholar] [CrossRef] [PubMed]
- Gabriel, A.; Konrad, A.; Roidl, A.; Queisser, J.; Schleip, R.; Horstmann, T.; Pohl, T. Myofascial Treatment Techniques on the Plantar Surface Influence Functional Performance in the Dorsal Kinetic Chain. J. Sports Sci. Med. 2021, 21, 13–22. [Google Scholar] [CrossRef] [PubMed]
- O’Neill, E.; Tamjid, N.; DeRevere, J.; Kostelis, K. Assessment and application of the Bunkie test in college students. J. Bodyw. Mov. Ther. 2020, 24, 165–169. [Google Scholar] [CrossRef]
- Ronai, P. The bunkie test. Strength Cond. J. 2015, 37, 89–92. [Google Scholar] [CrossRef]
- Chamorro, C.; Armijo-Olivo, S.; De la Fuente, C.; Fuentes, J.; Chirosa, L.J. Absolute reliability and concurrent validity of hand held dynamometry and isokinetic dynamometry in the hip, knee and ankle joint: Systematic review and meta-analysis. Open Med. 2017, 12, 359–375. [Google Scholar] [CrossRef] [PubMed]
- Rosene, J.M.; Fogarty, T.D.; Mahaffey, B.L. Isokinetic hamstrings: Quadriceps ratios in intercollegiate athletes. J. Athl. Train. 2001, 36, 378. [Google Scholar] [PubMed]
- Dauty, M.; Potiron-Josse, M.; Rochcongar, P. Identification of previous hamstring muscle injury by isokinetic concentric and eccentric torque measurement in elite soccer player. Isokinet. Exerc. Sci. 2003, 11, 139–144. [Google Scholar] [CrossRef]
- Bonci, C.M. Assessment and evaluation of predisposing factors to anterior cruciate ligament injury. J. Athl. Train. 1999, 34, 155. [Google Scholar] [PubMed]
- Osternig, L.R. Isokinetic dynamometry: Implications for muscle testing and rehabilitation. Exerc. Sport Sci. Rev. 1986, 14, 45–80. [Google Scholar] [CrossRef]
- Goebel, S. Entwicklung, Überprüfung und Normierung eines Kraftmessverfahrens. Doctoral Dissertation, Universitäts-und Landesbibliothek Bonn, Bonn, Germany, 2002. [Google Scholar]
- Gaines, J.M.; Talbot, L.A. Isokinetic strength testing in research and practice. Biol. Res. Nurs. 1999, 1, 57–64. [Google Scholar] [CrossRef] [PubMed]
- Kollock Jr, R.O.; Onate, J.A.; Van Lunen, B. The reliability of portable fixed dynamometry during hip and knee strength assessments. J. Athl. Train. 2010, 45, 349–356. [Google Scholar] [CrossRef] [PubMed]
- Mathes, T.; Pieper, D. An algorithm for the classification of study designs to assess diagnostic, prognostic and predictive test accuracy in systematic reviews. Syst. Rev. 2019, 8, 226. [Google Scholar] [CrossRef] [PubMed]
- Sitch, A.J.; Dekkers, O.M.; Scholefield, B.R.; Takwoingi, Y. Introduction to diagnostic test accuracy studies. Eur. J. Endocrinol. 2021, 184, E5–E9. [Google Scholar] [CrossRef] [PubMed]
- Bossuyt, P.M.; Reitsma, J.B.; Bruns, D.E.; Gatsonis, C.A.; Glasziou, P.P.; Irwig, L.M.; Moher, D.; Rennie, D.; De Vet, H.C.; Lijmer, J.G. The STARD statement for reporting studies of diagnostic accuracy: Explanation and elaboration. Ann. Intern. Med. 2003, 138, W1–W12. [Google Scholar] [CrossRef] [PubMed]
- Hess, A.; Shardell, M.; Johnson, J.; Thom, K.; Strassle, P.; Netzer, G.; Harris, A. Methods and recommendations for evaluating and reporting a new diagnostic test. Eur. J. Clin. Microbiol. Infect. Dis. 2012, 31, 2111–2116. [Google Scholar] [CrossRef] [PubMed]
- Strath, S.J.; Kaminsky, L.A.; Ainsworth, B.E.; Ekelund, U.; Freedson, P.S.; Gary, R.A.; Richardson, C.R.; Smith, D.T.; Swartz, A.M. Guide to the assessment of physical activity: Clinical and research applications: A scientific statement from the American Heart Association. Circulation 2013, 128, 2259–2279. [Google Scholar] [CrossRef] [PubMed]
- Bull, F.C.; Al-Ansari, S.S.; Biddle, S.; Borodulin, K.; Buman, M.P.; Cardon, G.; Carty, C.; Chaput, J.-P.; Chastin, S.; Chou, R. World Health Organization 2020 guidelines on physical activity and sedentary behaviour. Br. J. Sports Med. 2020, 54, 1451–1462. [Google Scholar] [CrossRef] [PubMed]
- MacDonald, G.Z.; Penney, M.D.; Mullaley, M.E.; Cuconato, A.L.; Drake, C.D.; Behm, D.G.; Button, D.C. An acute bout of self-myofascial release increases range of motion without a subsequent decrease in muscle activation or force. J. Strength Cond. Res. 2013, 27, 812–821. [Google Scholar] [CrossRef]
- Massoud Arab, A.; Salavati, M.; Ebrahimi, I.; Ebrahim Mousavi, M. Sensitivity, specificity and predictive value of the clinical trunk muscle endurance tests in low back pain. Clin. Rehabil. 2007, 21, 640–647. [Google Scholar] [CrossRef]
- Emrani, A.; Bagheri, H.; Hadian, M.R.; Jabal-Ameli, M.; Olyaei, G.R.; Talebian, S. Isokinetic strength and functional status in knee osteoarthritis. J. Phys. Ther. Sci. 2006, 18, 107–114. [Google Scholar] [CrossRef]
- Grygorowicz, M.; Kubacki, J.; Pilis, W.; Gieremek, K.; Rzepka, R. Selected isokinetic tests in knee injury prevention. Biol. Sport 2010, 27, 47–51. [Google Scholar] [CrossRef]
- Jeon, K.; Seo, B.-D.; Lee, S.-H. Comparative study on isokinetic capacity of knee and ankle joints by functional injury. J. Phys. Ther. Sci. 2016, 28, 250–256. [Google Scholar] [CrossRef]
- The R Foundation. R: The R Project for Statistical Computing; The R Foundation: Vienna, Austria, 2022. [Google Scholar]
- Sawilowsky, S.S. New effect size rules of thumb. J. Mod. Appl. Stat. Methods 2009, 8, 26. [Google Scholar] [CrossRef]
- Knottnerus, J.A.; Muris, J.W. Assessment of the accuracy of diagnostic tests: The cross-sectional study. J. Clin. Epidemiol. 2003, 56, 1118–1128. [Google Scholar] [CrossRef] [PubMed]
- Hernaez, R. Reliability and agreement studies: A guide for clinical investigators. Gut 2015, 64, 1018–1027. [Google Scholar] [CrossRef]
- Mandroukas, A.; Michailidis, Y.; Metaxas, T. Muscle Strength and Hamstrings to Quadriceps Ratio in Young Soccer Players: A Cross-Sectional Study. J. Funct. Morphol. Kinesiol. 2023, 8, 70. [Google Scholar] [CrossRef] [PubMed]
- Baroni, B.M.; Ruas, C.V.; Ribeiro-Alvares, J.B.; Pinto, R.S. Hamstring-to-quadriceps torque ratios of professional male soccer players: A systematic review. J. Strength Cond. Res. 2020, 34, 281–293. [Google Scholar] [CrossRef] [PubMed]
- Dauty, M.; Menu, P.; Fouasson-Chailloux, A.; Ferréol, S.; Dubois, C. Prediction of hamstring injury in professional soccer players by isokinetic measurements. Muscles Ligaments Tendons J. 2016, 6, 116. [Google Scholar] [CrossRef]
- Bennell, K.; Wajswelner, H.; Lew, P.; Schall-Riaucour, A.; Leslie, S.; Plant, D.; Cirone, J. Isokinetic strength testing does not predict hamstring injury in Australian Rules footballers. Br. J. Sports Med. 1998, 32, 309–314. [Google Scholar] [CrossRef] [PubMed]
- Dauty, M.; Potiron-Josse, M.; Rochcongar, P. Consequences and prediction of hamstring muscle injury with concentric and eccentric isokinetic parameters in elite soccer players. In Annales de Readaptation et de Medecine Physique: Revue Scientifique de la Societe Francaise de Reeducation Fonctionnelle de Readaptation et de Medecine Physique; Europe PMC: London, UK, 2003; pp. 601–606. [Google Scholar]
- Zvijac, J.E.; Toriscelli, T.A.; Merrick, S.; Kiebzak, G.M. Isokinetic concentric quadriceps and hamstring strength variables from the NFL Scouting Combine are not predictive of hamstring injury in first-year professional football players. Am. J. Sports Med. 2013, 41, 1511–1518. [Google Scholar] [CrossRef]
- Feiring, D.C.; Ellenbecker, T.S.; Derscheid, G.L. Test-retest reliability of the Biodex isokinetic dynamometer. J. Orthop. Sports Phys. Ther. 1990, 11, 298–300. [Google Scholar] [CrossRef]
- Habets, B.; Staal, J.B.; Tijssen, M.; van Cingel, R. Intrarater reliability of the Humac NORM isokinetic dynamometer for strength measurements of the knee and shoulder muscles. BMC Res. Notes 2018, 11, 15. [Google Scholar] [CrossRef]
- Mau-Moeller, A.; Gube, M.; Felser, S.; Feldhege, F.; Weippert, M.; Husmann, F.; Tischer, T.; Bader, R.; Bruhn, S.; Behrens, M. Intrarater reliability of muscle strength and hamstring to quadriceps strength imbalance ratios during concentric, isometric, and eccentric maximal voluntary contractions using the isoforce dynamometer. Clin. J. Sport Med. 2019, 29, 69–77. [Google Scholar] [CrossRef]
- R Core Team. R: A Language and Environment for Statistical Computing; R Foundation for Statistical Computing: Vienna, Austria, 2018; Available online: https://www.R-project.org (accessed on 17 December 2023).
- Koo, T.K.; Li, M.Y. A guideline of selecting and reporting intraclass correlation coefficients for reliability research. J. Chiropr. Med. 2016, 15, 155–163. [Google Scholar] [CrossRef] [PubMed]
- Shrout, P.E.; Fleiss, J.L. Intraclass correlations: Uses in assessing rater reliability. Psychol. Bull. 1979, 86, 420. [Google Scholar] [CrossRef] [PubMed]
- Champagne, A.; Descarreaux, M.; Lafond, D. Back and hip extensor muscles fatigue in healthy subjects: Task-dependency effect of two variants of the Sorensen test. Eur. Spine J. 2008, 17, 1721–1726. [Google Scholar] [CrossRef] [PubMed]
- Demoulin, C.; Vanderthommen, M.; Duysens, C.; Crielaard, J.-M. Spinal muscle evaluation using the Sorensen test: A critical appraisal of the literature. Jt. Bone Spine 2006, 73, 43–50. [Google Scholar] [CrossRef] [PubMed]
- Latimer, J.; Maher, C.G.; Refshauge, K.; Colaco, I. The reliability and validity of the Biering–Sorensen test in asymptomatic subjects and subjects reporting current or previous nonspecific low back pain. Spine 1999, 24, 2085. [Google Scholar] [CrossRef] [PubMed]
- De Blaiser, C.; De Ridder, R.; Willems, T.; Danneels, L.; Vanden Bossche, L.; Palmans, T.; Roosen, P. Evaluating abdominal core muscle fatigue: Assessment of the validity and reliability of the prone bridging test. Scand. J. Med. Sci. Sports 2018, 28, 391–399. [Google Scholar] [CrossRef] [PubMed]
- Matinlauri, A.; Alcaraz, P.E.; Freitas, T.T.; Mendiguchia, J.; Abedin-Maghanaki, A.; Castillo, A.; Martínez-Ruiz, E.; Carlos-Vivas, J.; Cohen, D.D. A comparison of the isometric force fatigue-recovery profile in two posterior chain lower limb tests following simulated soccer competition. PLoS ONE 2019, 14, e0206561. [Google Scholar] [CrossRef] [PubMed]
- Constantine, E.; Taberner, M.; Richter, C.; Willett, M.; Cohen, D.D. Isometric Posterior Chain Peak Force Recovery Response Following Match-Play in Elite Youth Soccer Players: Associations with Relative Posterior Chain Strength. Sports 2019, 7, 218. [Google Scholar] [CrossRef] [PubMed]
- Oliveira, C.B.; Maher, C.G.; Pinto, R.Z.; Traeger, A.C.; Lin, C.-W.C.; Chenot, J.-F.; van Tulder, M.; Koes, B.W. Clinical practice guidelines for the management of non-specific low back pain in primary care: An updated overview. Eur. Spine J. 2018, 27, 2791–2803. [Google Scholar] [CrossRef] [PubMed]
- Tonosu, J.; Oka, H.; Higashikawa, A.; Okazaki, H.; Tanaka, S.; Matsudaira, K. The associations between magnetic resonance imaging findings and low back pain: A 10-year longitudinal analysis. PLoS ONE 2017, 12, e0188057. [Google Scholar] [CrossRef] [PubMed]
- Harøy, J.; Thorborg, K.; Hölmich, P.; Serner, A.; Bjørkheim, A.; Rolstad, L.E.; Bahr, R.; Andersen, T.E. Including the Copenhagen Adduction Exercise in the Fifa 11+ Provides Missing Eccentric Hip Adduction Strength Effect: A Randomised Controlled Trial. Br. J. Sports Med. 2017, 51, 327. [Google Scholar] [CrossRef]
- Pincivero, D.M.; Campy, R.M.; Coelho, A.J. Knee flexor torque and perceived exertion: A gender and reliability analysis. Med. Sci. Sports Exerc. 2003, 35, 1720–1726. [Google Scholar] [CrossRef]


| Patients | Healthy Controls | |
|---|---|---|
| Sex (n) | 9 f/12 m 1 | 9 f/12 m 1 |
| Age (years) | 26.5 (5.7) | 26.2 (5.3) |
| Weight (kg) | 72.6 16.9) | 73.8 (14.6) |
| Height (cm) | 177.0 (10.1) | 176.0 (9.9) |
| Dominant leg (n) | 19r/2l 2 | 19r/2l 2 |
| Activity status (min/week) | 250 (30) 3 | 230 (70) 3 |
| Test Result | Patients | Healthy Controls |
|---|---|---|
| Positive | A: 17 (17 *) | B: 10 (10 *) |
| Negative | C: 4 (2 *) | D: 11 (11 *) |
| Test Result 60°/s | Patient | Healthy Controls |
|---|---|---|
| Positive | A: 3 | B: 6 |
| Negative | C: 18 | D: 14 |
| Test Result 120°/s | ||
| Positive | A: 1 | B: 2 |
| Negative | C: 20 | D: 18 |
Disclaimer/Publisher’s Note: The statements, opinions and data contained in all publications are solely those of the individual author(s) and contributor(s) and not of MDPI and/or the editor(s). MDPI and/or the editor(s) disclaim responsibility for any injury to people or property resulting from any ideas, methods, instructions or products referred to in the content. |
© 2024 by the authors. Licensee MDPI, Basel, Switzerland. This article is an open access article distributed under the terms and conditions of the Creative Commons Attribution (CC BY) license (https://creativecommons.org/licenses/by/4.0/).
Share and Cite
Gabriel, A.; Konrad, A.; Herold, N.; Horstmann, T.; Schleip, R.; Paternoster, F.K. Testing the Posterior Chain: Diagnostic Accuracy of the Bunkie Test versus the Isokinetic Hamstrings/Quadriceps Measurement in Patients with Self-Reported Knee Pain and Healthy Controls. J. Clin. Med. 2024, 13, 1011. https://doi.org/10.3390/jcm13041011
Gabriel A, Konrad A, Herold N, Horstmann T, Schleip R, Paternoster FK. Testing the Posterior Chain: Diagnostic Accuracy of the Bunkie Test versus the Isokinetic Hamstrings/Quadriceps Measurement in Patients with Self-Reported Knee Pain and Healthy Controls. Journal of Clinical Medicine. 2024; 13(4):1011. https://doi.org/10.3390/jcm13041011
Chicago/Turabian StyleGabriel, Anna, Andreas Konrad, Nadine Herold, Thomas Horstmann, Robert Schleip, and Florian K. Paternoster. 2024. "Testing the Posterior Chain: Diagnostic Accuracy of the Bunkie Test versus the Isokinetic Hamstrings/Quadriceps Measurement in Patients with Self-Reported Knee Pain and Healthy Controls" Journal of Clinical Medicine 13, no. 4: 1011. https://doi.org/10.3390/jcm13041011
APA StyleGabriel, A., Konrad, A., Herold, N., Horstmann, T., Schleip, R., & Paternoster, F. K. (2024). Testing the Posterior Chain: Diagnostic Accuracy of the Bunkie Test versus the Isokinetic Hamstrings/Quadriceps Measurement in Patients with Self-Reported Knee Pain and Healthy Controls. Journal of Clinical Medicine, 13(4), 1011. https://doi.org/10.3390/jcm13041011