
Machine Learning Classification of Pediatric Health Status Based on Cardiorespiratory Signals with Causal and Information Domain Features Applied—An Exploratory Study

 ,
,  , ,
, ,  and
and
Abstract

1. Introduction
2. Materials and Methods
2.1. Study Design
- Cardiac—subjects with an ongoing cardiac disease requiring hospitalization;
- Healthy—subjects without any active heart disease, whether sedentary or recreationally active subjects according to McKay classification [39];
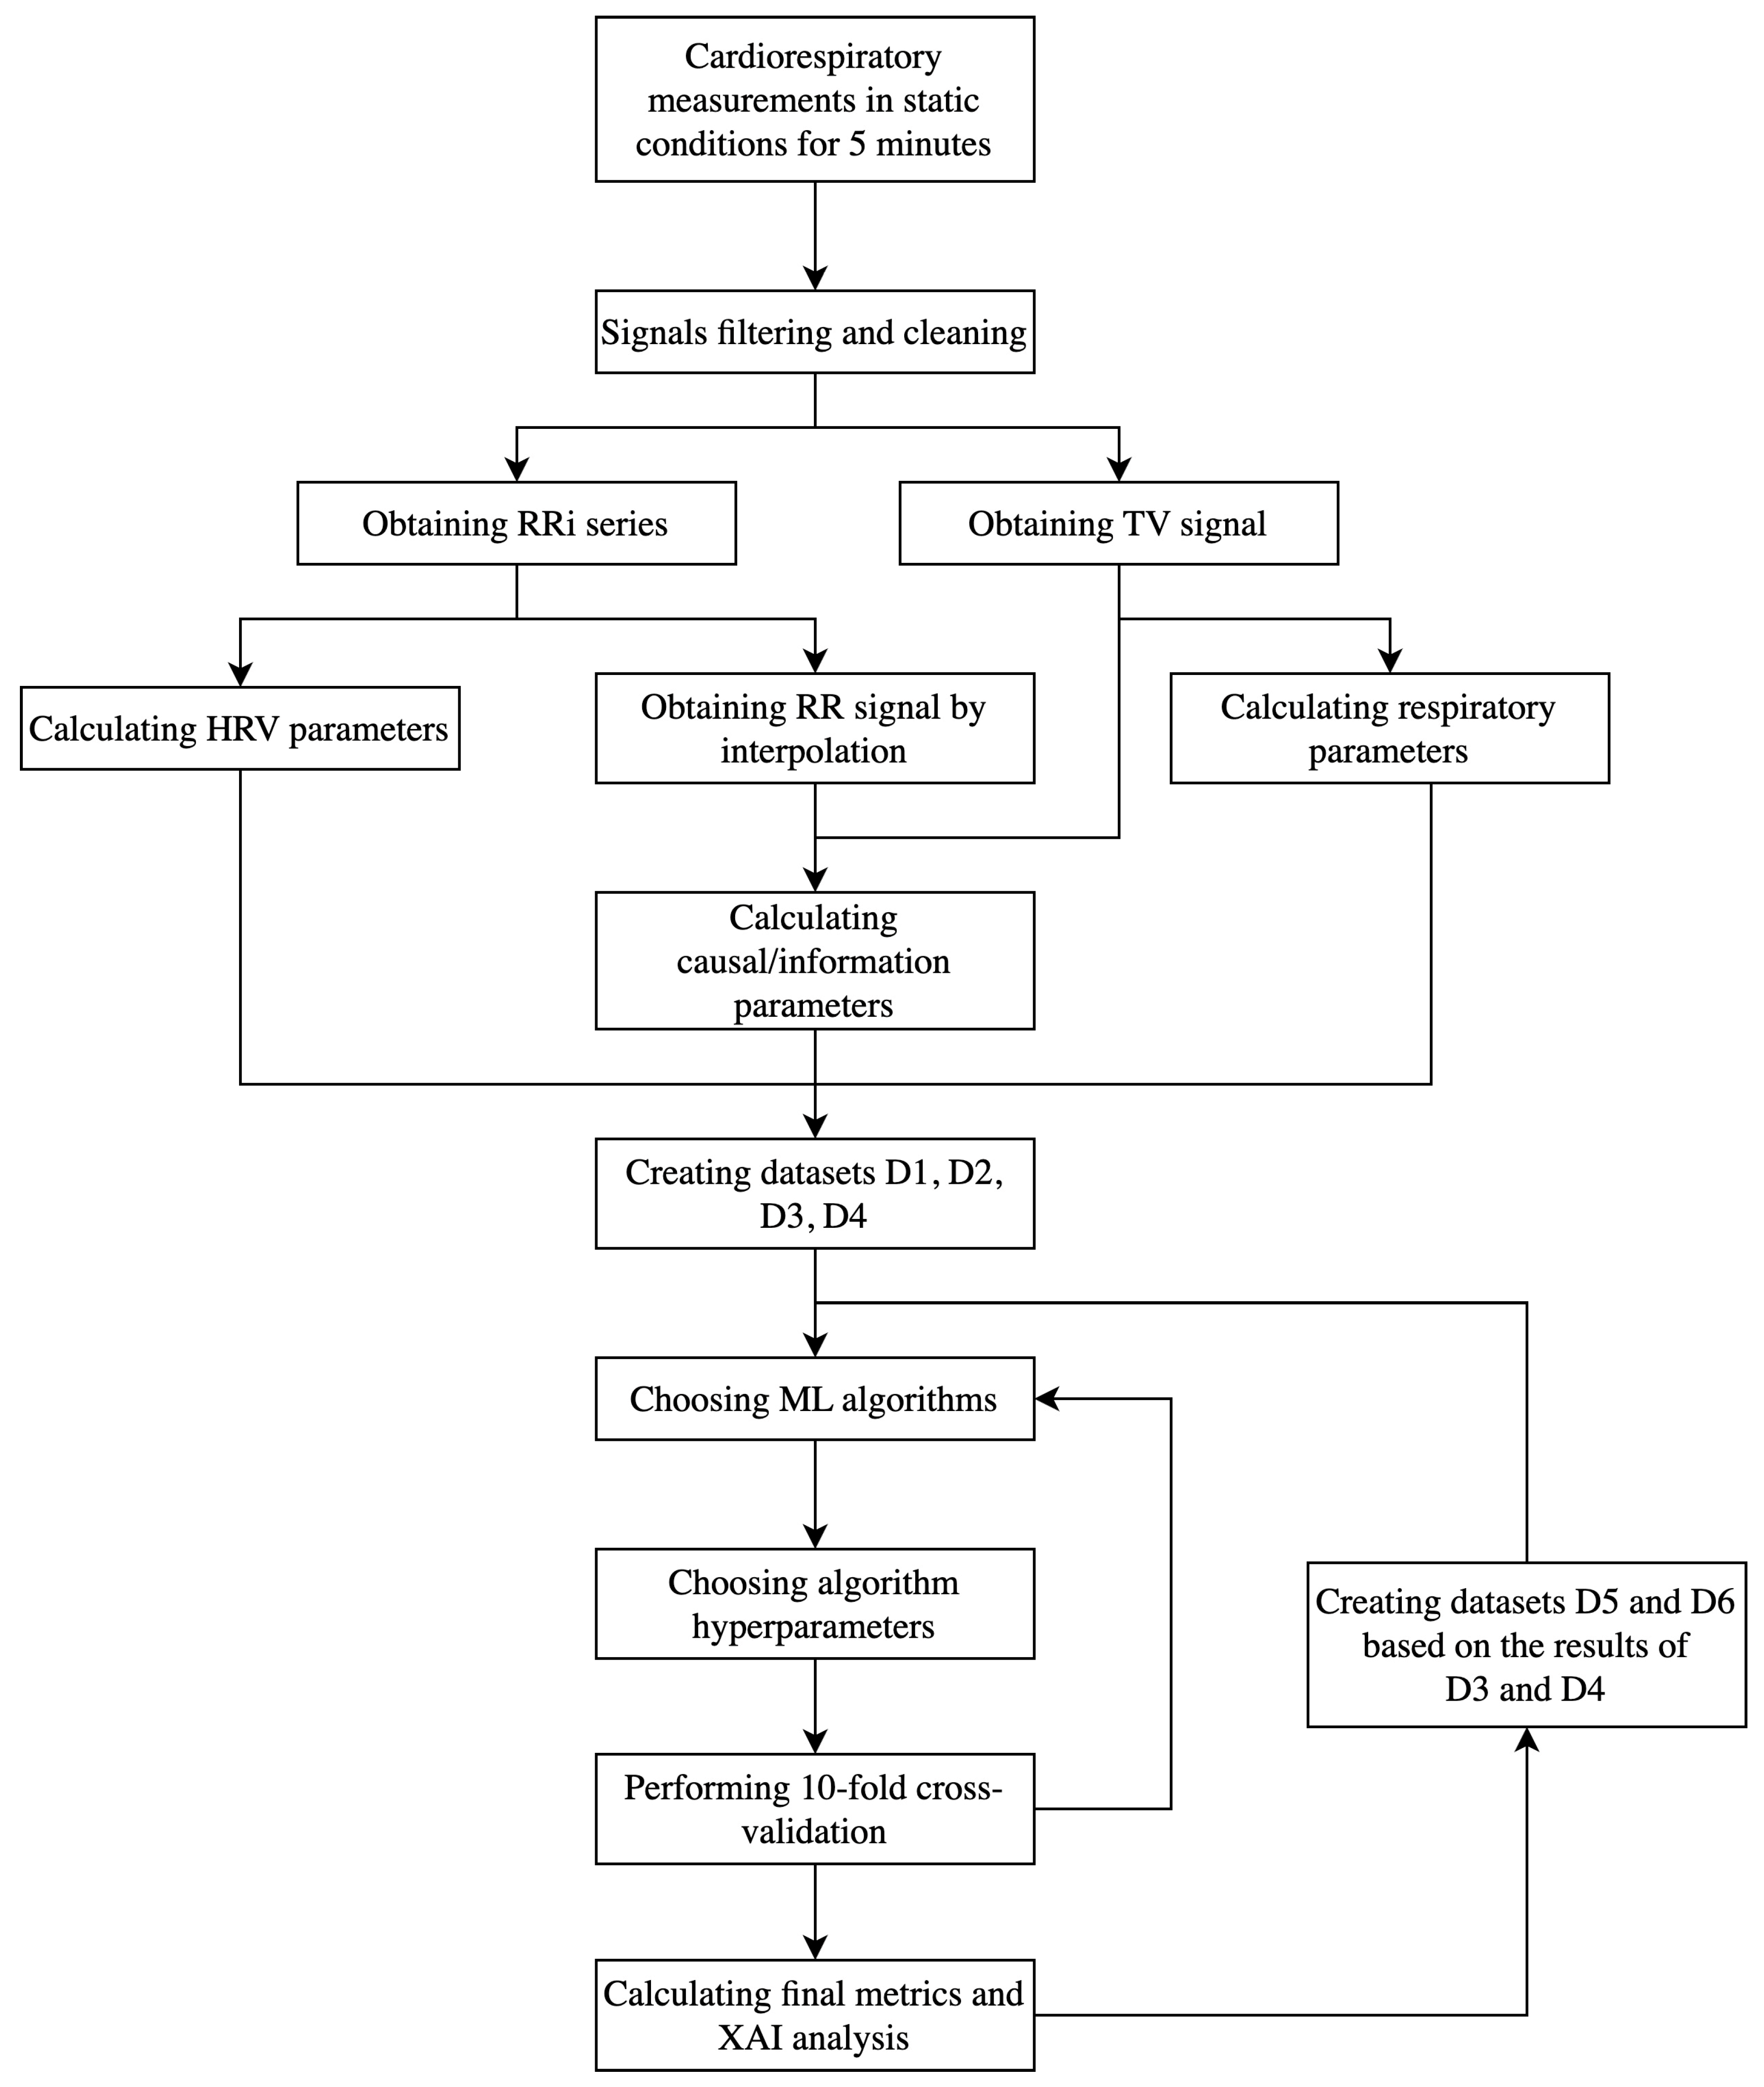
2.2. Signal Processing
2.3. Parameters Calculation
2.4. Modeling
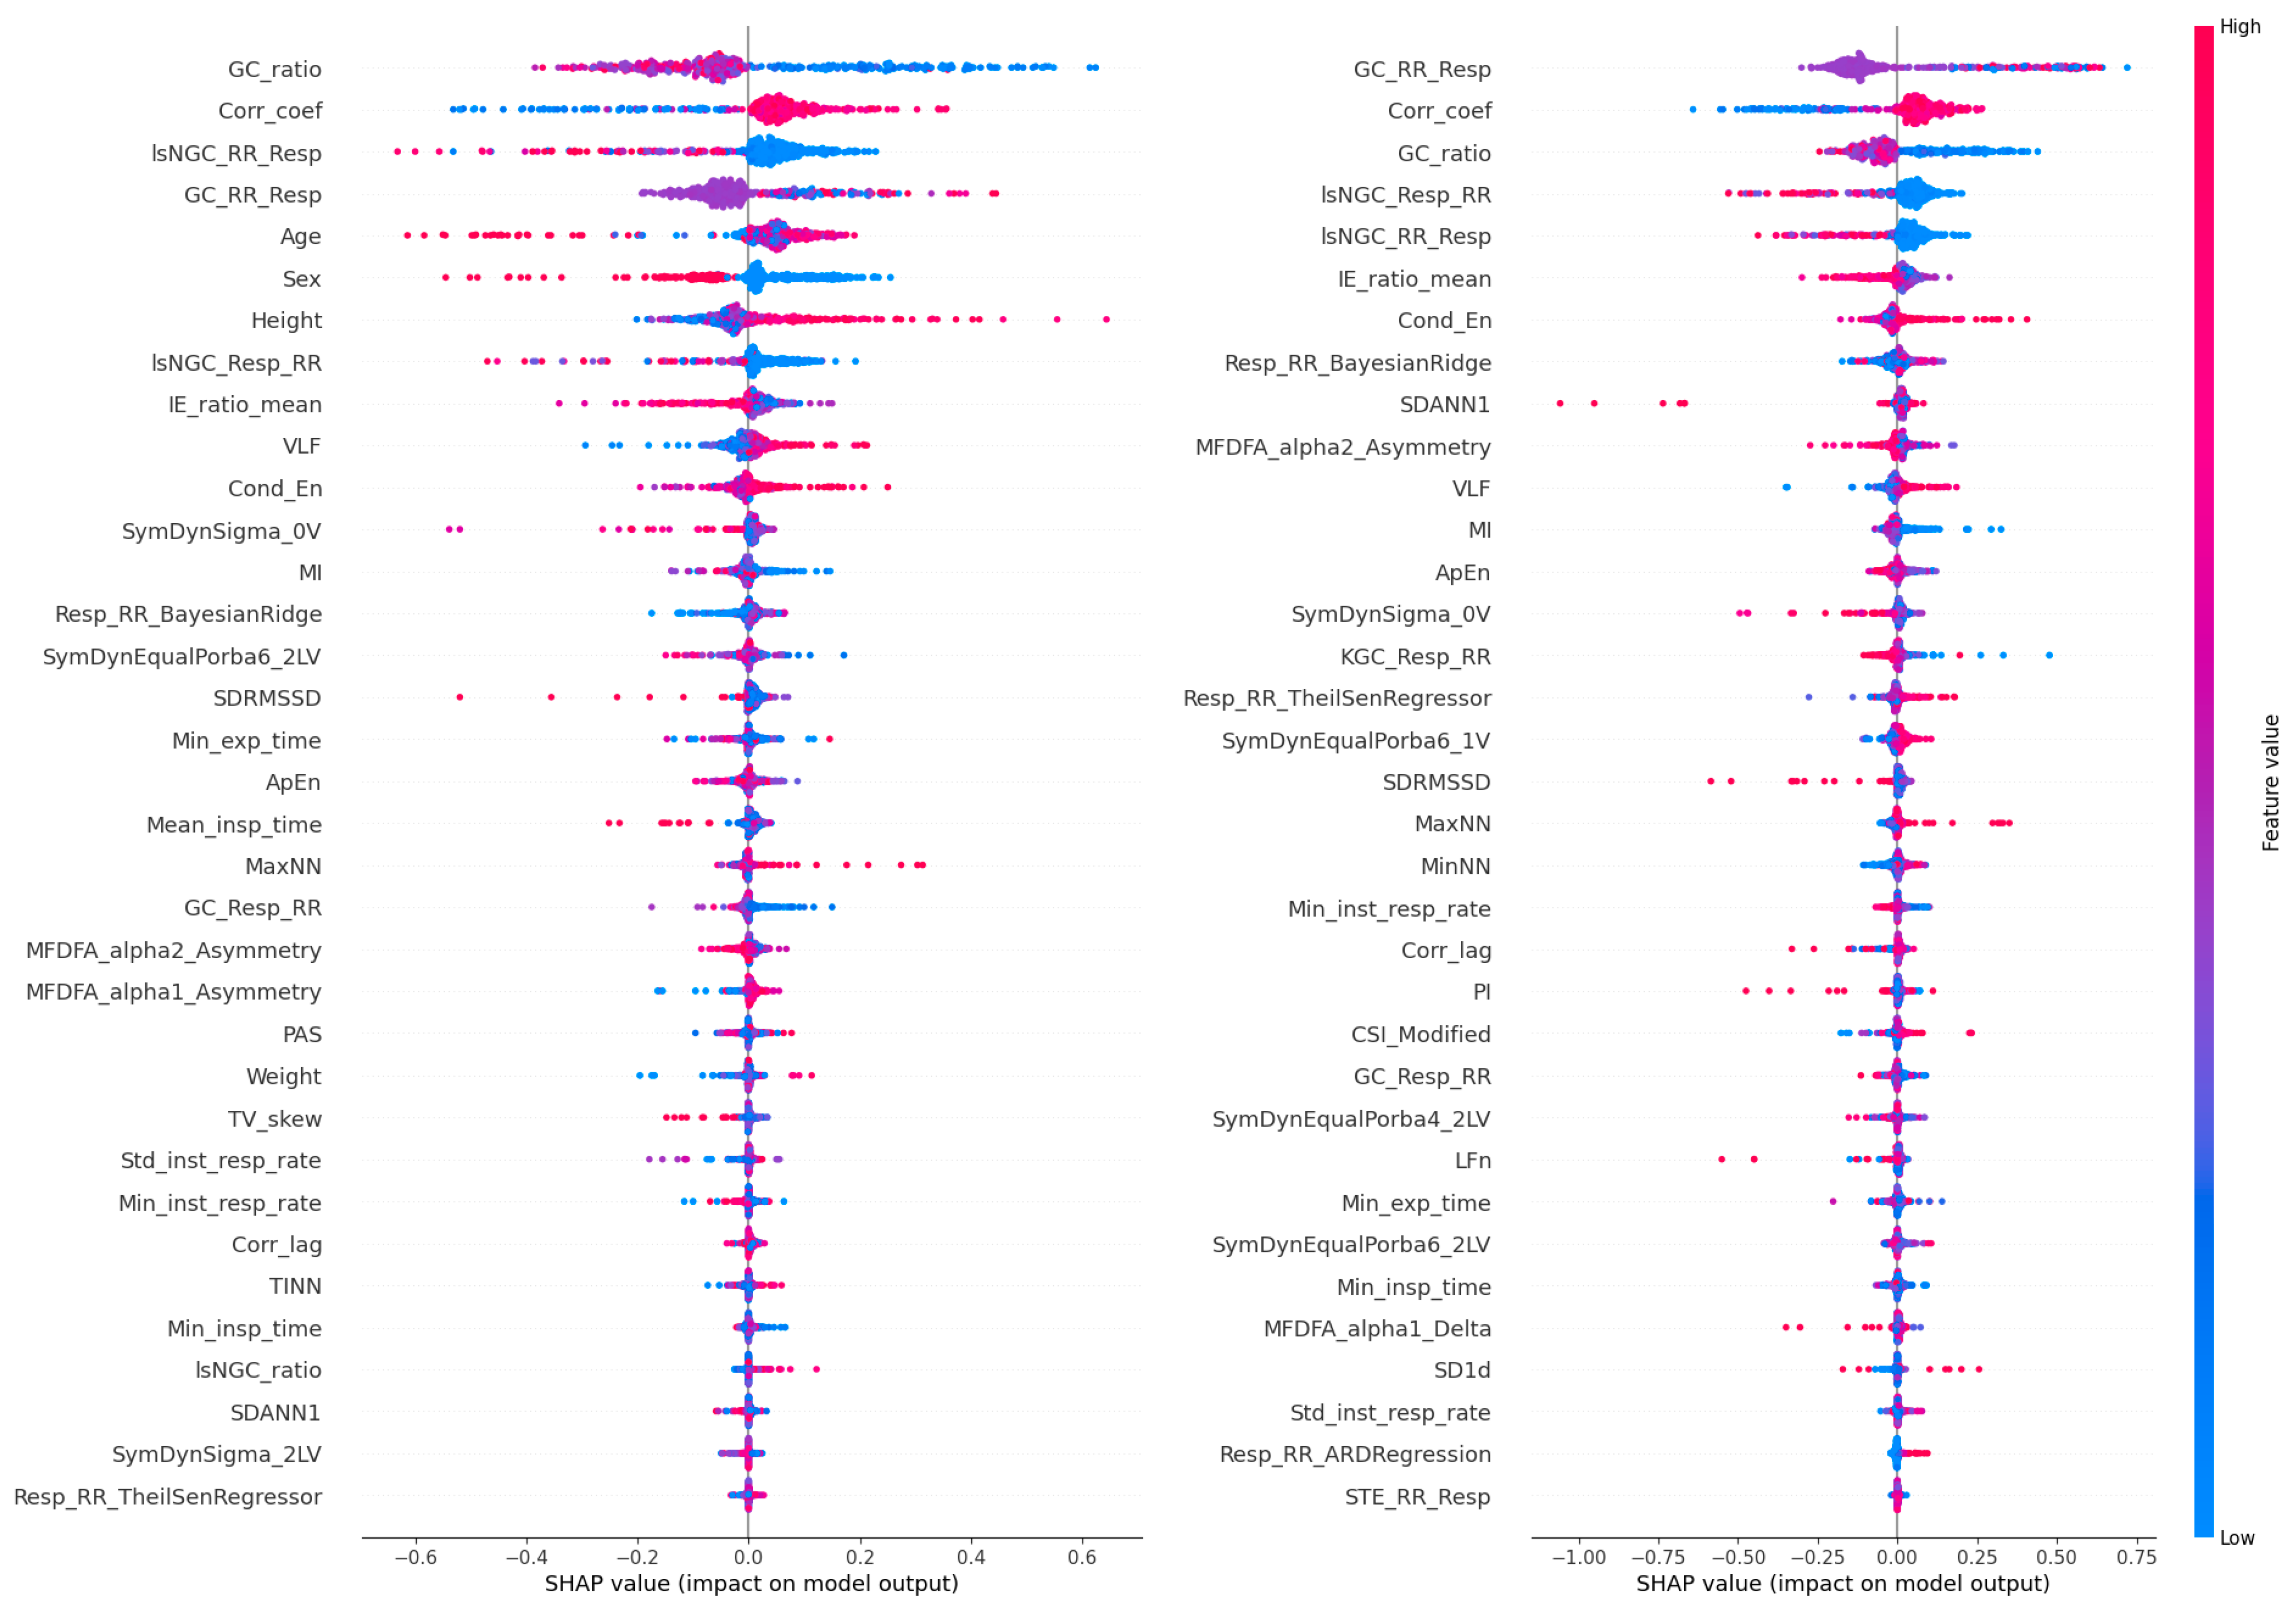
2.5. Explainable AI
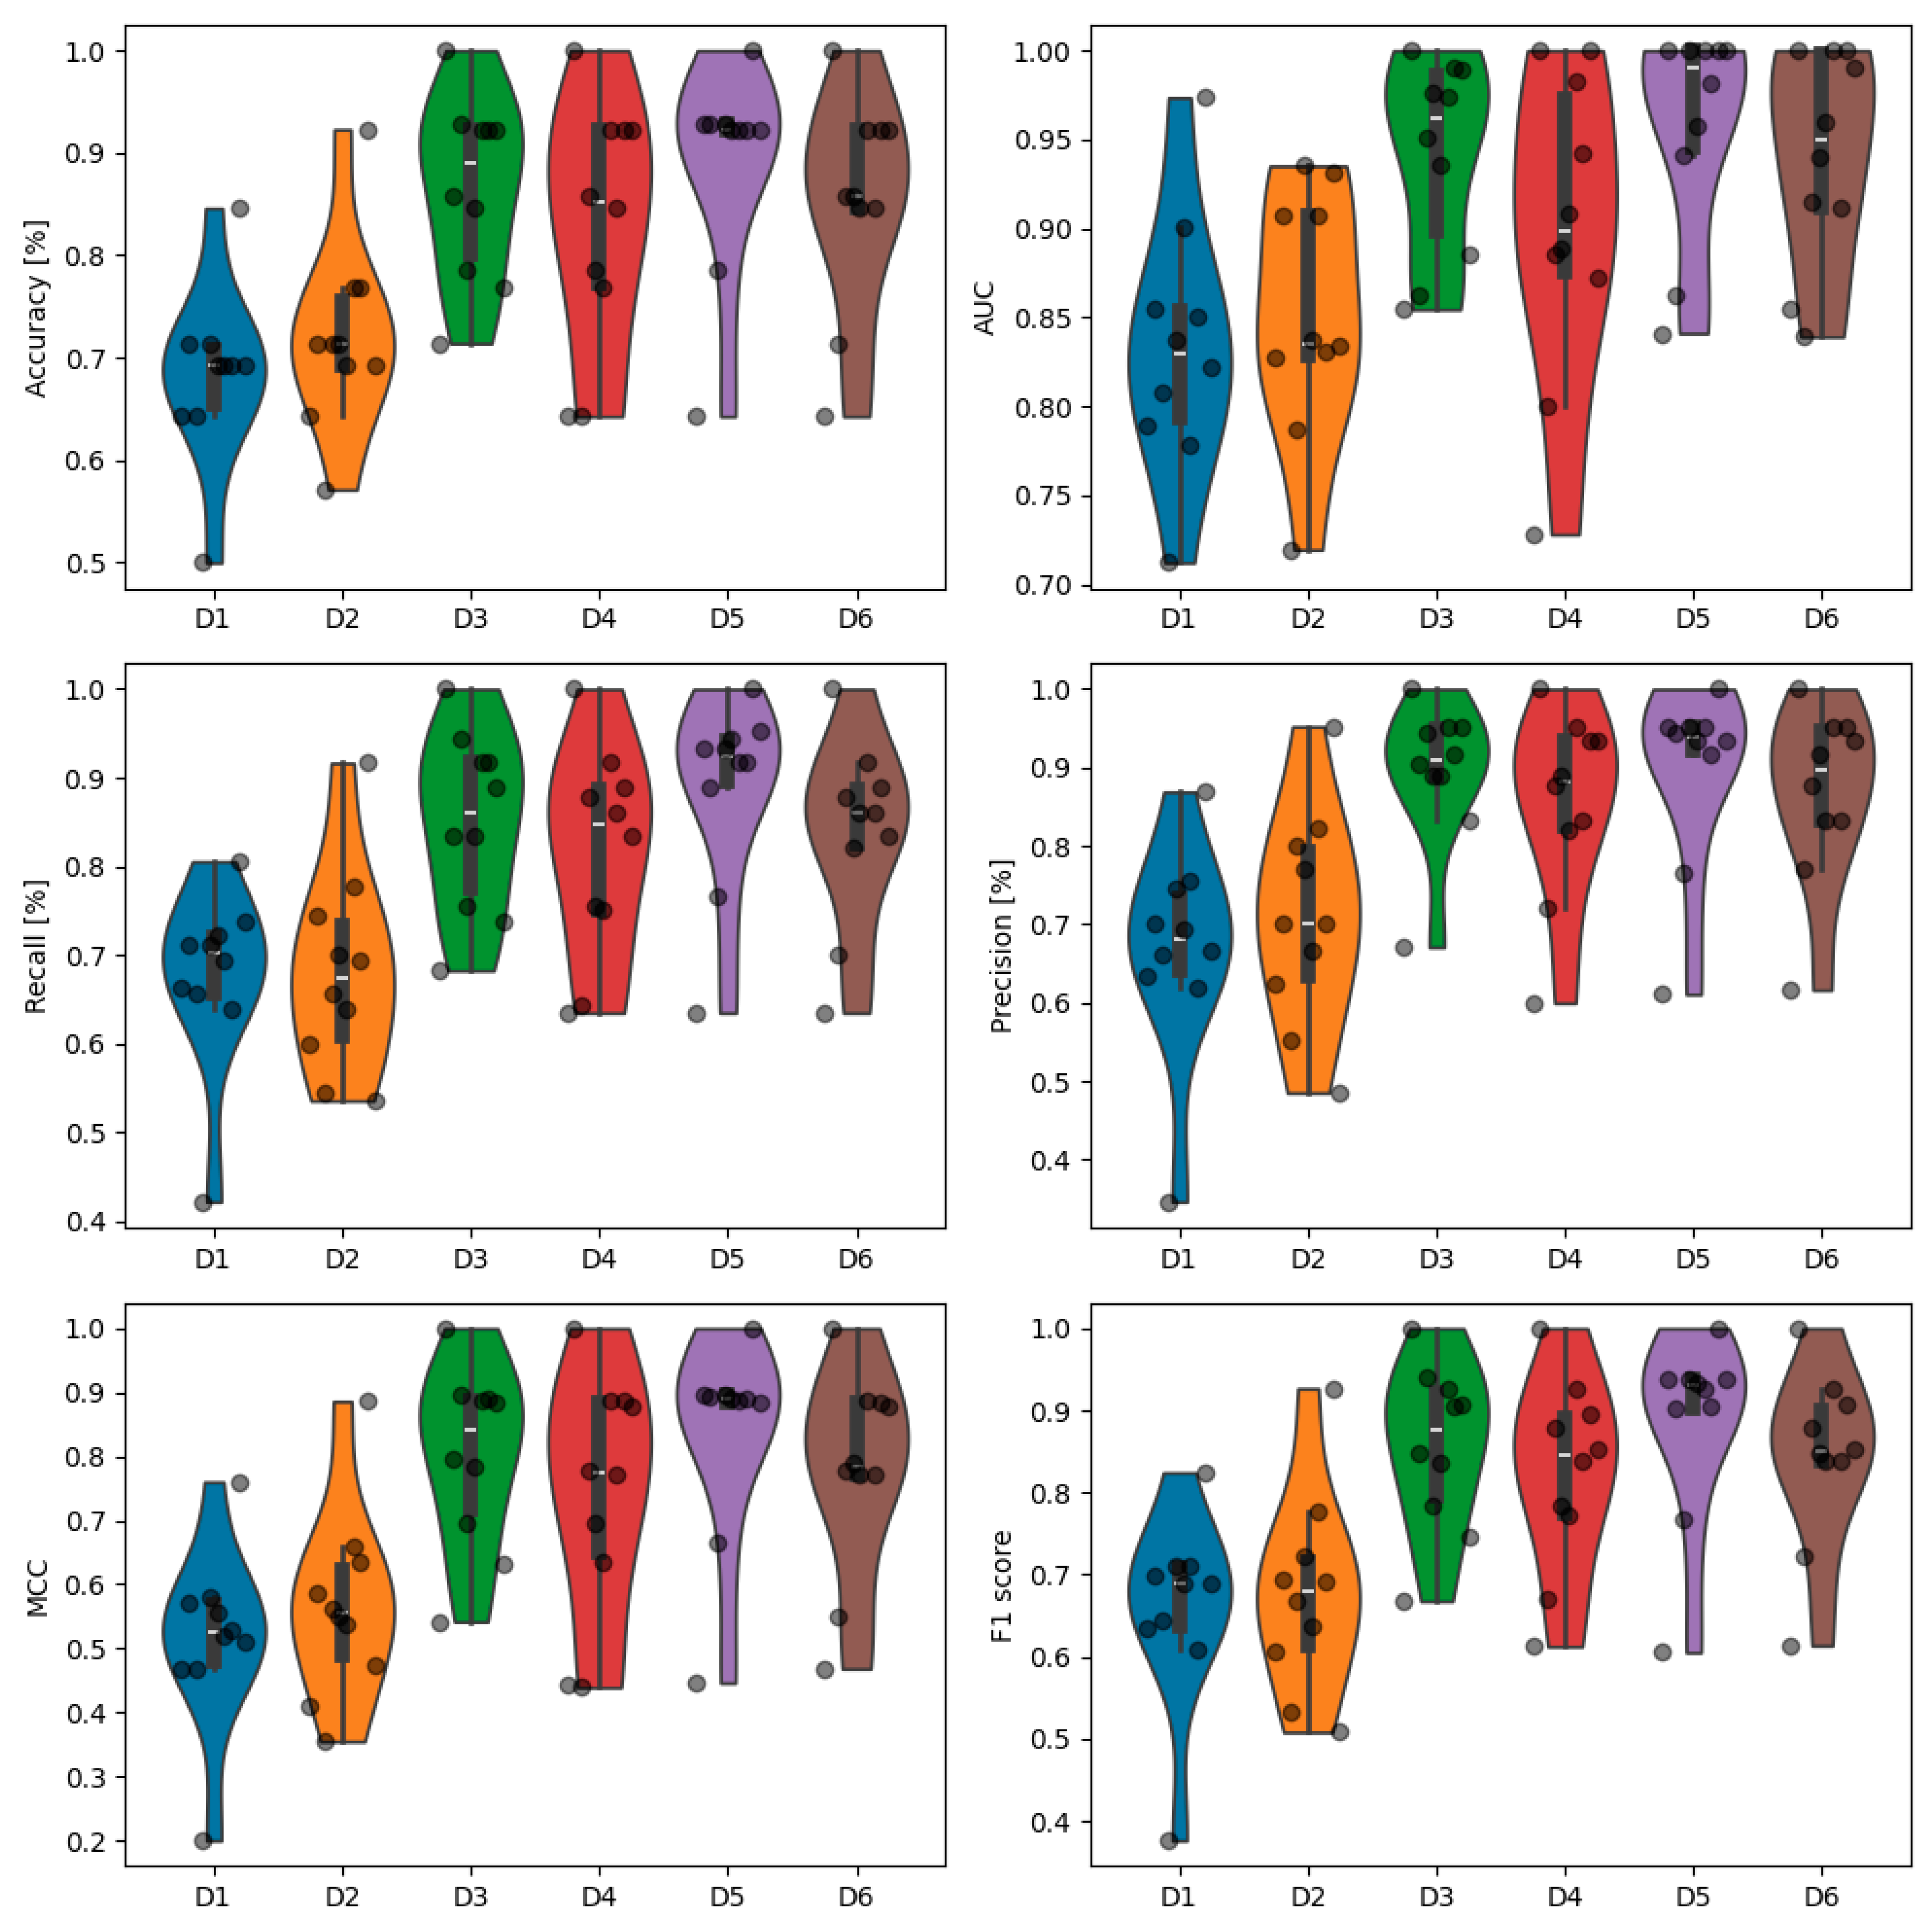
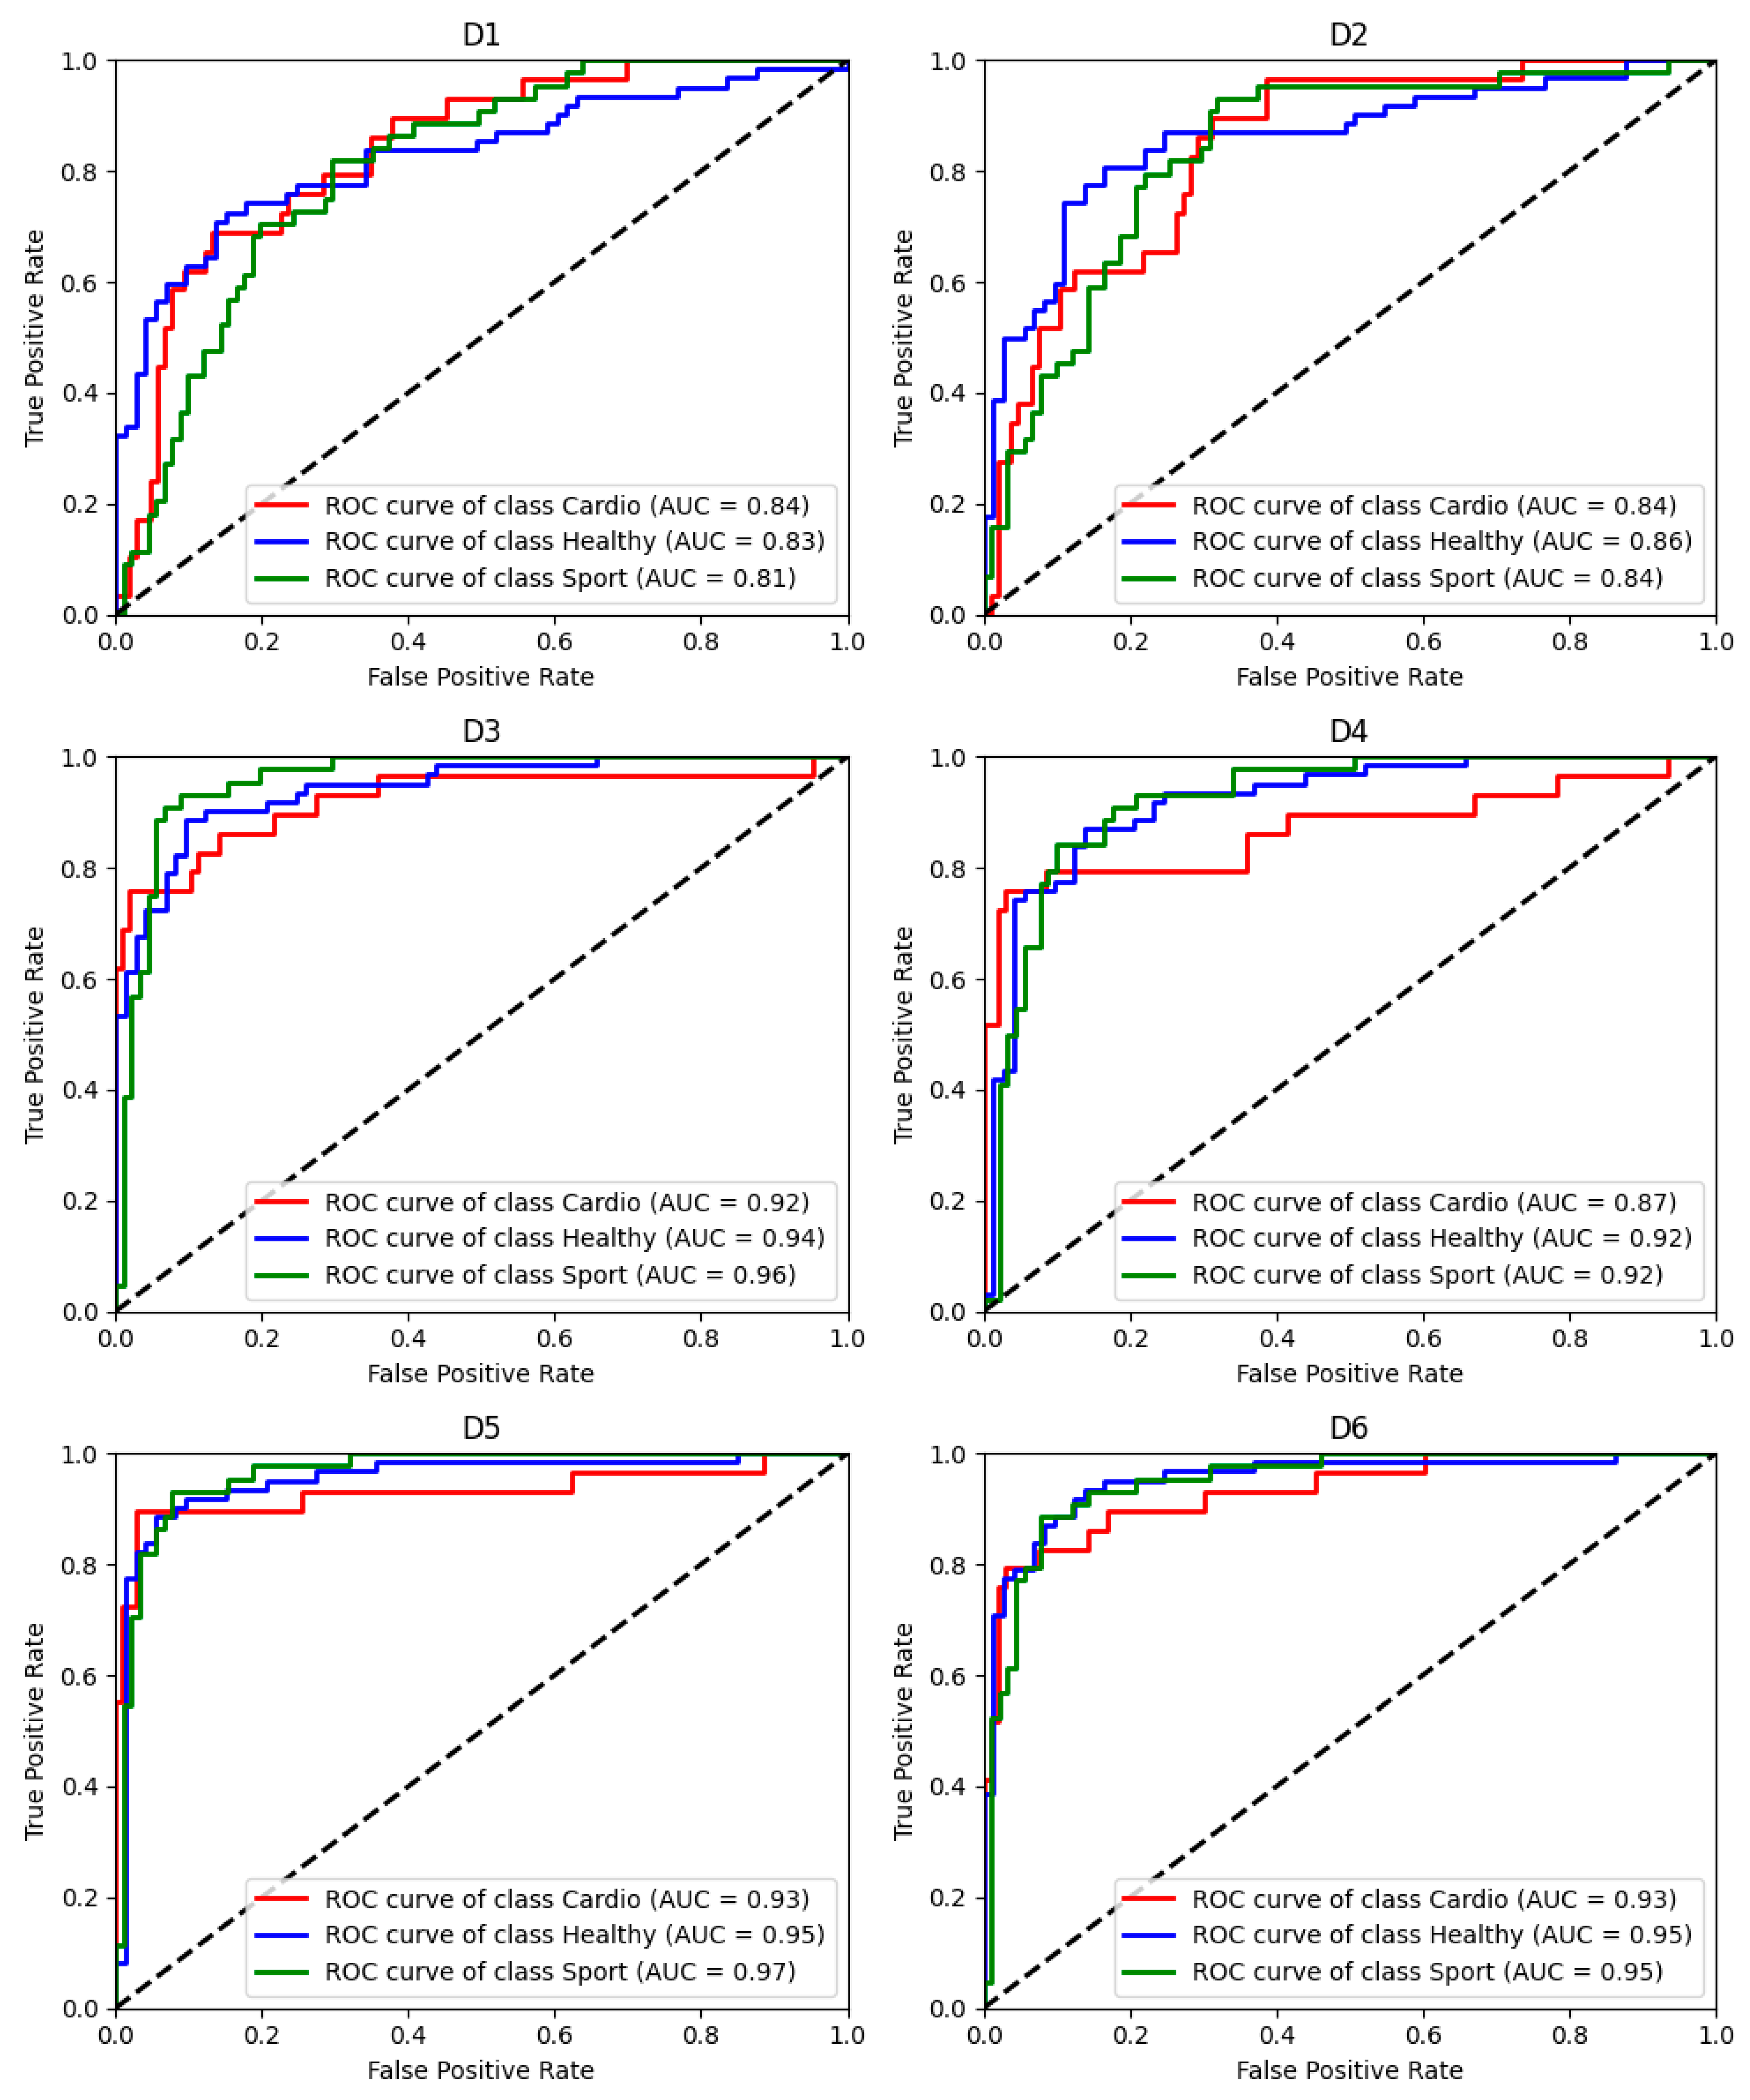
3. Results
4. Discussion
5. Conclusions
Author Contributions
Funding
Institutional Review Board Statement
Informed Consent Statement
Data Availability Statement
Acknowledgments
Conflicts of Interest
Abbreviations
| AUC | Area under the curve |
| BMI | Body mass index |
| CRC | Cardiorespiratory coupling |
| CRF | Cardiorespiratory fitness |
| CPET | Cardiopulmonary exercise test |
| ECG | Electrocardiography |
| GC | Granger causality |
| HRV | Heart rate variability |
| IP | Impedance pneumography |
| lsNGC | Large-scale nonlinear Granger causality |
| MCC | Mathew’s correlation coefficient |
| ML | Machine learning |
| Resp | Respiratory signal |
| RespRate | Respiratory rate |
| ROC | Receiver operating curve |
| RR | Tachogram time series |
| RRi | RR intervals |
| RSA | Respiratory sinus arrhythmia |
| SMOTE | Synthetic minority oversampling technique |
| TV | Tidal volume |
| XAI | Explainable artificial intelligence |
Appendix A
- Sex
- Age
- Weight
- Height
- BMI: Body mass index
- MeanNN: The mean of the RR intervals.
- SDNN: The standard deviation of the RR intervals.
- SDANN1: The standard deviation of average RR intervals extracted from 1-min segments of time series data.
- SDNNI1: The mean of the standard deviations of RR intervals extracted from 1-min segments of time series data.
- RMSSD: The square root of the mean of the squared successive differences between adjacent RR intervals.
- SDSD: The standard deviation of the successive differences between RR intervals.
- CVNN: The standard deviation of the RR intervals (SDNN) divided by the mean of the RR intervals (MeanNN).
- CVSD: The root mean square of successive differences (RMSSD) divided by the mean of the RR intervals (MeanNN).
- MedianNN: The median of the RR intervals.
- MadNN: The median absolute deviation of the RR intervals.
- MCVNN: The median absolute deviation of the RR intervals (MadNN) divided by the median of the RR intervals (MedianNN).
- IQRNN: The interquartile range (IQR) of the RR intervals.
- SDRMSSD: SDNN/RMSSD, a time-domain equivalent for the low Frequency-to-High Frequency (LF/HF) Ratio.
- Prc20NN: The 20th percentile of the RR intervals.
- Prc80NN: The 80th percentile of the RR intervals.
- pNN50: The proportion of RR intervals greater than 50 ms, out of the total number of RR intervals.
- pNN20: The proportion of RR intervals greater than 20 ms, out of the total number of RR intervals.
- MinNN: The minimum of the RR intervals.
- MaxNN: The maximum of the RR intervals.
- HTI: The HRV triangular index, measuring the total number of RR intervals divided by the height of the RR intervals histogram.
- TINN: The baseline width of the RR intervals distribution obtained by triangular interpolation.
- VLF: The spectral power of very low frequencies (0.0033 to 0.04 Hz).
- LF: The spectral power of low frequencies (0.04 to 0.15 Hz).
- HF: The spectral power of high frequencies (0.15 to 0.4 Hz).
- VHF: The spectral power of very high frequencies (0.4 to 0.5 Hz).
- TP: The total spectral power.
- LFHF: The ratio obtained by dividing the low frequency power by the high frequency power.
- LFn: The normalized low frequency, obtained by dividing the low frequency power by the total power.
- HFn: The normalized high frequency, obtained by dividing the low frequency power by the total power.
- LnHF: The log transformed HF.
- SD1: Standard deviation perpendicular to the line of identity.
- SD2: Standard deviation along the identity line. Index of long-term HRV changes.
- SD1SD2: ratio of SD1 to SD2.
- S: Area of ellipse described by SD1 and SD2 (pi * SD1 * SD2).
- CSI: The Cardiac Sympathetic Index calculated by dividing the longitudinal variability of the Poincaré plot (4*SD2) by its transverse variability (4*SD1).
- CVI: The Cardiac Vagal Index equal to the logarithm of the product of longitudinal (4*SD2) and transverse variability (4*SD1).
- CSI_Modified: The modified CSI obtained by dividing the square of the longitudinal variability by its transverse variability.
- GI: Guzik’s Index.
- SI: Slope Index.
- AI: Area Index.
- PI: Porta’s Index.
- SD1d and SD1a: short-term variance of contributions of decelerations (prolongations of RR intervals) and accelerations (shortenings of RR intervals), respectively.
- C1d and C1a: the contributions of heart rate decelerations and accelerations to short-term HRV, respectively.
- SD2d and SD2a: long-term variance of contributions of decelerations (prolongations of RR intervals) and accelerations (shortenings of RR intervals), respectively.
- C2d and C2a: the contributions of heart rate decelerations and accelerations to long-term HRV, respectively.
- SDNNd and SDNNa: total variance of contributions of decelerations (prolongations of RR intervals) and accelerations (shortenings of RR intervals), respectively.
- Cd and Ca: the total contributions of heart rate decelerations and accelerations to HRV.
- PIP: Percentage of inflection points of the RR intervals series.
- IALS: Inverse of the average length of the acceleration/deceleration segments.
- PSS: Percentage of short segments.
- PAS: Percentage of NN intervals in alternation segments.
- DFA_alpha1: The monofractal detrended fluctuation analysis of the HR signal, corresponding to short-term correlations.
- DFA_alpha2: The monofractal detrended fluctuation analysis of the HR signal, corresponding to long-term correlations.
- MFDFA_alpha1_Width, MFDFA_alpha1_Peak, MFDFA_alpha1_Mean, MFDFA_alpha1_Max, MFDFA_alpha1_Delta, MFDFA_alpha1_Asymmetry, MFDFA_alpha1_Fluctuation, MFDFA_alpha1_Increment, MFDFA_alpha2_Width, MFDFA_alpha2_Peak, MFDFA_alpha2_Mean, MFDFA_alpha2_Max, MFDFA_alpha2_Delta, MFDFA_alpha2_Asymmetry, MFDFA_alpha2_Fluctuation, MFDFA_alpha2_Increment: Indices related to the Multifractal Detrended Fluctuation Analysis.
- ApEn: Approximate entropy.
- SampEn: Sample entropy.
- ShanEn: Shannon entropy.
- FuzzyEn: Fuzzy entropy.
- MSEn: Multiscale entropy.
- CMSEn: Composite Multiscale entropy.
- RCMSEn: Refined Composite Multiscale entropy.
- CD: Correlation Dimension.
- HFD: Higuchi’s Fractal Dimension.
- KFD: Katz’s Fractal Dimension.
- LZC: Lempel-Ziv Complexity.
- SymDynMaxMin_0V: Percentage of words in the Max–min method that fall into the 0V family, representing sequences where all three consecutive symbols are equal. This method uses six levels of uniform quantization.
- SymDynMaxMin_1V: Percentage of words in the Max–min method that fall into the 1V family, which includes sequences with only one variation among three consecutive symbols.
- SymDynMaxMin_2LV: Percentage of words in the Max–min method that fall into the 2LV family, representing sequences with two variations in the same direction, forming an increasing or decreasing sequence.
- SymDynMaxMin_2UV: Percentage of words in the Max–min method that fall into the 2UV family, where symbols vary two times in opposite directions, forming a peak or a valley.
- SymDynSigma_0V: Percentage of words in the σ method that fall into the 0V family. The σ method uses three levels defined by the signal average and its variations shifted up and down by a set factor.
- SymDynSigma_1V: Percentage of words in the σ method that fall into the 1V family.
- SymDynSigma_2LV: Percentage of words in the σ method that fall into the 2LV family.
- SymDynSigma_2UV: Percentage of words in the σ method that fall into the 2UV family.
- SymDynEqualPorba4_0V: Percentage of words using the Equal-probability method with four quantization levels (q = 4) that fall into the 0V family.
- SymDynEqualPorba4_1V: Percentage of words using the Equal-probability method with four quantization levels that fall into the 1V family.
- SymDynEqualPorba4_2LV: Percentage of words using the Equal-probability method with four quantization levels that fall into the 2LV family.
- SymDynEqualPorba4_2UV: Percentage of words using the Equal-probability method with four quantization levels that fall into the 2UV family.
- SymDynEqualPorba6_0V: Percentage of words using the Equal-probability method with six quantization levels (q = 6) that fall into the 0V family.
- SymDynEqualPorba6_1V: Percentage of words using the Equal-probability method with six quantization levels that fall into the 1V family.
- SymDynEqualPorba6_2LV: Percentage of words using the Equal-probability method with six quantization levels that fall into the 2LV family.
- SymDynEqualPorba6_2UV: Percentage of words using the Equal-probability method with six quantization levels that fall into the 2UV family.
- RespRate: respiratory rate.
- Std_inst_resp_rate: Standard deviation of instantaneous respiratory rate.
- Min_inst_resp_rate: minimal value of instantaneous respiratory rate.
- Max_inst_resp_rate: maximal value of instantaneous respiratory rate.
- Mean_insp_time: mean inspiration time.
- Min_insp_time: minimal inspiration time.
- Max_insp_time: maximal inspiration time.
- Std_insp_time: standard deviation of inspiration time.
- Mean_exp_time:mean expiration time.
- Min_exp_time: minimal expiration time.
- Max_exp_time: maximal expiration time.
- Std_exp_time: standard deviation of expiration time.
- TV_std: standard deviation of tidal volume normalized by median tidal volume.
- TV_q25: 25th quantile of tidal volume normalized by median tidal volume.
- TV_q75: 75th quantile of tidal volume normalized by median tidal volume.
- TV_skew: skewness of tidal volume normalized by median tidal volume.
- TV_kurtosis: kurtosis of tidal volume normalized by median tidal volume.
- IE_ratio_mean: mean inspiration/expiration ratio.
- GC_RR_Resp: Granger causality from tachogram to respiratory signal.
- GC_Resp_RR: Granger causality from respiratory signal to tachogram.
- STE_RR_Resp: Symbolic transfer entropy from tachogram to respiratory signal.
- STE_Resp_RR: Symbolic transfer entropy from respiratory signal to tachogram.
- Resp_RR_SVR: Granger causality from respiratory signal to tachogram calculated using Support Vector Regression (SVR).
- RR_Resp_SVR: Granger causality from tachogram to respiratory signal calculated using Support Vector Regression (SVR).
- Resp_RR_BayesianRidge: Granger causality from respiratory signal to tachogram calculated using Bayesian Ridge Regression.
- KGC_Resp_RR: Granger causality from respiratory signal to tachogram calculated using Kernel Granger Causality (KGC).
- KGC_RR_Resp: Granger causality from Tachogram to respiratory signal calculated using Kernel Granger Causality (KGC).
- RR_Resp_GradientBoostingRegressor: Granger causality from tachogram to respiratory signal calculated using Gradient Boosting Regressor.
- Resp_RR_GradientBoostingRegressor: Granger causality from respiratory signal to tachogram calculated using Gradient Boosting Regressor.
- RR_Resp_TheilSenRegressor: Granger causality from tachogram to respiratory signal calculated using Theil-Sen Regressor.
- Resp_RR_TheilSenRegressor: Granger causality from respiratory signal to tachogram calculated using Theil-Sen Regressor.
- RR_Resp_ARDRegression: Granger causality from tachogram to respiratory signal calculated using Automatic Relevance Determination (ARD) Regression.
- Resp_RR_ARDRegression: Granger causality from respiratory signal to tachogram calculated using Automatic Relevance Determination (ARD) Regression.
- RR_Resp_RandomForestRegressor: Granger causality from tachogram to respiratory signal calculated using Random Forest Regression.
- Resp_RR_RandomForestRegressor: Granger causality from respiratory signal to tachogram calculated using Random Forest Regression.
- lsNGC_RR_Resp: Large scale-nonlinear Granger causality from tachogram to respiratory signal.
- lsNGC_Resp_RR: Large scale-nonlinear Granger causality from respiratory signal to tachogram.
- Corr_coef: Highest values of the Pearson correlation coefficient between respiratory and cardiac signals for lag between −1 and 1 s.
- Corr_lag: Value of the lag for which the highest Pearson correlation coefficient was obtained.
- MI: Mutual information.
- AI: Active information.
- Block_En: Block entropy.
- Cond_En: Conditional entropy.
- En_rate: Entropy rate.
- Trans_En: Transfer entropy
- Perm_En: Permutation entropy.
- KGC_ratio: ratio of KGC_Resp_RR and KGC_RR_Resp.
- GC_ratio: ratio of GC_Resp_RR and GC_RR_Resp.
- STE_ratiols: ratio of STE_Resp_RR and STE_RR_Resp.
- lsNGC_ratio: ratio of lsNGC_Resp_RR and lsNGC_RR_Resp.
References
- Zeid, S.; Buch, G.; Velmeden, D.; Söhne, J.; Schulz, A.; Schuch, A.; Tröbs, S.-O.; Heidorn, M.W.; Müller, F.; Strauch, K.; et al. Heart rate variability: Reference values and role for clinical profile and mortality in individuals with heart failure. Clin. Res. Cardiol. 2023, 113, 1317–1330. [Google Scholar] [CrossRef] [PubMed]
- Pham, T.; Lau, Z.J.; Chen, S.H.A.; Makowski, D. Heart rate variability in psychology: A review of hrv indices and an analysis tutorial. Sensors 2021, 21, 3998. [Google Scholar] [CrossRef] [PubMed]
- Mol, M.B.A.; Strous, M.T.A.; van Osch, F.H.M.; Vogelaar, F.J.; Barten, D.G.; Farchi, M.; Foudraine, N.A.; Gidron, Y. Heart-rate-variability (HRV), predicts outcomes in COVID-19. PLoS ONE 2021, 16, e0258841. [Google Scholar] [CrossRef]
- Stepanyan, L.; Lalayan, G. Heart rate variability features and their impact on athletes’ sports performance. J. Phys. Educ. Sport 2023, 23, 2156–2163. [Google Scholar] [CrossRef]
- Shah, S.A.; Velardo, C.; Farmer, A.; Tarassenko, L. Exacerbations in chronic obstructive pulmonary disease: Identification and prediction using a digital health system. J. Med. Internet Res. 2017, 19, e69. [Google Scholar] [CrossRef] [PubMed]
- O’donnell, D. Ventilatory limitations in chronic obstructive pulmonary disease. Med. Sci. Sports Exerc. 2001, 33, S647–S655. [Google Scholar] [CrossRef] [PubMed]
- Ginsburg, A.S.; Lenahan, J.L.; Izadnegahdar, R.; Ansermino, J.M. A systematic review of tools to measure respiratory rate in order to identify childhood pneumonia. Am. J. Respir. Crit. Care Med. 2018, 197, 1116–1127. [Google Scholar] [CrossRef]
- Porta, A.; Gelpi, F.; Bari, V.; Cairo, B.; De Maria, B.; Tonon, D.; Rossato, G.; Ranucci, M.; Faes, L. Categorizing the Role of Respiration in Cardiovascular and Cerebrovascular Variability Interactions. IEEE Trans. Biomed. Eng. 2022, 69, 2065–2076. [Google Scholar] [CrossRef]
- Porta, A.; Bassani, T.; Bari, V.; Pinna, G.D.; Maestri, R.; Guzzetti, S. Accounting for respiration is necessary to reliably infer granger causality from cardiovascular variability series. IEEE Trans. Biomed. Eng. 2011, 59, 832–841. [Google Scholar] [CrossRef]
- de Abreu, R.M.; Cairo, B.; Porta, A. On the significance of estimating cardiorespiratory coupling strength in sports medicine. Front. Netw. Physiol. 2023, 2, 1114733. [Google Scholar] [CrossRef]
- Dick, T.E.; Hsieh, Y.H.; Dhingra, R.R.; Baekey, D.M.; Galán, R.F.; Wehrwein, E.; Morris, K.F. Cardiorespiratory coupling: Common rhythms in cardiac, sympathetic, and respiratory activities. Prog. Brain Res. 2014, 209, 191–205. [Google Scholar] [CrossRef] [PubMed]
- Vinik, A.I. The conductor of the autonomic orchestra. Front. Endocrinol. 2012, 3, 22505. [Google Scholar] [CrossRef] [PubMed]
- Młyńczak, M.; Krysztofiak, H. Cardiorespiratory temporal causal links and the differences by sport or lack thereof. Front. Physiol. 2019, 10, 45. [Google Scholar] [CrossRef] [PubMed]
- Rosol, M.; Gasior, J.S.; Walecka, I.; Werner, B.; Cybulski, G.; Mlynczak, M. Causality in cardiorespiratory signals in pediatric cardiac patients. In Proceedings of the 2022 44th Annual International Conference of the IEEE Engineering in Medicine & Biology Society (EMBC), Glasgow, UK, 11–15 July 2022. [Google Scholar] [CrossRef]
- Schumann, A.; Fleckenstein, B.; Bär, K.-J. Nonlinear causal influences assessed by mutual compression entropy. Curr. Dir. Biomed. Eng. 2016, 2, 221–224. [Google Scholar] [CrossRef]
- Faes, L.; Porta, A.; Nollo, G. Testing frequency-domain causality in multivariate time series. IEEE Trans. Biomed. Eng. 2010, 57, 1897–1906. [Google Scholar] [CrossRef]
- Müller, A.; Kraemer, J.F.; Penzel, T.; Bonnemeier, H.; Kurths, J.; Wessel, N. Causality in physiological signals. Physiol. Meas. 2016, 37, R46–R72. [Google Scholar] [CrossRef]
- Rosoł, M.; Młyńczak, M.; Cybulski, G. Granger causality test with nonlinear neural-network-based methods: Python package and simulation study. Comput. Methods Programs Biomed. 2022, 216, 106669. [Google Scholar] [CrossRef]
- Wismüller, A.; Dsouza, A.M.; Vosoughi, M.A.; Abidin, A. Large-scale nonlinear Granger causality for inferring directed dependence from short multivariate time-series data. Sci. Rep. 2021, 11, 7817. [Google Scholar] [CrossRef]
- Marinazzo, D.; Pellicoro, M.; Stramaglia, S. Kernel method for nonlinear granger causality. Phys. Rev. Lett. 2008, 100, 144103. [Google Scholar] [CrossRef]
- Pompe, B.; Blidh, P.; Hoyer, D.; Eiselt, M. Using mutual information to measure coupling in the cardiorespiratory system. IEEE Eng. Med. Biol. Mag. 1998, 17, 32–39. [Google Scholar] [CrossRef]
- Porta, A.; Guzzetti, S.; Montano, N.; Pagani, M.; Somers, V.; Malliani, A.; Baselli, G.; Cerutti, S. Information domain analysis of cardiovascular variability signals: Evaluation of regularity, synchronisation and co-ordination. Med. Biol. Eng. Comput. 2000, 38, 180–188. [Google Scholar] [CrossRef]
- Schulz, S.; Adochiei, F.-C.; Edu, I.-R.; Schroeder, R.; Costin, H.; Bär, K.-J.; Voss, A. Cardiovascular and cardiorespiratory coupling analyses: A review. Philos. Trans. R. Soc. A Math. Phys. Eng. Sci. 2013, 371, 20120191. [Google Scholar] [CrossRef] [PubMed]
- Mlynczak, M. Temporal orders and causal vector for physiological data analysis. In Proceedings of the Annual International Conference of the IEEE Engineering in Medicine and Biology Society, EMBS, Montreal, QC, Canada, 20–24 July 2020. [Google Scholar] [CrossRef]
- Krittanawong, C.; Virk, H.U.H.; Bangalore, S.; Wang, Z.; Johnson, K.W.; Pinotti, R.; Zhang, H.; Kaplin, S.; Narasimhan, B.; Kitai, T.; et al. Machine learning prediction in cardiovascular diseases: A meta-analysis. Sci. Rep. 2020, 10, 16057. [Google Scholar] [CrossRef] [PubMed]
- Kufel, J.; Bargieł-Łączek, K.; Kocot, S.; Koźlik, M.; Bartnikowska, W.; Janik, M.; Czogalik, Ł.; Dudek, P.; Magiera, M.; Lis, A.; et al. What Is Machine Learning, Artificial Neural Networks and Deep Learning?—Examples of Practical Applications in Medicine. Diagnostics 2023, 13, 2582. [Google Scholar] [CrossRef] [PubMed]
- MacEachern, S.J.; Forkert, N.D. Machine learning for precision medicine. Genome 2021, 64, 416–425. [Google Scholar] [CrossRef]
- Chinni, B.K.; Manlhiot, C. Emerging Analytical Approaches for Personalized Medicine Using Machine Learning In Pediatric and Congenital Heart Disease. Can. J. Cardiol. 2024, 40, 1880–1896. [Google Scholar] [CrossRef]
- Hughes, A.; Shandhi, M.H.; Master, H.; Dunn, J.; Brittain, E. Wearable Devices in Cardiovascular Medicine. Circ. Res. 2023, 132, 652–670. [Google Scholar] [CrossRef]
- Loh, H.W.; Ooi, C.P.; Seoni, S.; Barua, P.D.; Molinari, F.; Acharya, U.R. Application of explainable artificial intelligence for healthcare: A systematic review of the last decade (2011–2022). Comput. Methods Programs Biomed. 2022, 226, 107161. [Google Scholar] [CrossRef]
- Albahri, A.; Duhaim, A.M.; Fadhel, M.A.; Alnoor, A.; Baqer, N.S.; Alzubaidi, L.; Albahri, O.; Alamoodi, A.; Bai, J.; Salhi, A.; et al. A systematic review of trustworthy and explainable artificial intelligence in healthcare: Assessment of quality, bias risk, and data fusion. Inf. Fusion 2023, 96, 156–191. [Google Scholar] [CrossRef]
- De Cannière, H.; Corradi, F.; Smeets, C.J.P.; Schoutteten, M.; Varon, C.; Van Hoof, C.; Van Huffel, S.; Groenendaal, W.; Vandervoort, P. Wearable monitoring and interpretable machine learning can objectively track progression in patients during cardiac rehabilitation. Sensors 2020, 20, 3601. [Google Scholar] [CrossRef]
- Nazaret, A.; Tonekaboni, S.; Darnell, G.; Ren, S.Y.; Sapiro, G.; Miller, A.C. Modeling personalized heart rate response to exercise and environmental factors with wearables data. npj Digit. Med. 2023, 6, 207. [Google Scholar] [CrossRef] [PubMed]
- Serantoni, C.; Zimatore, G.; Bianchetti, G.; Abeltino, A.; De Spirito, M.; Maulucci, G. Unsupervised Clustering of Heartbeat Dynamics Allows for Real Time and Personalized Improvement in Cardiovascular Fitness. Sensors 2022, 22, 3974. [Google Scholar] [CrossRef]
- Cui, J.; Huang, Z.; Jiaerken, D.; Fan, Y.; Zhao, S.; Zhang, L.; Wu, J. A wearable system for cardiopulmonary assessment and personalized respiratory training. Futur. Gener. Comput. Syst. 2020, 112, 1131–1140. [Google Scholar] [CrossRef]
- Raghuveer, G.; Hartz, J.; Lubans, D.R.; Takken, T.; Wiltz, J.L.; Mietus-Snyder, M.; Perak, A.M.; Baker-Smith, C.; Pietris, N.; Edwards, N.M. Cardiorespiratory Fitness in Youth: An Important Marker of Health: A Scientific Statement From the American Heart Association. Circulation 2020, 142, E101–E118. [Google Scholar] [CrossRef] [PubMed]
- Bermejo-Cantarero, A.; Álvarez-Bueno, C.; Martínez-Vizcaino, V.; Redondo-Tébar, A.; Pozuelo-Carrascosa, D.P.; Sánchez-López, M. Relationship between both cardiorespiratory and muscular fitness and health-related quality of life in children and adolescents: A systematic review and meta-analysis of observational studies. Health Qual. Life Outcomes 2021, 19, 127. [Google Scholar] [CrossRef]
- García-Hermoso, A.; Ramírez-Vélez, R.; García-Alonso, Y.; Alonso-Martínez, A.M.; Izquierdo, M. Association of Cardiorespiratory Fitness Levels during Youth with Health Risk Later in Life: A Systematic Review and Meta-analysis. JAMA Pediatr. 2020, 174, 952–960. [Google Scholar] [CrossRef]
- McKay, A.K.A.; Stellingwerff, T.; Smith, E.S.; Martin, D.T.; Mujika, I.; Goosey-Tolfrey, V.L.; Sheppard, J.; Burke, L.M. Defining Training and Performance Caliber: A Participant Classification Framework. Int. J. Sports Physiol. Perform. 2022, 17, 317–331. [Google Scholar] [CrossRef] [PubMed]
- Araújo, C.G.S.; Scharhag, J. Athlete: A working definition for medical and health sciences research. Scand. J. Med. Sci. Sports 2016, 26, 4–7. [Google Scholar] [CrossRef]
- Młyńczak, M.; Żyliński, M.; Niewiadomski, W.; Cybulski, G. Ambulatory Devices Measuring Cardiorespiratory Activity with Motion. In BIODEVICES 2017—10th International Conference on Biomedical Electronics and Devices, Proceedings; Part of 10th International Joint Conference on Biomedical Engineering Systems and Technologies, BIOSTEC 2017; SciTePress: Setúbal, Portugal, 2017. [Google Scholar] [CrossRef]
- Gąsior, J.S.; Młyńczak, M.; Rosoł, M.; Wieniawski, P.; Walecka, I.; Cybulski, G.; Werner, B. Validity of the Pneumonitor for RR intervals acquisition for short-term heart rate variability analysis extended with respiratory data in pediatric cardiac patients. Kardiologia Polska 2023, 81, 491–500. [Google Scholar] [CrossRef]
- Młyńczak, M.; Cybulski, G. Flow parameters derived from impedance pneumography after nonlinear calibration based on neural networks. In BIOSIGNALS 2017—10th International Conference on Bio-Inspired Systems and Signal Processing, Proceedings; Part of 10th International Joint Conference on Biomedical Engineering Systems and Technologies, BIOSTEC 2017; SciTePress: Setúbal, Portugal, 2017; Volume 4. [Google Scholar] [CrossRef]
- Młyńczak, M.; Cybulski, G. Decomposition of the cardiac and respiratory components from impedance pneumography signals. In BIOSIGNALS 2017—10th International Conference on Bio-Inspired Systems and Signal Processing, Proceedings; Part of 10th International Joint Conference on Biomedical Engineering Systems and Technologies, BIOSTEC 2017; SciTePress: Setúbal, Portugal, 2017; Volume 4. [Google Scholar] [CrossRef]
- Seppä, V.-P.; Hyttinen, J.; Uitto, M.; Chrapek, W.; Viik, J. Novel electrode configuration for highly linear impedance pneumography. Biomed. Eng./Biomed. Tech. 2013, 58, 35–38. [Google Scholar] [CrossRef]
- Młyńczak, M.; Niewiadomski, W.; Żyliński, M.; Cybulski, G. Assessment of calibration methods on impedance pneumography accuracy. Biomed. Eng./Biomed. Tech. 2016, 61, 587–593. [Google Scholar] [CrossRef] [PubMed]
- Makowski, D.; Pham, T.; Lau, Z.J.; Brammer, J.C.; Lespinasse, F.; Pham, H.; Schölzel, C.; Chen, S.H.A. NeuroKit2: A Python toolbox for neurophysiological signal processing. Behav. Res. Methods 2021, 53, 1689–1696. [Google Scholar] [CrossRef] [PubMed]
- Cysarz, D.; Porta, A.; Montano, N.; Leeuwen, P.; Kurths, J.; Wessel, N. Quantifying heart rate dynamics using different approaches of symbolic dynamics. Eur. Phys. J. Spéc. Top. 2013, 222, 487–500. [Google Scholar] [CrossRef]
- Granger, C.W.J. Investigating Causal Relations by Econometric Models and Cross-spectral Methods. Econometrica 1969, 37, 424–438. [Google Scholar] [CrossRef]
- Rosoł, M. Nonlincausality—PyPI. 2021. Available online: https://pypi.org/project/nonlincausality/ (accessed on 28 November 2024).
- Rosoł, M. Classification Code. 2024. Available online: https://github.com/Mrosol/Cardiac_Healthy_Sport_classification (accessed on 28 November 2024).
- Chawla, N.V.; Bowyer, K.W.; Hall, L.O.; Kegelmeyer, W.P. SMOTE: Synthetic minority over-sampling technique. J. Artif. Intell. Res. 2002, 16, 321–357. [Google Scholar] [CrossRef]
- Baniecki, H.; Kretowicz, W.; Piatyszek, P.; Wisniewski, J.; Biecek, P. Dalex: Responsible machine learning with interactive explainability and fairness in python. J. Mach. Learn. Res. 2021, 22, 1–7. [Google Scholar]
- Lundberg, S.M.; Lee, S.I. A unified approach to interpreting model predictions. Adv. Neural Inf. Process Syst. 2017, 2017, 4768–4777. [Google Scholar]
- Rosoł, M.; Petelczyc, M.; Gąsior, J.S.; Młyńczak, M. Prediction of peak oxygen consumption using cardiorespiratory parameters from warmup and submaximal stage of treadmill cardiopulmonary exercise test. PLoS ONE 2024, 19, e0291706. [Google Scholar] [CrossRef] [PubMed]
- Gąsior, J.S.; Sacha, J.; Pawłowski, M.; Zieliński, J.; Jeleń, P.J.; Tomik, A.; Książczyk, T.M.; Werner, B.; Dąbrowski, M.J. Normative values for heart rate variability parameters in school-aged children: Simple approach considering differences in average heart rate. Front. Physiol. 2018, 9, 1495. [Google Scholar] [CrossRef]
- Berntson, G.G.; Cacioppo, J.T.; Quigley, K.S. Respiratory sinus arrhythmia: Autonomic origins, physiological mechanisms, and psychophysiological implications. Psychophysiology 1993, 30, 183–196. [Google Scholar] [CrossRef]
- Shaffer, F.; Ginsberg, J.P. An Overview of Heart Rate Variability Metrics and Norms. Front. Public Health 2017, 5, 258. [Google Scholar] [CrossRef]
- de Abreu, R.M.; Cairo, B.; Rehder-Santos, P.; da Silva, C.D.; Signini, D.F.; Milan-Mattos, J.C.; Sakaguchi, C.A.; Catai, A.M.; Porta, A. Cardiorespiratory coupling is associated with exercise capacity in athletes: A cross-sectional study. Respir. Physiol. Neurobiol. 2024, 320, 104198. [Google Scholar] [CrossRef]
- de Abreu, R.M.; Porta, A.; Rehder-Santos, P.; Cairo, B.; Sakaguchi, C.A.; da Silva, C.D.; Signini, D.F.; Milan-Mattos, J.C.; Catai, A.M. Cardiorespiratory coupling strength in athletes and non-athletes. Respir. Physiol. Neurobiol. 2022, 305, 103943. [Google Scholar] [CrossRef] [PubMed]
- Da Silva, C.D.; Catai, A.M.; de Abreu, R.M.; Signini, D.F.; Galdino, G.A.M.; Lorevice, L.; Santos, L.M.; Mendes, R.G. Cardiorespiratory coupling as an early marker of cardiac autonomic dysfunction in type 2 diabetes mellitus patients. Respir. Physiol. Neurobiol. 2023, 311, 104042. [Google Scholar] [CrossRef] [PubMed]
- Hietakoste, S.; Armañac-Julián, P.; Karhu, T.; Bailón, R.; Sillanmäki, S.; Töyräs, J.; Leppänen, T.; Myllymaa, S.; Kainulainen, S. Acute cardiorespiratory coupling impairment in worsening sleep apnea-related intermittent hypoxemia. IEEE Trans. Biomed. Eng. 2023, 71, 326–333. [Google Scholar] [CrossRef] [PubMed]
- Yoon, H.; Choi, S.H.; Bin Kwon, H.; Kim, S.K.; Hwang, S.H.; Oh, S.M.; Choi, J.-W.; Lee, Y.J.; Jeong, D.-U.; Park, K.S. Sleep-Dependent Directional Coupling of Cardiorespiratory System in Patients with Obstructive Sleep Apnea. IEEE Trans. Biomed. Eng. 2018, 65, 2847–2854. [Google Scholar] [CrossRef] [PubMed]
- Freyschuss, U.; Melcher, A. Sinus Arrhythmia in Man: Influence of Tidal Volume and Oesophageal Pressure. Scand. J. Clin. Lab. Investig. 1975, 35, 487–496. [Google Scholar] [CrossRef]
- Porta, A.; Castiglioni, P.; Di Rienzo, M.; Bassani, T.; Bari, V.; Faes, L.; Nollo, G.; Cividjan, A.; Quintin, L. Cardiovascular control and time domain Granger causality: Insights from selective autonomic blockade. Philos. Trans. R. Soc. A Math. Phys. Eng. Sci. 2013, 371, 20120161. [Google Scholar] [CrossRef]
- Kim, J.K.; Kang, S. Neural Network-Based Coronary Heart Disease Risk Prediction Using Feature Correlation Analysis. J. Health Eng. 2017, 2017, 2780501. [Google Scholar] [CrossRef]
- Inbar, O.; Inbar, O.; Reuveny, R.; Segel, M.; Greenspan, H.; Scheinowitz, M. A Machine Learning Approach to Classify Exercise Limitation Severity Using Cardiopulmonary Exercise Testing—Development and Validation. Med. Res. Arch. 2023, 11. [Google Scholar] [CrossRef]
- Cauwenberghs, N.; Sente, J.; Van Criekinge, H.; Sabovčik, F.; Ntalianis, E.; Haddad, F.; Claes, J.; Claessen, G.; Budts, W.; Goetschalckx, K.; et al. Integrative Interpretation of Cardiopulmonary Exercise Tests for Cardiovascular Outcome Prediction: A Machine Learning Approach. Diagnostics 2023, 13, 2051. [Google Scholar] [CrossRef] [PubMed]
- Varisco, G.; Peng, Z.; Kommers, D.; Zhan, Z.; Cottaar, W.; Andriessen, P.; Long, X.; van Pul, C. Central apnea detection in premature infants using machine learning. Comput. Methods Programs Biomed. 2022, 226, 107155. [Google Scholar] [CrossRef] [PubMed]
- Levett, D.; Jack, S.; Swart, M.; Carlisle, J.; Wilson, J.; Snowden, C.; Riley, M.; Danjoux, G.; Ward, S.; Older, P.; et al. Perioperative cardiopulmonary exercise testing (CPET): Consensus clinical guidelines on indications, organization, conduct, and physiological interpretation. Br. J. Anaesth. 2018, 120, 484–500. [Google Scholar] [CrossRef]
- Pastore, E.; Turchetta, A.; Attias, L.; Calzolari, A.; Giordano, U.; Squitieri, C.; Parisi, F. Cardiorespiratory functional assessment after pediatric heart transplantation. Pediatr. Transplant. 2001, 5, 425–429. [Google Scholar] [CrossRef] [PubMed]
- Hauser, C.; Lichtenstein, E.; Nebiker, L.; Streese, L.; Köchli, S.; Infanger, D.; Faude, O.; Hanssen, H. Cardiorespiratory fitness and development of childhood cardiovascular risk: The EXAMIN YOUTH follow-up study. Front. Physiol. 2023, 14, 1243434. [Google Scholar] [CrossRef]
- Akamagwuna, U.; Badaly, D. Pediatric Cardiac Rehabilitation: A Review. Curr. Phys. Med. Rehabil. Rep. 2019, 7, 67–80. [Google Scholar] [CrossRef]
- Adami, P.E.; Squeo, M.R.; Quattrini, F.M.; Di Paolo, F.M.; Pisicchio, C.; Di Giacinto, B.; Lemme, E.; Maestrini, V.; Pelliccia, A. Pre-participation health evaluation in adolescent athletes competing at Youth Olympic Games: Proposal for a tailored protocol. Br. J. Sports Med. 2019, 53, 1111–1116. [Google Scholar] [CrossRef]
- Düking, P.; Hotho, A.; Holmberg, H.-C.; Fuss, F.K.; Sperlich, B. Comparison of non-invasive individual monitoring of the training and health of athletes with commercially available wearable technologies. Front. Physiol. 2016, 7, 71. [Google Scholar] [CrossRef]
- Gąsior, J.S.; Sacha, J.; Jeleń, P.J.; Pawłowski, M.; Werner, B.; Dąbrowski, M.J. Interaction between heart rate variability and heart rate in pediatric population. Front. Physiol. 2015, 6, 385. [Google Scholar] [CrossRef]
- Fleming, S.; Thompson, M.; Stevens, R.; Heneghan, C.; Plüddemann, A.; Maconochie, I.; Tarassenko, L.; Mant, D. Normal ranges of heart rate and respiratory rate in children from birth to 18 years of age: A systematic review of observational studies. Lancet 2011, 377, 1011–1018. [Google Scholar] [CrossRef]
- Gąsior, J.S.; Rosoł, M.; Młyńczak, M.; Flatt, A.A.; Hoffmann, B.; Baranowski, R.; Werner, B. Reliability of Symbolic Analysis of Heart Rate Variability and Its Changes During Sympathetic Stimulation in Elite Modern Pentathlon Athletes: A Pilot Study. Front. Physiol. 2022, 13, 829887. [Google Scholar] [CrossRef] [PubMed]
- Cysarz, D.; Edelhauser, F.; Javorka, M.; Montano, N.; Porta, A. On the Relevance of Symbolizing Heart Rate Variability by Means of a Percentile-Based Coarse Graining Approach. Physiol. Meas. 2018, 39. [Google Scholar] [CrossRef] [PubMed]
- Wismüller, A. Large-Scale Nonlinear Granger Causality Code. 2021. Available online: https://github.com/Large-scale-causality-inference/Large-scale-nonlinear-causality (accessed on 28 November 2024).
- PyInform Package. Available online: https://elife-asu.github.io/PyInform/ (accessed on 28 November 2024).


| Dataset | Demographic Data | Cardiological Features | Respiratory Features | Causal and Information Domain Features |
|---|---|---|---|---|
| D1 | + | + | ||
| D2 | + | + | + | |
| D3 | + | + | + | + |
| D4 | + | + | + |
| Cardiac | Healthy | Sport | Overall | |
|---|---|---|---|---|
| N | 29 | 62 | 44 | 135 |
| Male/female | 20/9 | 33/29 | 44/0 | 97/38 |
| Age | 13.1 ± 3.5 (6–17) | 11.0 ± 2.2 (7–15) | 13.3 ± 1.4 (10–15) | 12.2 ± 2.6 (6–17) |
| Body mass [kg] | 57.1 ± 21.0 (23.0–95.0) | 43.5 ± 12.1 (21.4–75.6) | 57.2 ± 13.6 (30.0–81.8) | 50.9 ± 16.4 (21.4–95.0) |
| Height [cm] | 160.4 ± 17.2 (123–184) | 151.2 ± 13.1 (123–183) | 169.4 ± 12.7 (135–190) | 159.1 ± 16.0 (123–190) |
| HR [beats/min] | 72.8 ± 13.3 (56.0–100.5) | 79.4 ± 10.2 (60.7–100.5) | 76.9 ± 15.0 (46.7–121.4) | 77.2 ± 12.8 (46.7–121.4) |
| RMSSD [ms] | 55.3 ± 36.8 (9.4–140.7) | 61.8 ± 34.4 (13.0–162.3) | 68.2 ± 46.7 (5.6–178.9) | 62.5 ± 39.6 (5.6–178.9) |
| RespRate [breaths/min] | 18.5 ± 4.6 (7.9–25.4) | 18.8 ± 3.5 (10.7–28.5) | 17.1 ± 3.5 (10.2–25.8) | 18.2 ± 3.8 (7.9–28.5) |
| D1 | D2 | D3 | D4 | D5 | D6 | |
|---|---|---|---|---|---|---|
| Accuracy [%] | 68.3 ± 8.1 | 72.0 ± 8.7 | 86.7 ± 8.4 | 83.1 ± 11.5 | 89.1 ± 9.6 | 85.3 ± 10.0 |
| AUC | 83.2 ± 6.7 | 85.2 ± 6.5 | 94.2 ± 5.2 | 90.1 ± 8.3 | 95.8 ± 5.7 | 94.1 ± 5.7 |
| Recall [%] | 67.6 ± 9.6 | 68.1 ± 10.9 | 85.1 ± 9.6 | 81.6 ± 11.2 | 88.9 ± 10.2 | 84.0 ± 9.9 |
| Precision [%] | 66.9 ± 12.7 | 70.8 ± 13.0 | 89.5 ± 8.6 | 85.6 ± 11.3 | 89.6 ± 11.1 | 86.9 ± 10.6 |
| MCC | 0.516 ± 0.132 | 0.566 ± 0.140 | 0.801 ± 0.133 | 0.742 ± 0.180 | 0.835 ± 0.151 | 0.778 ± 0.152 |
| F1 score | 0.659 ± 0.109 | 0.676 ± 0.114 | 0.856 ± 0.095 | 0.823 ± 0.111 | 0.885 ± 0.109 | 0.843 ± 0.102 |
| ML algorithm | XGBoost Classifier | Logistic Regression | Gradient Boosting | Gradient Boosting | Gradient Boosting | Gradient Boosting |
| Upsampling strategy | 200/200/200 | 200/200/150 | 200/200/200 | 200/200/200 | 200/200/200 | 200/200/200 |
Disclaimer/Publisher’s Note: The statements, opinions and data contained in all publications are solely those of the individual author(s) and contributor(s) and not of MDPI and/or the editor(s). MDPI and/or the editor(s) disclaim responsibility for any injury to people or property resulting from any ideas, methods, instructions or products referred to in the content. |
© 2024 by the authors. Licensee MDPI, Basel, Switzerland. This article is an open access article distributed under the terms and conditions of the Creative Commons Attribution (CC BY) license (https://creativecommons.org/licenses/by/4.0/).
Share and Cite
Rosoł, M.; Gąsior, J.S.; Korzeniewski, K.; Łaba, J.; Makuch, R.; Werner, B.; Młyńczak, M. Machine Learning Classification of Pediatric Health Status Based on Cardiorespiratory Signals with Causal and Information Domain Features Applied—An Exploratory Study. J. Clin. Med. 2024, 13, 7353. https://doi.org/10.3390/jcm13237353
Rosoł M, Gąsior JS, Korzeniewski K, Łaba J, Makuch R, Werner B, Młyńczak M. Machine Learning Classification of Pediatric Health Status Based on Cardiorespiratory Signals with Causal and Information Domain Features Applied—An Exploratory Study. Journal of Clinical Medicine. 2024; 13(23):7353. https://doi.org/10.3390/jcm13237353
Chicago/Turabian StyleRosoł, Maciej, Jakub S. Gąsior, Kacper Korzeniewski, Jonasz Łaba, Robert Makuch, Bożena Werner, and Marcel Młyńczak. 2024. "Machine Learning Classification of Pediatric Health Status Based on Cardiorespiratory Signals with Causal and Information Domain Features Applied—An Exploratory Study" Journal of Clinical Medicine 13, no. 23: 7353. https://doi.org/10.3390/jcm13237353
APA StyleRosoł, M., Gąsior, J. S., Korzeniewski, K., Łaba, J., Makuch, R., Werner, B., & Młyńczak, M. (2024). Machine Learning Classification of Pediatric Health Status Based on Cardiorespiratory Signals with Causal and Information Domain Features Applied—An Exploratory Study. Journal of Clinical Medicine, 13(23), 7353. https://doi.org/10.3390/jcm13237353