
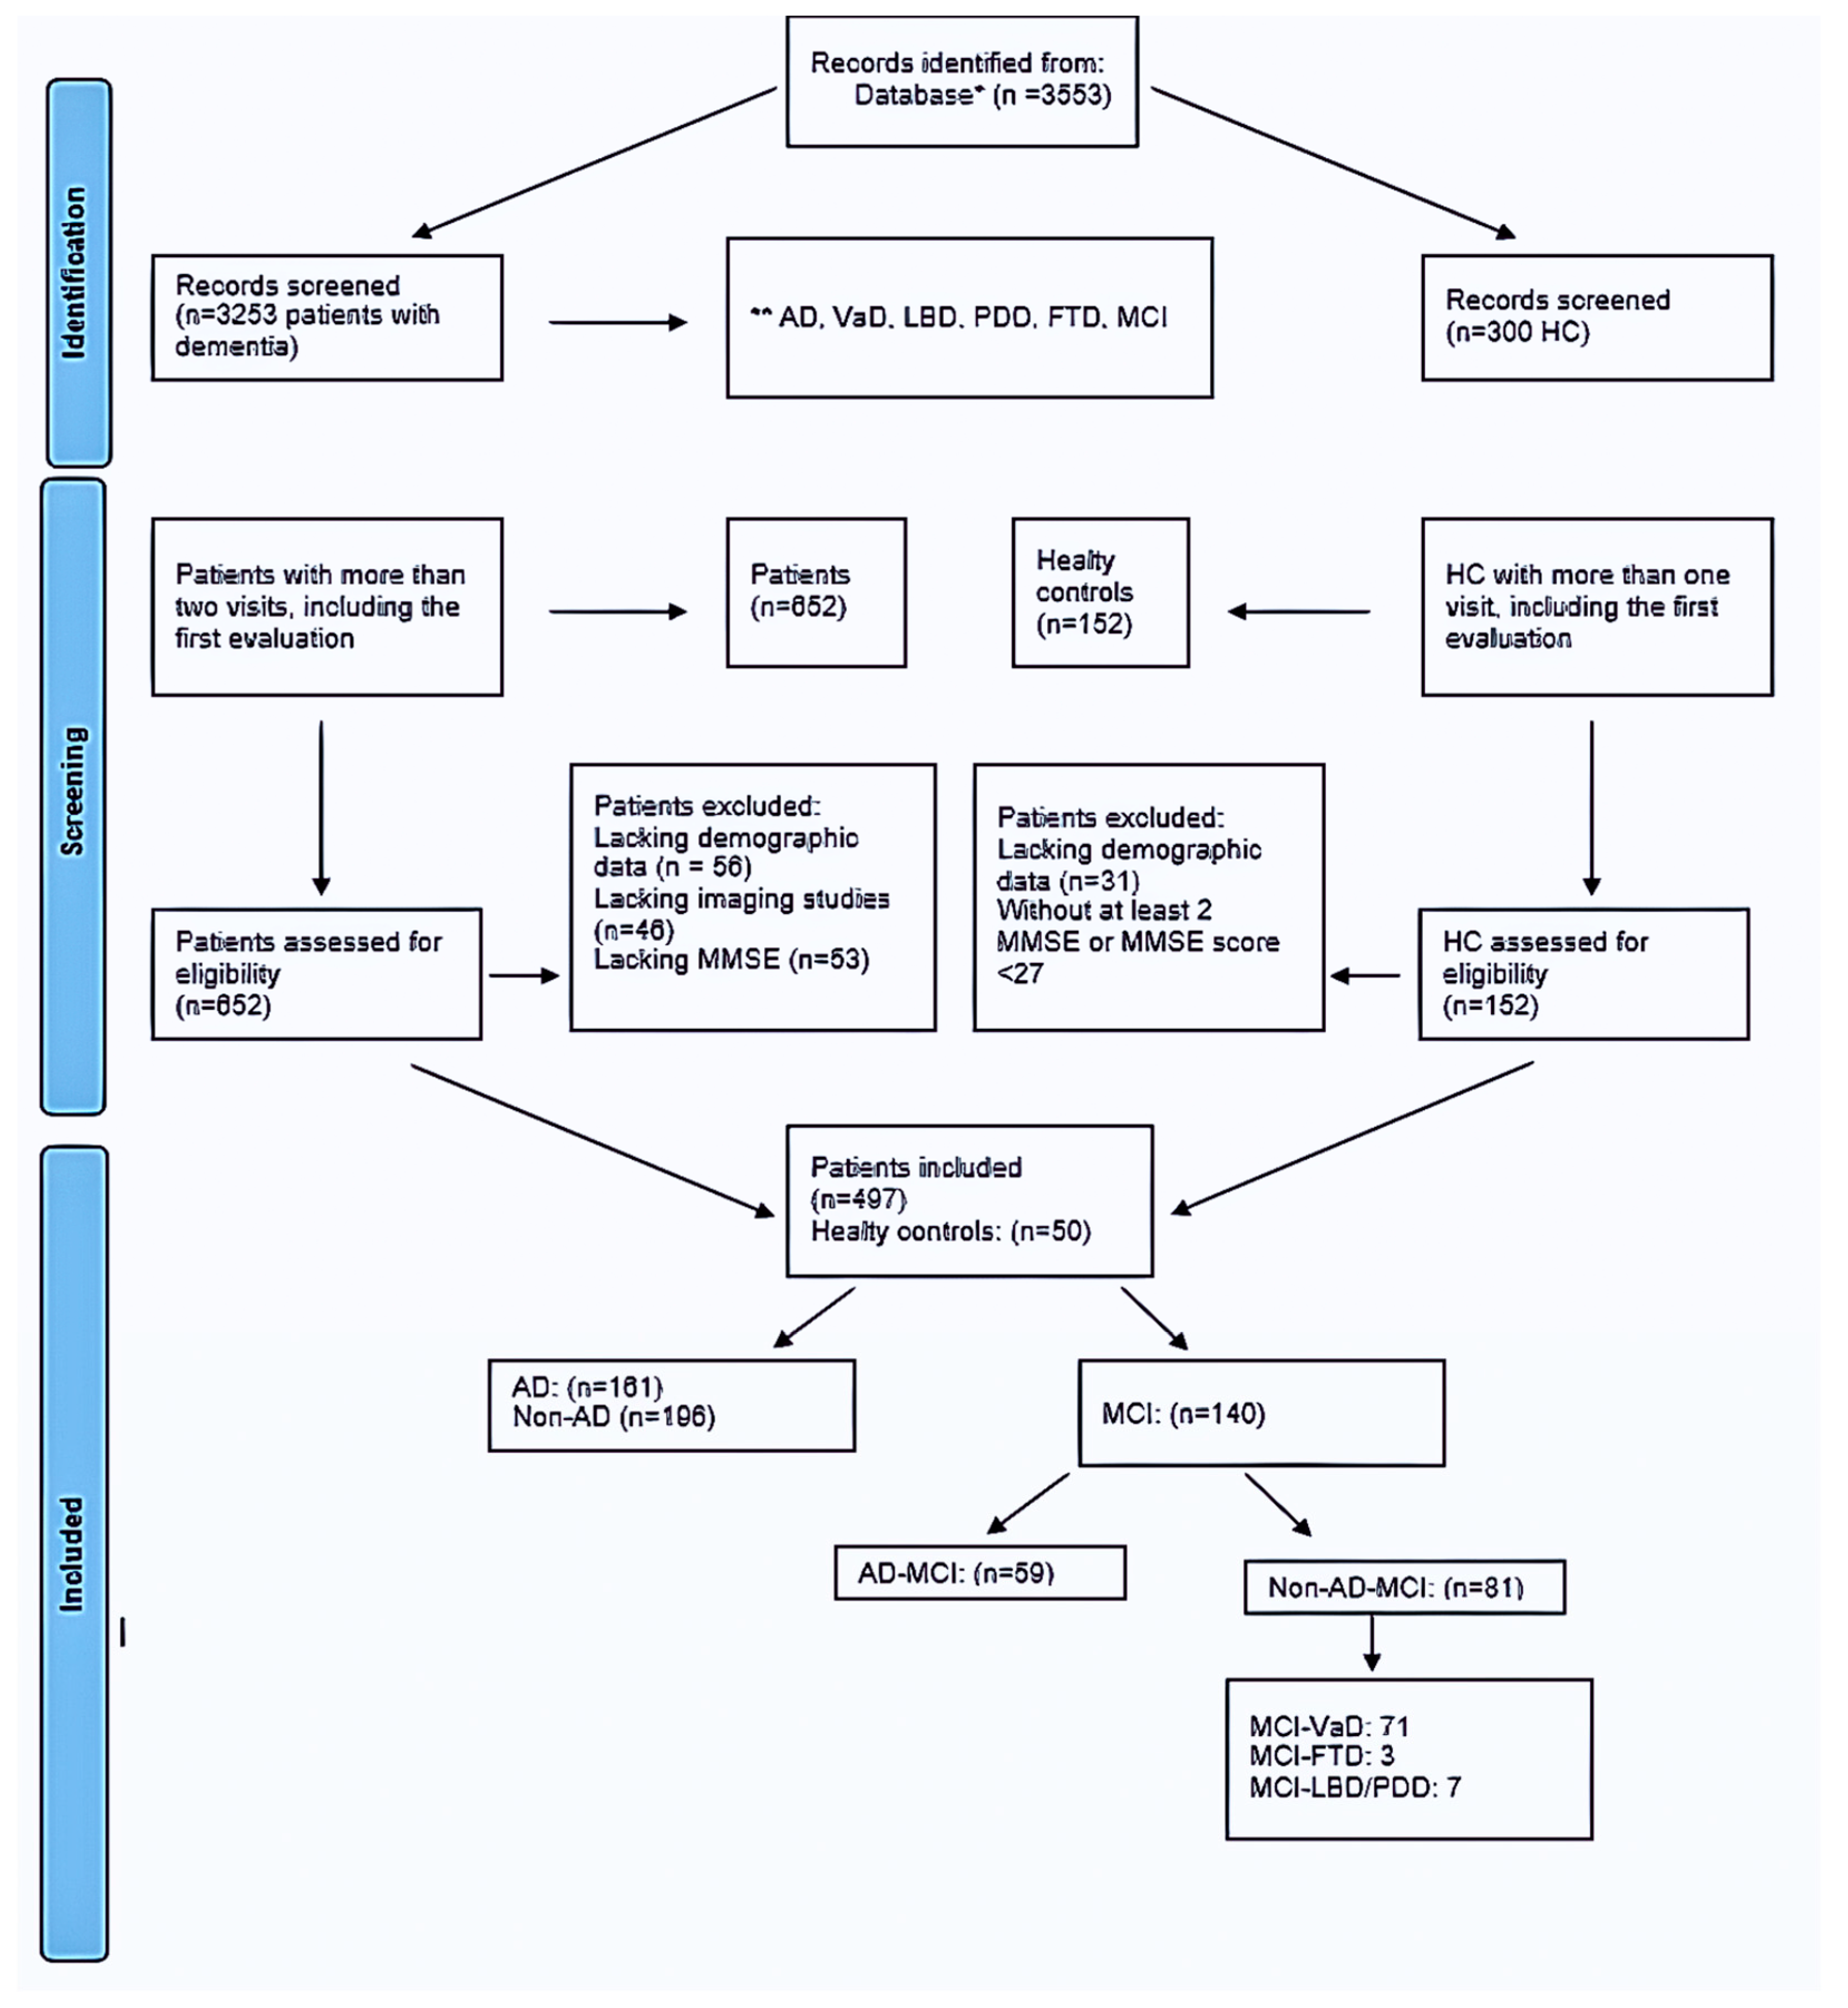
Mild Cognitive Impairment Progression and Alzheimer’s Disease Risk: A Comprehensive Analysis of 3553 Cases over 203 Months


Abstract
1. Introduction
- -
- Define the long-term progression of MCI in a comprehensive longitudinal follow-up data set under the same senior author’s supervision.
- -
- Differentiate from the healthy elders.
- -
- Define the effect of the type of dementia on the process.
- -
- Define the potential cofactors on the progression to project some clues for further studies.
2. Materials and Methods
2.1. Data Collection and Patient Selection
- -
- Over 18 years of age and under 85 years of age.
- -
- To have signed the voluntary consent form.
- -
- No known neurodegenerative, toxic, metabolic, malignant, etc. diseases requiring treatment.
- -
- No recent history of head trauma or history of recurrent head trauma in the past.
- -
- No major psychiatric disorder requiring treatment for more than 6 months in the past.
- -
- No history of alcohol or substance abuse.
2.2. Statistical Analysis
3. Results
4. Discussion
4.1. Implications
4.2. Limitations
5. Conclusions
Author Contributions
Funding
Institutional Review Board Statement
Informed Consent Statement
Data Availability Statement
Acknowledgments
Conflicts of Interest
References
- Jongsiriyanyong, S.; Limpawattana, P. Mild Cognitive Impairment in Clinical Practice: A Review Article. Am. J. Alzheimers Dis. Other Dementias 2018, 33, 500–507. [Google Scholar] [CrossRef] [PubMed]
- Petersen, R.C.; Lopez, O.; Armstrong, M.J.; Getchius, T.S.D.; Ganguli, M.; Gloss, D.; Gronseth, G.S.; Marson, D.; Pringsheim, T.; Day, G.S.; et al. Practice guideline update summary: Mild cognitive impairment: Report of the Guideline Development, Dissemination, and Implementation Subcommittee of the American Academy of Neurology. Neurology 2018, 90, 126–135. [Google Scholar] [CrossRef]
- Luck, T.; Luppa, M.; Briel, S.; Riedel-Heller, S.G. Incidence of mild cognitive impairment: A systematic review. Dement. Geriatr. Cogn. Disord. 2010, 29, 164–175. [Google Scholar] [CrossRef]
- Petersen, R.C. Mild cognitive impairment. Continuum. (Minneapolis, Minn.). Contin. Lifelong Learn. Neurol. 2016, 22, 404–418. [Google Scholar] [CrossRef]
- Petersen, R.C. Mild cognitive impairment as a diagnostic entity. J. Intern. Med. 2004, 256, 183–194. [Google Scholar] [CrossRef] [PubMed]
- Özge, A.; Ghouri, R.; Öksüz, N.; Taşdelen, B. Predictive factors for Alzheimer’s disease progression: A comprehensive retrospective analysis of 3553 cases with 211 months follow-up. Front. Neurol. 2023, 14, 1239995. [Google Scholar] [CrossRef] [PubMed]
- Ghouri, R.; Öksüz, N.; Taşdelen, B.; Özge, A. Factors affecting progression of non-Alzheimer dementia: A retrospective analysis with long-term follow-up. Front. Neurol. 2023, 14, 1240093. [Google Scholar] [CrossRef]
- del C Valdés Hernández, M.; Morris, Z.; Dickie, D.A.; Royle, N.A.; Maniega, S.M.; Aribisala, B.S.; Bastin, M.E.; Deary, I.J.; Wardlaw, J.M. Close correlation between quantitative and qualitative assessments of white matter lesions. Neuroepidemiology 2012, 40, 13–22. [Google Scholar] [CrossRef] [PubMed]
- Kaye, J.A.; Swihart, T.; Howieson, D.; Dame, A.; Moore, M.M.; Karnos, T.; Camicioli, R.; Ball, M.; Oken, B.; Sexton, G. Volume loss of the hippocampus and temporal lobe in healthy elderly persons destined to develop dementia. Neurology 1997, 48, 1297–1304. [Google Scholar] [CrossRef]
- Henneman, W.; Sluimer, J.D.; Barnes, J.; van der Flier, W.M.; Sluimer, I.C.; Fox, N.C.; Scheltens, P.; Vrenken, H.; Barkhof, F. Hippocampal atrophy rates in Alzheimer disease: Added value over whole brain volume measures. Neurology 2009, 72, 999–1007. [Google Scholar] [CrossRef] [PubMed]
- van de Pol, L.A.; Hensel, A.; Barkhof, F.; Gertz, H.J.; Scheltens, P.; van der Flier, W.M. Hippocampal atrophy in Alzheimer disease: Age matters. Neurology 2006, 66, 236–238. [Google Scholar] [CrossRef]
- Mahoney, F.I.; Barthel, D.W. Functional evaluation: The Barthel Index. Md. State Med. J. 1965, 14, 61–65. [Google Scholar] [PubMed]
- Hernández, M.D.; Booth, T.; Murray, C.; Gow, A.J.; Penke, L.; Morris, Z.; Maniega, S.M.; Royle, N.A.; Aribisala, B.S.; Bastin, M.E.; et al. Brain white matter damage in aging and cognitive ability in youth and older age. Neurobiol. Aging 2013, 34, 2740–2747. [Google Scholar] [CrossRef]
- Frankfurt, S.; Frazier, P.; Syed, M.; Jung, K.R. Using group-based trajectory and growth mixture modeling to identify classes of change trajectories. Couns. Psychol. 2016, 44, 622–660. [Google Scholar] [CrossRef]
- Petersen, R.C. Clinical practice. Mild Cognitive Impairment. N. Engl. J. Med. 2011, 364, 2227–2234. [Google Scholar] [CrossRef] [PubMed]
- Winblad, B.; Palmer, K.; Kivipelto, M.; Jelic, V.; Fratiglioni, L.; Wahlund, L.; Nordberg, A.; Bäckman, L.; Albert, M.; Almkvist, O.; et al. Mild cognitive impairment—Beyond controversies, towards a consensus: Report of the International Working Group on Mild Cognitive Impairment. J. Intern. Med. 2004, 256, 240–246. [Google Scholar] [CrossRef]
- Petersen, R.C. Mild cognitive impairment: Current research and clinical implications. Semin. Neurol. 2007, 27, 22–31. [Google Scholar] [CrossRef] [PubMed]
- Albert, M.S.; DeKosky, S.T.; Dickson, D.; Dubois, B.; Feldman, H.H.; Fox, N.C.; Gamst, A.; Holtzman, D.M.; Jagust, W.J.; Petersen, R.C.; et al. The diagnosis of mild cognitive impairment due to Alzheimer’s disease: Recommendations from the National Institute on Aging-Alzheimer’s Association workgroups on diagnostic guidelines for Alzheimer’s disease. Alzheimers Dement. 2011, 7, 270–279. [Google Scholar] [CrossRef]
- Jia, J.; Zhou, A.; Wei, C.; Jia, X.; Wang, F.; Li, F.; Wu, X.; Mok, V.; Gauthier, S.; Tang, M.; et al. The prevalence of mild cognitive impairment and its etiological subtypes in elderly Chinese. Alzheimers Dement. 2014, 10, 439–447. [Google Scholar] [CrossRef]
- Deckers, K.; van Boxtel, M.P.J.; Schiepers, O.J.G.; de Vugt, M.; Sánchez, J.L.M.; Anstey, K.J.; Brayne, C.; Dartigues, J.-F.; Engedal, K.; Kivipelto, M.; et al. Target risk factors for dementia prevention: A systematic review and Delphi consensus study on the evidence from observational studies. Int. J. Geriatr. Psychiatry 2014, 30, 234–246. [Google Scholar] [CrossRef]
- Wolters, F.J.; Zonneveld, H.I.; Hofman, A.; van der Lugt, A.; Koudstaal, P.J.; Vernooij, M.W.; Ikram, M.A. Heart-Brain Connection Collaborative Research Group. Cerebral Perfusion and the Risk of Dementia: A Population-Based Study. Circulation 2017, 136, 719–728. [Google Scholar] [CrossRef] [PubMed]
- Anstey, K.J.; Mack, H.A.; Cherbuin, N. Alcohol consumption as a risk factor for dementia and cognitive decline: Meta-analysis of prospective studies. Am. J. Geriatr. Psychiatry 2009, 17, 542–555. [Google Scholar] [CrossRef] [PubMed]
- Sabia, S.; Elbaz, A.; Britton, A.; Bell, S.; Dugravot, A.; Shipley, M.; Kivimaki, M.; Singh-Manoux, A. Alcohol consumption and cognitive decline in early old age. Neurology 2014, 82, 332–339. [Google Scholar] [CrossRef] [PubMed]
- Sperling, R.A.; Aisen, P.S.; Beckett, L.A.; Bennett, D.A.; Craft, S.; Fagan, A.M.; Iwatsubo, T.; Jack, C.R., Jr.; Kaye, J.; Montine, T.J.; et al. Toward defining the preclinical stages of Alzheimer’s disease: Recommendations from the national institute on aging-Alzheimer’s association workgroups on diagnostic guidelines for Alzheimer’s disease. Alzheimers Dement. 2011, 7, 280–292. [Google Scholar] [CrossRef]
- Schrag, A.; Siddiqui, U.F.; Anastasiou, Z.; Weintraub, D.; Schott, J.M. Clinical variables and biomarkers in prediction of cognitive impairment in patients with newly diagnosed Parkinson’s disease: A cohort study. Lancet Neurol. 2017, 16, 66–75. [Google Scholar] [CrossRef]
- Foster, N.L.; Heidebrink, J.L.; Clark, C.M.; Jagust, W.J.; Arnold, S.E.; Barbas, N.R.; DeCarli, C.S.; Turner, R.S.; Koeppe, R.A.; Higdon, R.; et al. FDG-PET improves accuracy in distinguishing frontotemporal dementia and Alzheimer’s disease. Brain 2007, 130, 2616–2635. [Google Scholar] [CrossRef]
- Madore, M.R.; Scott, T.M.; Fairchild, J.K.; Yochim, B.P. Validity of the Verbal Naming Test and Boston Naming Test in a sample of older Veterans. Clin. Neuropsychol. 2022, 36, 1679–1690. [Google Scholar] [CrossRef]
- Teri, L.; Truax, P.; Logsdon, R.; Uomoto, J.; Zarit, S.; Vitaliano, P.P. Assessment of behavioral problems in dementia: The revised memory and behavior problems checklist. Psychol. Aging 1992, 7, 622–631. [Google Scholar] [CrossRef]
- Liu, C.-C.; Kanekiyo, T.; Xu, H.; Bu, G. Apolipoprotein E and Alzheimer disease: Risk, mechanisms and therapy. Nat. Rev. Neurol. 2013, 9, 106–118. [Google Scholar] [CrossRef]
- Ramanan, V.K.; Saykin, A.J. Pathways to neurodegeneration: Mechanistic insights from GWAS in Alzheimer’s disease, Parkinson’s disease, and related disorders. Am. J. Neurodegener. Dis. 2013, 2, 145–175. [Google Scholar]
- Jun, G.; Naj, A.C.; Beecham, G.W.; Wang, L.S.; Buros, J.; Gallins, P.J.; Buxbaum, J.D.; Ertekin-Taner, N.; Fallin, M.D.; Friedland, R.; et al. Meta-analysis confirms CR1, CLU, and PICALM as Alzheimer disease risk loci and reveals interactions with APOE genotypes. Arch. Neurol. 2010, 67, 1473–1484. [Google Scholar] [CrossRef] [PubMed]
- Apostolova, L.G.; Mosconi, L.; Thompson, P.M.; Green, A.E.; Hwang, K.S.; Ramirez, A.; Mistur, R.; Tsui, W.H.; de Leon, M.J. Subregional hippocampal atrophy predicts Alzheimer’s dementia in the cognitively normal. Neurobiol. Aging 2010, 31, 1077–1088. [Google Scholar] [CrossRef] [PubMed]
- Jack, C.R.; Petersen, R.C.; Xu, Y.C.; Waring, S.C.; O’Brien, P.C.; Tangalos, E.G.; Smith, G.E.; Ivnik, R.J.; Kokmen, E. Medial temporal atrophy on MRI in normal aging and very mild Alzheimer’s disease. Neurology 1997, 49, 786–794. [Google Scholar] [CrossRef]
- Debette, S.; Markus, H.S. The clinical importance of white matter hyperintensities on brain magnetic resonance imaging: Systematic review and meta-analysis. BMJ 2010, 341, c3666. [Google Scholar] [CrossRef] [PubMed]
- Longstreth, W.; Manolio, T.A.; Arnold, A.; Burke, G.L.; Bryan, N.; Jungreis, C.A.; Enright, P.L.; O’Leary, D.; Fried, L. Clinical correlates of white matter findings on cranial magnetic resonance imaging of 3301 elderly people. The cardiovascular health study. Stroke 1996, 27, 1274–1282. [Google Scholar] [CrossRef]
- Petersen, R.C.; Smith, G.E.; Waring, S.C.; Ivnik, R.J.; Tangalos, E.G.; Kokmen, E. Mild Cognitive Impairment: Clinical characterization and outcome. Arch. Neurol. 1999, 56, 303–308. [Google Scholar] [CrossRef] [PubMed]
- Gauthier, S.; Reisberg, B.; Zaudig, M.; Petersen, R.C.; Ritchie, K.; Broich, K.; Belleville, S.; Brodaty, H.; Bennett, D.; Chertkow, H.; et al. Psychogeriatric Association Expert Conference on mild cognitive impairment. Mild cognitive impairment. Lancet 2006, 367, 1262–1270. [Google Scholar] [CrossRef]
- Petersen, R.C.; Roberts, R.O.; Knopman, D.S.; Boeve, B.F.; Geda, Y.E.; Ivnik, R.J.; Smith, G.E.; Jack, C.R., Jr. Mild cognitive impairment: Ten years later. Arch. Neurol. 2009, 66, 1447–1455. [Google Scholar] [CrossRef]
- Kryscio, R.J.; Abner, E.L.; Cooper, G.E.; Fardo, D.W.; Jicha, G.A.; Nelson, P.T.; Smith, C.D.; Van Eldik, L.J.; Wan, L.; Schmitt, F.A. Self-reported memory complaints: Implications from a longitudinal cohort with autopsies. Neurology 2014, 83, 1359–1365. [Google Scholar] [CrossRef]
- Petersen, R.C.; Doody, R.; Kurz, A.; Mohs, R.C.; Morris, J.C.; Rabins, P.V.; Ritchie, K.; Rossor, M.; Thal, L.; Winblad, B. Current concepts in mild cognitive impairment. Arch. Neurol. 2001, 58, 1985–1992. [Google Scholar] [CrossRef]
- Mitchell, A.J.; Shiri-Feshki, M. Rate of progression of mild cognitive impairment to dementia—Meta-analysis of 41 robust inception cohort studies. Acta Psychiatr. Scand. 2009, 119, 252–265. [Google Scholar] [CrossRef] [PubMed]
- Dubois, B.; Feldman, H.H.; Jacova, C.; Cummings, J.L.; DeKosky, S.T.; Barberger-Gateau, P.; Delacourte, A.; Frisoni, G.; Fox, N.C.; Galasko, D.; et al. Revising the definition of Alzheimer’s disease: A new lexicon. Lancet Neurol. 2010, 9, 1118–1127. [Google Scholar] [CrossRef] [PubMed]
- Daviglus, M.L.; Bell, C.C.; Berrettini, W.; Bowen, P.E.; Connolly, E.S.; Cox, N.J.; Dunbar-Jacob, J.M.; Granieri, E.C.; Hunt, G.; McGarry, K.; et al. National Institutes of Health State-of-the-Science Conference statement: Preventing Alzheimer disease and cognitive decline. Ann. Intern. Med. 2010, 153, 176–181. [Google Scholar] [CrossRef]
- Morris, J.C.; Storandt, M.; Miller, J.P.; McKeel, D.W.; Price, J.L.; Rubin, E.H.; Berg, L. Mild cognitive impairment represents early-stage Alzheimer disease. Arch. Neurol. 2001, 58, 397–405. [Google Scholar] [CrossRef] [PubMed]
- Farias, S.T.; Mungas, D.; Jagust, W. Degree of discrepancy between self and other-reported everyday functioning by cognitive status: Dementia, mild cognitive impairment, and healthy elders. Int. J. Geriatr. Psychiatry 2005, 20, 827–834. [Google Scholar] [CrossRef]
- Ahmadi-Abhari, S.; Guzman-Castillo, M.; Bandosz, P.; Shipley, M.J.; Muniz-Terrera, G.; Singh-Manoux, A.; Kivimäki, M.; Steptoe, A.; Capewell, S.; O’flaherty, M.; et al. Temporal trend in dementia incidence since 2002 and projections for prevalence in England and Wales to 2040: Modelling study. BMJ 2017, 358, j2856. [Google Scholar] [CrossRef]
- Canevelli, M.; Grande, G.; Lacorte, E.; Quarchioni, E.; Cesari, M.; Mariani, C.; Bruno, G.; Vanacore, N. Spontaneous Reversion of Mild Cognitive Impairment to Normal Cognition: A Systematic Review of Literature and Meta-Analysis. J. Am. Med Dir. Assoc. 2016, 17, 943–948. [Google Scholar] [CrossRef]
- Petersen, R.C.; Caracciolo, B.; Brayne, C.; Gauthier, S.; Jelic, V.; Fratiglioni, L. Mild cognitive impairment: A concept in evolution. J. Intern. Med. 2014, 275, 214–228. [Google Scholar] [CrossRef]


| Healthy Control n = 50 (26.31%) | MCI-AD n = 59 (31.05%) | Non-AD MCI n = 81 (42.63%) | Total MCI n = 140 (73.68%) | Total n = 190 (100%) | p | |
|---|---|---|---|---|---|---|
| Age. year (mean ± SD) | 65.59 ± 9.96 | 69.51 ± 6.32 | 71.12 ± 7.32 | 70.44 ± 6.94 | 69.26 ±8.07 | 0.0015 |
| Follow-up (months) | ||||||
| (mean ± SD) (min–max) | 28.32 ± 35.11 | 27.05 ± 25.19 | 28.63 ± 27.84 | 27.96 ± 26.68 | 38.06 ± 29.03 | 0.948683 |
| First visit * | (0–120) | (3–120) | (3–120) | (3–120) | (0–120) | |
| - | 12.95 ± 11.92 | 15.06 ± 13.71 | 14.17 ± 12.98 | 14.17 ± 12.98 | 0.343653 | |
| Second visit | (3–60) | (3–79) | (3–79) | (3–79) | ||
| 26.72 ± 27.58 | 41.03 ± 37.68 | 31.38 ± 31.63 | 35.45 ± 34.51 | 33.15 ± 32.99 | 0.063143 | |
| Last visit ** | (4–127) | (3–174) | (2–137) | (12–203) | (2–174) | |
| Gender | ||||||
| Female n (%) | 28 (56%) | 31 (52.54%) | 47 (58.02%) | 78 (55.71%) | 106 (55.79%) | 0.81173 |
| Male n (%) | 22 (44%) | 28 (47.46%) | 34 (41.98%) | 62 (44.28%) | 84 (44.21%) | |
| Formal education, n (%) | ||||||
| Basic school | 42 (84%) | 47 (79.66%) | 73 (90.12%) | 120 (85.71%) | 162 (85.26%) | 0.14378 |
| Middle school | - | 2 (3.39%) | 2 (2.47%) | 4 (2.86%) | 4 (2.10%) | |
| High school | - | 2 (3.38%) | 3 (3.70%) | 5 (3.57%) | 5 (2.63%) | |
| University | 8 (16%) | 8 (13.56%) | 3 (3.70%) | 11 (7.86%) | 19 (10%) | |
| Living n (%) | ||||||
| Alone | 3 (6%) | 8 (13.56%) | 15 (18.52%) | 23 (16.43%) | 26 (13.68%) | 0.12854 |
| with family | 47 (94%) | 51 (86.44%) | 66 (81.48%) | 117 (83.57%) | 164 (86.32%) | |
| Presentation symptoms n (%) | ||||||
| Memory dysfunction | 26 (44.07%) | 25 (30.86%) | 51 (36.43%) | 51 (26.84%) | 0.19237 | |
| Language dysfunction | 38 (64.41%) | 47 (58.02%) | 85 (60.71%) | 44 (74%) | 0.14820 | |
| Executive dysfunction | 8 (13.56%) | 11 (13.58%) | 19 (13.57%) | 19 (10%) | 0.02306 | |
| Behavioral problem | 1 (1.69%) | 1 (1.23%) | 2 (1.43%) | 2 (1.05%) | 0.67323 | |
| Self-Care problem | 3 (5.08%) | 4 (4.94%) | 7 (5%) | 7 (3.68%) | 0.96302 | |
| Sleep problem | 21 (35.59%) | 20 (24.69%) | 41 (29.28%) | 41 (21.58%) | 0.31678 | |
| Disorientation | 12 (20.34%) | 21 (25.93%) | 33 (23.57%) | 33 (17.37%) | 0.52651 | |
| Incontinence | 8 (13.56%) | 20 (24.69%) | 28 (20%) | 28(14.74%) | 0.06346 | |
| Loss of appetite | 7 (11.86%) | 9 (11.11%) | 16 (11.43 | 16 (8.42%) | 0.95305 | |
| Comorbid medical problems n (%) | ||||||
| Hypertension | 19 (38%) | 22 (37.29%) | 38 (46.92%) | 60 (42.86%) | 79 (41.58%) | 0.43609 |
| Thyroid dysf. | 7 (14%) | 10 (16.95%) | 12 (14.81%) | 22 (15.71%) | 29 (15.26%) | 0.90305 |
| Diabetes Mellitus | 9 (18%) | 11 (18.64%) | 19 (23.46%) | 30 (21.43%) | 39 (20.52%) | 0.68723 |
| CAD | 12 (24%) | 15 (25.42%) | 23 (28.40%) | 38 (27.14%) | 50 (26.31%) | 0.84236 |
| Hyperlipidemia | 9 (18%) | 14 (23.73%) | 20 (24.69%) | 34 (24.28%) | 43 (22.63%) | 0.65397 |
| Stroke | 1 (2%) | 1 (1.69%) | 5 (6.17%) | 6 (4.28%) | 7 (3.68%) | 0.29063 |
| Current Smoker | 7 (14%) | 4 (6.78%) | 14 (17.28%) | 18 (12.86%) | 25 (13.16%) | 0.44638 |
| No smoker | 32 (64%) | 41 (69.49%) | 47 (58.02%) | 88 (62.86%) | 120 (63.16) | |
| Ex-smoker | 11 (22%) | 14 (23.73%) | 20 (24.69%) | 34 (24.28%) | 45 (23.68%) | |
| Regular alcoholic | - | 9 (15.25%) | 6 (7.41%) | 15 (10.72%) | 15 (7.89%) | 0.29225 |
| Non-alcoholic | 47 (94%) | 49 (83.05%) | 73 (90.12%) | 122 (87.14%) | 169 (88.95%) | |
| Ex-alcoholic | 3 (6%) | 1 (1.69%) | 2 (2.47%) | 3 (2.14%) | 6 (3.16%) | |
| Epilepsy | - | 4 (6.78%) | 14 (17.28%) | 18 (12.86%) | 18 (9.47%) | 0.00319 |
| Extrapyramidal symptoms | - | 1 (1.69%) | 18 (22.22%) | 19 (13.57%) | 19 (10%) | 0.00004 |
| Family history of dementia n (%) Family history of vascular disease | 18 (36%) | 22 (37.29%) | 39 (48.15%) | 61 (43.57%) | 79 (41.58%) | 0.28268 |
| 23 (46%) | 30 (50.85%) | 43 (53.09%) | 73 (52.14%) | 96 (50.53%) | 0.73176 |
| First Visit | Second Visit | Third Visit | p | |
|---|---|---|---|---|
| BDLAS mean ± SD (min–max) | 1.20 ± 0.99 (0–4.5) | 1.63 ± 1.10 (0–6) | 2.33 ± 1.64 (0–7.5) | 0.00042 * |
| EDLAS mean ± SD (min–max) | 21.28 ±3.07 (8–23) | 19.78 ± 4.63 (3–23) | 16.70 ± 6.86 (0–23) | 0.00663 |
| MMSE mean ± SD (min–max) | 27.28 ± 2.66 (15–30) | 26.74 ± 3.42 (13–30) | 23.06 ± 6.34 (3–30) | <0.0001 * |
| Digit forward: median (min–max) | 4 (2–7) | 4 (3–7) | 4 (0–7) | 0.82657 |
| Digit backward: median (min–max) | 3 (0–5) | 3 (0–6) | 3 (0–7) | 0.18348 |
| Calculation: median (min–max) | 5 (0–5) n = 128 | 5 (0–5) n = 127 | 4 (0–5) n = 127 (0–5) | <0.0001 * |
| Abstraction: median (min–max) | 3 (0–3) n = 131 | 3 (0–3) n = 130 | 3 (0–3) n = 130 | 0.00009 * |
| WMT-1: median (min–max) | 3 (0–7) | 3 (0–10) | 3 (0–7) | 0.03915 |
| n = 124 | n = 127 | n = 127 | ||
| WMT-2: median (min–max) | 5 (0–8) | 4 (0–10) | 4 (0–8) | 0.00146 * |
| n = 125 | n = 127 | n = 128 | ||
| WMT-3: median (min–max) | 5 (0–10) | 5 (0–9) | 5 (0–9) | 0.02696 |
| n = 126 | n = 126 | n = 128 | ||
| WMT-recall: median (min–max) | 3 (0–10) | 3 (0–8) | 2 (0–9) | 0.00529 |
| n = 122 | n = 123 | n = 124 | ||
| WMT-recognition: median (min–max) | 17 (0–20) | 18 (0–20) | 16 (0–20) | 0.00362 |
| n = 122 | n = 126 | n = 127 | ||
| BNT: median (min–max) | 14 (3–15) n = 128 | 14 (2–15) n = 124 | 13 (0–15) n = 130 | 0.00186 * |
| CDT: median (min–max) | 9 (0–10) n = 121 | 10 (0–10) n = 123 | 8 (0–10) n = 123 | 0.12589 |
| GDS: median (min–max) | 2 (1–3) n = 140 | 3 (2–5) n = 140 | 3 (2–7) n = 140 | <0.0001 * |
| Comprehension: median (min–max) | 6 (1–6) n = 77 | 6 (1–6) n = 87 | 6 (0–6) n = 90 | 0.04630 |
| Visual memory score: median (min–max) | 11 (0–11) n = 48 | 10 (0–11) n = 49 | 8 (0–11) n = 70 | 0.07971 |
| Visual memory-recall: median (min–max) | 8 (0–11) n = 47 | 7 (0–11) n = 47 | 3 (0–11) n = 67 | 0.52839 |
| n (%) | Male (n = 62) | Female (n = 78) | Total (n = 140) | p |
|---|---|---|---|---|
| APOE genotype | 0.38171 | |||
| E3/E4 | 6 (66.67%) | 5 (55.56%) | 11 (61.12%) | |
| E3/E3 | 3 (33.33%) | 2 (22.22%) | 5 (27.78%) | |
| E2/E4 | 0 (0%) | 1 (11.11%) | 1 (5.55%) | |
| E4/E4 | 0 (0%) | 1 (11.11%) | 1 (5.55%) | |
| Hippocampal atrophy n (%) | 0.44000 | |||
| Grade 1 | 32 (52.46%) | 49 (62.82%) | 81 (58.27%) | |
| Grade 2 | 25 (40.98%) | 24 (30.77%) | 49 (35.26%) | |
| Grade 3 | 4 (6.56%) | 5 (6.41%) | 9 (6.47) | |
| Fazekas grading n (%) | 0.47120 | |||
| Grade 0 | 9 (15.25%) | 19 (25.33%) | 28 (20.90%) | |
| Grade 1 | 23 (38.98%) | 29 (38.67%) | 52 (38.81%) | |
| Grade 2 | 19 (32.20%) | 20 (26.67%) | 39 (29.10%) | |
| Grade 3 | 8 (13.56%) | 7 (9.33%) | 15 (11.19%) | |
| Associated | ||||
| Hydrocephalus | 0 (0%) | 0(0%) | 0 (0%) | N.A. |
| Epilepsy | 8 (12.90%) | 10 (12.82%) | 18 (12.86%) | 0.98841 |
| Extrapyramidal symptoms | 12 (19.35%) | 7 (8.97%) | 19 (13.57%) | 0.07485 |
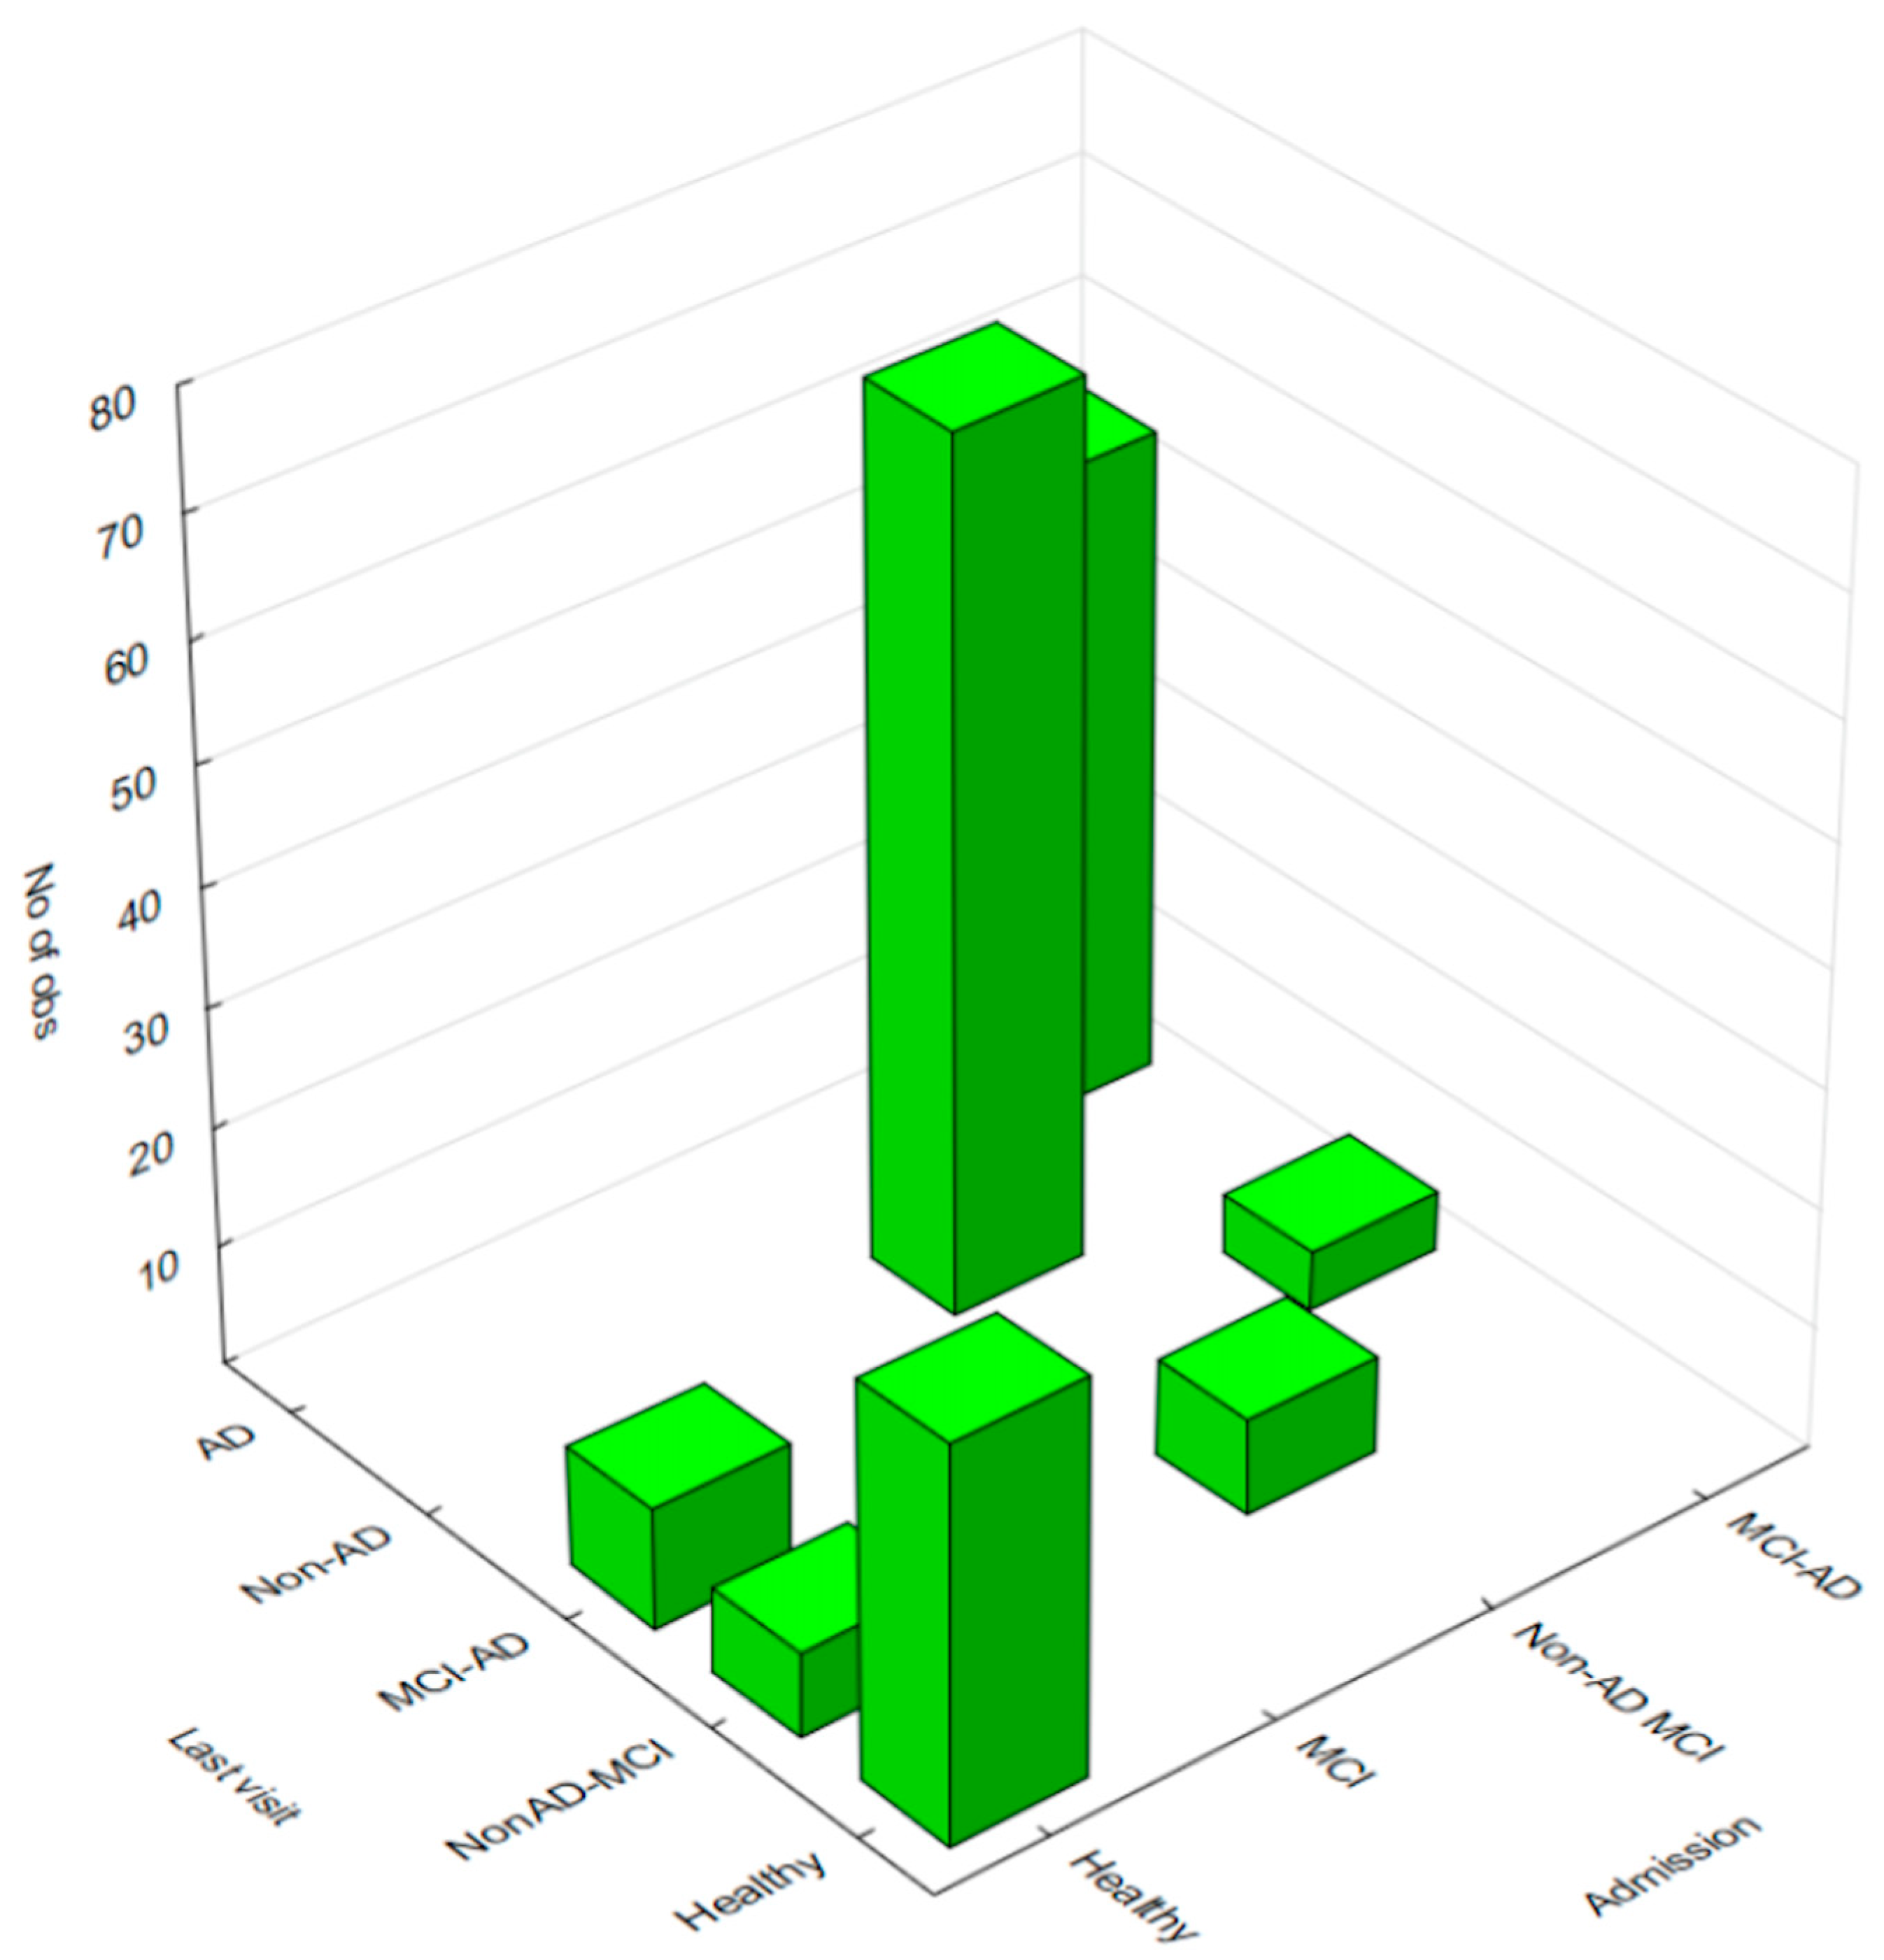
| Study Groups | ||||||
|---|---|---|---|---|---|---|
| Healthy | NonAD-MCI | MCI-AD | Non-AD | AD | Row Totals | |
| Healthy | 33 | 7 | 10 | 0 | 0 | 50 |
| Non-AD MCI | 0 | 8 | 0 | 73 | 0 | 81 |
| MCI-AD | 0 | 0 | 5 | 0 | 54 | 59 |
| Totals | 33 | 15 | 15 | 73 | 54 | 190 |
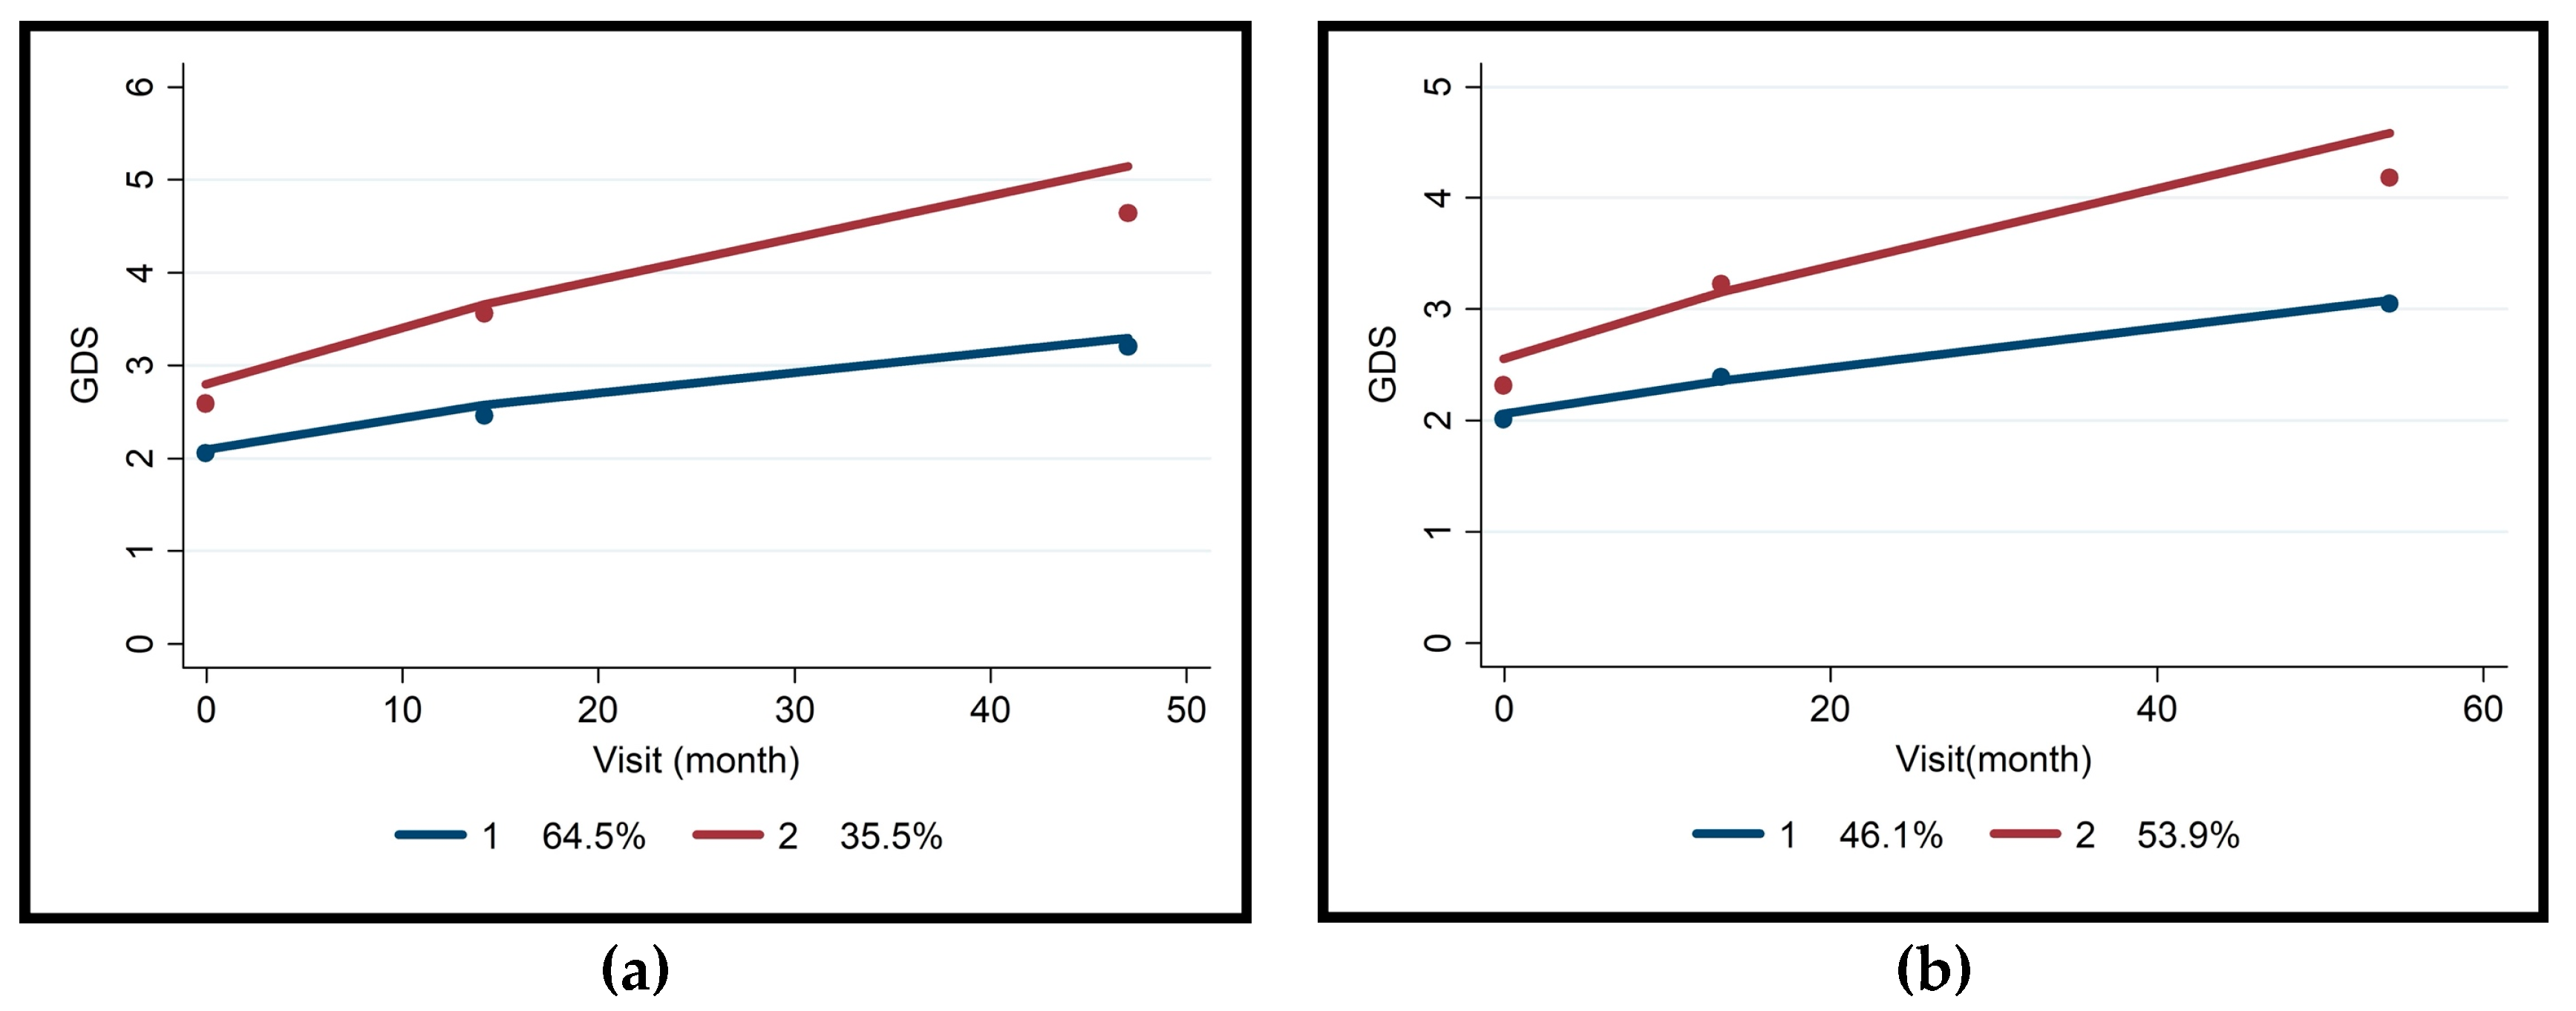
| Non-AD MCI (n = 81) | MCI-AD (n = 59) | |||||||
|---|---|---|---|---|---|---|---|---|
| Slow | Fast | Trajectory Model | Slow | Fast | Trajectory Model | |||
| n = 52 (64.5%) | n = 29 (35.5%) | Coeff. ± Std. Error | p | n = 27 (46.1%) | n = 32 (53.9%) | Coeff. ± Std. Error | p | |
| Fazekas grading | 0.29 ± 0.33 | 0.387 | −0.106 ± 0.41055 | 0.794 | ||||
| 0 | 6 | 1 | 8 | 13 | ||||
| 1 | 16 | 7 | 13 | 14 | ||||
| 2 | 19 | 11 | 4 | 3 | ||||
| 3 | 7 | 4 | 0 | 1 | ||||
| Hippocampal atrophy | 0.74 ± 0.47 | 0.116 | 0.856 ± 0.50845 | 0.094 | ||||
| 1 | 38 | 15 | 12 | 10 | ||||
| 2 | 9 | 10 | 13 | 16 | ||||
| 3 | 1 | 1 | 0 | 5 | ||||
| BDLAS-1 | 0.98 ± 0.75 (0–3.5) | 1.69 ± 1.22 (0–4.5) | 0.16 ± 0.52 | 0.751 | 0.95 ± 0.96 (0–3) | 1.33 ± 0.98 (0–3) | 0.44 ± 0.33 | 0.180 |
| BDLAS-2 | NA | NA | NA | NA | ||||
| BDLAS-3 | NA | NA | NA | NA | ||||
| EDLAS-1 | 22.22 ± 1.5 (16–23) | 19 ± 4.6 (8–23) | −0.4 ± 0.2 | 0.065 | 22.0 ± 1.3 (19–23) | 20.9 ± 3.3 (10–23) | −0.2 ± 0.1 | 0.168 |
| EDLAS-2 | 21.03 ± 3.37 (13–23) | 18.27 ± 5.11 (3–23) | 19.84 ± 5.84 (6–23) | 19.578 ± 4.58 (10–23) | ||||
| EDLAS-3 | 20.73 ± 3.01 (13–23) | 12.684 ± 7.93 (0–23) | 20.06 ± 4.18 (0–23) | 13.45 ± 7.11 (10–23) | ||||
| Epilepsy | 2.62 ± 0.86 | 0.002 | NA | NA | ||||
| No | 44 | 16 | 24 | 28 | ||||
| Yes | 4 | 10 | 1 | 3 | ||||
| Extrapyramidal symptoms | −0.48 ± 0.91 | 0.594 | NA | NA | ||||
| No | 37 | 21 | 25 | 30 | ||||
| Yes | 11 | 5 | 0 | 1 | ||||
| Thyroid dysfunction | 0.13 ± 0.86 | 0.879 | 0.17 ± 0.82 | 0.833 | ||||
| No | 41 | 23 | 21 | 25 | ||||
| Yes | 7 | 3 | 4 | 6 | ||||
| Coronary artery disease | 0.53 ±0.76 | 0.484 | −0.610 ± 0.71777 | 0.396 | ||||
| No | 37 | 18 | 17 | 24 | ||||
| Yes | 11 | 8 | 8 | 7 | ||||
| Diabetes mellitus | 0.10 ± 0.90 | 0.910 | 0.35 ± 0.80 | 0.662 | ||||
| No | 39 | 18 | 21 | 24 | ||||
| Yes | 9 | 8 | 4 | 7 | ||||
| Hypertension | 1.33 ± 0.77 | 0.084 | 0.87 ± 0.70 | 0.216 | ||||
| No | 28 | 10 | 18 | 17 | ||||
| Yes | 20 | 16 | 7 | 14 | ||||
| Stroke | 0.67 ± 1.37 | 0.624 | NA | NA | ||||
| No | 47 | 24 | 25 | 30 | ||||
| Yes | 1 | 2 | 0 | 1 | ||||
| Hyperlipidemia | 0.26 ± 0.85 | 0.753 | 0.66 ± 0.73 | 0.367 | ||||
| No | 37 | 19 | 20 | 22 | ||||
| Yes | 11 | 7 | 5 | 9 | ||||
| Sleep disorders | −0.09 ± 0.80 | 0.903 | 0.45 ± 0.67 | 0.503 | ||||
| No | 11 | 7 | 18 | 18 | ||||
| Yes | 37 | 19 | 7 | 13 | ||||
| Smoking | −0.07 ± 0.41 | 0.857 | 0.94 ± 0.61 | 0.126 | ||||
| Current | 8 | 5 | 3 | 0 | ||||
| None | 28 | 16 | 17 | 23 | ||||
| Quit | 12 | 5 | 5 | 8 | ||||
| Regular Alcohol usage | −0.29 ± 0.92 | 0.750 | 0.03 ± 0.82 | 0.963 | ||||
| Current | 2 | 4 | 5 | 3 | ||||
| None | 46 | 21 | 19 | 28 | ||||
| Quit | 0 | 1 | 1 | 0 | ||||
| Family history of dementia | 0.19 ± 0.54 | 0.721 | −0.56 ± 0.59 | 0.340 | ||||
| No | 27 | 12 | 14 | 21 | ||||
| Yes | 21 | 14 | 11 | 10 | ||||
Disclaimer/Publisher’s Note: The statements, opinions and data contained in all publications are solely those of the individual author(s) and contributor(s) and not of MDPI and/or the editor(s). MDPI and/or the editor(s) disclaim responsibility for any injury to people or property resulting from any ideas, methods, instructions or products referred to in the content. |
© 2024 by the authors. Licensee MDPI, Basel, Switzerland. This article is an open access article distributed under the terms and conditions of the Creative Commons Attribution (CC BY) license (https://creativecommons.org/licenses/by/4.0/).
Share and Cite
Öksüz, N.; Ghouri, R.; Taşdelen, B.; Uludüz, D.; Özge, A. Mild Cognitive Impairment Progression and Alzheimer’s Disease Risk: A Comprehensive Analysis of 3553 Cases over 203 Months. J. Clin. Med. 2024, 13, 518. https://doi.org/10.3390/jcm13020518
Öksüz N, Ghouri R, Taşdelen B, Uludüz D, Özge A. Mild Cognitive Impairment Progression and Alzheimer’s Disease Risk: A Comprehensive Analysis of 3553 Cases over 203 Months. Journal of Clinical Medicine. 2024; 13(2):518. https://doi.org/10.3390/jcm13020518
Chicago/Turabian StyleÖksüz, Nevra, Reza Ghouri, Bahar Taşdelen, Derya Uludüz, and Aynur Özge. 2024. "Mild Cognitive Impairment Progression and Alzheimer’s Disease Risk: A Comprehensive Analysis of 3553 Cases over 203 Months" Journal of Clinical Medicine 13, no. 2: 518. https://doi.org/10.3390/jcm13020518
APA StyleÖksüz, N., Ghouri, R., Taşdelen, B., Uludüz, D., & Özge, A. (2024). Mild Cognitive Impairment Progression and Alzheimer’s Disease Risk: A Comprehensive Analysis of 3553 Cases over 203 Months. Journal of Clinical Medicine, 13(2), 518. https://doi.org/10.3390/jcm13020518