
The Influence of Mobility Training on the Myofascial Structures of the Back and Extremities


 ,
,  ,
,
Abstract
1. Introduction
2. Materials and Methods
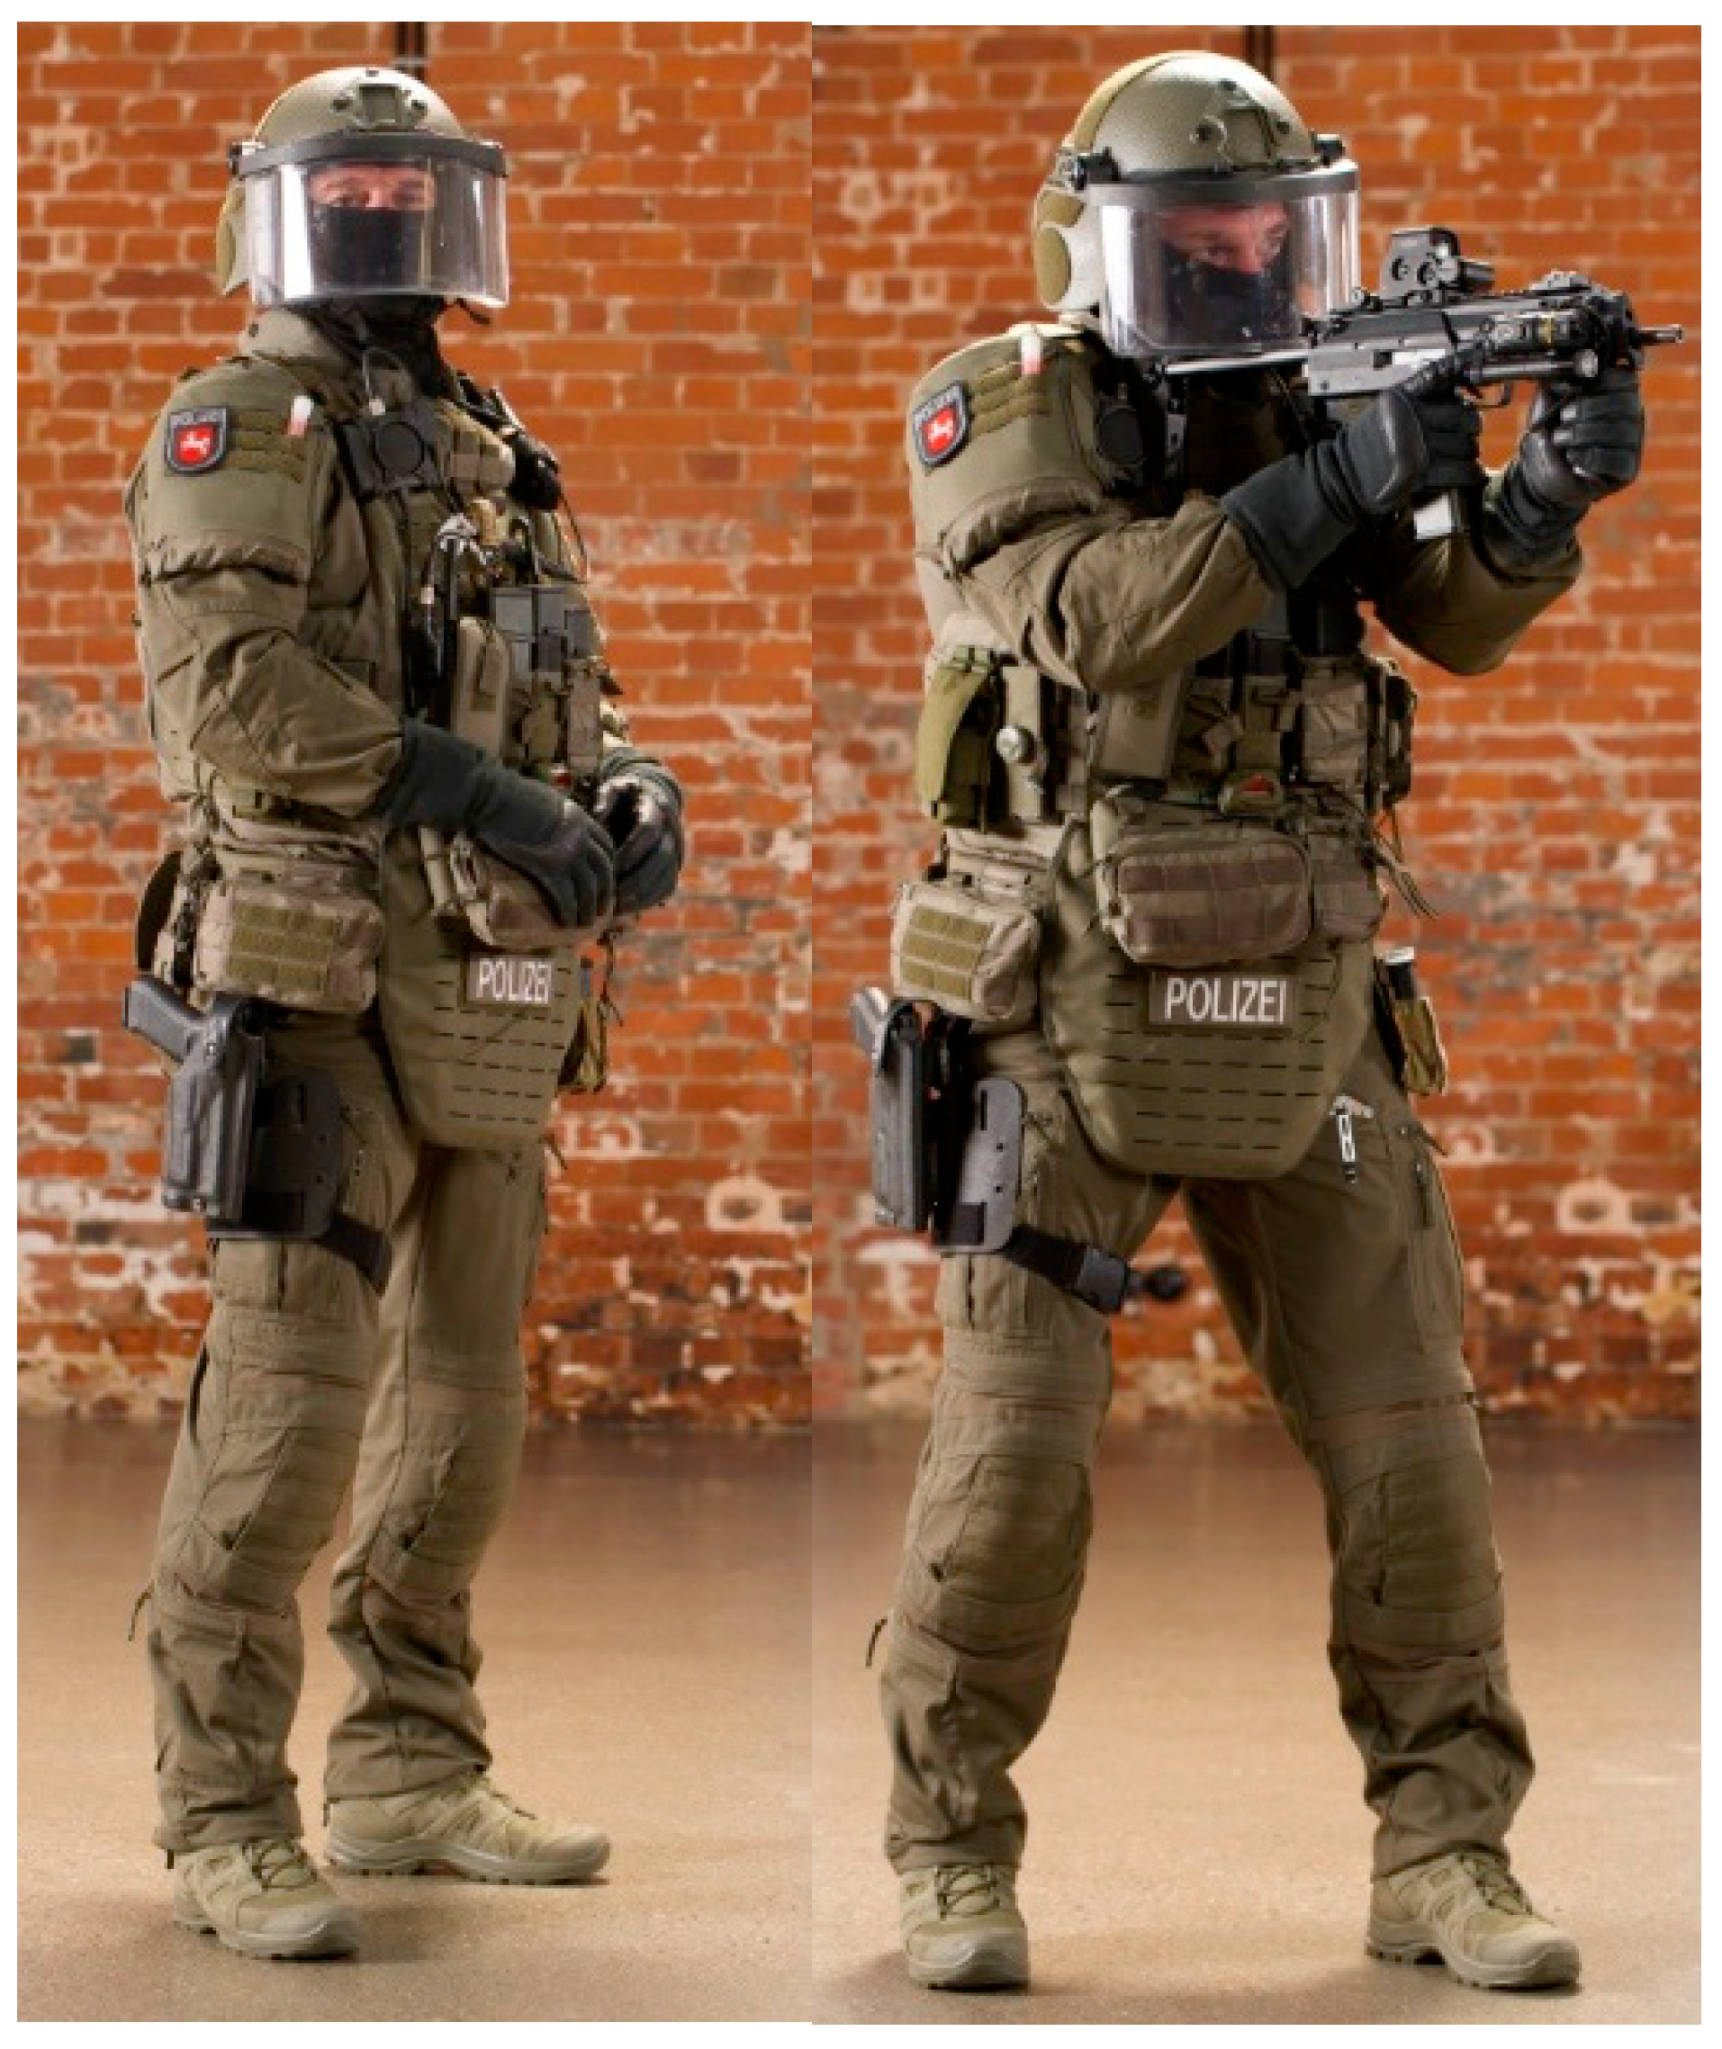
2.1. Participants
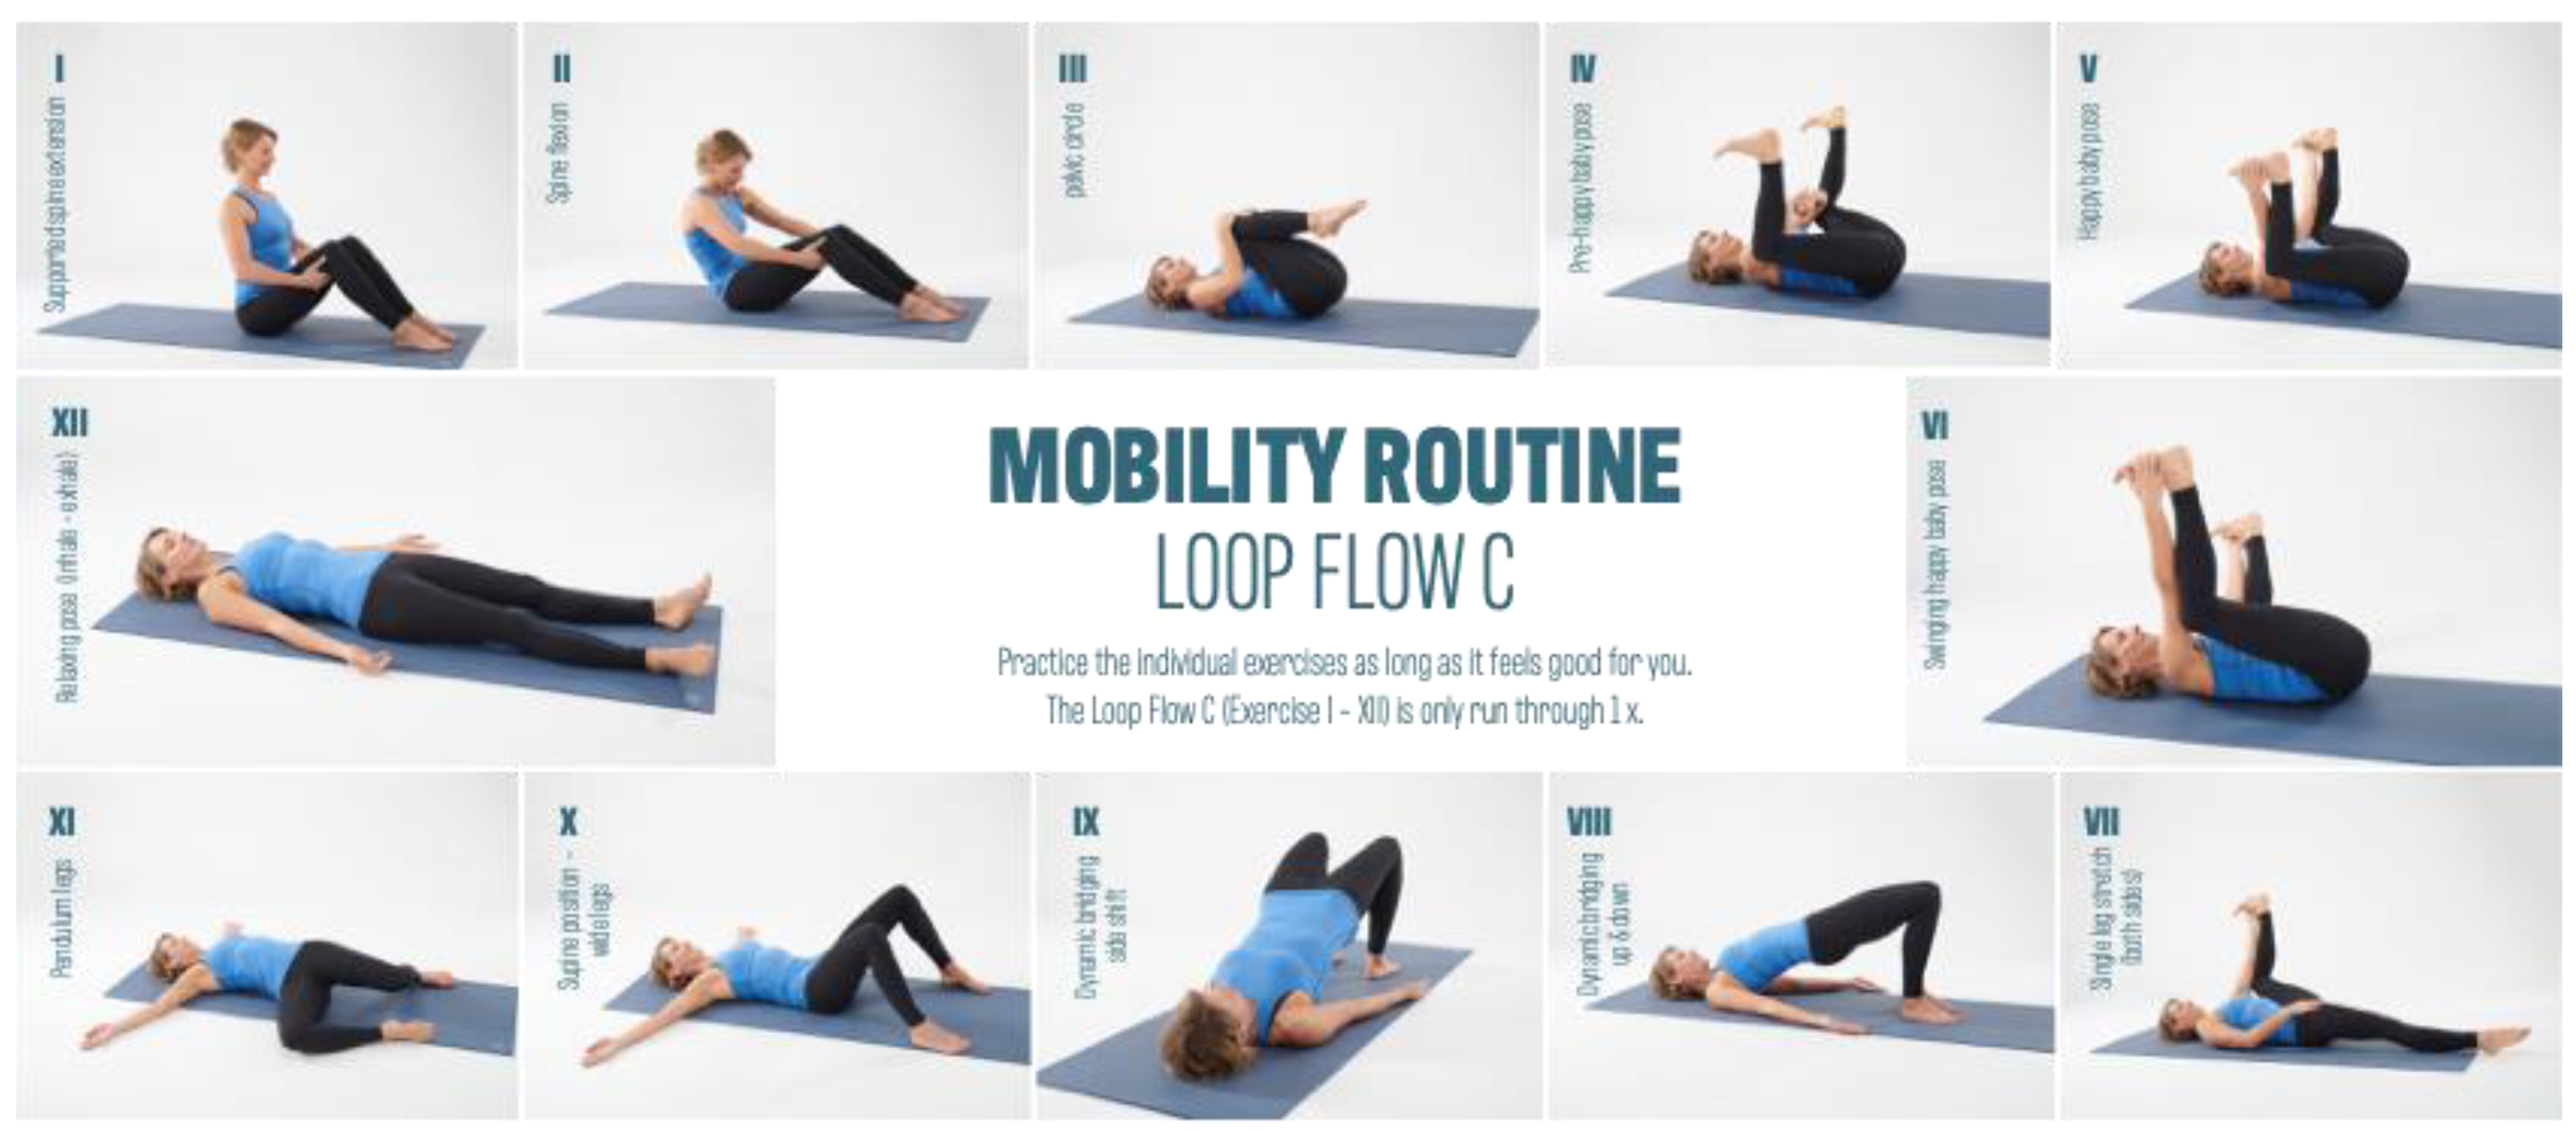
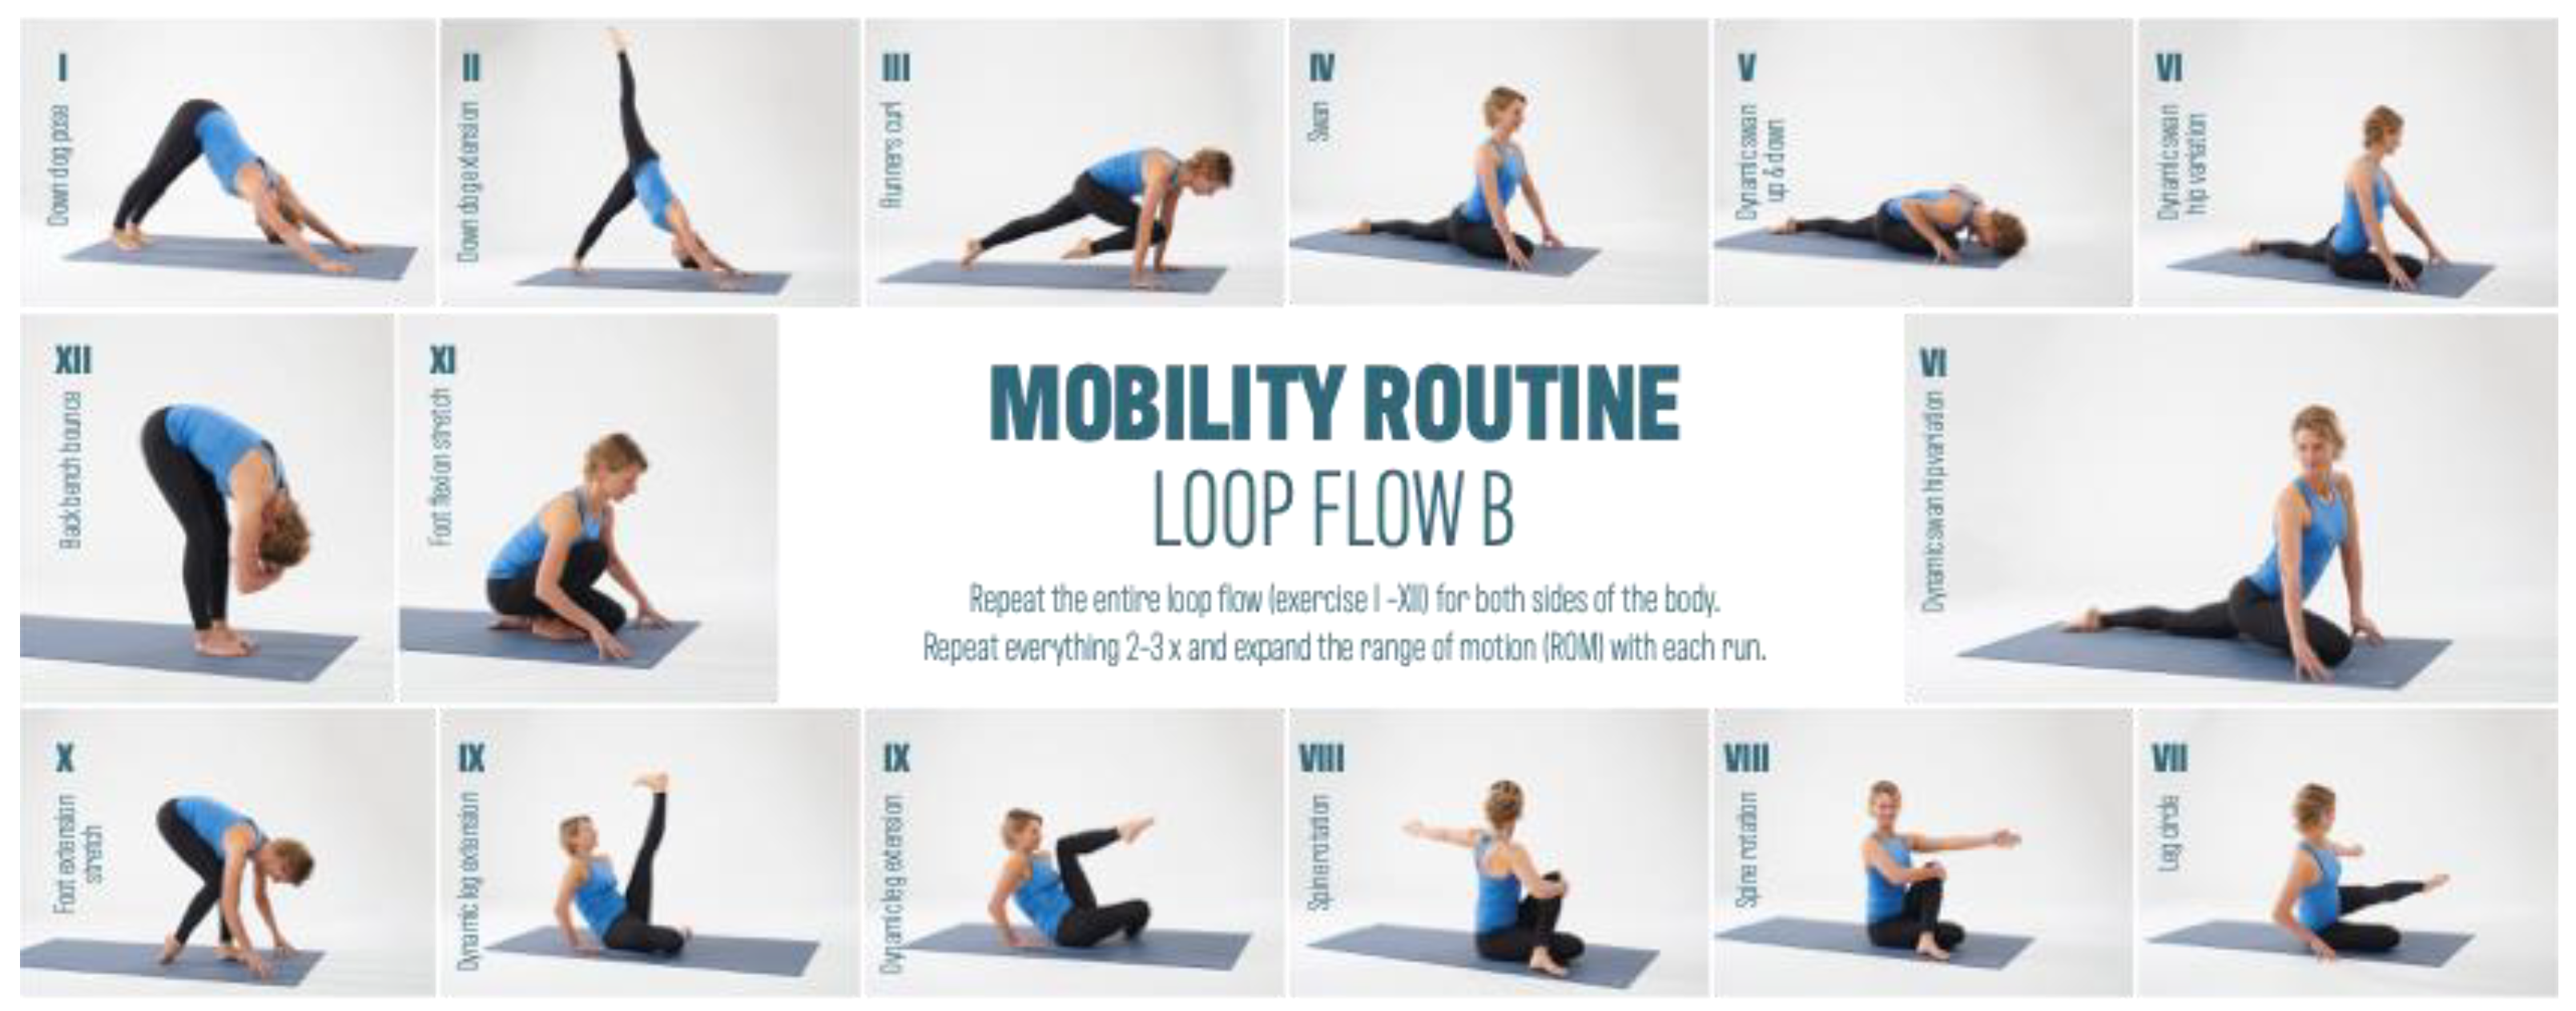
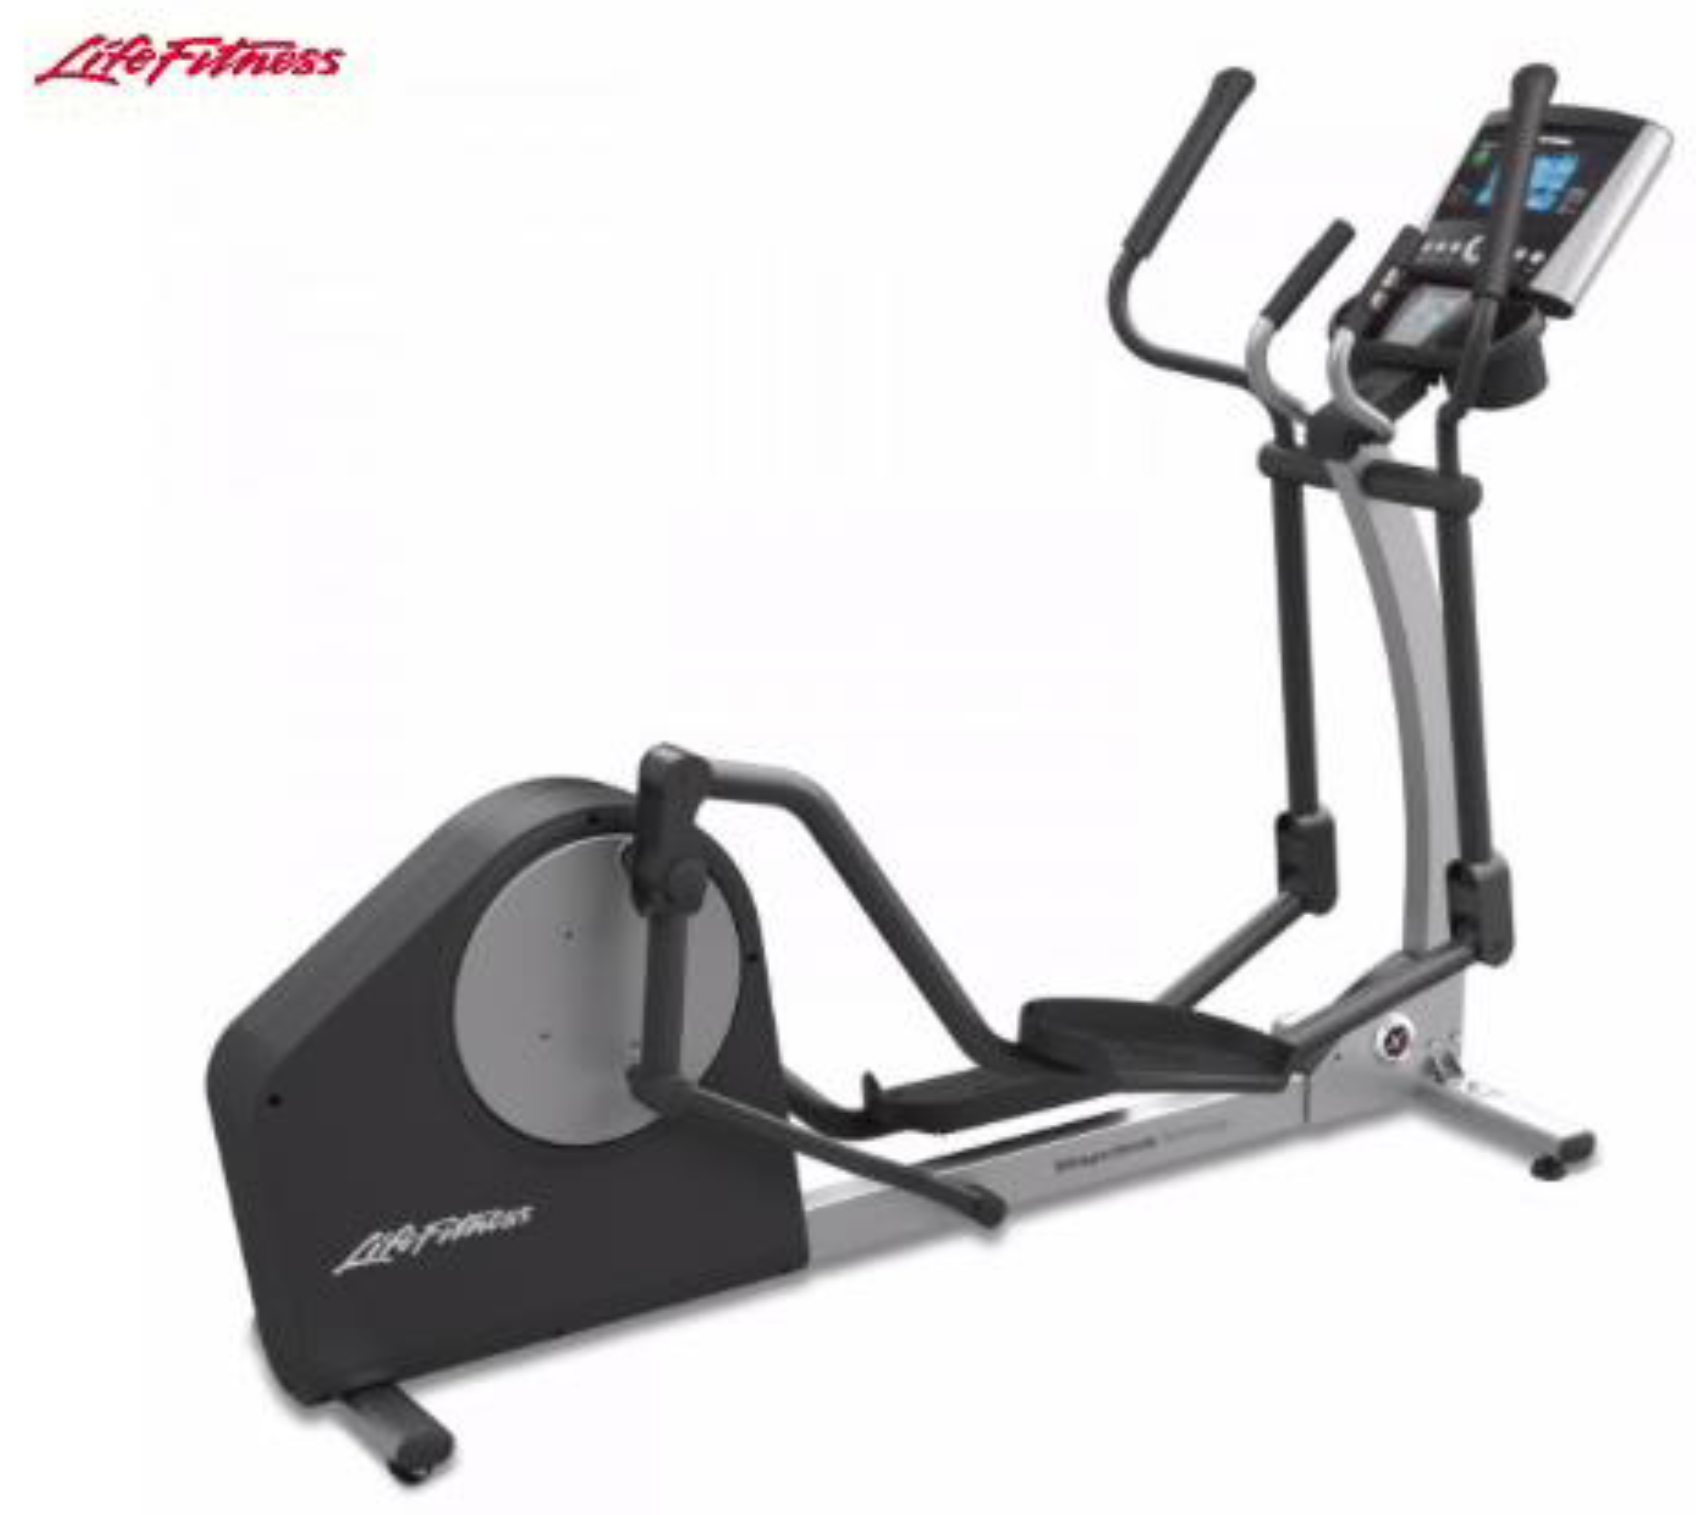
2.2. Intervention
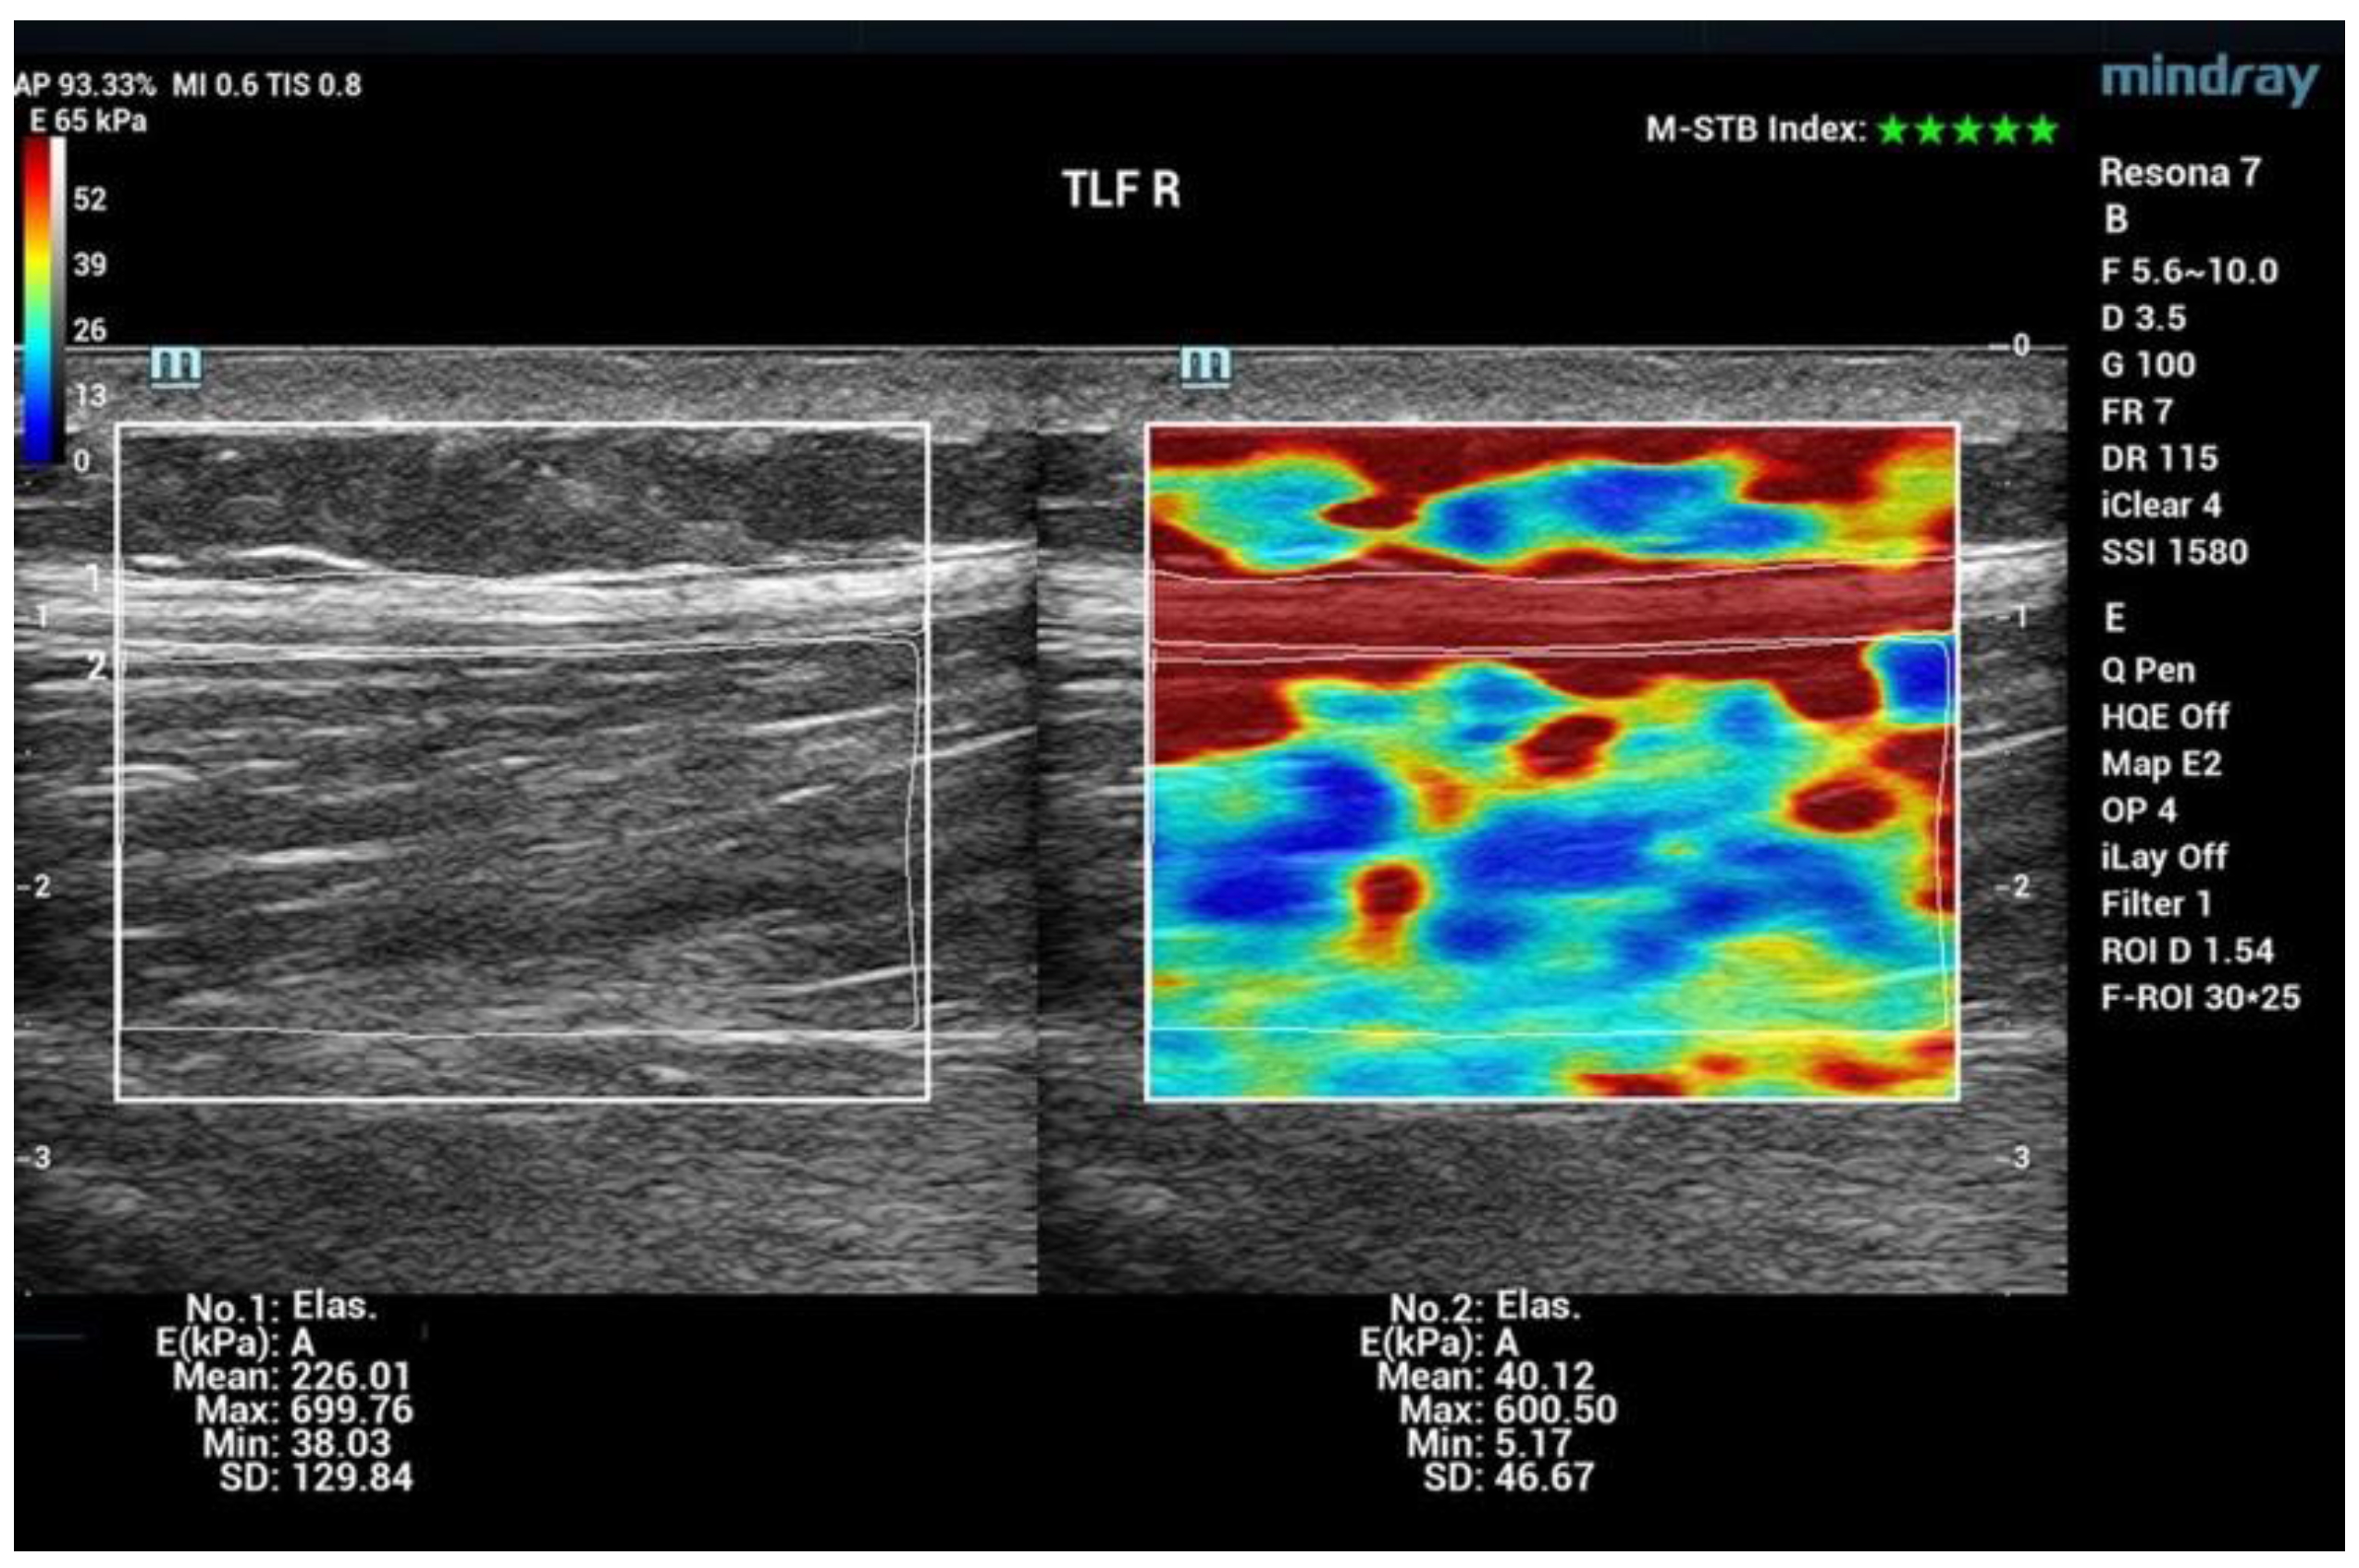
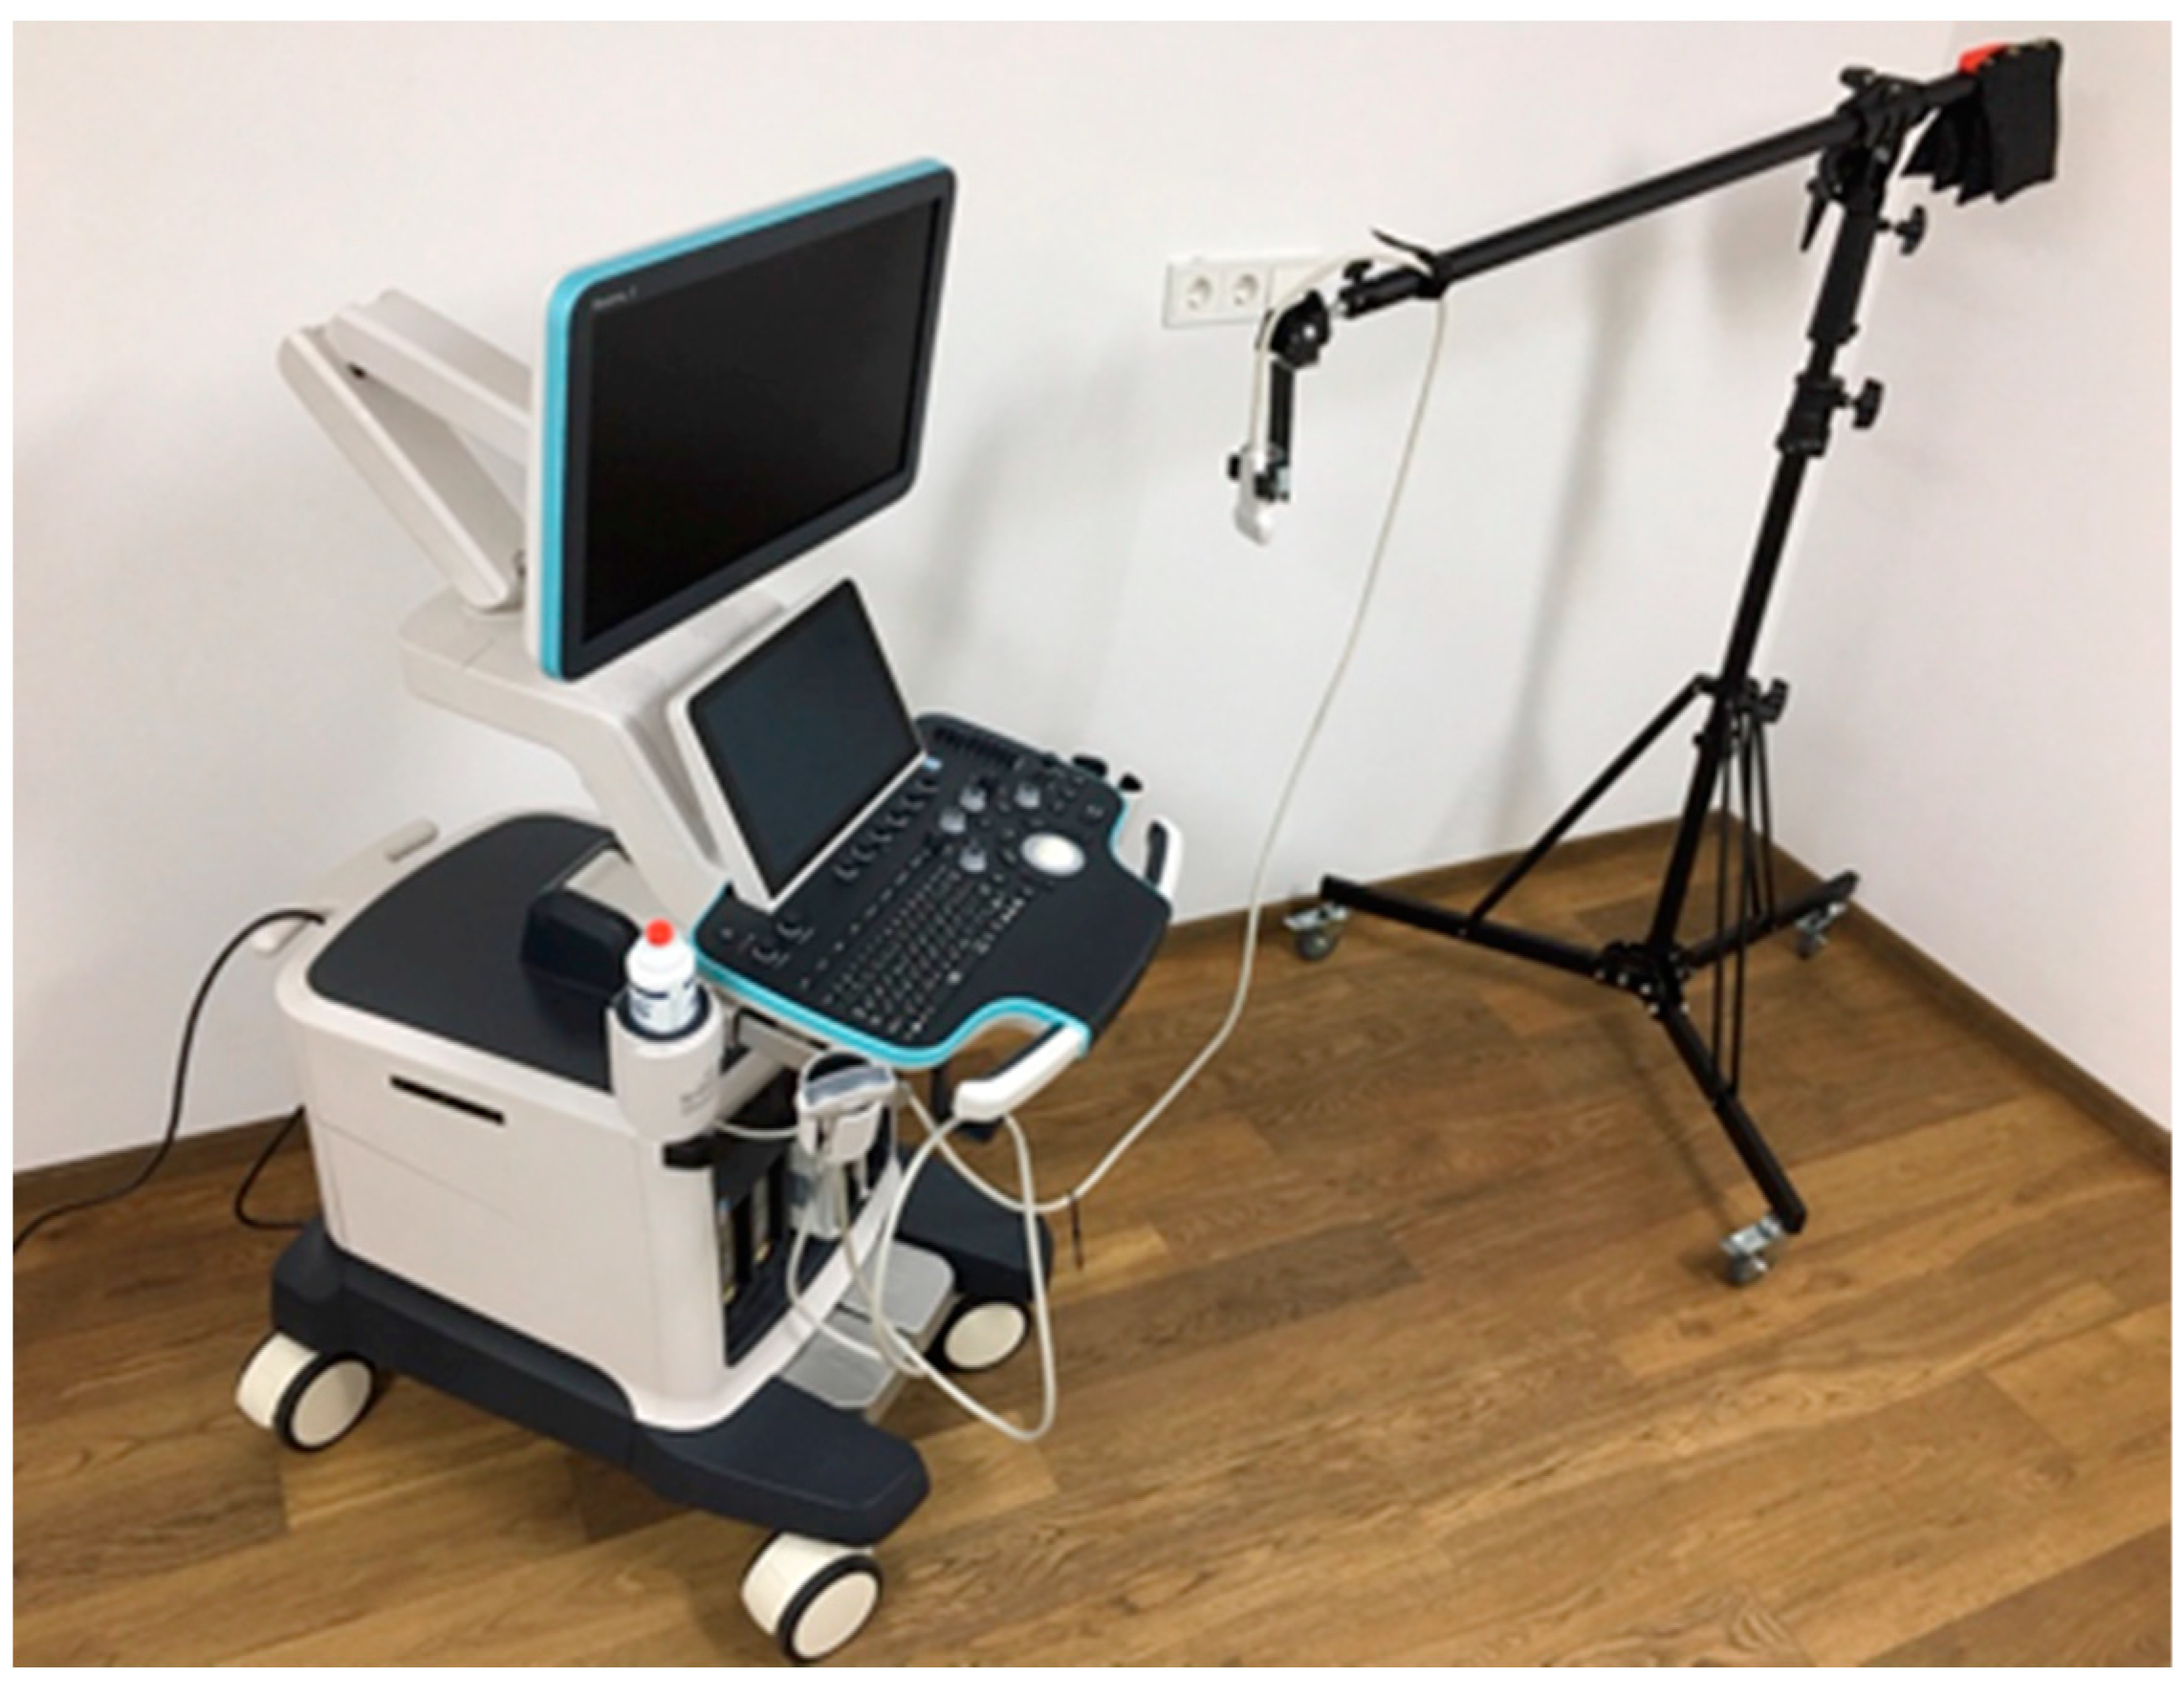
2.3. Measurement Technique
2.4. Statistical Analysis Methods
3. Results
3.1. Shear Wave Elastography (SWE)
3.2. Range of Motion (ROM)
3.3. Pressure Pain Threshold (PPT)
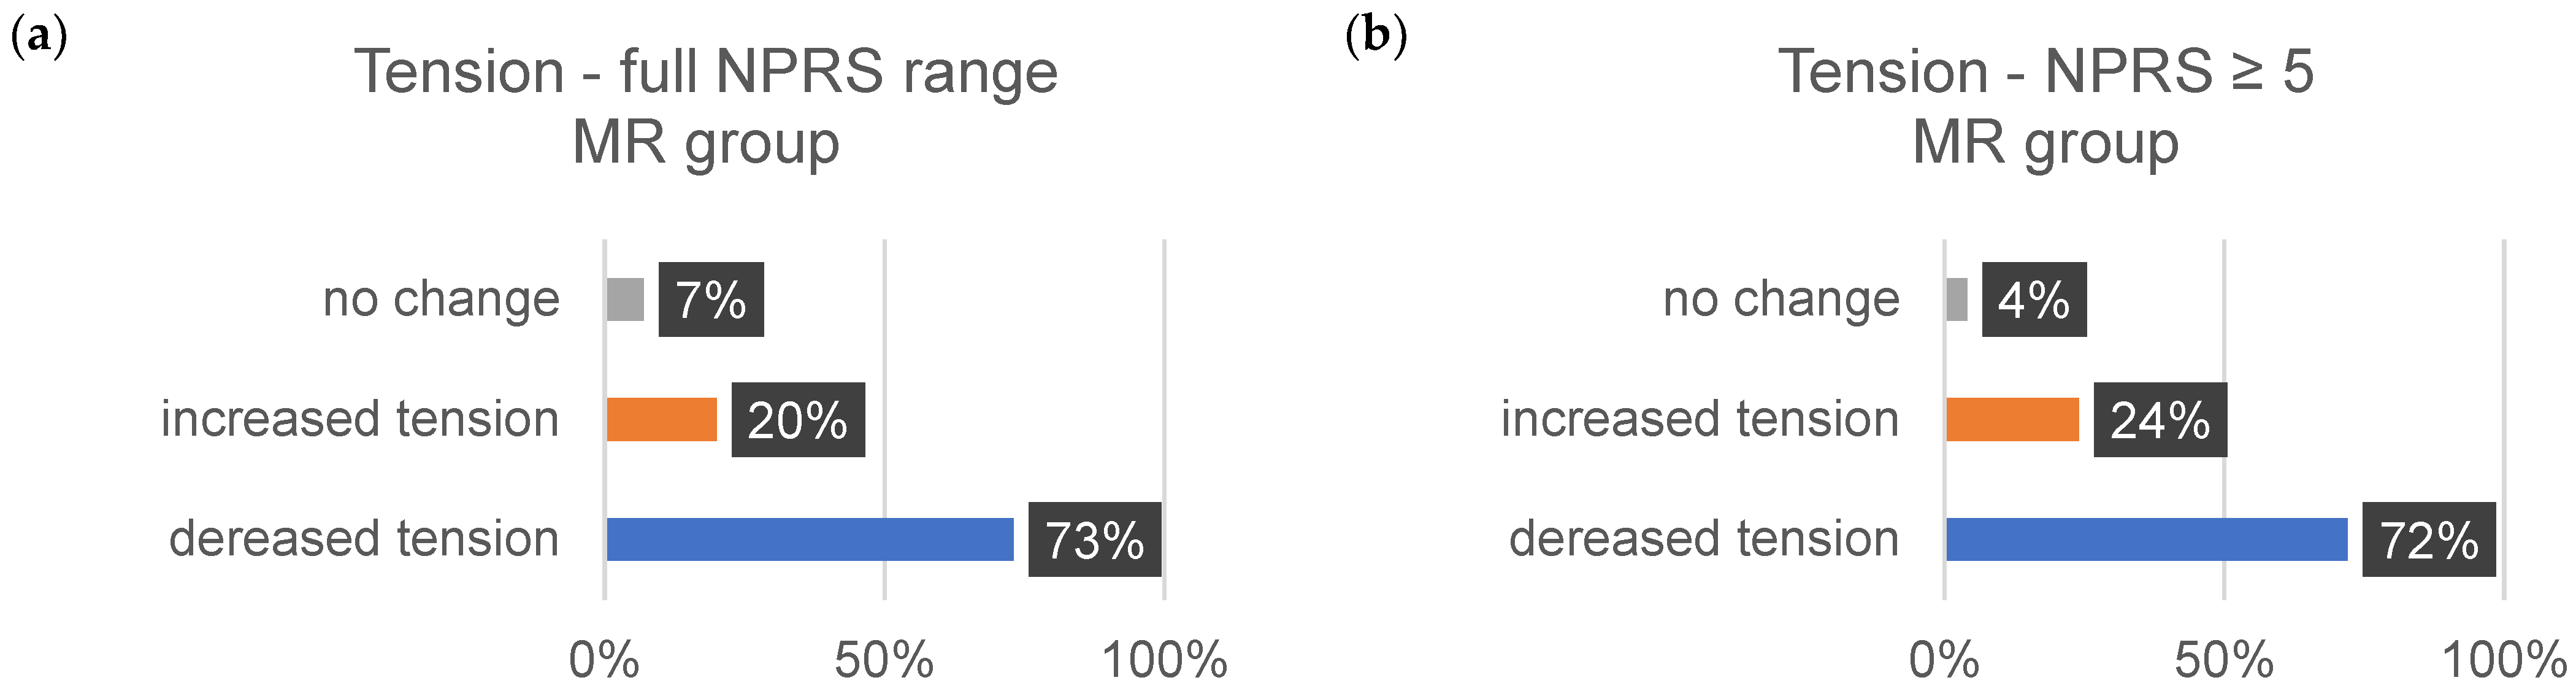
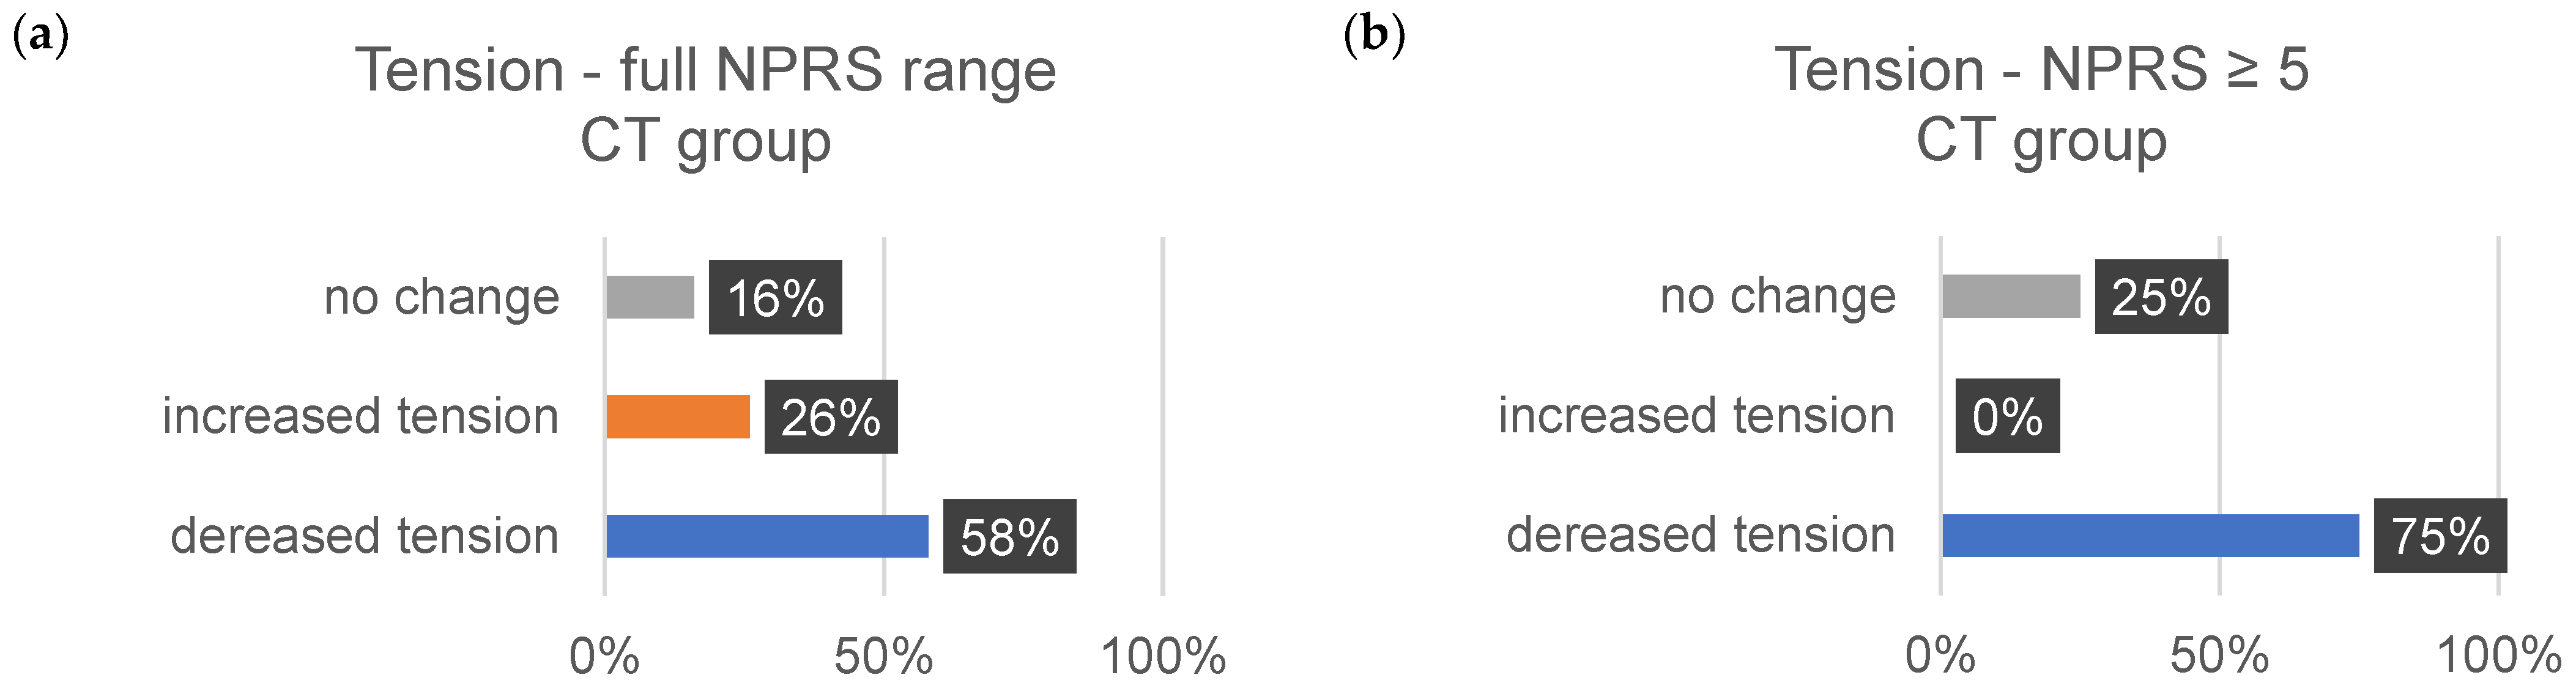
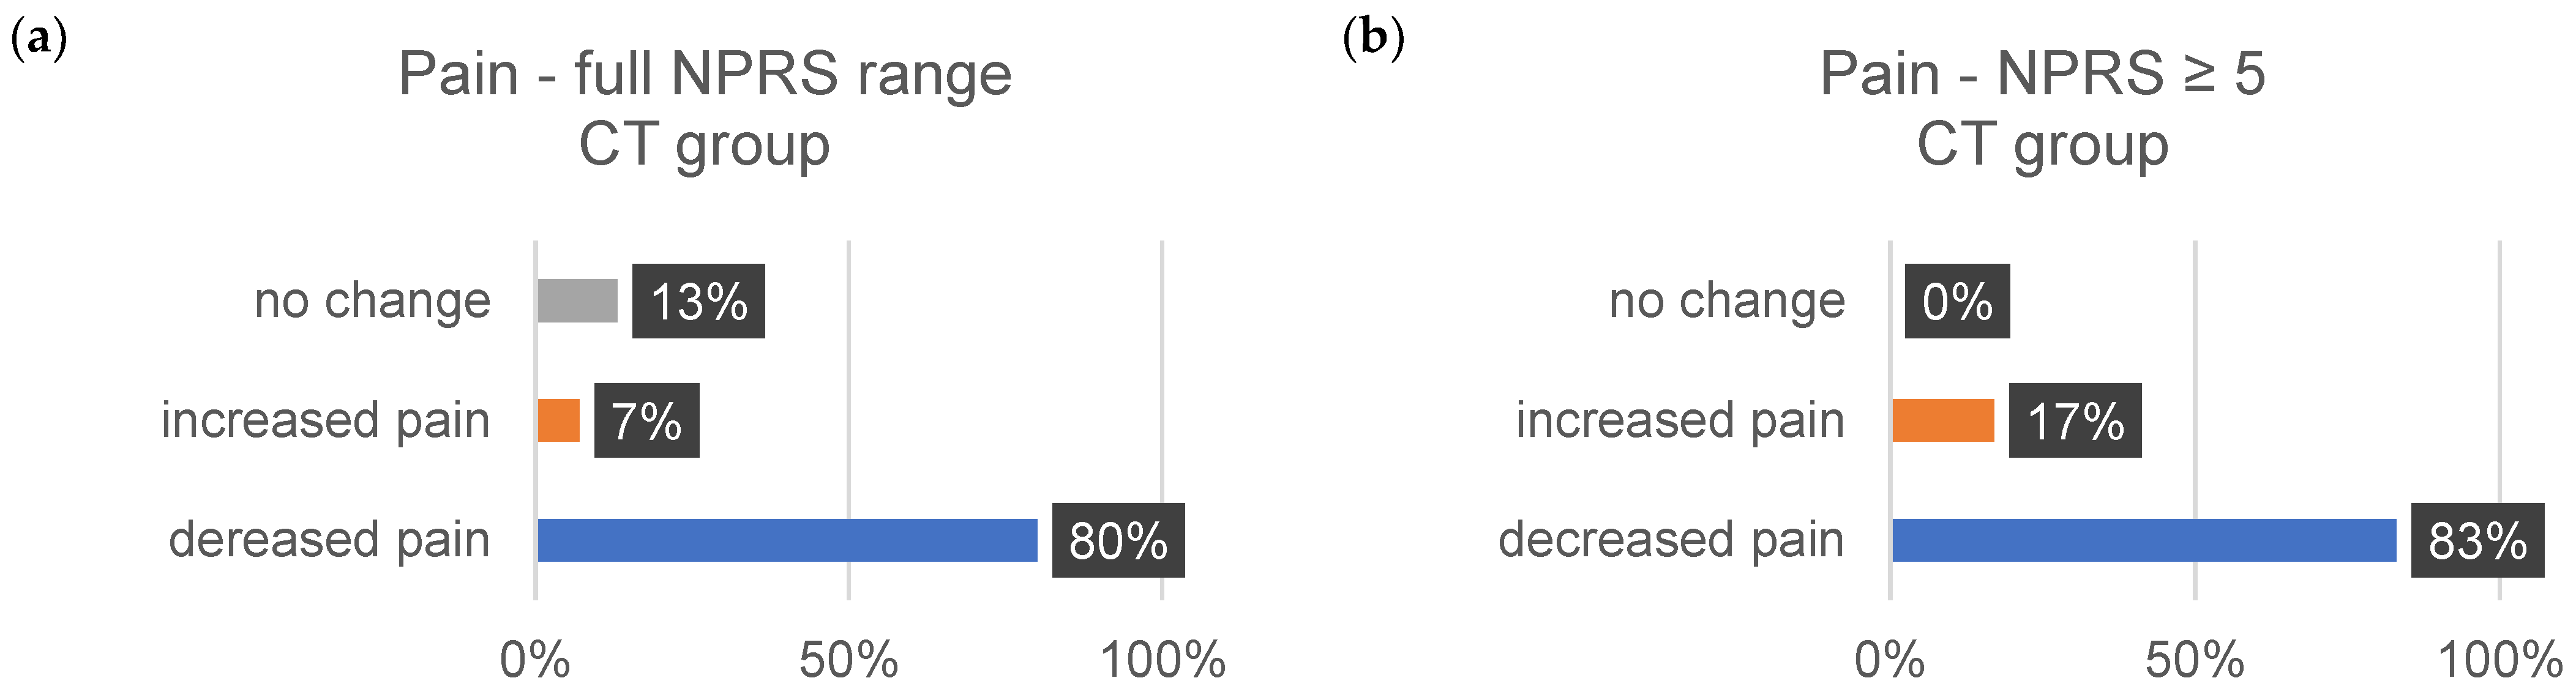
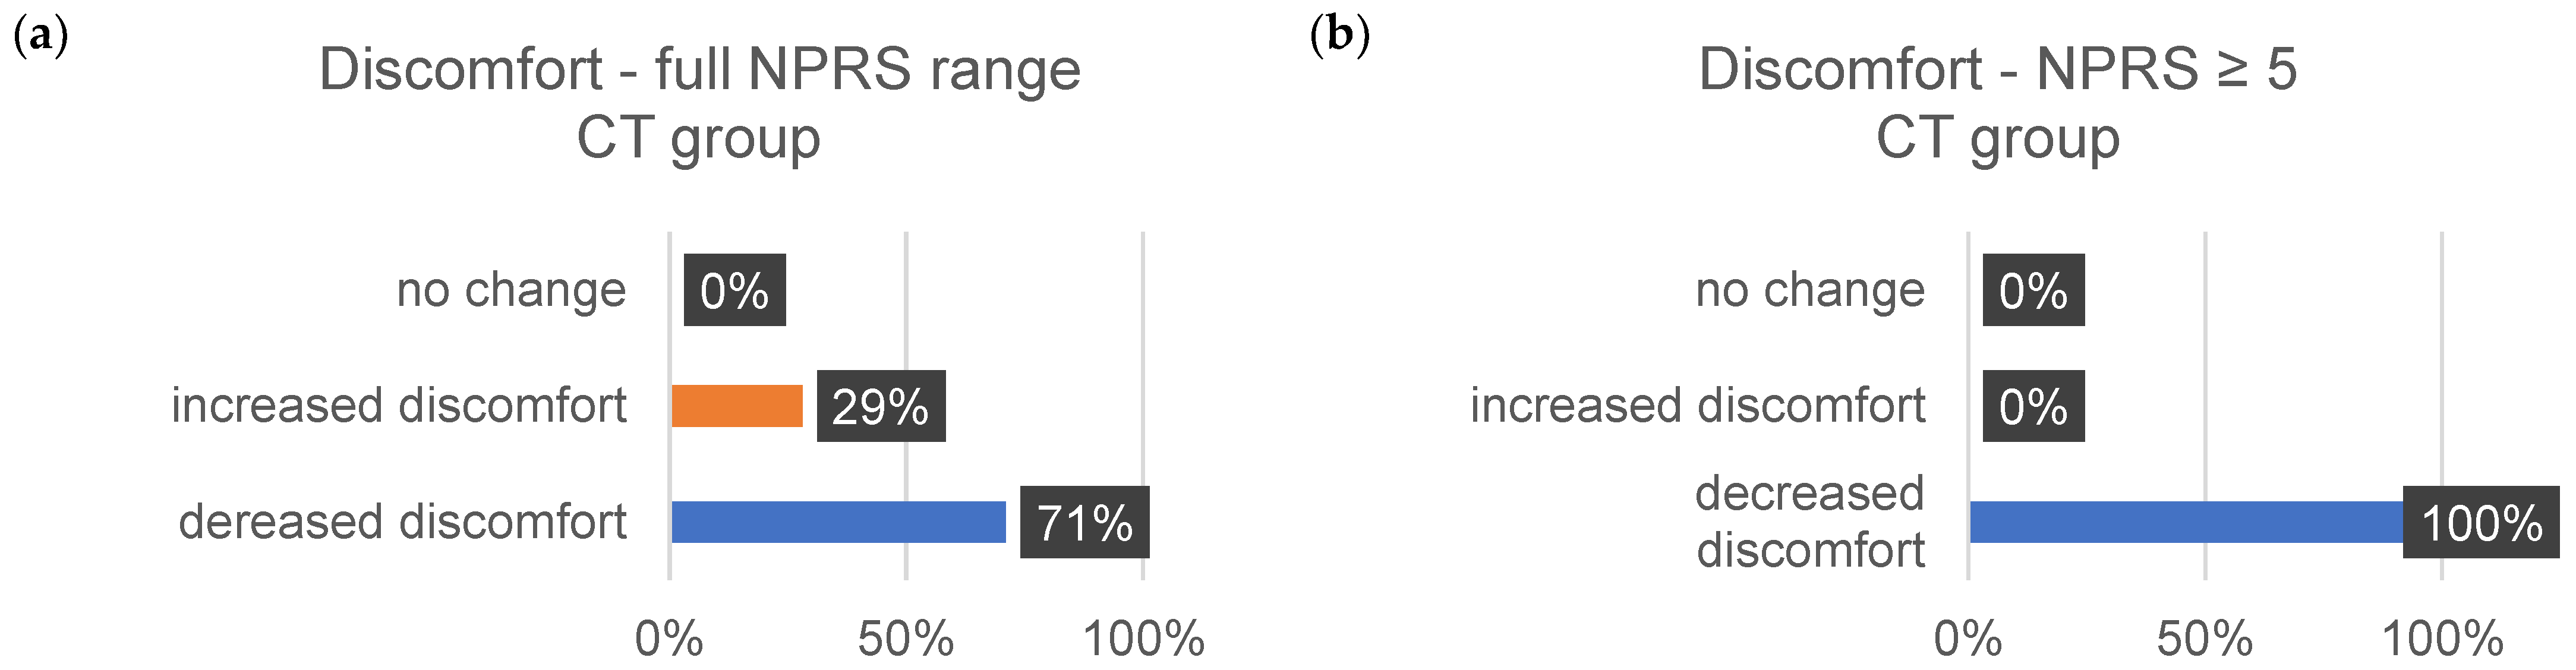
3.4. Well-Being
4. Discussion
4.1. Elastic Modulus Analysis
4.2. Range of Motion (ROM)
4.3. Pressure Pain Threshold (PPT)
4.4. Well-Being
5. Conclusions
Author Contributions
Funding
Institutional Review Board Statement
Informed Consent Statement
Data Availability Statement
Conflicts of Interest
References
- Wilke, J.; Hespanhol, L.; Behrens, M. Is It All About the Fascia? A Systematic Review and Meta-analysis of the Prevalence of Extramuscular Connective Tissue Lesions in Muscle Strain Injury. Orthop. J. Sports Med. 2019, 7, 2325967119888500. [Google Scholar] [CrossRef] [PubMed]
- Bourne, M.N.; Timmins, R.G.; Opar, D.A.; Pizzari, T.; Ruddy, J.D.; Sims, C.; Williams, M.D.; Shield, A.J. An Evidence-Based Framework for Strengthening Exercises to Prevent Hamstring Injury. Sports Med. 2018, 48, 251–267. [Google Scholar] [CrossRef] [PubMed]
- Zemková, E.; Poór, O.; Jeleň, M. Between-side differences in trunk rotational power in athletes trained in asymmetric sports. J. Back Musculoskelet. Rehabil. 2019, 32, 529–537. [Google Scholar] [CrossRef] [PubMed]
- McHugh, M.P.; Cosgrave, C.H. To stretch or not to stretch: The role of stretching in injury prevention and performance. Scand. J. Med. Sci. Sports 2010, 20, 169–181. [Google Scholar] [CrossRef]
- Owoeye, O.B.A.; Akinbo, S.R.A.; Tella, B.A.; Olawale, O.A. Efficacy of the FIFA 11+ Warm-Up Programme in Male Youth Football: A Cluster Randomised Controlled Trial. J. Sports Sci. Med. 2014, 13, 321–328. [Google Scholar] [PubMed]
- Bizzini, M.; Dvorak, J. FIFA 11+: An effective programme to prevent football injuries in various player groups worldwide-a narrative review. Br. J. Sports Med. 2015, 49, 577–579. [Google Scholar] [CrossRef] [PubMed]
- Silvers-Granelli, H.; Mandelbaum, B.; Adeniji, O.; Insler, S.; Bizzini, M.; Pohlig, R.; Junge, A.; Snyder-Mackler, L.; Dvorak, J. Efficacy of the FIFA 11+ Injury Prevention Program in the Collegiate Male Soccer Player. Am. J. Sports Med. 2015, 43, 2628–2637. [Google Scholar] [CrossRef]
- van Mechelen, W.; Hlobil, H.; Kemper, H.C.; Voorn, W.J.; de Jongh, H.R. Prevention of running injuries by warm-up, cool-down, and stretching exercises. Am. J. Sports Med. 1993, 21, 711–719. [Google Scholar] [CrossRef]
- Woods, K.; Bishop, P.; Jones, E. Warm-up and stretching in the prevention of muscular injury. Sports Med. 2007, 37, 1089–1099. [Google Scholar] [CrossRef]
- James, G.; Millecamps, M.; Stone, L.S.; Hodges, P.W. Dysregulation of the Inflammatory Mediators in the Multifidus Muscle After Spontaneous Intervertebral Disc Degeneration SPARC-null Mice is Ameliorated by Physical Activity. Spine 2018, 43, E1184–E1194. [Google Scholar] [CrossRef]
- Dubois, G.; Kheireddine, W.; Vergari, C.; Bonneau, D.; Thoreux, P.; Rouch, P.; Tanter, M.; Gennisson, J.-L.; Skalli, W. Reliable Protocol for Shear Wave Elastography of Lower Limb Muscles at Rest and During Passive Stretching. Ultrasound Med. Biol. 2015, 41, 2284–2291. [Google Scholar] [CrossRef] [PubMed]
- Creze, M.; Nordez, A.; Soubeyrand, M.; Rocher, L.; Maitre, X.; Bellin, M.F. Shear wave sonoelastography of skeletal muscle: Basic principles, biomechanical concepts, clinical applications, and future perspectives. Skelet. Radiol. 2018, 47, 457–471. [Google Scholar] [CrossRef] [PubMed]
- Bauermeister, W. Ultraschall Elastografie. In Stellenwert in der Sportmedizin; Sportärztezeitung: Mainz, Germany, 2019; Volume 2. [Google Scholar]
- Evans, A.; Whelehan, P.; Thomson, K.; McLean, D.; Brauer, K.; Purdie, C.; Baker, L.; Jordan, L.; Rauchhaus, P.; Thompson, A. Invasive Breast Cancer: Relationship between Shear-wave Elastographic Findings and Histologic Prognostic Factors. Radiology 2012, 263, 673–677. [Google Scholar] [CrossRef] [PubMed]
- Frulio, N.; Trillaud, H. Ultrasound elastography in liver. Diagn. Interv. Imaging 2013, 94, 515–534. [Google Scholar] [CrossRef] [PubMed]
- Eby, S.F.; Song, P.; Chen, S.; Chen, Q.; Greenleaf, J.F.; An, K.-N. Validation of shear wave elastography in skeletal muscle. J. Biomech. 2013, 46, 2381–2387. [Google Scholar] [CrossRef]
- Wu, H.; Chen, Q.; Liu, Y.; Chen, J.; Deng, W. Optimized algorithm in solid thyroid nodule elastography. Oncol. Lett. 2020, 20, 248. [Google Scholar] [CrossRef]
- Taş, S.; Onur, M.R.; Yılmaz, S.; Soylu, A.R.; Korkusuz, F. Shear Wave Elastography Is a Reliable and Repeatable Method for Measuring the Elastic Modulus of the Rectus Femoris Muscle and Patellar Tendon. J. Ultrasound Med. 2017, 36, 565–570. [Google Scholar] [CrossRef]
- Ichihashi, N.; Umegaki, H.; Ikezoe, T.; Nakamura, M.; Nishishita, S.; Fujita, K.; Umehara, J.; Nakao, S.; Ibuki, S. The effects of a 4-week static stretching programme on the individual muscles comprising the hamstrings. J. Sports Sci. 2016, 34, 2155–2159. [Google Scholar] [CrossRef]
- Le Sant, G.; Ates, F.; Brasseur, J.L.; Nordez, A. Elastography Study of Hamstring Behaviors during Passive Stretching. PLoS ONE 2015, 10, e0139272. [Google Scholar] [CrossRef]
- Baumer, T.G.; Davis, L.; Dischler, J.; Siegal, D.S.; van Holsbeeck, M.; Moutzouros, V.; Bey, M.J. Shear wave elastography of the supraspinatus muscle and tendon: Repeatability and preliminary findings. J. Biomech. 2017, 53, 201–204. [Google Scholar] [CrossRef]
- Gennisson, J.L.; Deffieux, T.; Fink, M.; Tanter, M. Ultrasound elastography: Principles and techniques. Diagn. Interv. Imaging 2013, 94, 487–495. [Google Scholar] [CrossRef] [PubMed]
- Parker, K.J.; Fu, D.; Graceswki, S.M.; Yeung, F.; Levinson, S.F. Vibration sonoelastography and the detectability of lesions. Ultrasound Med. Biol. 1998, 24, 1437–1447. [Google Scholar] [CrossRef] [PubMed]
- Hawker, G.A.; Mian, S.; Kendzerska, T.; French, M. Measures of adult pain: Visual Analog Scale for Pain (VAS Pain), Numeric Rating Scale for Pain (NRS Pain), McGill Pain Questionnaire (MPQ), Short-Form McGill Pain Questionnaire (SF-MPQ), Chronic Pain Grade Scale (CPGS), Short Form-36 Bodily Pain Scale (SF-36 BPS), and Measure of Intermittent and Constant Osteoarthritis Pain (ICOAP). Arthritis Care Res. 2011, 63 (Suppl. 11), S240–S252. [Google Scholar] [CrossRef]
- Williamson, A.; Hoggart, B. Pain: A review of three commonly used pain rating scales. J. Clin. Nurs. 2005, 14, 798–804. [Google Scholar] [CrossRef] [PubMed]
- Ferreira-Valente, M.A.; Pais-Ribeiro, J.L.; Jensen, M.P. Validity of four pain intensity rating scales. Pain 2011, 152, 2399–2404. [Google Scholar] [CrossRef] [PubMed]
- Royston, J.P. An Extension of Shapiro and Wilk’s W Test for Normality to Large Samples. J. R. Stat. Soc. Ser. C (Appl. Stat.) 1982, 31, 115–124. [Google Scholar] [CrossRef]
- Hollander, M.A.; Wolfe, D.; Chicken, E. The One-Way Layout. In Nonparametric Statistical Methods; Wiley: Hoboken, NJ, USA, 2015; pp. 202–288. [Google Scholar] [CrossRef]
- Spiegelman, D. Commentary: Some remarks on the seminal 1904 paper of Charles Spearman ‘The Proof and Measurement of Association between Two Things’. Int. J. Epidemiol. 2010, 39, 1156–1159. [Google Scholar] [CrossRef]
- Karstoft, K.; Pedersen, B.K. Exercise and type 2 diabetes: Focus on metabolism and inflammation. Immunol. Cell Biol. 2016, 94, 146–150. [Google Scholar] [CrossRef]
- Pillon Barcelos, R.; Freire Royes, L.F.; Gonzalez-Gallego, J.; Bresciani, G. Oxidative stress and inflammation: Liver responses and adaptations to acute and regular exercise. Free Radic. Res. 2017, 51, 222–236. [Google Scholar] [CrossRef]
- Simpson, R.J.; Kunz, H.; Agha, N.; Graff, R. Exercise and the Regulation of Immune Functions. Prog. Mol. Biol. Transl. Sci. 2015, 135, 355–380. [Google Scholar] [CrossRef]
- Farzanegi, P.; Dana, A.; Ebrahimpoor, Z.; Asadi, M.; Azarbayjani, M.A. Mechanisms of beneficial effects of exercise training on non-alcoholic fatty liver disease (NAFLD): Roles of oxidative stress and inflammation. Eur. J. Sport. Sci. 2019, 19, 994–1003. [Google Scholar] [CrossRef] [PubMed]
- Barr, A.E.; Barbe, M.F. Inflammation reduces physiological tissue tolerance in the development of work-related musculoskeletal disorders. J. Electromyogr. Kinesiol. 2004, 14, 77–85. [Google Scholar] [CrossRef] [PubMed]
- Franceschi, C.; Campisi, J. Chronic inflammation (inflammaging) and its potential contribution to age-associated diseases. J. Gerontol. A Biol. Sci. Med. Sci. 2014, 69 (Suppl. 1), S4–S9. [Google Scholar] [CrossRef] [PubMed]
- Shah, J.P.; Danoff, J.V.; Desai, M.J.; Parikh, S.; Nakamura, L.Y.; Phillips, T.M.; Gerber, L.H. Biochemicals associated with pain and inflammation are elevated in sites near to and remote from active myofascial trigger points. Arch. Phys. Med. Rehabil. 2008, 89, 16–23. [Google Scholar] [CrossRef]
- Matsuda, M.; Huh, Y.; Ji, R.R. Roles of inflammation, neurogenic inflammation, and neuroinflammation in pain. J. Anesth. 2019, 33, 131–139. [Google Scholar] [CrossRef]


| Parameter | Intervention Group I (MR) | Intervention Group II (CT) |
|---|---|---|
| Number of Participants (n) | 47 | 21 |
| Gender (Male) | 47 | 21 |
| Age (years) | 28.4 ± 4.6 | 29.1 ± 3.8 |
| Weight (kg) | 79.6 ± 9.3 | 81.2 ± 10.5 |
| Height (cm) | 181.5 ± 6.3 | 179.8 ± 5.9 |
| Duration of Intervention (weeks) | 12 | 12 |
| Physical Workload (hours/week) | 24.7 ± 2.9 | 24.5 ± 3.1 |
| Weight of Protective Gear (kg) | 33.5 ± 2.1 | 33.4 ± 2.3 |
| Protective Clothing | Weight |
|---|---|
| Total weight during training | 27.6 kg |
| Total weight in use | 33.5 kg |
| Incl. paramedic rucksack | 45.6 kg |
| Region | Description | Subject- Position | |
|---|---|---|---|
| 1 | M. trapezius Trap. L | A total of 10 cm paravertebral from the center of the cervical spine acromion | sitting |
| 2 | M. trapezius Trap R | A total of 10 cm paravertebral from the center of the cervical spine acromion | sitting |
| 3 | Plantar fascia PLF L | Calcaneus | prone position |
| 4 | Plantar fascia PLF R | Calcaneus | prone position |
| 5 | Thoracolumbar fascia TLF L4/5 L | Line ilium upper margin A total of 2 cm paravertebral proc. spinous process | prone position |
| 6 | Thoracolumbar fascia TLF L4/5 R | Line ilium upper margin A total of 2 cm paravertebral spinous process | prone position |
| 7 | M. gluteus medius GlutMed L | A total of 2.5 cm distal to the center of the crista iliac | prone position |
| 8 | M. gluteus medius GlutMed R | A total of 2.5 cm distal to the center of the crista iliac | prone position |
| 9 | M. gluteus maximus/GlutMax L | Midpoint between greater trochanter and sacrum | prone position |
| 10 | M. gluteus maximus/GlutMax R | Midpoint between greater trochanter and sacrum | prone position |
| 11 | M. biceps femoris BicFem L | A total of 20 cm from the fibula head in the direction Tuber ischiadicum | prone position |
| 12 | M. biceps femoris BicFem R | A total of 20 cm from the fibula head in the direction Tuber ischiadicum | prone position |
| 13 | M. gastrocnemius lateralis/Gastroc L | A total of 12 cm below the popliteal fossa, lateral calf | prone position |
| 14 | M. gastrocnemius lateralis/Gastroc R | A total of 12 cm below the popliteal fossa, lateral calf | prone position |
| 15 | Mm. adductor ADD L | A total of 20 cm from adductor tuberculum dist. femur towards the pubic tubercle | supine position |
| 16 | Mm. adductor ADD R | 20 cm from adductor tuberculum dist. femur towards pubic tubercle | supine position |
| 17 | M. rectus femoris RFM L | 0 cm from the upper edge of the patella in direction. Spina iliaca anterior superior (SIAS) | supine position |
| 18 | M. rectus femoris RFM R | 0 cm from the upper edge of the patella in direction. Spina iliaca anterior superior (SIAS) | supine position |
| 19 | M. tibialis anterior TibA L | 9 cm below the patella, 1 finger width lateral to the margo anterior of the tibia | supine position |
| 20 | M. tibialis anterior TibA L | 9 cm below the patella, 1 finger width lateral to the margo anterior of the tibia | supine position |
| Measurement Area | ∆E (%) | p-Value |
|---|---|---|
| M. trapezius | ||
| Trap Left | +48 | <0.001 |
| Trap Right | +61 | <0.001 |
| Mm. Adductor | ||
| ADD Left | +36 | <0.001 |
| ADD Right | +29 | <0.001 |
| M. biceps femoris | ||
| BicFem Left | +19 | <0.001 |
| BicFem Right | +43 | <0.001 |
| M. gluteus medius | ||
| GlMed Left | +25 | <0.001 |
| GlMed Right | +13 | 0.007 |
| M. gastrocnemius lateralis | ||
| GaLat Right | +18 | <0.001 |
| Thoracolumbar fascia | ||
| TLF Left | +15 | 0.039 |
| TLF Right | +17 | 0.003 |
| M. erector spinae | ||
| ESp Left | +15 | 0.001 |
| ESp Right | +14 | <0.001 |
| M. biceps femoris | ||
| RFM Left | +7 | 0.012 |
| RFM Right | +17 | <0.001 |
| M. gluteus maximus | ||
| GlMax Right | +10 | 0.006 |
| M. anterior tibialis | ||
| TibA Left | −9 | 0.014 |
| Measurement Area | ∆E (%) | p-Value |
|---|---|---|
| M. trapezius | ||
| Trap Left | +94 | <0.001 |
| Trap Right | +77 | <0.001 |
| Thoracolumbar fascia | ||
| TLF Left | +44 | <0.001 |
| M. biceps femoris | ||
| RFM Right | +35 | 0.001 |
| Mm. adductor | ||
| ADD Left | +31 | <0.001 |
| ADD Right | +40 | 0.002 |
| M. gastrocnemius lateralis | ||
| GaLat Right | +31 | 0.007 |
| GaLat Right | +31 | 0.007 |
| M. biceps femoris | ||
| BicFem Left | +31 | 0.002 |
| BicFem Right | +31 | <0.001 |
| M. gluteus maximus | ||
| GMax Right | +19 | 0.004 |
| M. erector spinae | ||
| ESp Left | +0.9 | 0.010 |
| M. gluteus medius | ||
| GlMed Left | +0.6 | 0.019 |
| Measurement Area | ∆E (%) MR | ∆E (%) CT | MR > CT CT > MR |
|---|---|---|---|
| M. Biceps femoris | |||
| BicFem R | +43 | +40 | MR > CT |
| Mm. adductor muscle | |||
| ADD R | +29 | +18 | MR > CT |
| M. gluteus medius muscle | |||
| GlMed L | +25 | +6 | MR > CT |
| Thoracolumbar fascia | |||
| TLF R | +17 | +10 * | MR > CT |
| M. erector spinae | |||
| ESp L | +15 | +9 | MR > CT |
| ESp R | +14 | +5 * | MR > CT |
| M. gluteus medius | |||
| GlMed R | +13 | 0 * | MR > CT |
| M. rectus femoris | |||
| RFM L | +7 | 0 * | MR > CT |
| M. trapezius | |||
| Trap L | +48 | +94 | CT > MR |
| Thoracolumbar fascia | |||
| TLF L | +15 | +44 | CT > MR |
| M. gastrocnemius lateralis | |||
| GaLat L | +9 * | +31 | CT > MR |
| M. rectus femoris | |||
| RFM R | +17 | +35 | CT > MR |
| M. trapezius | |||
| Trap R | +61 | +77 * | CT > MR |
| Mm. adductor | |||
| ADD L | +36 | +50 | CT > MR |
| M. gastrocnemius lateralis | |||
| GaLat R | +18 | +31 | CT > MR |
| M. anterior tibialis | |||
| TibA L | −9 | +5 * | CT > MR |
| M. biceps femoris | |||
| BicFem L | +19 | +31 | CT > MR |
| M. gluteus maximus | |||
| GlMax R | +10 | +19 | CT > MR |
| M. anterior tibialis | |||
| TibA L | −9 | +5 * | CT > MR |
| M. gluteus maximus | |||
| GlMax L | −7 | 0 * | CT > MR |
| M. anterior tibialis | |||
| TibA R | +5 * | +7 * | CT > MR |
| Plantar fascia | |||
| PLF L | 0 * | 1 * | CT > MR |
| Plantar fascia | |||
| PLF R | −9 * | −8 * | CT > MR |
| Measurement Area | MT1 | MT2 | ∆ROM Absolute (°/cm) | ∆ROM Relative (%) | p-Value (<0.05) |
|---|---|---|---|---|---|
| Finger–Floor Distance | |||||
| FBA | 4 * | 9 * | 5 * | 133 | 0.000 |
| Hip Internal Rotation | |||||
| Hip IR R | 20 | 28 | 8 | 40 | 0.000 |
| Foot Dorsiflexion 0° | |||||
| Do 0° R | 13 | 18 | 5 | 38 | 0.001 |
| Foot Dorsiflexion 90° | |||||
| Do 90° R | 22 | 30 | 8 | 36 | 0.001 |
| Hip Internal Rotation | |||||
| Hip IR L | 25 | 32 | 7 | 28 | 0.000 |
| Spinal Rotation | |||||
| WS Rot L | 30 | 38 | 8 | 27 | 0.028 |
| Foot Dorsiflexion 0° | |||||
| Do 0° L | 12 | 15 | 3 | 25 | 0.000 |
| Heel–Glute Distance | |||||
| FGA R | 15 | 12 | 3 * | 20 | 0.000 |
| Heel–Glute Distance | |||||
| FGA L | 14.5 | 12 | 3 * | 17 | 0.000 |
| Leg Extension | |||||
| LegExt L | 62 | 72 | 10 | 16 | 0.000 |
| LegExt R | 62 | 72 | 10 | 16 | 0.000 |
| Shoulder Internal Rotation | |||||
| Shoulder IR L | 55 | 62 | 7 | 13 | 0.000 |
| Shoulder External Rotation | |||||
| Shoulder AR R | 76 | 85 | 9 | 12 | 0.000 |
| Shoulder Internal Rotation | |||||
| Shoulder IR R | 59 | 65 | 6 | 10 | 0.001 |
| Shoulder External Rotation | |||||
| Shoulder AR L | 82 | 89 | 7 | 9 | 0.001 |
| Hip External Rotation | |||||
| Hip AR L | 39 | 42 | 3 | 8 | 0.008 |
| Spinal Lateral Flexion | |||||
| WS Latflex L | 39 | 42 | 3 | 8 | 0.000 |
| Spinal Rotation | |||||
| WS Rot R | 30 | 32 | 2 | 7 | 0.024 |
| Cervical Spine Flexion | |||||
| C-spine Flexion | 59 | 63 | 4 | 7 | 0.000 |
| C-spine Lateral Flexion | |||||
| C-spine Latflex R | 40 | 42 | 2 | 5 | 0.000 |
| Cervical Spine Lateral Flexion | |||||
| C-spine Latflex L | 42 | 44 | 2 | 5 | 0.003 |
| Cervical Spine Rotation | |||||
| C-spine Rot R | 70 | 73 | 3 | 4 | 0.000 |
| Hip External Rotation | |||||
| Hip ext. rot. R | 43 | 44 | 1 | 2 | 0.000 |
| Cervical Spine Extension | |||||
| C-spine Extension | 78 | 79 | 1 | 1 | 0.028 |
| Cervical Spine Rotation | |||||
| C-spine Rot L | 79 | 78 | 0 | 0 | 0.031 |
| Cervical Spine Lateral Flexion | |||||
| C-spine Latflex R | 45 | 45 | 0 | 0 | 0.000 |
| Foot Dorsiflexion 90° | |||||
| Foot d-flex 90° L | 20 | 20 | 0 | 0 | 0.003 |
| Measurement Area | MT1 | MT2 | ∆ROM Absolute (°/cm) | ∆ROM Relative (%) | p-Value (<0.05) |
|---|---|---|---|---|---|
| Finger–Bottom Distance | |||||
| FBA | 3.6 | 7 | 3 * | 94 | 0.000 |
| Hip Internal Rotation | |||||
| Hip IR R | 20 | 26 | 6 | 30 | 0.050 |
| Hip IR L | 24 | 31 | 7 | 29 | 0.000 |
| Heel–Buttock Distance | |||||
| FGA R | 16 | 13 | 3 * | 19 | 0.000 |
| Shoulder Internal Rotation | |||||
| Shoulder IR L | 53 | 61 | 8 | 15 | 0.001 |
| Heel–Buttock Distance | |||||
| FGA L | 16.5 | 15 | 2 * | 12 | 0.002 |
| Shoulder External Rotation | |||||
| Shoulder ext. rot L | 81 | 88 | 7 | 9 | 0.004 |
| Shoulder int. rot. R | 57 | 62 | 5 | 9 | 0.014 |
| Cervical Spine Flexion | |||||
| C-spine Latflex | 59 | 64 | 5 | 8 | 0.021 |
| Foot Dorsiflexion 90° | |||||
| Foot do-fl 90° L | 17 | 18 | 1 | 6 | 0.018 |
| Shoulder External Rotation | |||||
| Shoulder ext. rot. R | 79 | 84 | 5 | 6 | 0.036 |
| Spinal Lateral Flexion | |||||
| Spine Latflex L | 40 | 42 | 2 | 5 | 0.001 |
| Spine Latflex R | 39 | 41 | 2 | 5 | 0.001 |
| Cervical Spine Rotation | |||||
| C-spine Rot L | 70 | 73 | 3 | 4 | 0.005 |
| C-spine Rot R | 70 | 72 | 2 | 3 | 0.029 |
| Foot Dorsiflexion 0° | |||||
| Foot do-fl 0° L | 11 | 11 | 0 | 0 | 0.019 |
| Measurement Area | ∆PPT (N) T1–T2 MR | p-Value (<0.05) | ∆PPT (N) T1–T2 CT | p-Value (<0.05) | ∆PPT (N) T1–T2 MR-CT |
|---|---|---|---|---|---|
| Trapezius Muscle | |||||
| Trap L | −3 | 0.420 | +2 | 0.530 | −MR +CT |
| Trap R | +1 | 0.696 | −4 | 0.726 | +MR −CT |
| Measurement Area | ∆PPT (N) T1–T2 MR | p-Value (<0.05) | ∆PPT (N) T1–T2 CT | p-Value (<0.05) | ∆PPT (N) T1–T2 MR-CT |
|---|---|---|---|---|---|
| Thoracolumbar fascia | |||||
| TLF L | −22.4 | 0.002 | −3.4 | 0.741 | −MR −CT |
| TLF R | −24 | 0.001 | -12 | 0.308 | −MR −CT |
| ∆Tension (%) | ∆Pain (%) | ∆Discomfort (%) | ||||
|---|---|---|---|---|---|---|
| 1–10 | ≥5 | 1–10 | ≥5 | 1–10 | ≥5 | |
| decrease | ||||||
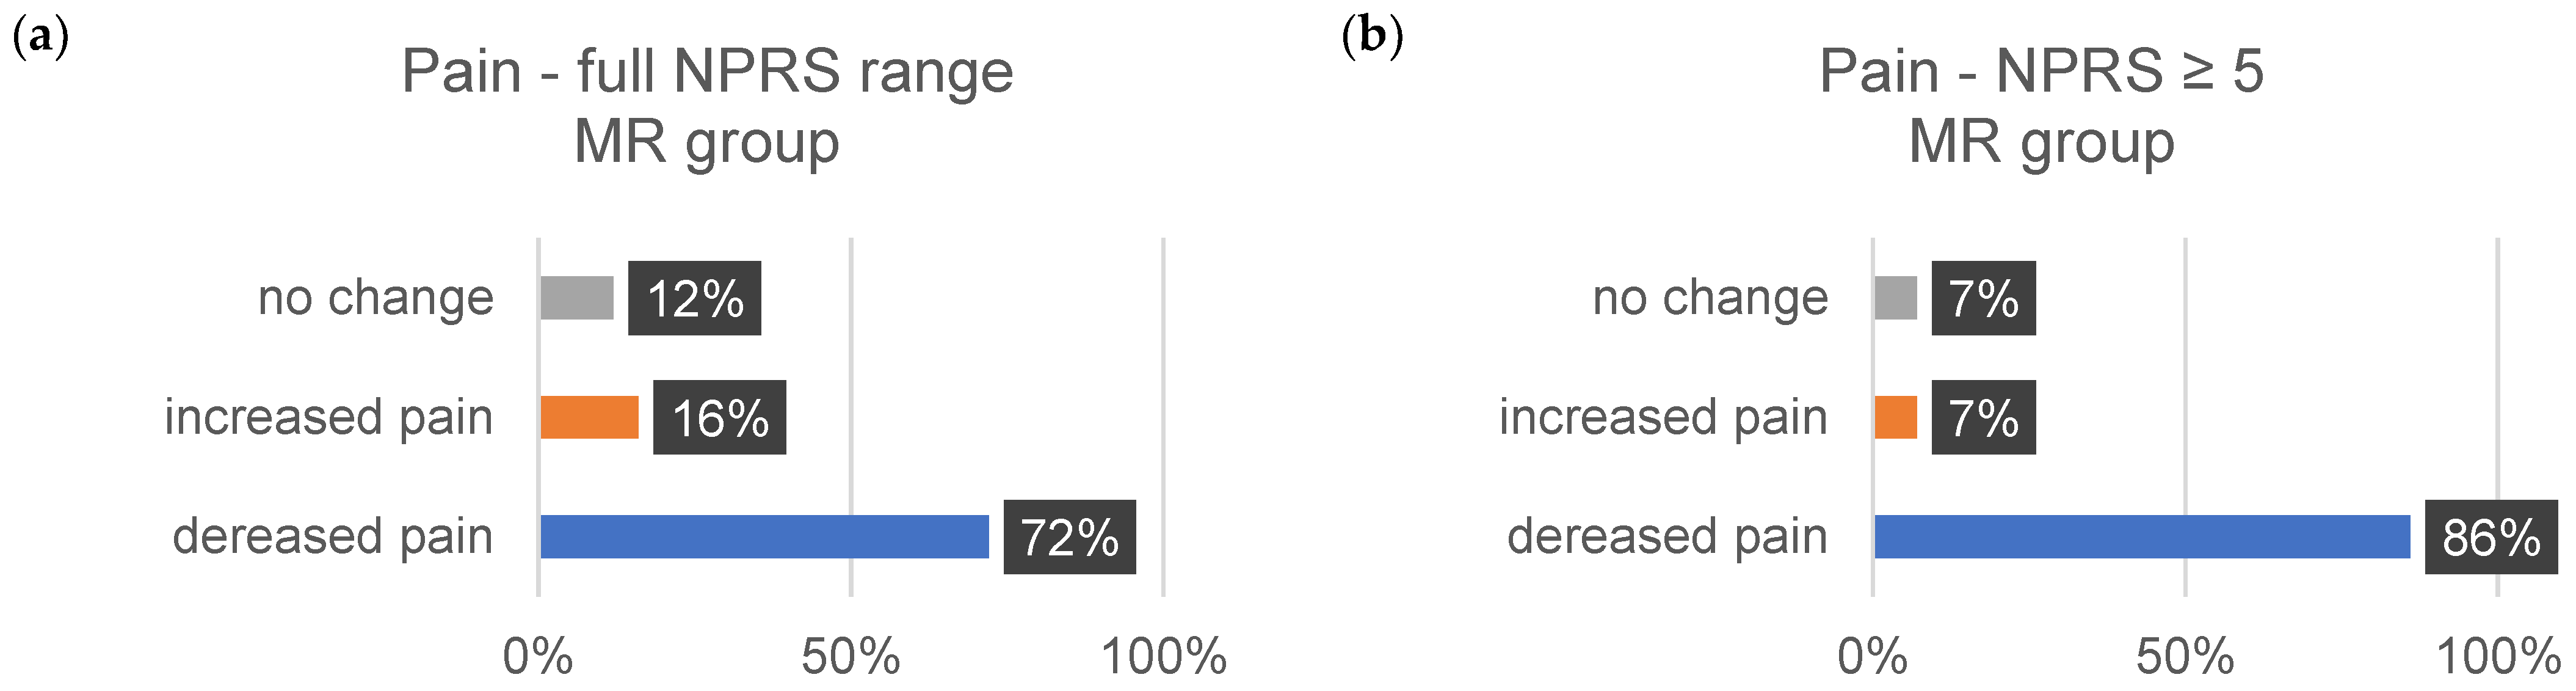
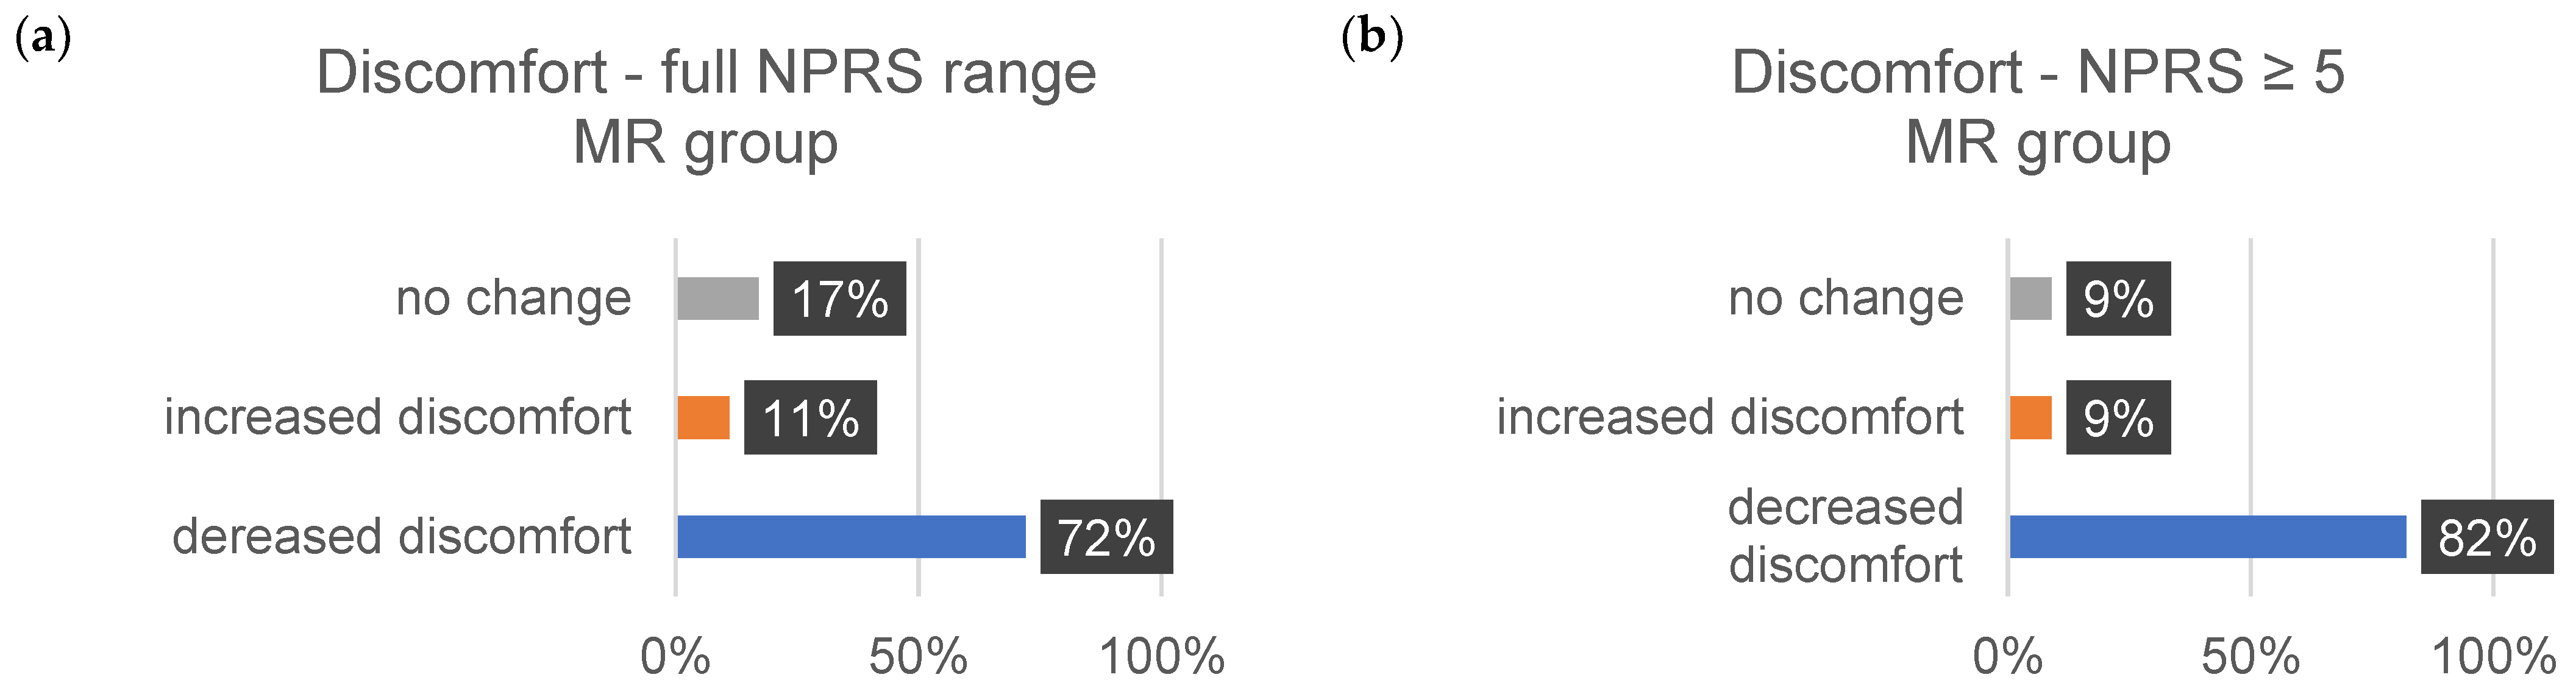
| MR | 73 | 72 | 72 | 86 | 72 | 82 |
| CT | 58 | 75 | 80 | 83 | 71 | 100 |
| increase | ||||||
| MR | 20 | 24 | 16 | 7 | 11 | 29 |
| CT | 26 | 0 | 7 | 17 | 9 | 0 |
| no change | ||||||
| MR | 7 | 4 | 12 | 7 | 17 | 9 |
| CT | 16 | 25 | 13 | 0 | 9 | 0 |
Disclaimer/Publisher’s Note: The statements, opinions and data contained in all publications are solely those of the individual author(s) and contributor(s) and not of MDPI and/or the editor(s). MDPI and/or the editor(s) disclaim responsibility for any injury to people or property resulting from any ideas, methods, instructions or products referred to in the content. |
© 2024 by the authors. Licensee MDPI, Basel, Switzerland. This article is an open access article distributed under the terms and conditions of the Creative Commons Attribution (CC BY) license (https://creativecommons.org/licenses/by/4.0/).
Share and Cite
Slomka, G.; Schleip, R.; Frei, P.; Kurpiers, N.; Krämer, M.; Bauermeister, K.; Bauermeister, W. The Influence of Mobility Training on the Myofascial Structures of the Back and Extremities. J. Clin. Med. 2024, 13, 329. https://doi.org/10.3390/jcm13020329
Slomka G, Schleip R, Frei P, Kurpiers N, Krämer M, Bauermeister K, Bauermeister W. The Influence of Mobility Training on the Myofascial Structures of the Back and Extremities. Journal of Clinical Medicine. 2024; 13(2):329. https://doi.org/10.3390/jcm13020329
Chicago/Turabian StyleSlomka, Gunda, Robert Schleip, Peter Frei, Nicolas Kurpiers, Michael Krämer, Katharina Bauermeister, and Wolfgang Bauermeister. 2024. "The Influence of Mobility Training on the Myofascial Structures of the Back and Extremities" Journal of Clinical Medicine 13, no. 2: 329. https://doi.org/10.3390/jcm13020329
APA StyleSlomka, G., Schleip, R., Frei, P., Kurpiers, N., Krämer, M., Bauermeister, K., & Bauermeister, W. (2024). The Influence of Mobility Training on the Myofascial Structures of the Back and Extremities. Journal of Clinical Medicine, 13(2), 329. https://doi.org/10.3390/jcm13020329