

A New Histology-Based Prognostic Index for Aggressive T-Cell lymphoma: Preliminary Results of the “TCL Urayasu Classification”

 , , , ,
Abstract
1. Introduction (A Brief Review)
2. Patients and Methods
2.1. Immunohistochemistry
2.2. Statistical Analysis
3. Results
4. Discussion
Supplementary Materials
Author Contributions
Funding
Institutional Review Board Statement
Informed Consent Statement
Data Availability Statement
Acknowledgments
Conflicts of Interest
References
- Luan, Y.; Li, X.; Luan, Y.; Luo, J.; Dong, Q.; Ye, S.; Li, Y.; Li, Y.; Jia, L.; Yang, J.; et al. Therapeutic challenges in peripheral T-cell lymphoma. Mol. Cancer 2024, 23, 2. [Google Scholar] [CrossRef] [PubMed]
- Vega, F.; Amador, C.; Chadburn, A.; Hsi, E.D.; Slack, G.; Medeiros, L.J.; Feldman, A.L. Genetic profiling and biomarkers in peripheral T-cell lymphomas: Current role in the diagnostic work-up. Mod. Pathol. 2022, 35, 306–318. [Google Scholar] [CrossRef] [PubMed]
- Nitta, H.; Takizawa, H.; Mitsumori, T.; Iizuka-Honma, H.; Araki, Y.; Fujishiro, M.; Tomita, S.; Kishikawa, S.; Hashizume, A.; Sawada, T.; et al. Possible New Histological Prognostic Index for Large B-Cell Lymphoma. J. Clin. Med. 2023, 12, 6324. [Google Scholar] [CrossRef] [PubMed]
- Duan, X.; Iwanowycz, S.; Ngoi, S.; Hill, M.; Zhao, Q.; Liu, B. Molecular Chaperone GRP94/GP96iCancers: Oncogenesis and Therapeutic Target. Front. Oncol. 2021, 11, 629846. [Google Scholar] [CrossRef] [PubMed]
- Kim, J.W.; Bin Cho, Y.; Lee, S. Cell Surface GRP94 as a Novel Emerging Therapeutic Target for Monoclonal Antibody Cancer Therapy. Cells 2021, 10, 670. [Google Scholar] [CrossRef] [PubMed]
- Akinyemi, A.O.; Simpson, K.E.; Oyelere, S.F.; Nur, M.; Ngule, C.M.; Owoyemi, B.C.D.; Ayarick, V.A.; Oyelami, F.F.; Obaleye, O.; Esoe, D.-P.; et al. Unveiling the dark side of glucose-regulated protein 78 (GRP78) in cancers and other human pathology: A systematic review. Mol. Med. 2023, 29, 112. [Google Scholar] [CrossRef] [PubMed]
- Timmins, M.A.; Ringshausen, I. Transforming Growth Factor-Beta Orchestrates Tumour and Bystander Cells in B-Cell Non-Hodgkin Lymphoma. Cancers 2022, 14, 1772. [Google Scholar] [CrossRef]
- Zhoua, X.; Lib, Z.; Zhoua, J. Tumor necrosis factor a in the onset and progression of leukemia. Exp. Hematol. 2017, 45, 17–26. [Google Scholar] [CrossRef]
- Gravelle, P.; Burroni, B.; Péricart, S.; Rossi, C.; Bezombes, C.; Tosolini, M.; Damotte, D.; Brousset, P.; Fournié, J.J.; Laurent, C. Mechanisms of PD-1/PD-L1 expression and prognostic relevance in non-Hodgkin lymphoma: A summary of immunohistochemical studies. Oncotarget 2017, 8, 44960–44975. [Google Scholar] [CrossRef] [PubMed]
- Gu, Q.; Li, J.; Chen, Z.; Zhang, J.; Shen, H.; Miao, X.; Zhou, Y.; Xu, X.; He, S. Expression and Prognostic Significance of PD-L2 in Diffuse Large B-Cell Lymphoma. Front. Oncol. 2021, 11, 664032. [Google Scholar] [CrossRef]
- Rodríguez-Antona, C.; Leskelä, S.; Zajac, M.; Cuadros, M.; Alvés, J.; Moneo, M.V.; Martín, C.; Cigudosa, J.C.; Carnero, A.; Robledo, M.; et al. Expression of CYP3A4 as a predictor of response to chemotherapy in peripheralT-cell lymphomas. Blood 2007, 110, 3345–3351. [Google Scholar] [CrossRef] [PubMed]
- Xiong, X.; Yu, D.; Gao, Q.; Zhang, Y.; Yin, Q.; Chen, X.; Xiao, H.; Tong, R. Association between CYP2B6 c.516G >T variant and acute leukaemia. A protocol for systematic review and meta-analysis. Medicine 2021, 100, 32. [Google Scholar] [CrossRef] [PubMed]
- Reddi, D.; Seaton, B.W.; Woolston, D.; Aicher, L.; Monroe, L.D.; Mao, Z.J.; Harrell, J.C.; Radich, J.P.; Advani, A.; Papadantonakis, N.; et al. AKR1C3 expression in T acute lymphoblastic leukemia/lymphoma for clinical use as a biomarker. Sci. Rep. 2022, 12, 5809. [Google Scholar] [CrossRef] [PubMed]
- Laffin, B.; Petrash, J.M. Expressionofthealdo-ketoreductases AKR1B1 and AKR1B10inhumancancers. Front. Pharmacol. 2012, 3, 104. [Google Scholar] [CrossRef] [PubMed]
- He, R.-Z.; Jiang, J.; Luo, D.-X. New cancers therapy through targeting Aldo-keto reductase family 1 member B10 with miRNAs. Transl. Cancer Res. 2020, 9, 4043–4045. [Google Scholar] [CrossRef]
- Ramdial, J.L.; Valdez, B.C.; Andersson, B.S.; Nieto, Y. Romidepsin antagonism with CHOEP. Leukemia 2023, 37, 1160–1161. [Google Scholar] [CrossRef] [PubMed]
- Sahores, A.; Carozzo, A.; May, M.; Gómez, N.; Di Siervi, N.; Serro, M.D.S.; Yaneff, A.; Rodríguez-González, A.; Abba, M.; Shayo, C.; et al. Multidrug transporter MRP4/ABCC4 as a key determinantof pancreatic cancer aggressiveness. Sci. Rep. 2020, 10, 14217. [Google Scholar] [CrossRef] [PubMed]
- Nie, X.; Clifford, P.M.; Bhat, R.; Heintzelman, R.; Abraham, M.; Hou, J.S. Thymidine phosphorylase expression in B-cell lymphomas and its significance: A new prognostic marker? Anal. Quant. Cytopathol. Histpathol. 2013, 35, 301–305. [Google Scholar]
- Johnson, W.T.; Ganesan, N.; Epstein-Peterson, Z.D.; Moskowitz, A.J.; Stuver, R.N.; Maccaro, C.R.; Galasso, N.; Chang, T.; Khan, N.; Aypar, U.; et al. TP53 mutations identify high-risk events for peripheral T-cell lymphoma treated with CHOP-based chemotherapy. Blood Adv. 2023, 7, 5172–5186. [Google Scholar] [CrossRef]
- Hasenan, N.; Isa, S.A.M.; Hussain, F.A. Association between c-Myc Expression with Clinicopathological Features in T And NK Cell Lymphomas. Asian Pac. J. Cancer Prev. 2021, 22, 4011–4016. [Google Scholar] [CrossRef]
- Català, A.; Pastor-Anglada, M.; Caviedes-Cárdenas, L.; Malatesta, R.; Rives, S.; Vega-García, N.; Camós, M.; Fernández-Calotti, P. FLT3 is implicated in cytarabine transport by human equilibrative nucleoside transporter 1 in pediatric acute leukemia. Oncotarget 2016, 7, 49786–49799. [Google Scholar] [CrossRef]
- Chen, J.; Hurford, M.; Mekan, S.; Simpkins, H. Downregulation of glutathione transferase π sensitizes lymphoma/leukaemia cells to platinum-based chemotherapy. Br. J. Haematol. 2013, 162, 135–137. [Google Scholar] [CrossRef] [PubMed]
- Takizawa, H.; Araki, Y.; Fujishiro, M.; Tomita, S.; Kishikawa, S.; Hashizume, A.; Mitsumori, T.; Nitta, H.; Iizuka-Honma, H.; Sawada, T.; et al. Role of TGF-beta1 and TNF-alpha1 produced by neoplastic cells in the pathogenesis of fibrosis in patients with hematologic neoplasms. J. Clin. Exp. Hematop. 2023, 63, 83–89. [Google Scholar] [CrossRef] [PubMed]
- He, X.; Chen, Z.; Fu, T.; Jin, X.; Yu, T.; Liang, Y.; Zhao, X.; Huang, L. Ki-67 is a valuable prognostic predictor of lymphoma but its utility varies in lymphoma subtypes: Evidence from a systematic meta-analysis. BMC Cancer 2014, 14, 153. [Google Scholar] [CrossRef] [PubMed]
- Nakamura, N.; Kanemura, N.; Matsumoto, T.; Nakamura, H.; Ikoma, Y.; Shibata, Y.; Kitagawa, J.; Kasahara, S.; Yamada, T.; Sawada, M.; et al. Comparison of the prognostic impact of IPI and PIT in peripheral T-cell lymphoma in real-world practice with a large elderly population. Sci. Rep. 2023, 13, 19060. [Google Scholar] [CrossRef] [PubMed]
- Foster, C.; Kuruvilla, J. Treatment approaches in relapsed or refractory peripheral Tcell lymphomas [version 1; peer review: 3 approved]. F1000Research 2020, 9, 1091. [Google Scholar] [CrossRef] [PubMed]
- Kanda, Y. Investigation of the freely available easy-to-use software ‘EZR’ for medical statistics. Bone Marrow Transplant. 2013, 48, 452–458. [Google Scholar] [CrossRef]
- Piccaluga, P.P.; Agostinelli, C.; Gazzola, A.; Mannu, C.; Bacci, F.; Sabattini, E.; Pileri, S.A. Prognostic Markers in Peripheral T-Cell Lymphoma. Curr. Hematol. Malign Rep. 2010, 5, 222–228. [Google Scholar] [CrossRef] [PubMed]
- Bellei, M.; Foss, F.M.; Shustov, A.R.; Horwitz, S.M.; Marcheselli, L.; Kim, W.S.; Cabrera, M.E.; Dlouhy, I.; Nagler, A.; Advani, R.H.; et al. The outcome of peripheral T-cell lymphoma patients failing first-line therapy: A report fromthe prospective, International T-Cell Project. Haematologica 2018, 103, 1191–1197. [Google Scholar] [CrossRef]
- Kurokawa, Y.; Honma, Y.; Sawaki, A.; Naito, Y.; Iwagami, S.; Komatsu, Y.; Takahashi, T.; Nishida, T.; Doi, T. Pimitespib in patients with advanced gastrointestinal stromal tumor(CHAPTER-GIST-301): A randomized, double-blind, placebo-controlled phase III trial. Ann. Oncol. 2022, 33, 959–967. [Google Scholar] [CrossRef]
- Ikebe, E.; Shimosaki, S.; Hasegawa, H.; Iha, H.; Tsukamoto, Y.; Wang, Y.; Sasaki, D.; Imaizumi, Y.; Miyazaki, Y.; Yanagihara, K.; et al. TAS-116 (pimitespib), a heat shock protein 90 inhibitor, shows efficacy in preclinical models of adult T-cell leukemia. Cancer Sci. 2022, 113, 684–696. [Google Scholar] [CrossRef] [PubMed]
- Angeles-Floriano, T.; Rivera-Torruco, G.; García-Maldonado, P.; Juárez, E.; Gonzalez, Y.; Parra-Ortega, I.; Vilchis-Ordoñez, A.; Lopez-Martinez, B.; Arriaga-Pizano, L.; Orozco-Ruíz, D.; et al. Cell surface expression of GRP78 and CXCR4 is associated with childhood high-risk acute lymphoblastic leukemia at diagnostics. Sci. Rep. 2022, 12, 2322. [Google Scholar] [CrossRef] [PubMed]
- Ansell, S.M. PD-1 Blockade in Classic Hodgkin Lymphoma. JCO Oncol. Pract. 2021, 17, 72. [Google Scholar] [CrossRef] [PubMed]
- Yang, J.; Hu, G. Significance of PD-L1 in the diag. nosis and treatment of B-cell malignant lymphoma. Oncol. Lett. 2019, 17, 3382–3386. [Google Scholar] [PubMed]
- Zizzo, N.; Passantino, G.; D’Alessio, R.M.; Tinelli, A.; Lopresti, G.; Patruno, R.; Tricarico, D.; Maqoud, F.; Scala, R.; Zito, F.A.; et al. Thymidine Phosphorylase Expression and Microvascular Density. Correlation Analysis in Canine Mammary Tumor: Possible Prognostic Factor in Breast Cancer. Front. Vet. Sci. 2019, 6, 368. [Google Scholar] [CrossRef] [PubMed]
- de Moura Sperotto, N.D.; Deves Roth, C.; Rodrigues-Junior, V.S.; Ev Neves, C.; Reisdorfer Paula, F.; da Silva Dadda, A.; Bergo, P.; Freitas de Freitas, T.; Souza Macchi, F.; Moura, S.; et al. Design of Novel Inhibitors of Human Thymidine Phosphorylase: Synthesis, Enzyme Inhibition, In Vitro Toxicity, and Impact on Human Glioblastoma Cancer. J. Med. Chem. 2019, 62, 1231–1245. [Google Scholar] [CrossRef] [PubMed]
- Verma, K.; Zang, T.; Penning, T.M.; Trippier, P.C. Potent and Highly Selective Aldo-Keto Reductase 1C3 (AKR1C3) Inhibitors Act as Chemotherapeutic Potentiators in Acute Myeloid Leukemia and T-Cell Acute Lymphoblastic Leukemia. J. Med. Chem. 2019, 62, 3590–3616. [Google Scholar] [CrossRef] [PubMed]
- Hassin, O.; Oren, M. Drugging p53 in cancer: One protein, many targets. Nat. Rev. Drug Discov. 2023, 22, 127–144. [Google Scholar] [CrossRef] [PubMed]
- Wartewig, T.; Daniels, J.; Schulz, M.; Hameister, E.; Joshi, A.; Park, J.; Morrish, E.; Venkatasubramani, A.V.; Cernilogar, F.M.; van Heijster, F.H.A.; et al. PD-1 instructs a tumor-suppressive metabolic program that restricts glycolysis and restrains AP-1 activity in T cell lymphoma. Nat. Cancer 2023, 4, 1508–1525. [Google Scholar] [CrossRef]
- Liu, J.; Chen, Z.; Li, Y.; Zhao, W.; Wu, J.; Zhang, Z. PD-1/PD-L1 Checkpoint Inhibitors in Tumor Immunotherapy. Front. Pharmacol. 2021, 12, 7317. [Google Scholar] [CrossRef]


| n = 16 | |
|---|---|
| Age mean (range) | 69.3 (33–79) |
| Age > 60 years (%) | 12 (75%) |
| Male (%) | 9 (56%) |
| Histology | |
| PTCL (NOS) | 7 (44%) |
| AITL | 6 (38%) |
| ALCL | 3 (19%) |
| Stage | |
| Stage 1–2 | 6 (38%) |
| Stage 3–4 | 10 (63%) |
| IPI | |
| 1–2 Low risk | 7 (44%) |
| 3–4 High risk | 9 (56%) |
| PIT | |
| Group 1–2 Low risk | 4 (25%) |
| Group 3–4 High risk | 12 (75%) |
| CHOP outcomes | |
| CR | 8 (50%) |
| PD | 8 (50%) |
| PD + relapse within 1 year | 10 (63%) |
| Median OS (range) | 38M (2–114) |
| Category | Factors (# Significant Difference) | n | Median OS (Months) | p Value | Figure | Reference |
|---|---|---|---|---|---|---|
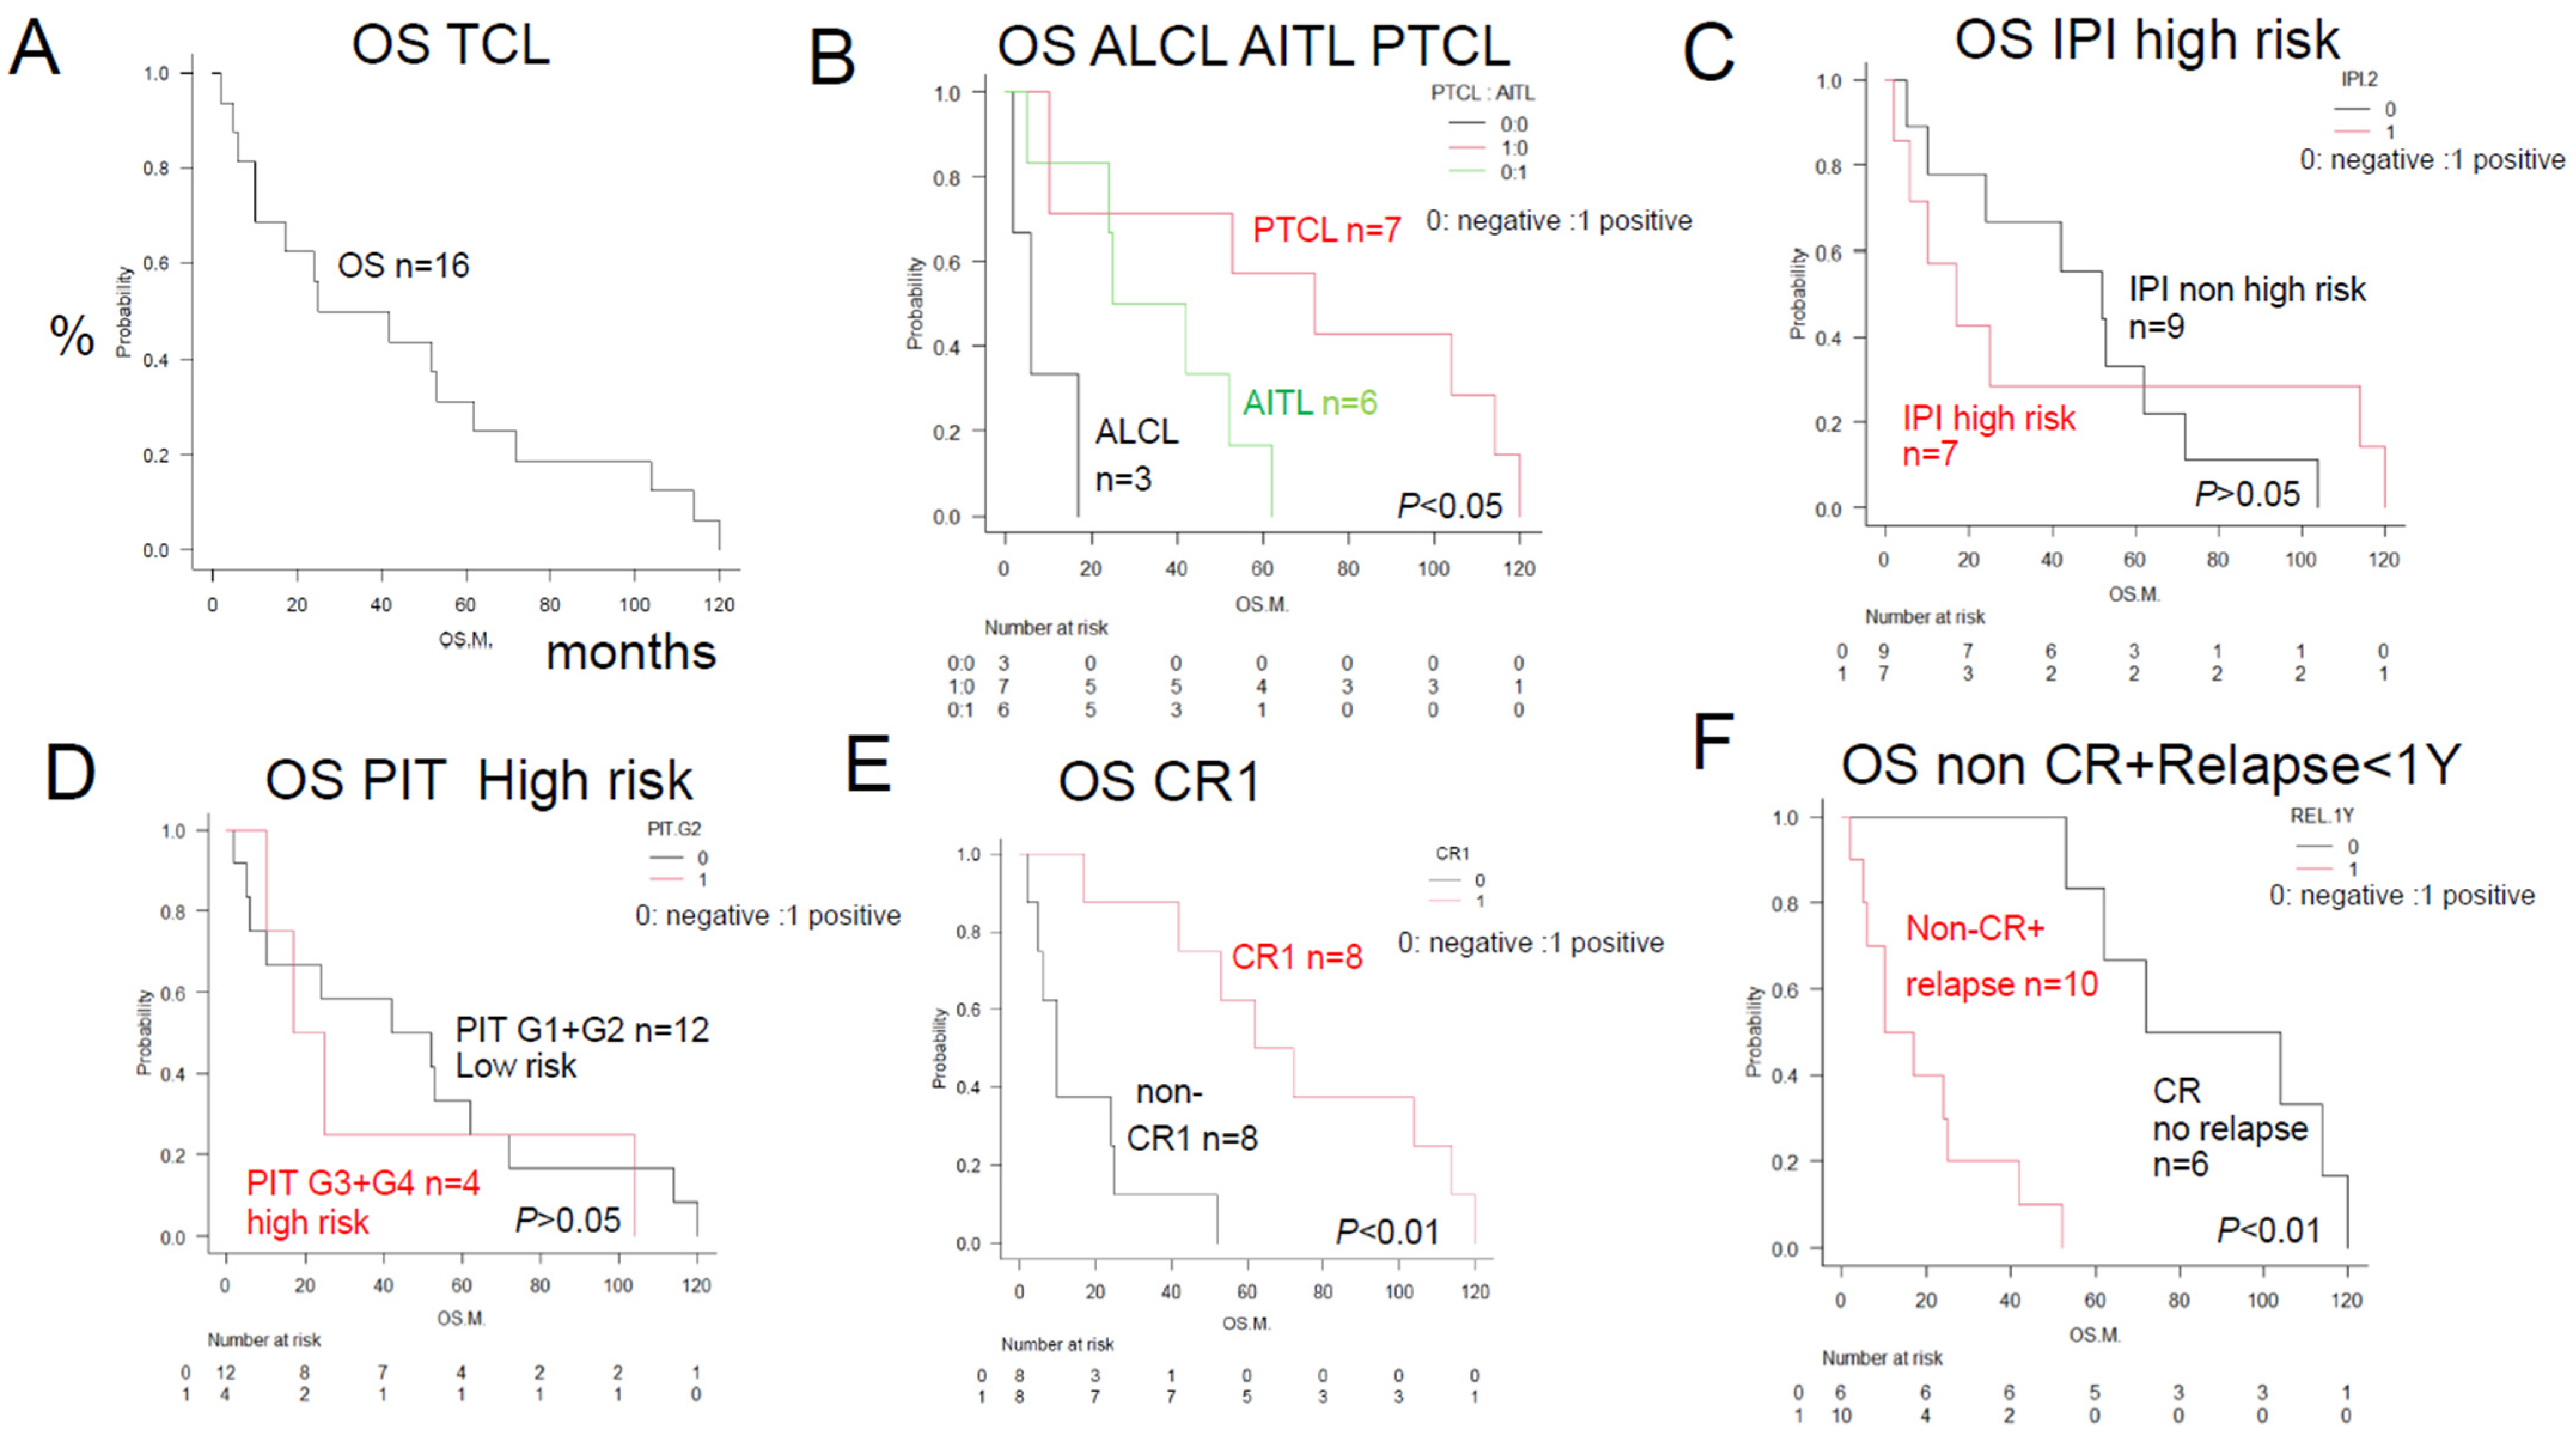
| Total | TCL | 16 | 34 | Figure 1A | ||
| Disease | PTCL (NOS) (#) | 7 | 72 | * p < 0.05 | Figure 1B | |
| AITL (#) | 6 | 34 | * p < 0.05 | Figure 1B | ||
| ALCL (#) | 3 | 6 | * p < 0.05 | Figure 1B | ||
| Prognostic factor | IPI High risk | 7 | 17 | p > 0.05 | Figure 1C | |
| PIT High risk | 4 | 21 | p > 0.05 | Figure 1D | ||
| Result | Non-CR1 (PD) (#) | 8 | 10 | ** p < 0.01 | Figure 1E | |
| PD or within 1Y relapse (#) | 10 | 14 | ** p < 0.01 | Figure 1F | ||
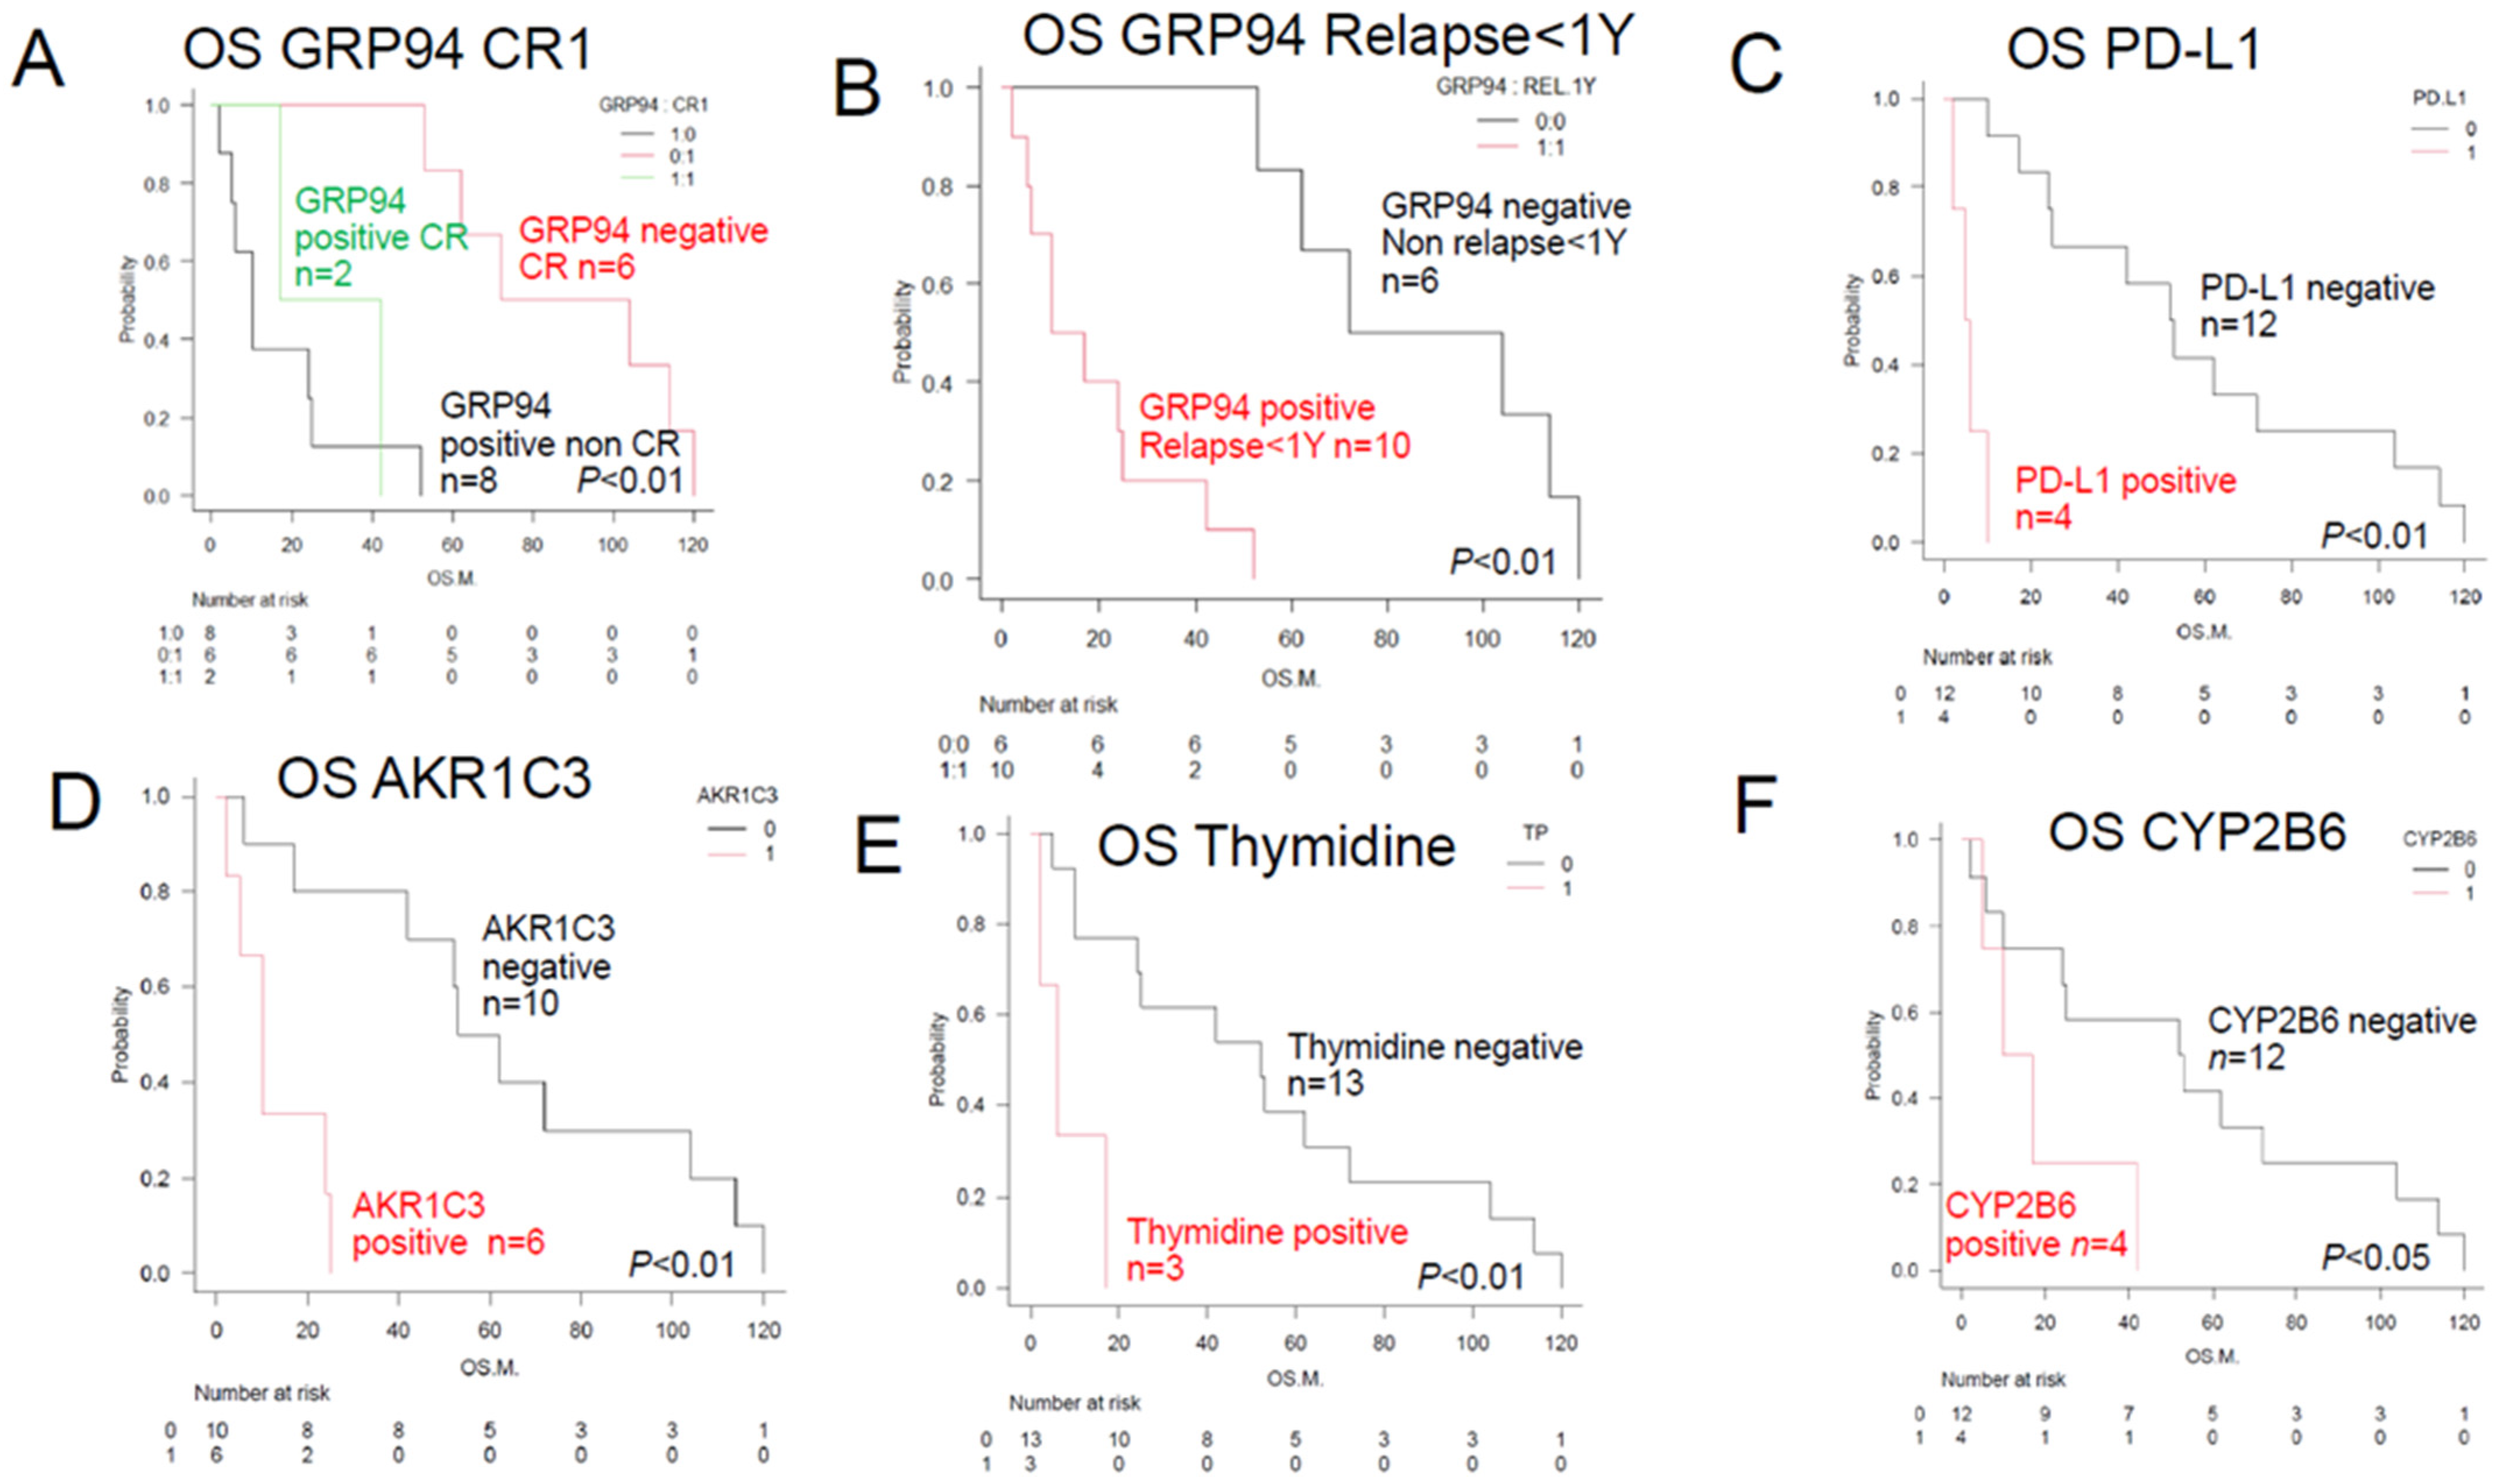
| ER stress proteins | GRP94 (#) | 10 | 14 | ** p < 0.01 | Figure 2B | [4,5,6] |
| TGFβ1 | 7 | 25 | p > 0.05 | [9,10] | ||
| GRP78 | 10 | 14 | p > 0.05 | [7,8] | ||
| TNFα1 | 4 | 16 | p > 0.05 | [11] | ||
| OH metabolic enzyme | AKR1C3 (#) | 6 | 10 | ** p < 0.01 | Figure 2D | [12,13,14,15,28] |
| AKR1B1 | 4 | 21 | p > 0.05 | |||
| AKR1B10 | 10 | 21 | p > 0.05 | |||
| C metabolic enzyme | CYP2B6 (#) | 4 | 14 | * p < 0.05 | Figure 2F | [18] |
| CHOP metabolic enzyme | CYP3A4 | 0 | [16,17] | |||
| OH efflux pump | MDR1 | 1 | 24 | p > 0.05 | [19,20,21] | |
| MRP1 | 0 | [22,23] | ||||
| MTX efflux pump | MRP4 | 0 | [24] | |||
| Immune check point molecules | PD-1 | 5 | 52 | p > 0.06 | ||
| PD-L1 (#) | 4 | 6 | ** p < 0.01 | Figure 2C | ||
| PD-L2 | 1 | 53 | p > 0.05 | |||
| Others | TP (#) | 3 | 6 | ** p < 0.01 | Figure 2E | [27] |
| p53 | 2 | 12 | p > 0.05 | |||
| GST | 13 | 25 | p > 0.05 | [26] | ||
| MYC | 3 | 6 | p > 0.05 | |||
| ENT-1 | 16 | 34 | p > 0.05 | |||
| Fibrosis (silver stain positive) | 14 | 39 | p > 0.05 | [28] | ||
| Significant combination | ||||||
| Non-CR1 plus GRP94+ (#) | 8 | 10 | ** p < 0.01 | Figure 2A | ||
| PD relapse < 1 year plus GRP94 (#) | 10 | 10 | ** p < 0.01 | Figure 2B | ||
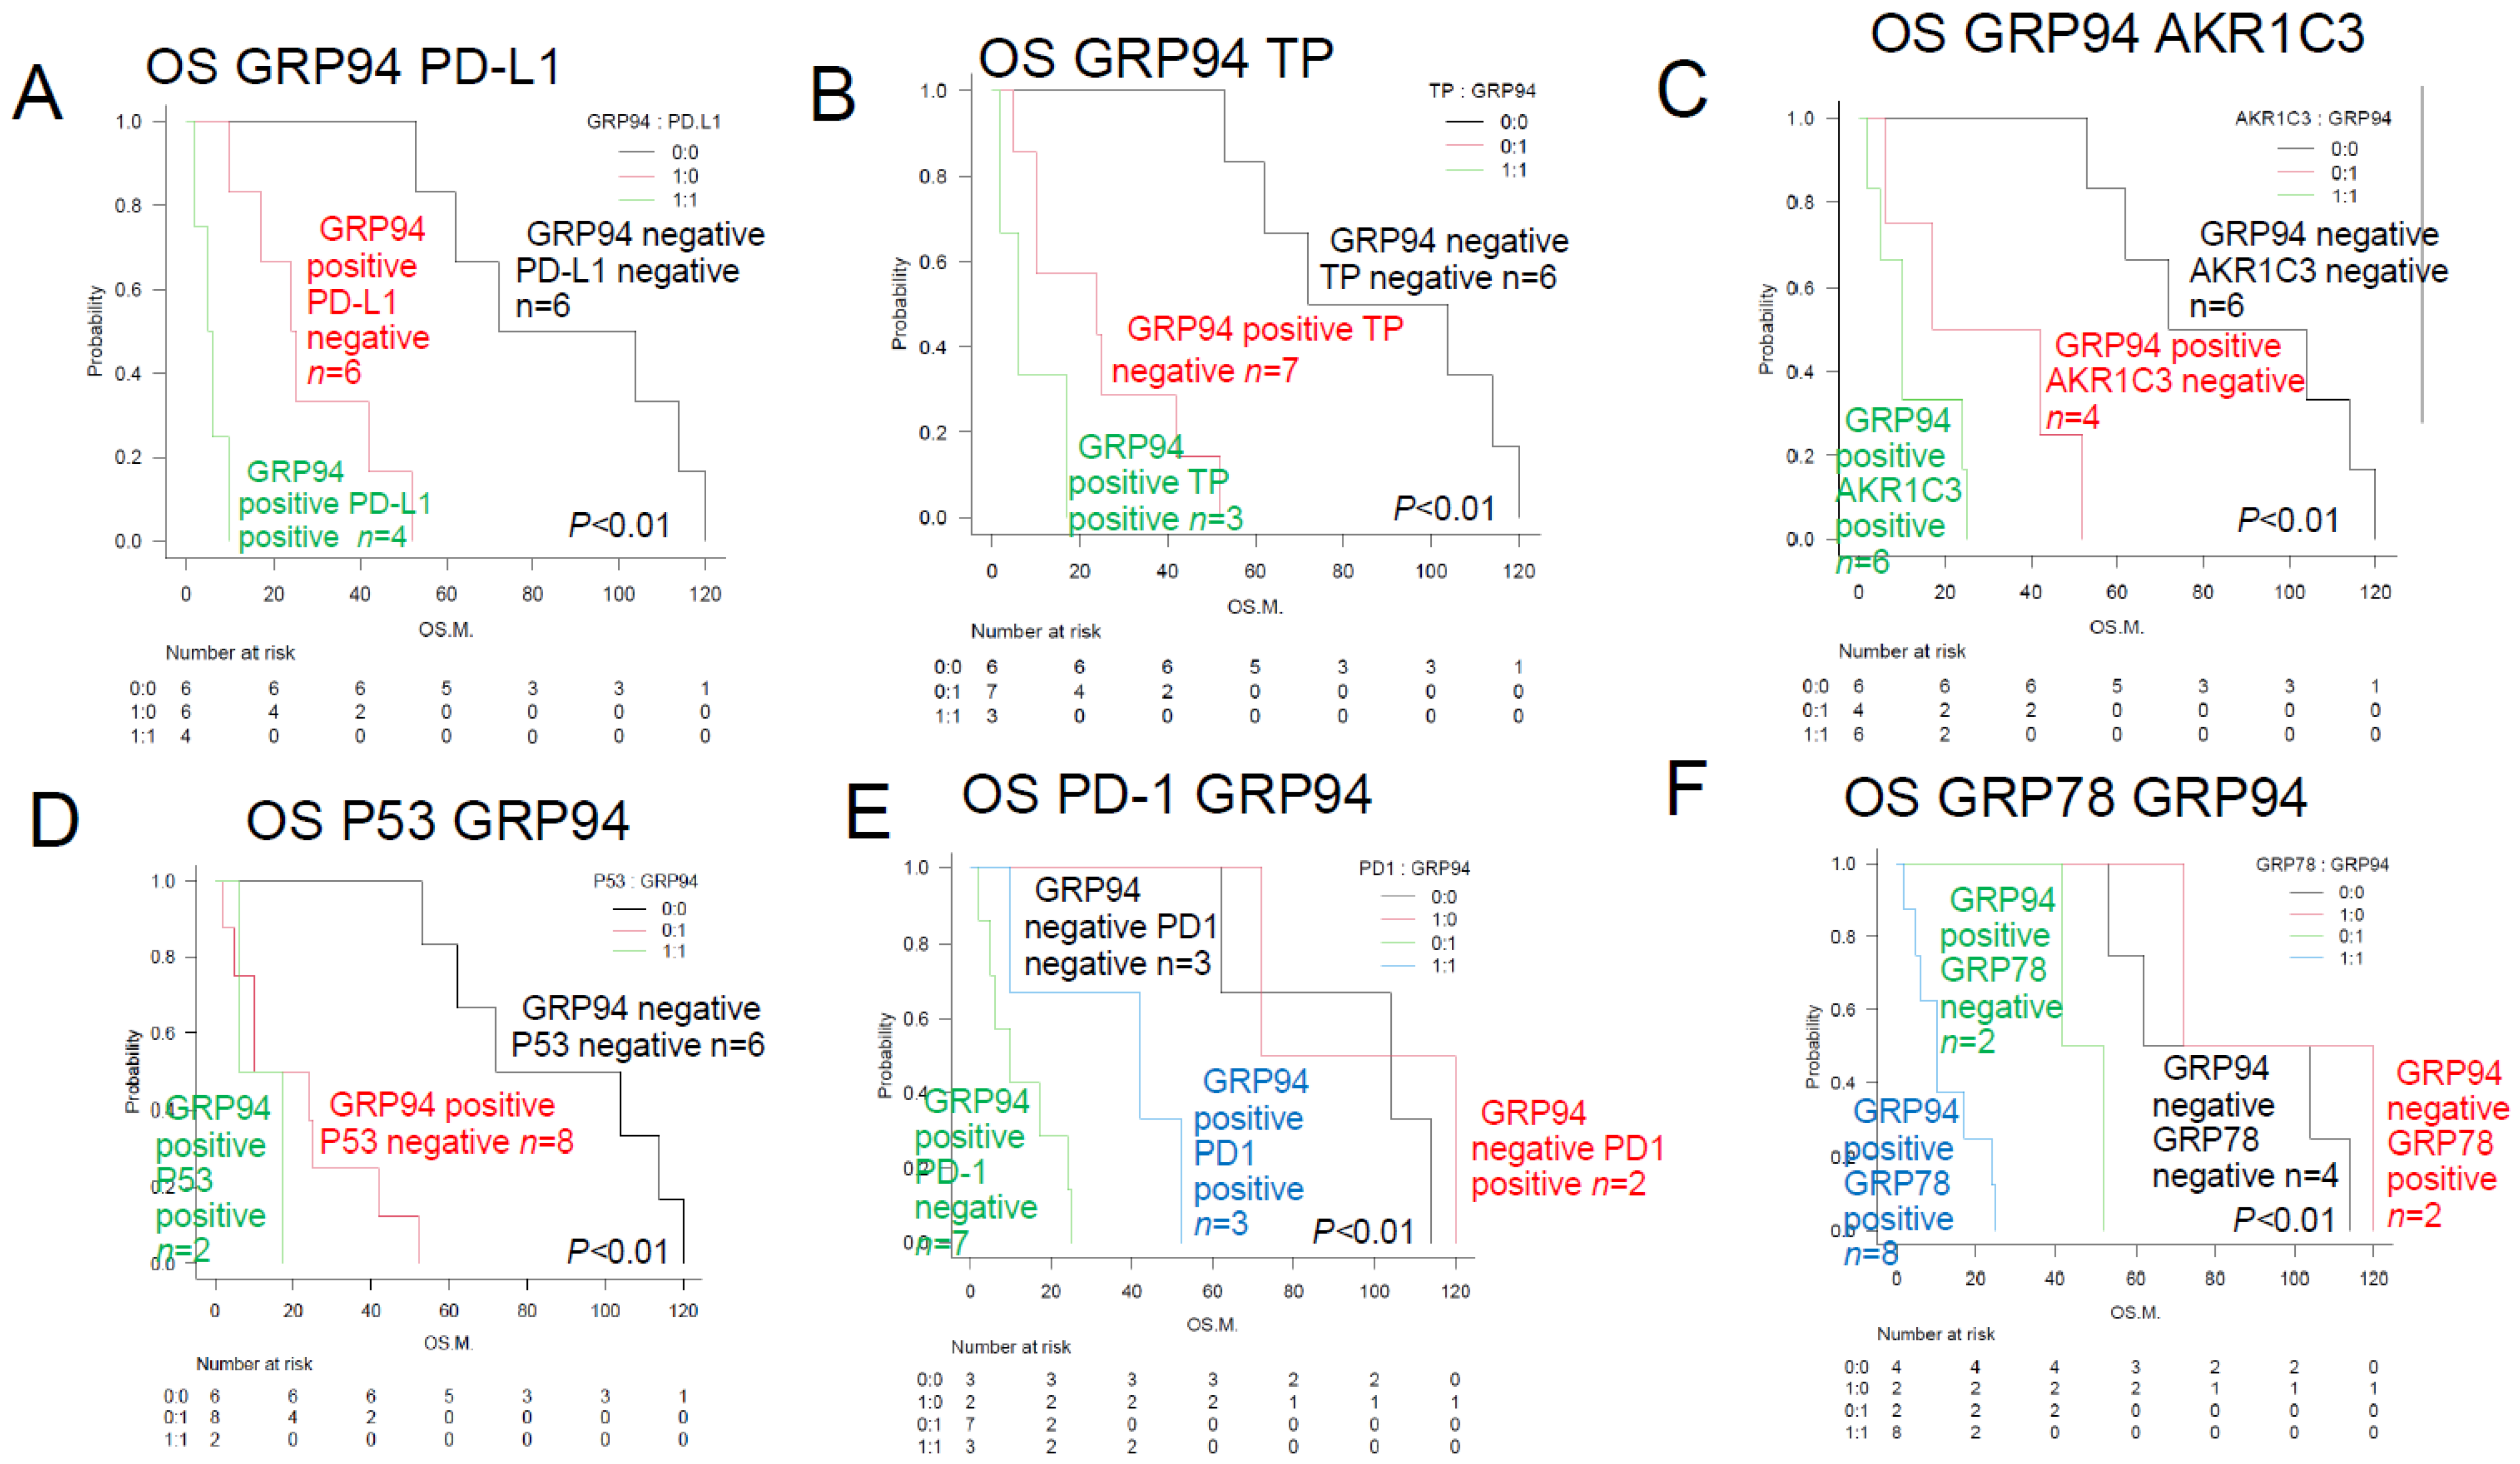
| GRP94+ plus PD-L1+ (#) | 4 | 4 | ** p < 0.01 | Figure 3A | ||
| GRP94+ plus TP+ (#) | 3 | 5 | ** p < 0.01 | Figure 3B | [22,23,25] | |
| GRP94+ plus AKR1C3+ (#) | 6 | 10 | ** p < 0.01 | Figure 3C | ||
| GRP94+ plus P53+ (#) | 2 | 4 | ** p < 0.01 | Figure 3D | ||
| GRP94+ plus PD-L1+ (#) | 7 | 10 | ** p < 0.01 | Figure 3E | ||
| GRP94+ plus GRP78+ (#) | 8 | 11 | ** p < 0.01 | Figure 3F | ||
| PD relapse < 1 year plus AKR1C3+ (#) | 6 | 10 | ** p < 0.01 | |||
| PD relapse < 1 year plus PD-L1+ (#) | 4 | 5 | ** p < 0.01 | |||
| IPI High risk, GRP94+ (#) | 5 | 10 | ** p < 0.01 | |||
| PIT High risk, PD-L1+ (#) | 4 | 8 | ** p < 0.01 | |||
| TCL Urayasu G1 (#) | 6 | 88 | ** p < 0.01 | Figure 4A | ||
| TCL Urayasu G2 | 5 | 25 | p > 0.05 | Figure 4B | ||
| TCL Urayasu G3 (#) | 5 | 10 | ** p < 0.01 | Figure 4C | ||
| TCL Urayasu G3 PTCL (NOS) | 2 | 10 | * p < 0.05 | Figure 4D | ||
| TCL Urayasu G3 AITL | 0 | ** p < 0.01 | Figure 4E | |||
| TCL Urayasu G3 ALCL | 3 | 6 | p < 0.05 | Figure 4F |
Disclaimer/Publisher’s Note: The statements, opinions and data contained in all publications are solely those of the individual author(s) and contributor(s) and not of MDPI and/or the editor(s). MDPI and/or the editor(s) disclaim responsibility for any injury to people or property resulting from any ideas, methods, instructions or products referred to in the content. |
© 2024 by the authors. Licensee MDPI, Basel, Switzerland. This article is an open access article distributed under the terms and conditions of the Creative Commons Attribution (CC BY) license (https://creativecommons.org/licenses/by/4.0/).
Share and Cite
Nitta, H.; Takizawa, H.; Mitsumori, T.; Iizuka-Honma, H.; Ochiai, T.; Furuya, C.; Araki, Y.; Fujishiro, M.; Tomita, S.; Hashizume, A.; et al. A New Histology-Based Prognostic Index for Aggressive T-Cell lymphoma: Preliminary Results of the “TCL Urayasu Classification”. J. Clin. Med. 2024, 13, 3870. https://doi.org/10.3390/jcm13133870
Nitta H, Takizawa H, Mitsumori T, Iizuka-Honma H, Ochiai T, Furuya C, Araki Y, Fujishiro M, Tomita S, Hashizume A, et al. A New Histology-Based Prognostic Index for Aggressive T-Cell lymphoma: Preliminary Results of the “TCL Urayasu Classification”. Journal of Clinical Medicine. 2024; 13(13):3870. https://doi.org/10.3390/jcm13133870
Chicago/Turabian StyleNitta, Hideaki, Haruko Takizawa, Toru Mitsumori, Hiroko Iizuka-Honma, Tomonori Ochiai, Chiho Furuya, Yoshihiko Araki, Maki Fujishiro, Shigeki Tomita, Akane Hashizume, and et al. 2024. "A New Histology-Based Prognostic Index for Aggressive T-Cell lymphoma: Preliminary Results of the “TCL Urayasu Classification”" Journal of Clinical Medicine 13, no. 13: 3870. https://doi.org/10.3390/jcm13133870
APA StyleNitta, H., Takizawa, H., Mitsumori, T., Iizuka-Honma, H., Ochiai, T., Furuya, C., Araki, Y., Fujishiro, M., Tomita, S., Hashizume, A., Sawada, T., Miyake, K., Okubo, M., Sekiguchi, Y., Ando, M., & Noguchi, M. (2024). A New Histology-Based Prognostic Index for Aggressive T-Cell lymphoma: Preliminary Results of the “TCL Urayasu Classification”. Journal of Clinical Medicine, 13(13), 3870. https://doi.org/10.3390/jcm13133870