
Longitudinal Internal Validity of the Quality of Life after Brain Injury: Response Shift and Responsiveness

 ,
,  , , ,
, , , 
Abstract
1. Introduction
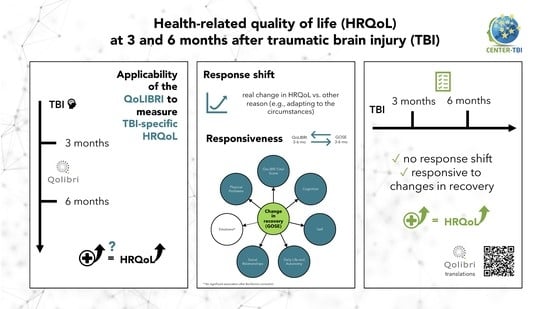
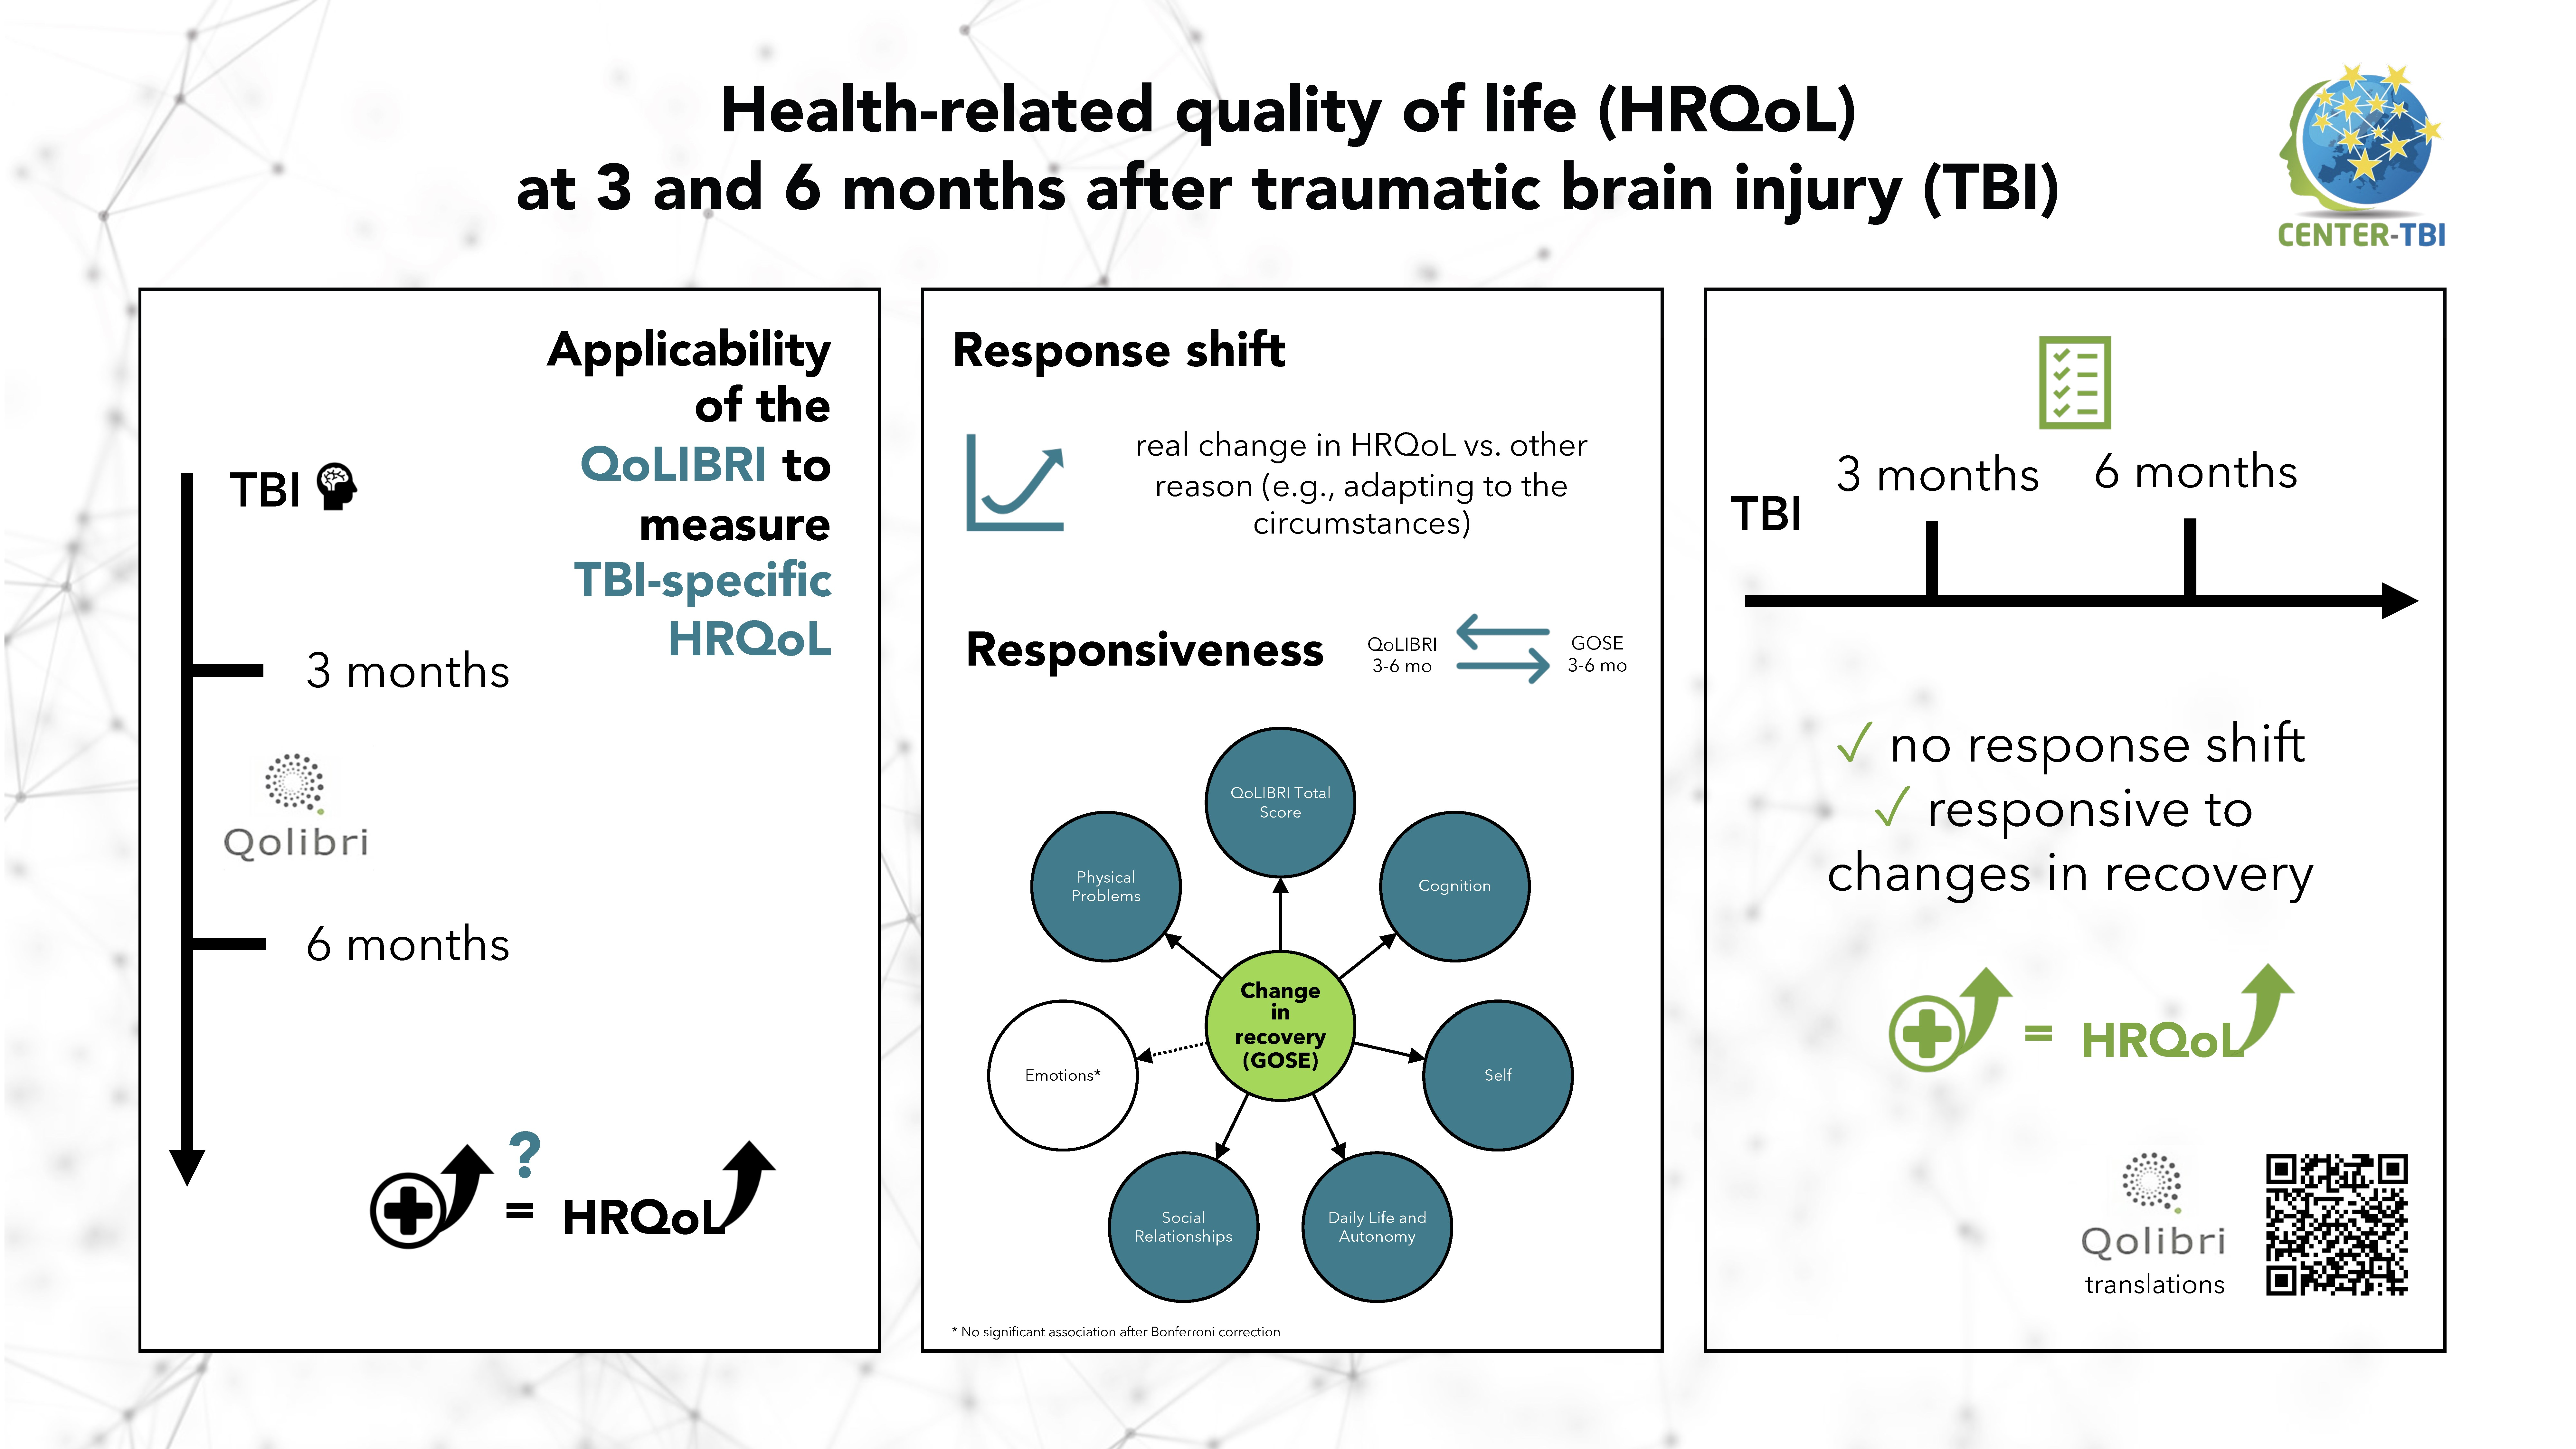
- Evaluation of response shift from three to six months after TBI using the longitudinal measurement invariance testing approach;
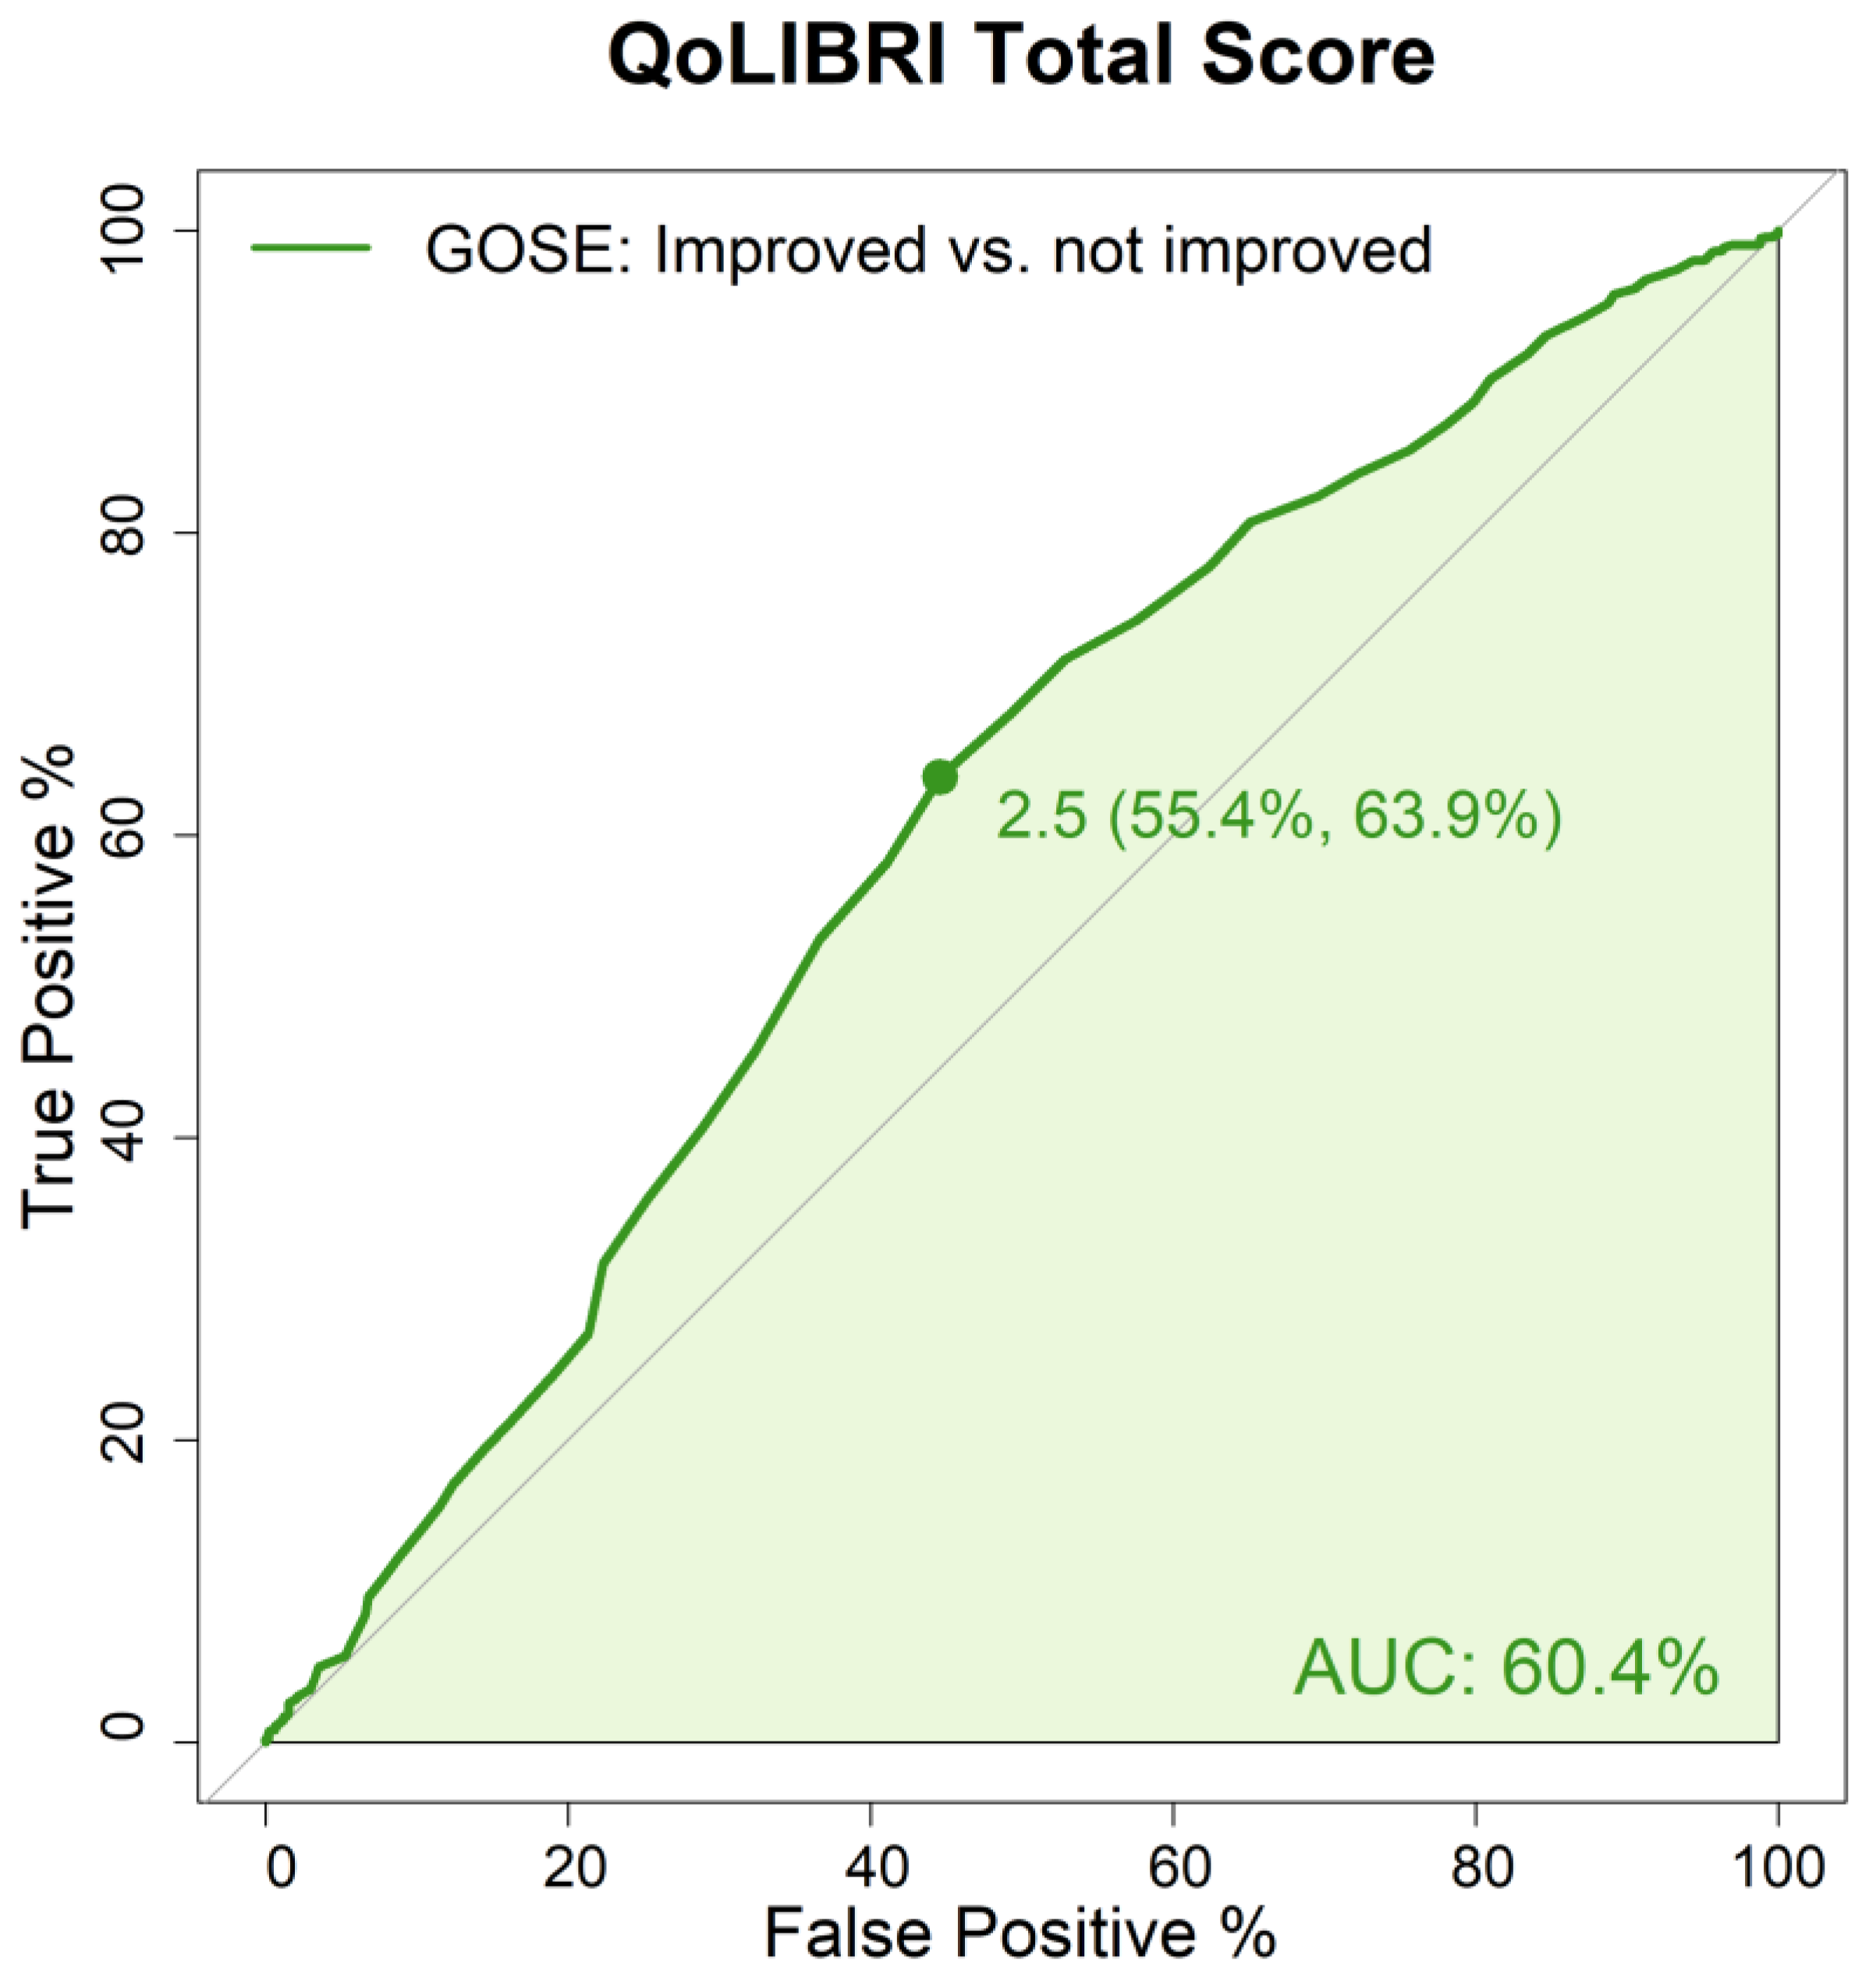
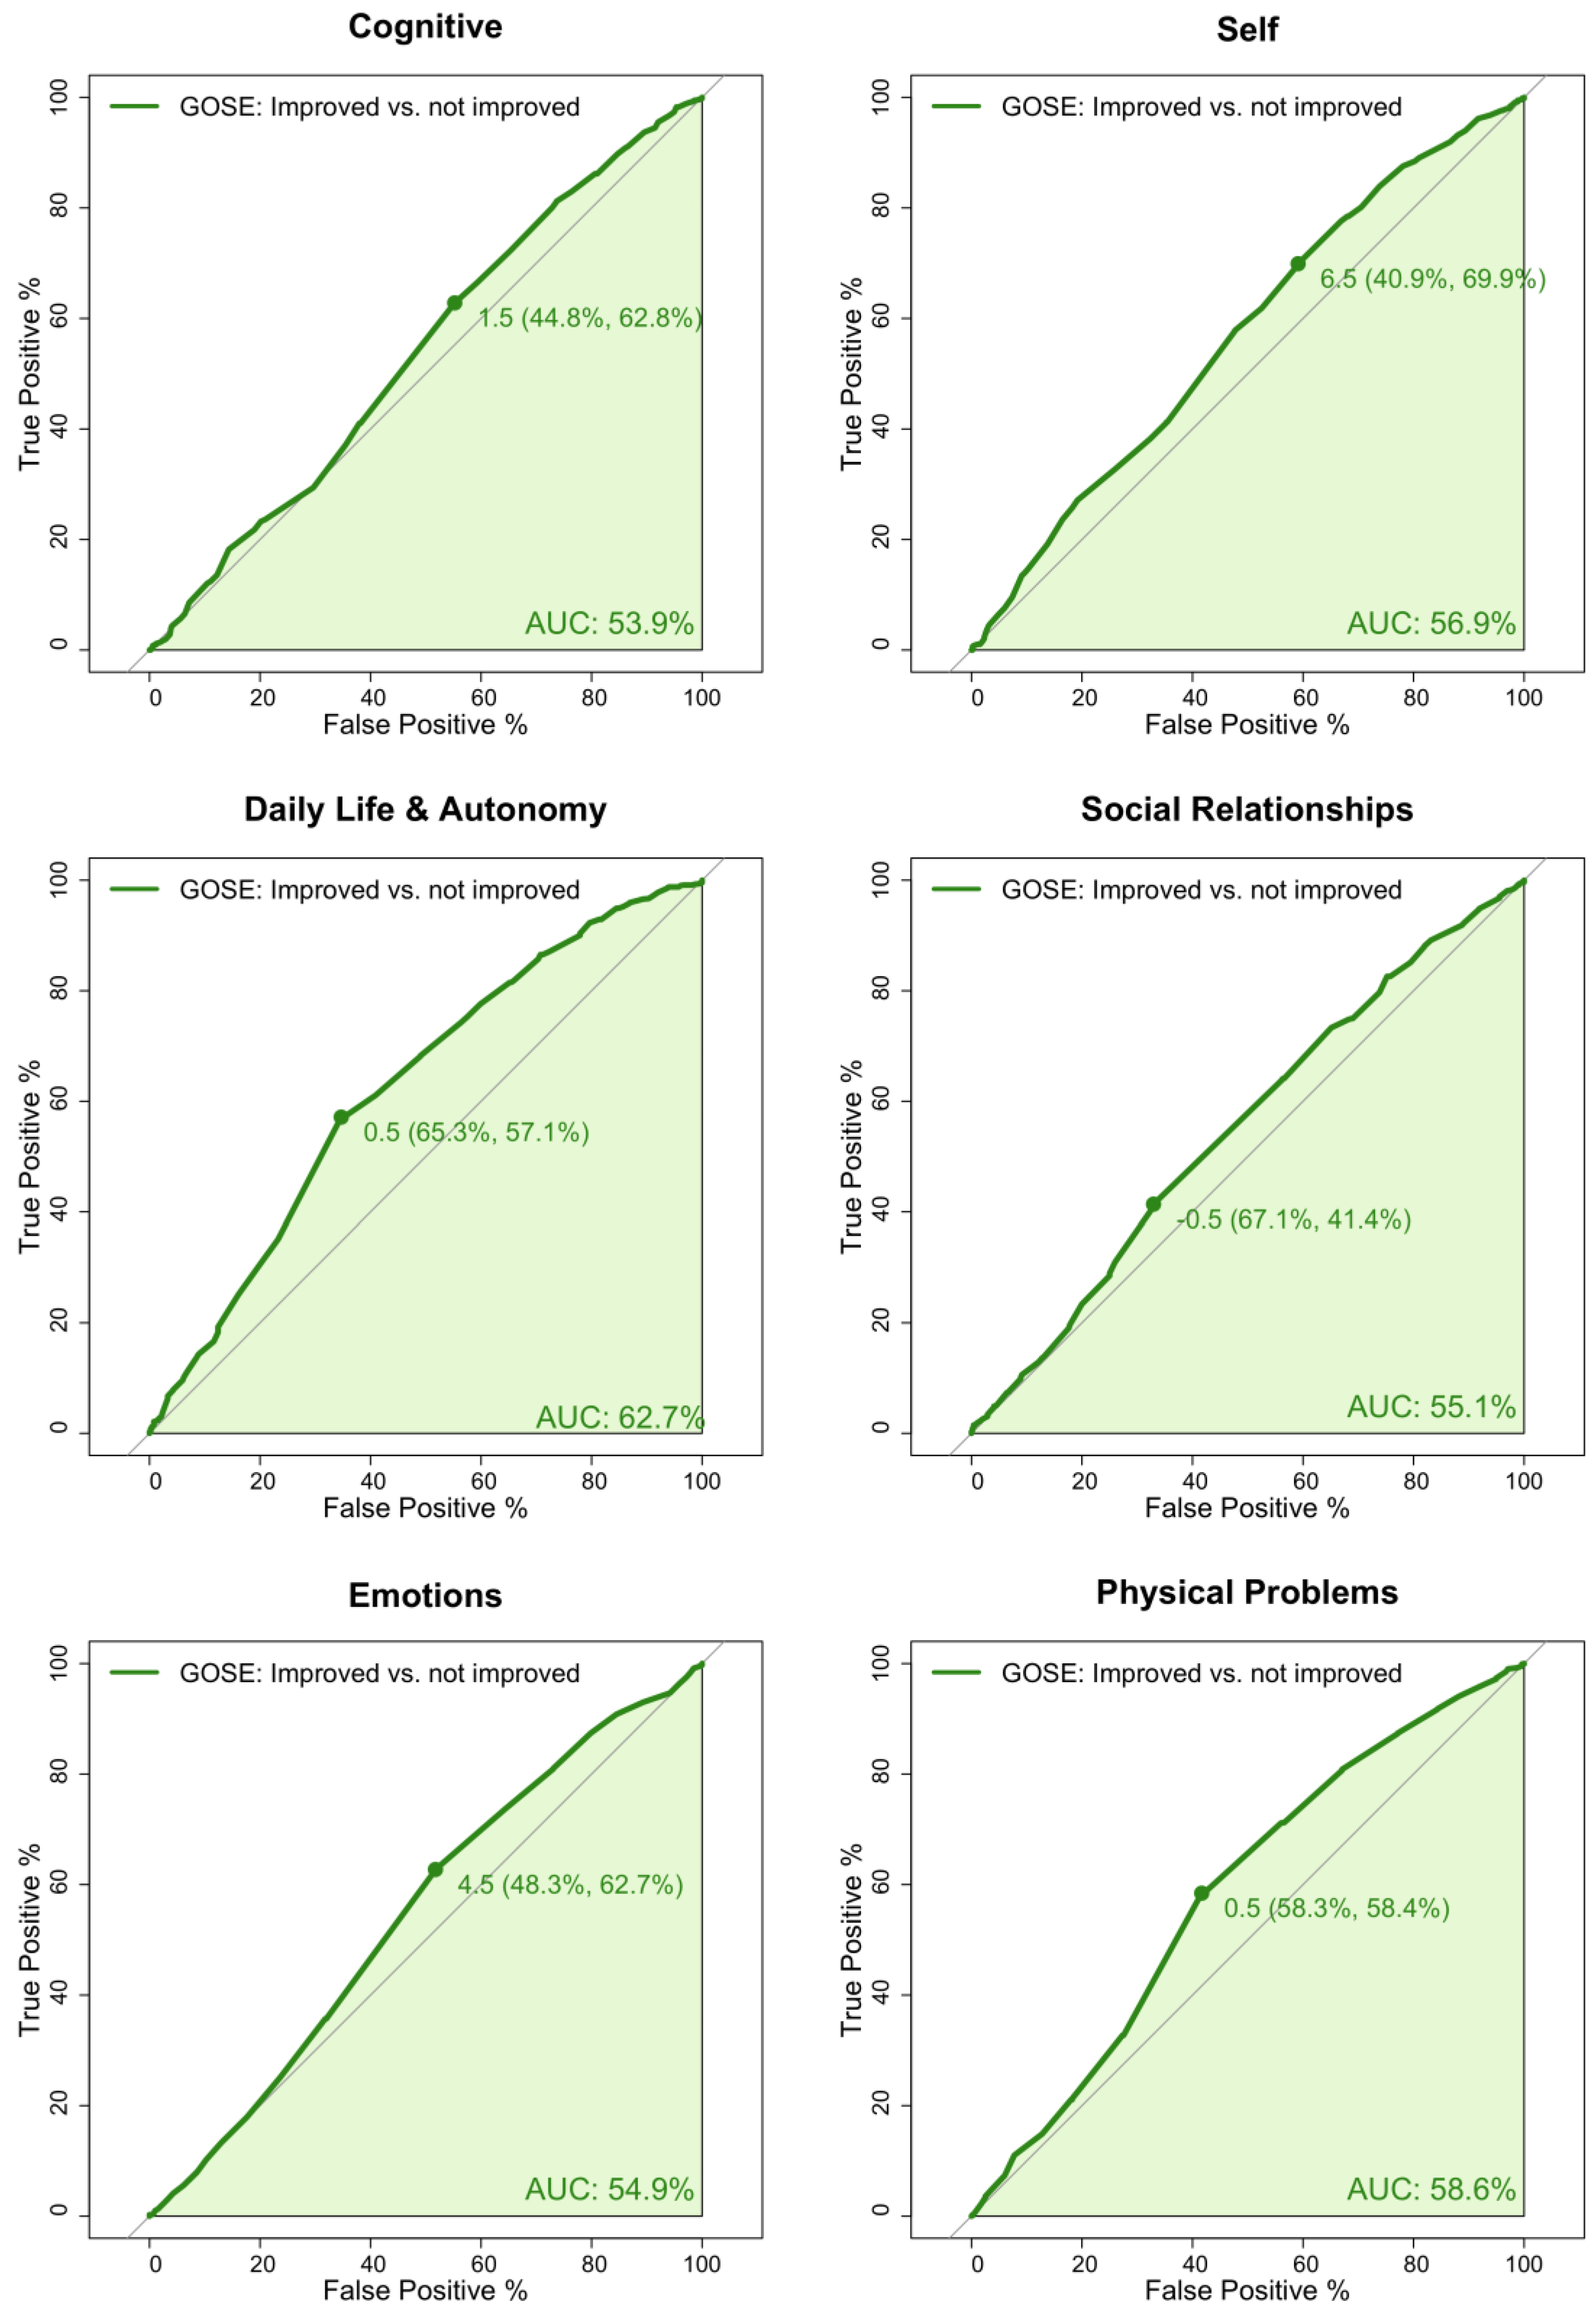
- Assessment of responsiveness as the ability of the QoLIBRI to detect changes in the patient’s functional recovery status, as measured by the Glasgow Outcome Scale–Extended (GOSE) [46], 3 to 6 months after injury.
2. Materials and Methods
2.1. Measures
2.1.1. Sociodemographic Data
2.1.2. Injury-Related Data
2.2. Statistical Analyses
2.2.1. Sample Characteristics
2.2.2. Confirmatory Factor Analysis
2.2.3. Response Shift
2.2.4. Responsiveness
3. Results
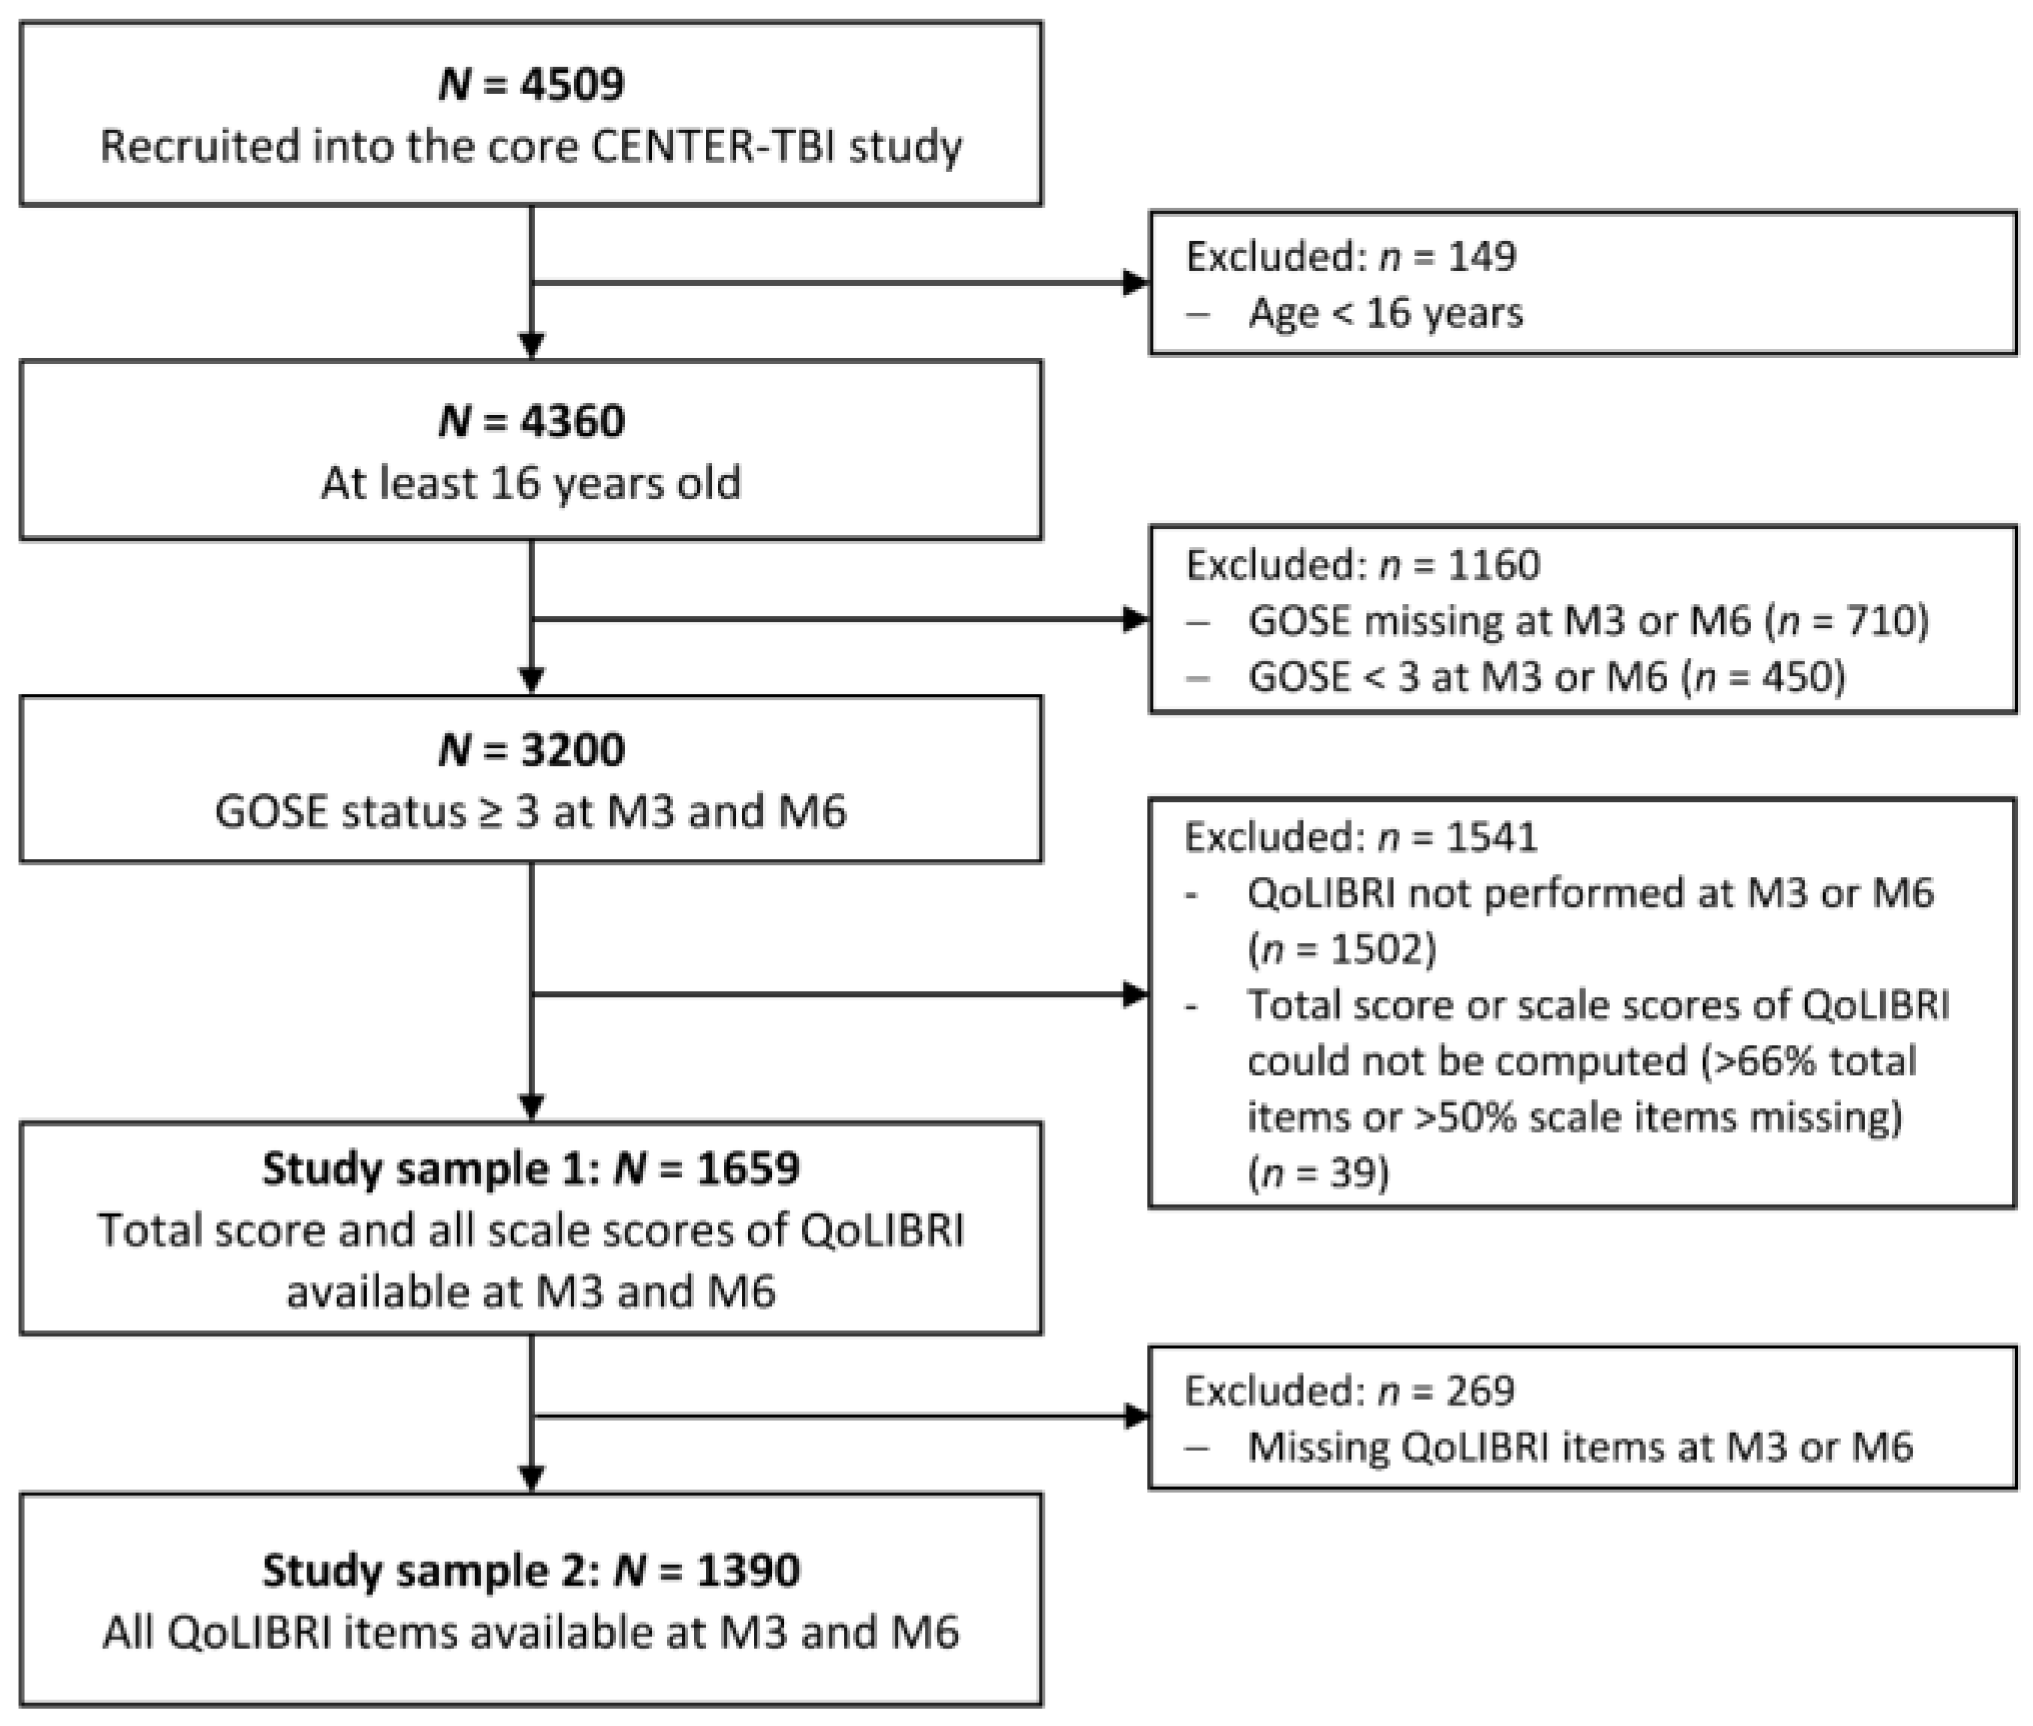
3.1. Study Participants
3.2. Confirmatory Factor Analysis
3.3. Response Shift
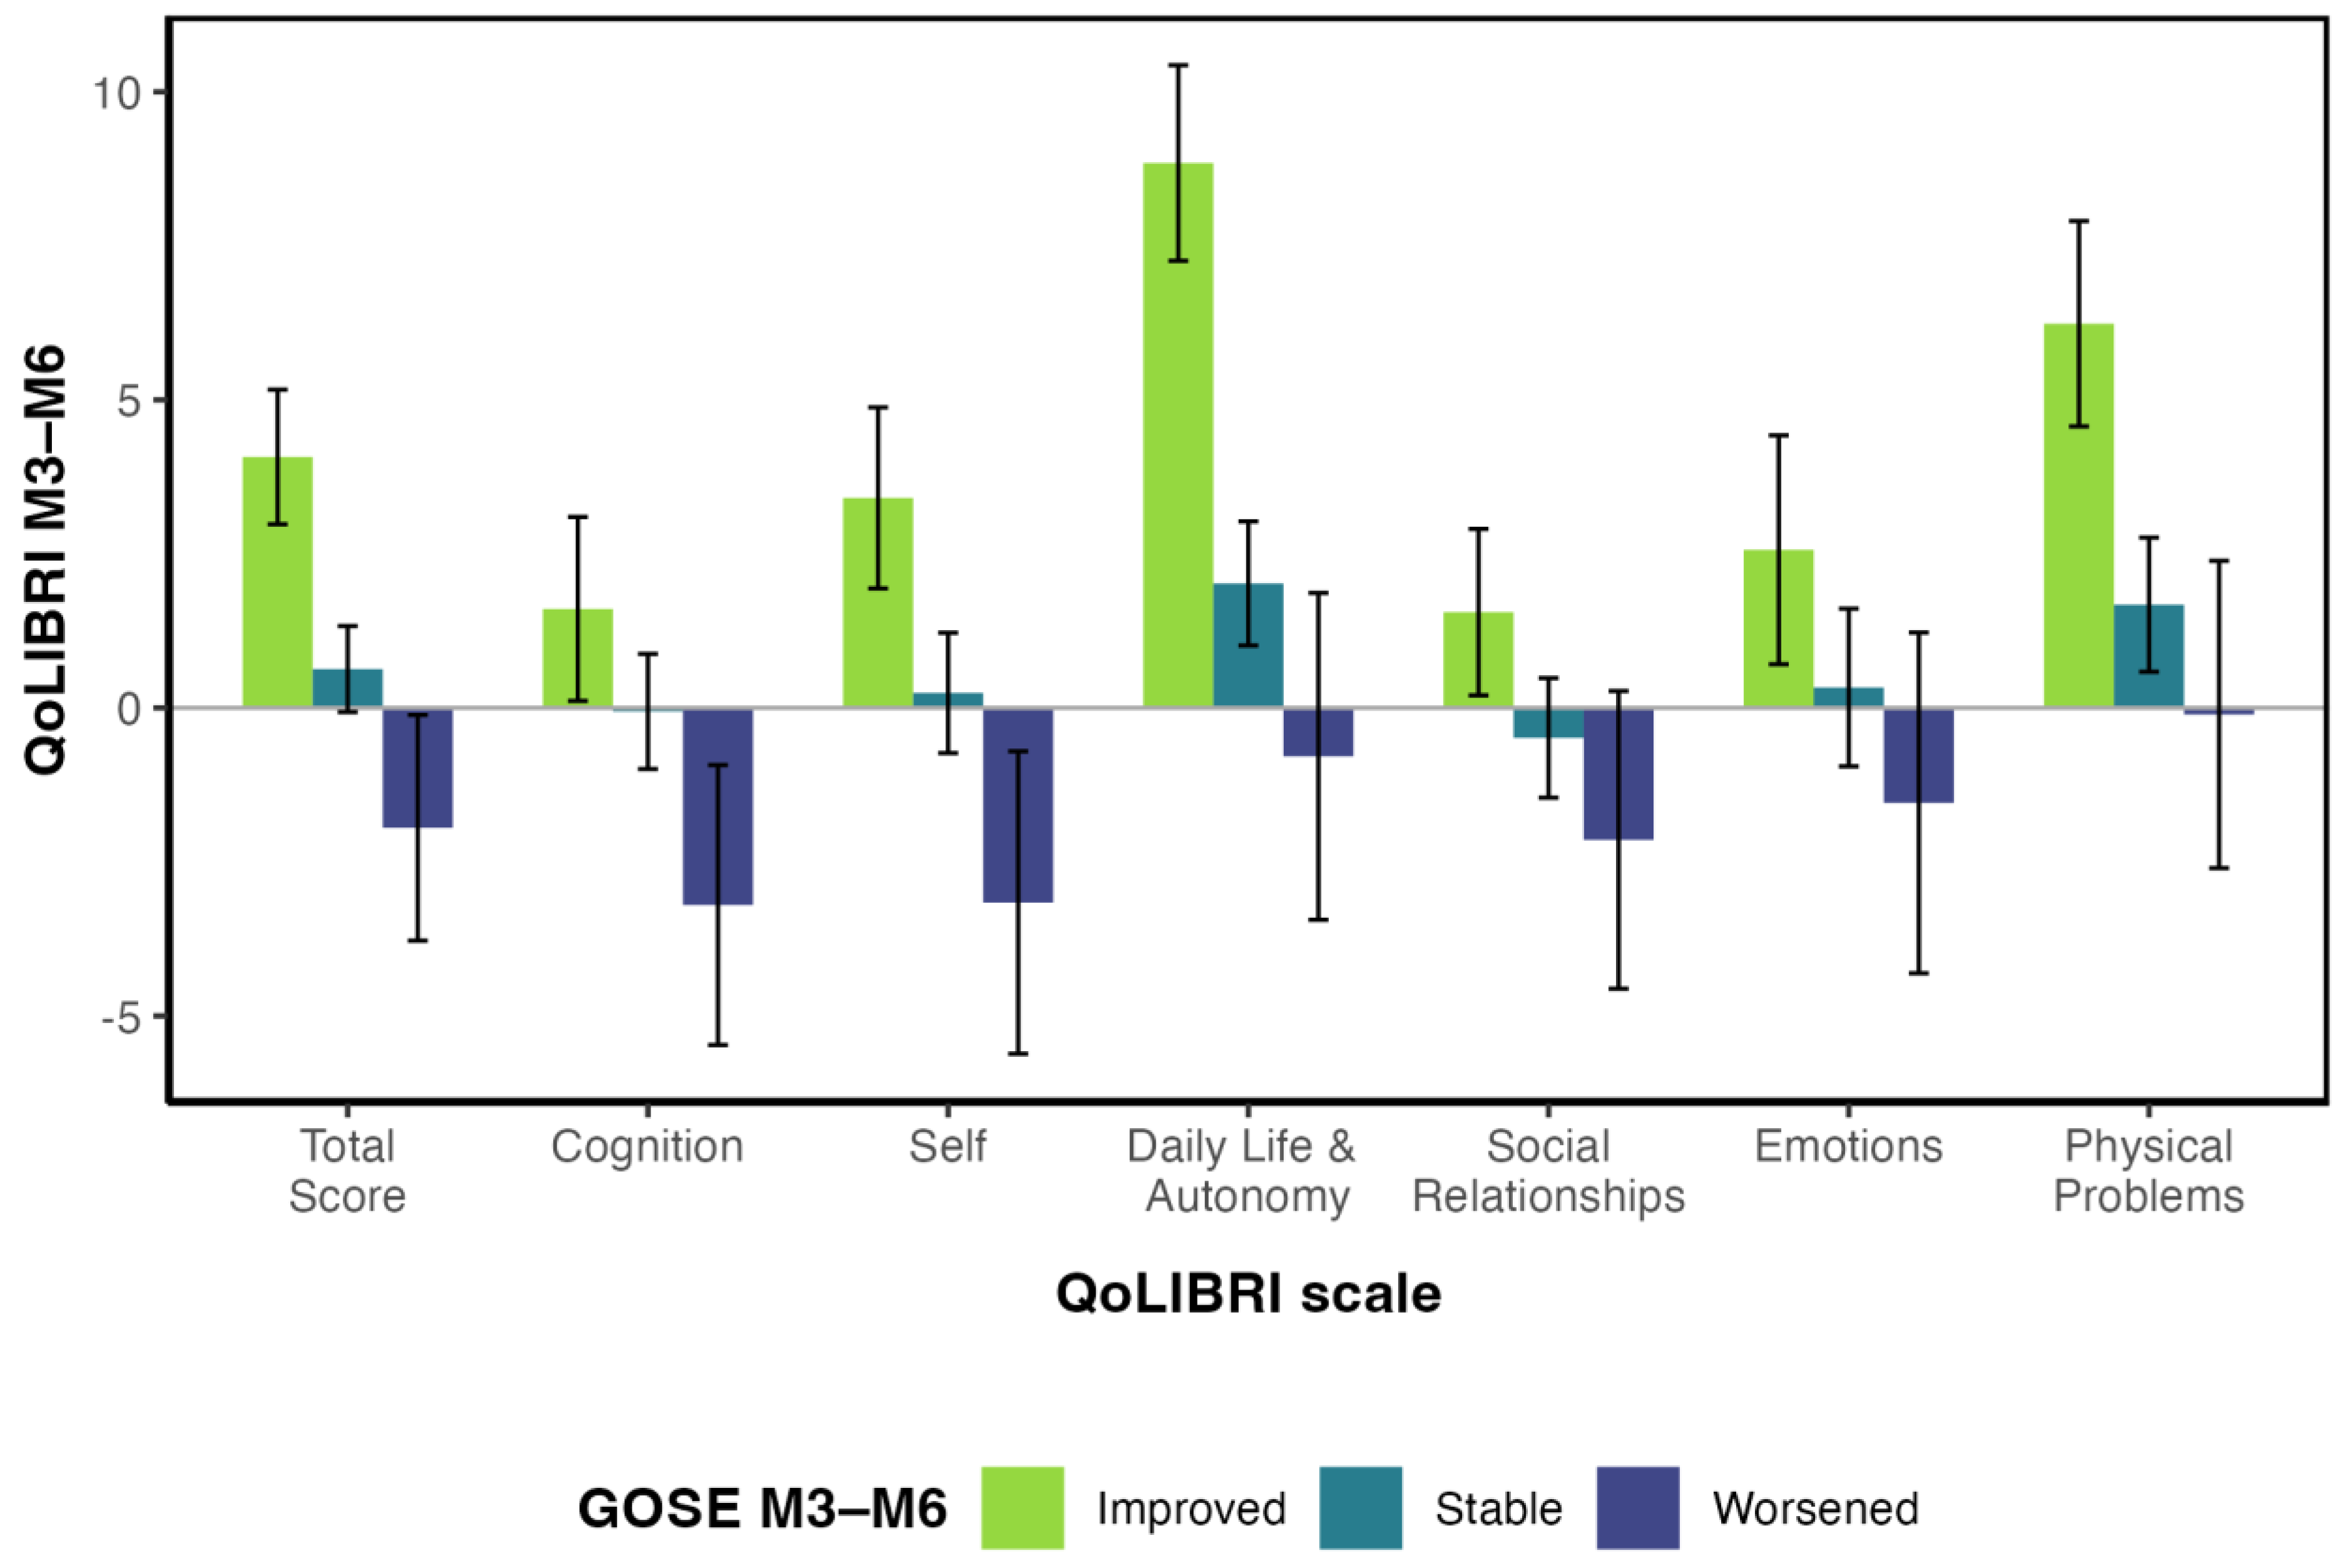
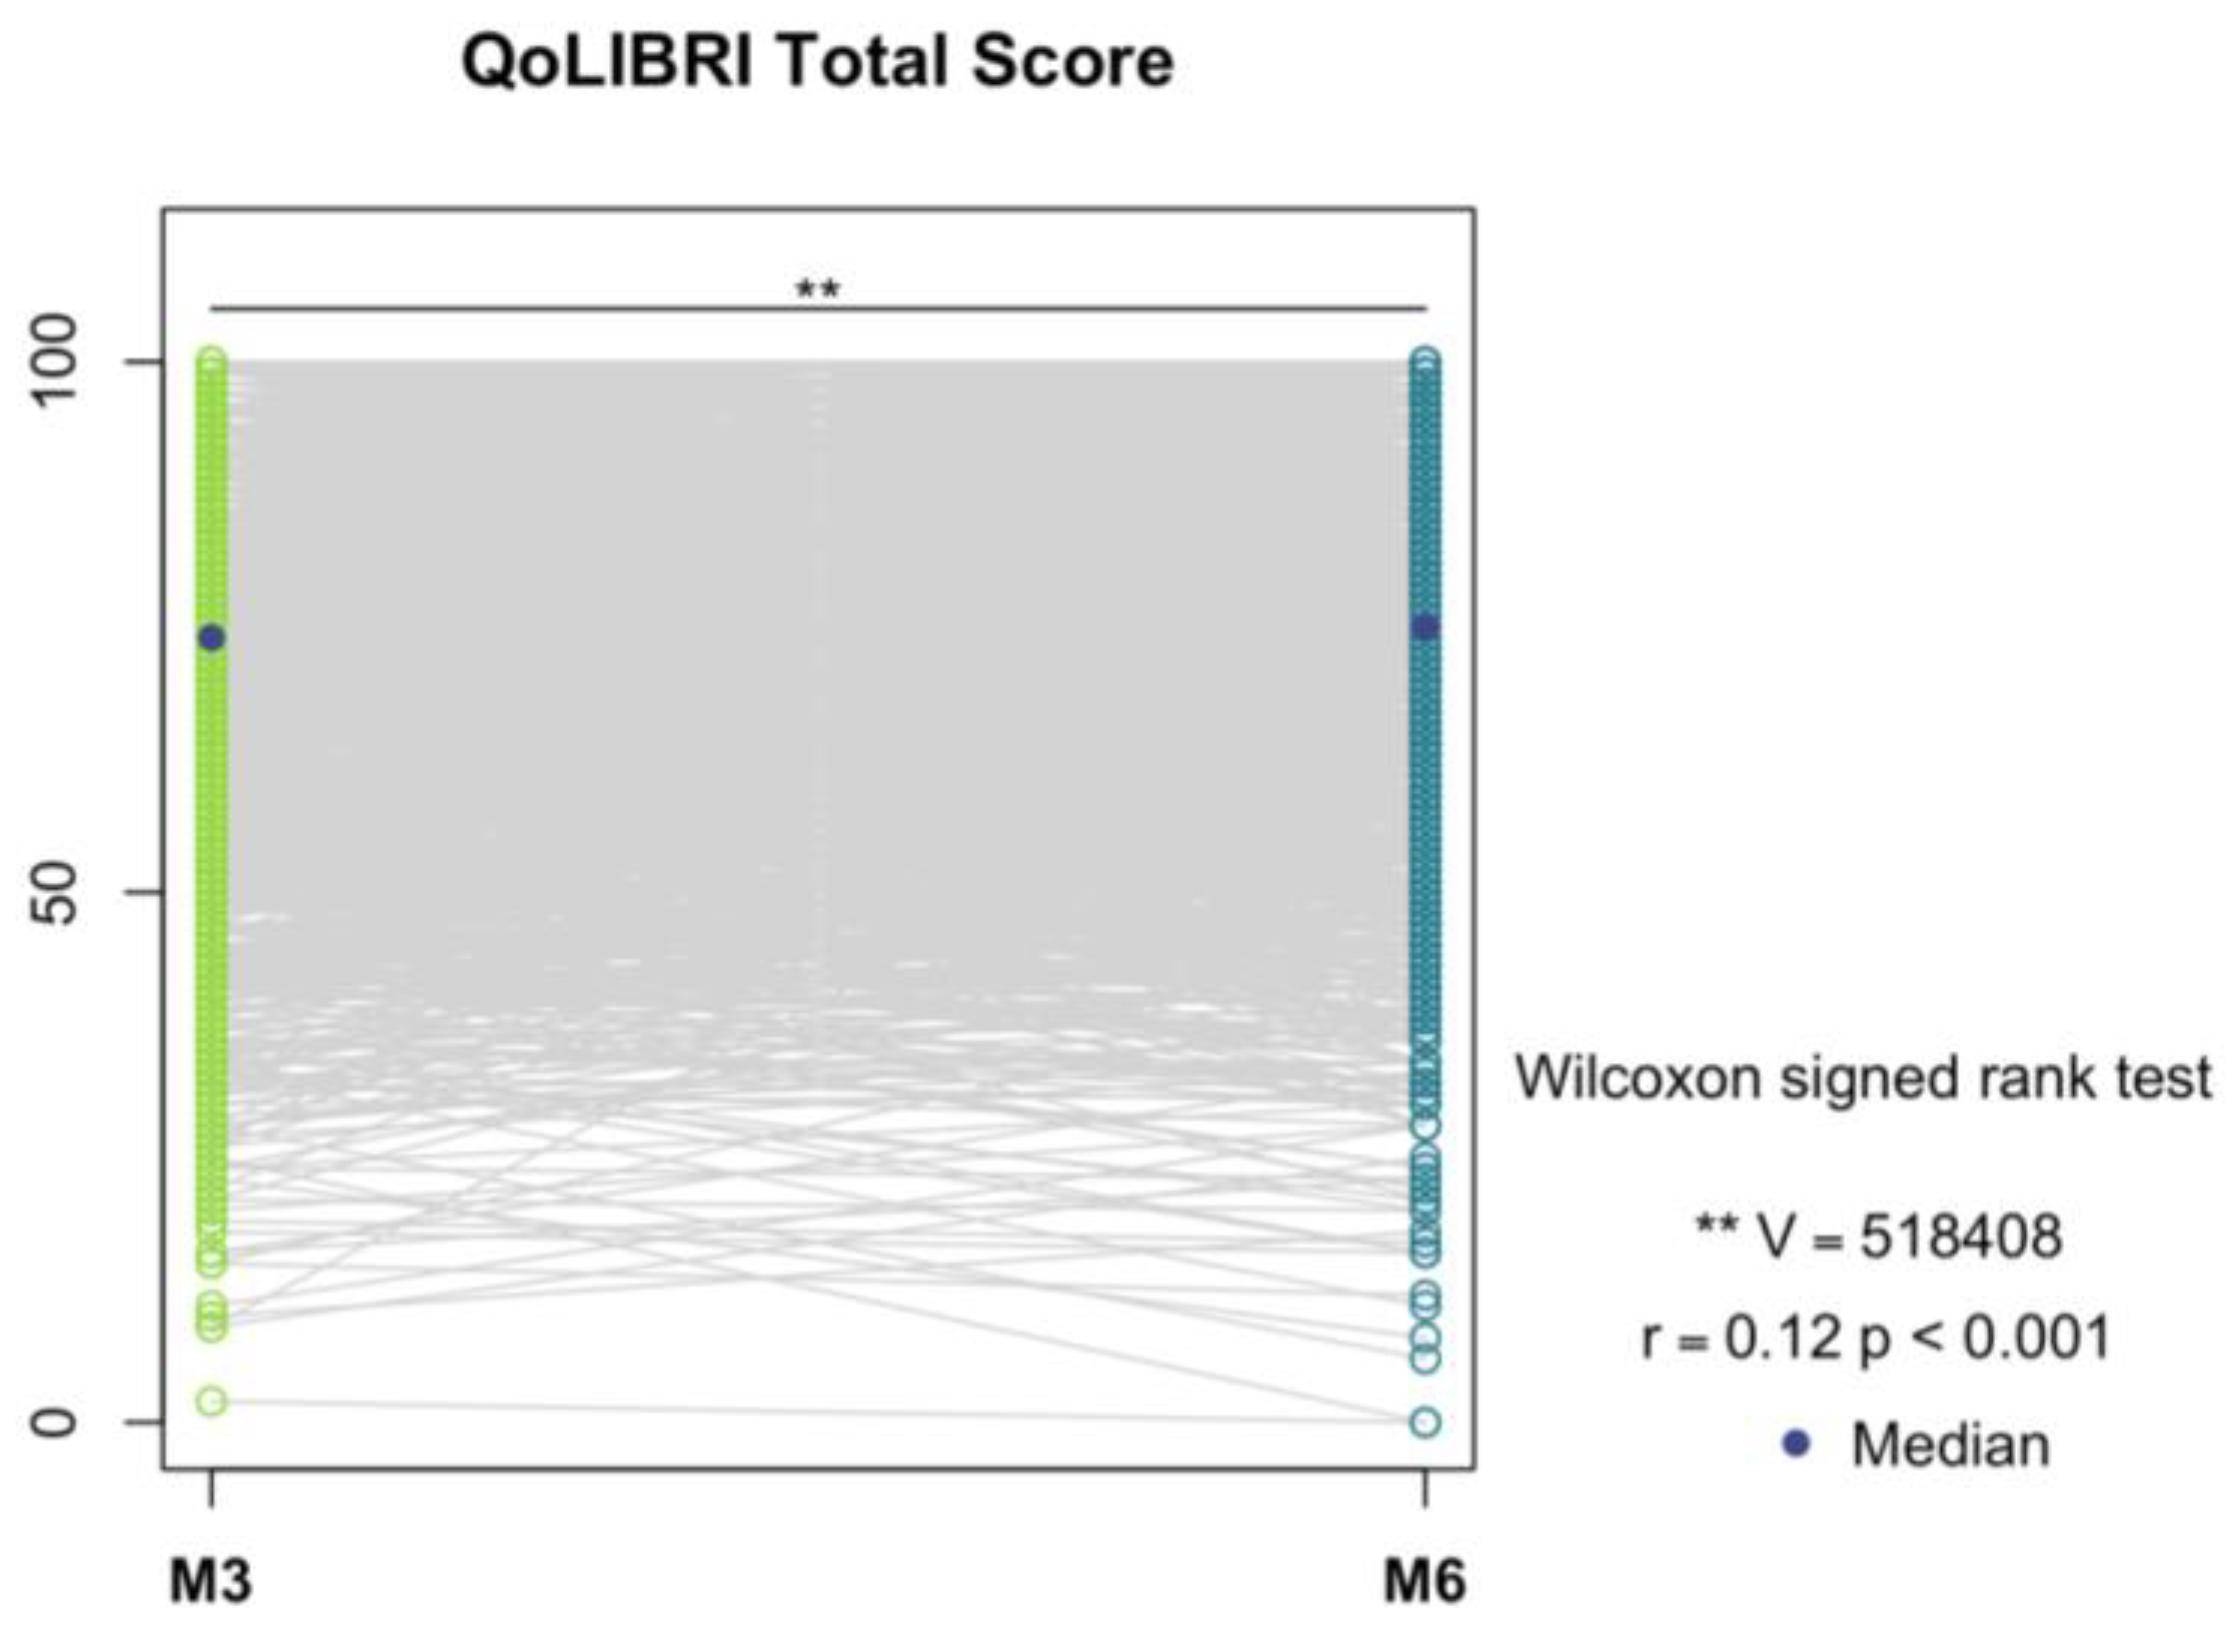
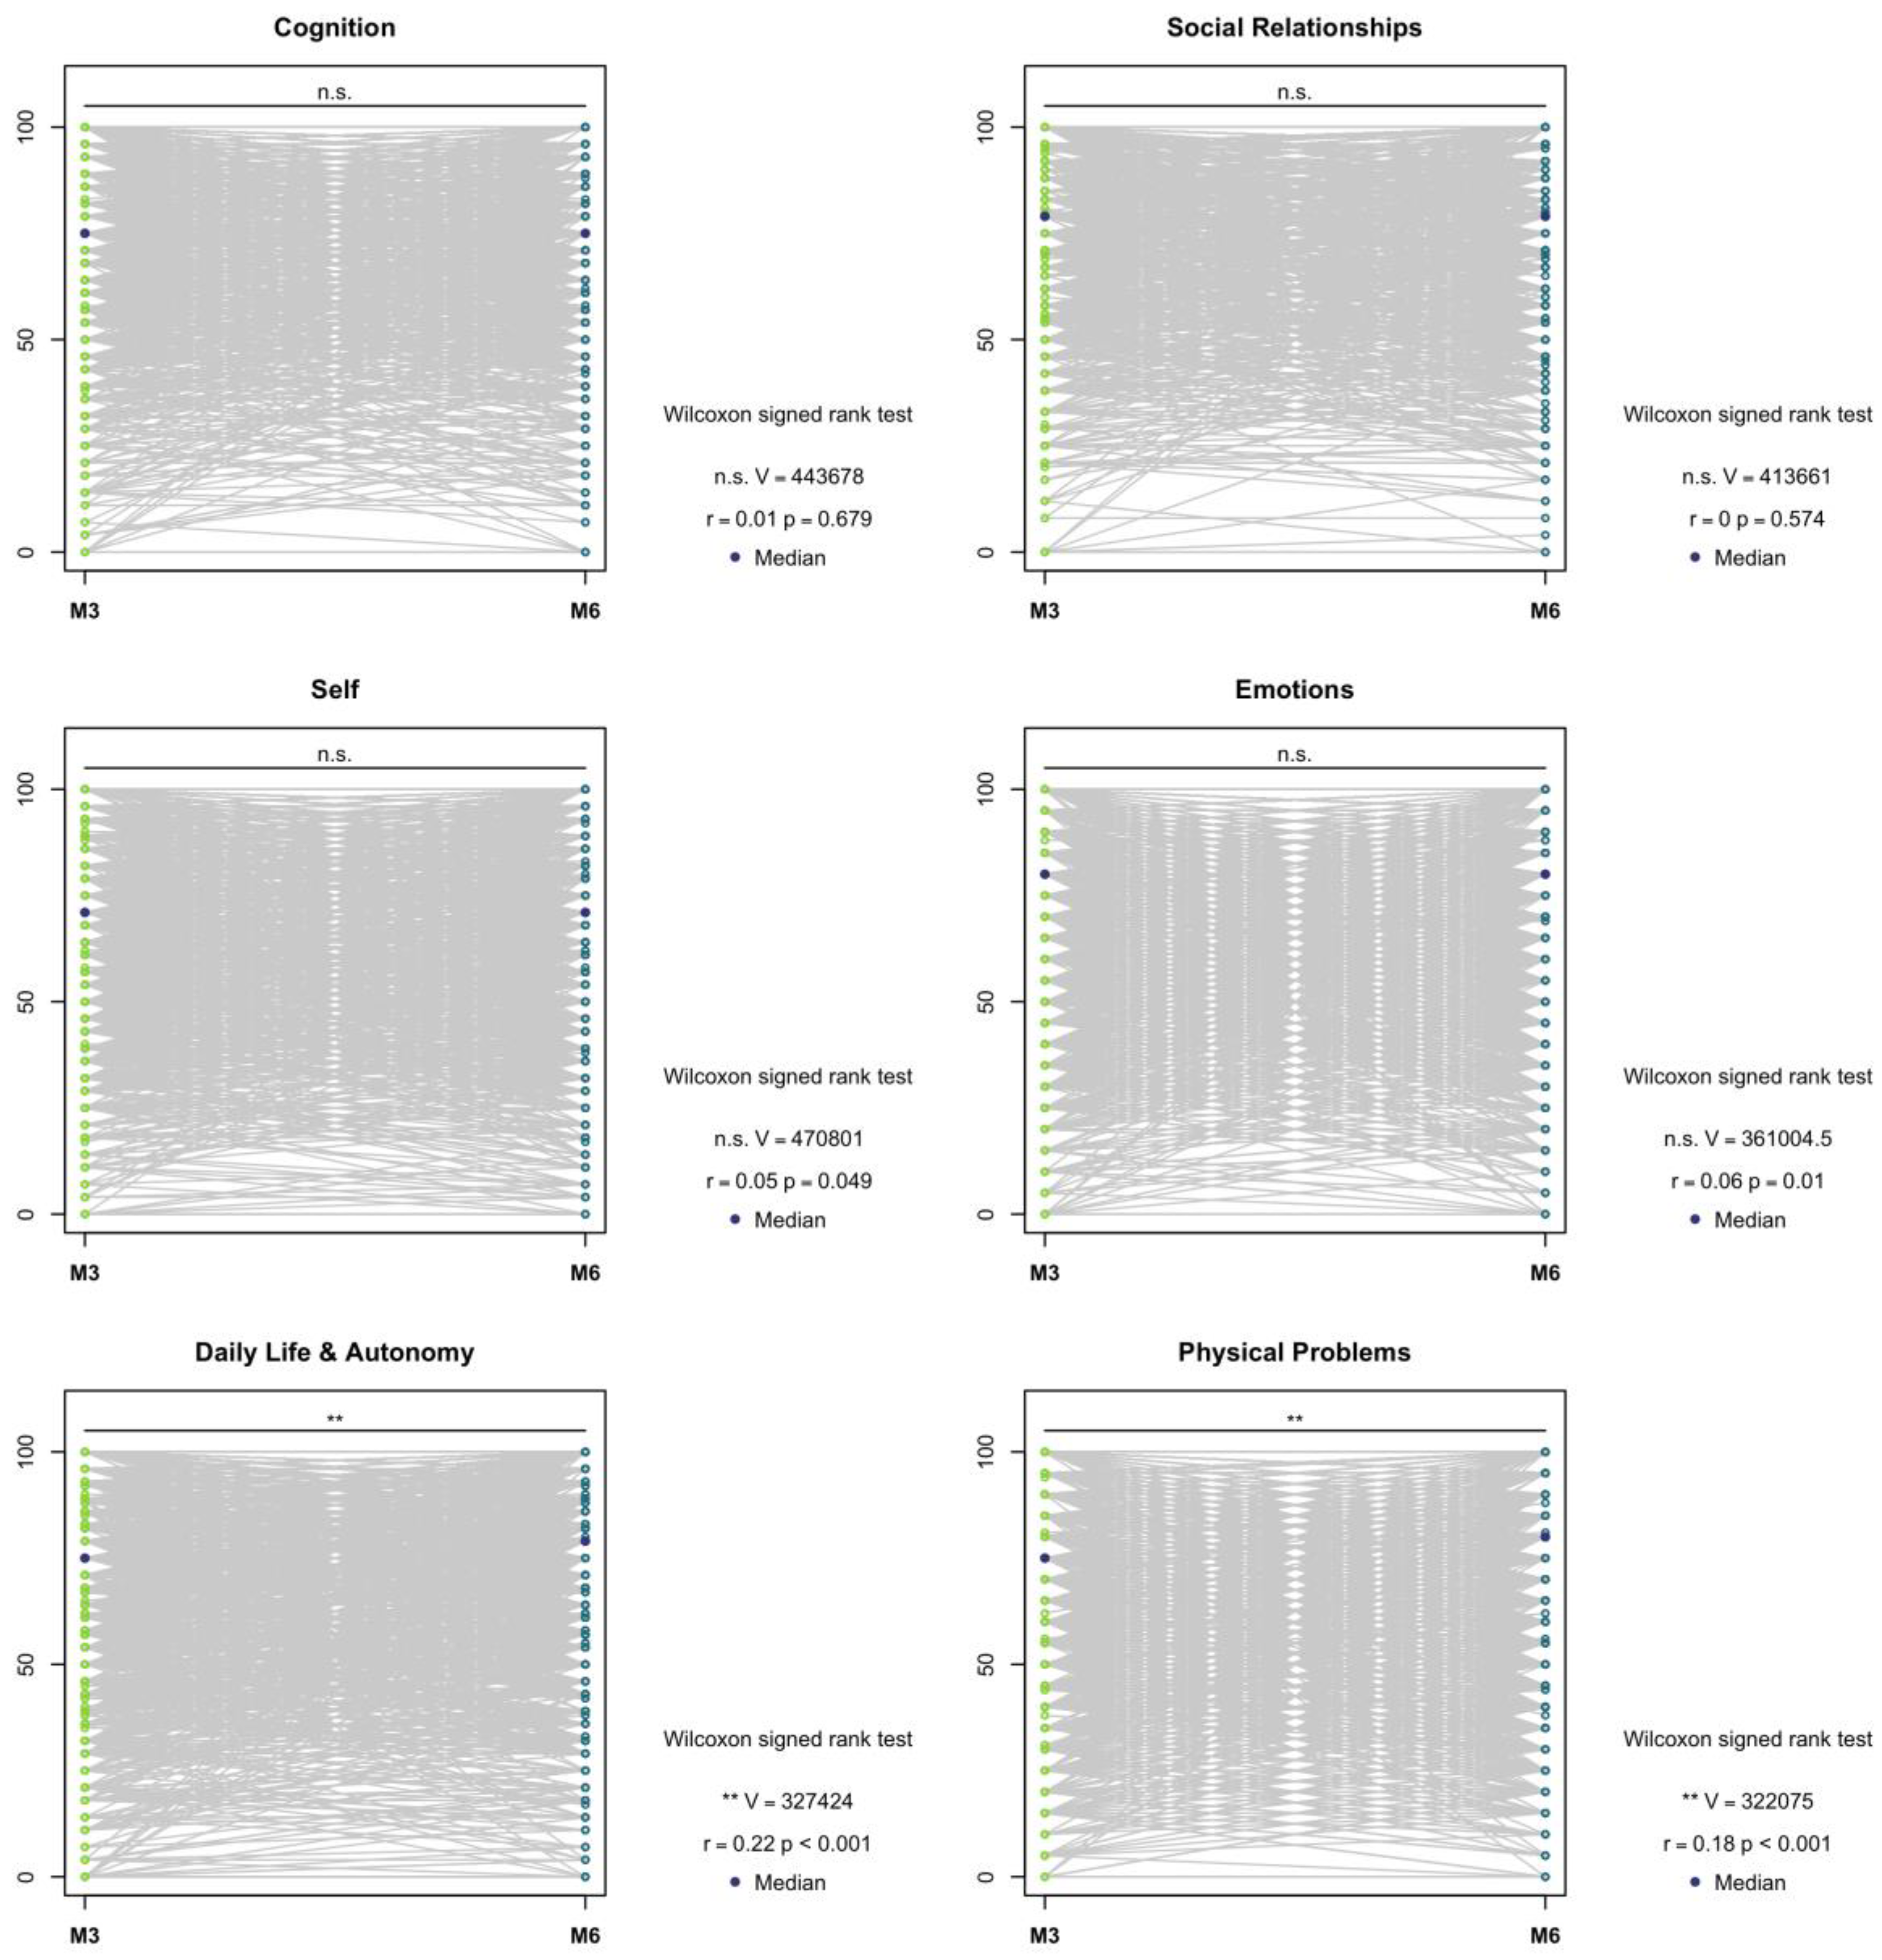
3.4. Responsiveness
4. Discussion
4.1. Response Shift
4.2. Responsiveness
4.3. Strengths and Limitations
5. Conclusions
Supplementary Materials
Author Contributions
Funding
Institutional Review Board Statement
Informed Consent Statement
Data Availability Statement
Acknowledgments
Conflicts of Interest
Appendix A

| Sample 1 * | ||||
|---|---|---|---|---|
| Value/Group | Sample 2 ** (n = 1390) | Excluded (n = 269) | p | |
| Age | M (SD) | 47.51 (18.13) | 60.42 (20.61) | <0.001 |
| Sex | Male | 928 (66.76%) | 149 (55.39%) | <0.001 |
| Female | 462 (33.24%) | 120 (44.61%) | ||
| Marital status | Partnered | 757 (54.46%) | 132 (49.07%) | 0.128 |
| Single | 631 (45.40%) | 136 (50.56%) | ||
| Missing | 2 (0.14%) | 1 (0.37%) | ||
| Education level | At least secondary/high school | 463 (33.31%) | 84 (31.23%) | 0.004 |
| College/university | 413 (29.71%) | 51 (18.96%) | ||
| None/primary school | 165 (11.87%) | 42 (15.61%) | ||
| Post-high school training | 238 (17.12%) | 55 (20.45%) | ||
| Missing | 111 (7.99%) | 37 (13.75%) | ||
| Employment status | Full-time employed | 661 (47.55%) | 57 (21.19%) | <0.001 |
| In training | 132 (9.50%) | 22 (8.18%) | ||
| Part-time employed | 180 (12.95%) | 16 (5.95%) | ||
| Retired | 246 (17.70%) | 143 (53.16%) | ||
| Unemployed | 106 (7.62%) | 17 (6.32%) | ||
| Missing | 65 (4.68%) | 14 (5.20%) | ||
| TBI severity (GCS) | Uncomplicated mild | 411 (29.57%) | 90 (33.46%) | 0.463 |
| Complicated mild | 94 (6.76%) | 19 (7.06%) | ||
| Moderate | 191 (13.74%) | 45 (16.73%) | ||
| Severe | 464 (33.38%) | 82 (30.48%) | ||
| Missing | 230 (16.55%) | 33 (12.27%) | ||
| Injury Severity Score (ISS) | M (SD) | 17.93 (15.03) | 18.59 (13.88) | 0.077 |
| Functional status change (Glasgow Outcome Scale–Extended; GOSE) | Improved | 436 (31.37%) | 80 (29.74%) | 0.001 |
| Stable | 785 (56.47%) | 133 (49.44%) | ||
| Worsened | 169 (12.16%) | 56 (20.82%) | ||
| Missing | 0 | 0 | ||
| Cause of injury | Fall | 572 (41.15%) | 143 (53.16%) | 0.001 |
| Road traffic accident | 595 (42.81%) | 97 (36.06%) | ||
| Violent/other | 222 (15.97%) | 29 (10.78%) | ||
| Missing | 1 (0.07%) | 0 | ||
| Clinical care pathways | ER | 335 (24.10%) | 48 (17.84%) | 0.049 |
| Admission | 536 (38.56%) | 104 (38.66%) | ||
| ICU | 519 (37.34%) | 117 (43.49%) | ||
| Length of hospital stay (in days) | M (SD) | 10.25 (18.16) | 12.17 (18.25) | 0.045 |
| Missing | 24 (1.73%) | 5 (1.86%) | ||
| Variable | Group | B (SE) | b | t | p |
|---|---|---|---|---|---|
| Total Score | |||||
| GOSE (linear) | - | 4.129 (0.680) | 0.344 | 6.073 | <0.001 |
| GOSE (ordinal) | - | 0.223 (0.511) | 0.019 | 0.436 | 0.663 |
| Age | - | −0.026 (0.027) | −0.042 | −0.960 | 0.337 |
| Sex (Ref: Female) | Male | −0.093 (0.635) | −0.008 | −0.147 | 0.883 |
| Marital status (Ref: Partnered) | Partnered | 0.191 (0.657) | 0.016 | 0.290 | 0.772 |
| Education level (Ref: College/university) | At least secondary/high school | −1.222 (0.806) | −0.102 | −1.515 | 0.132 |
| None/primary school | −1.289 (1.035) | −0.107 | −1.245 | 0.214 | |
| Post-high school training | −2.070 (0.880) | −0.172 | −2.354 | 0.019 | |
| Employment status (Ref: Full-time employed) | In training | −0.043 (1.279) | −0.004 | −0.034 | 0.973 |
| Part-time employed | 0.323 (1.001) | 0.027 | 0.323 | 0.747 | |
| Retired | 1.138 (1.044) | 0.095 | 1.090 | 0.276 | |
| Unemployed | −0.020 (1.206) | −0.002 | −0.017 | 0.986 | |
| TBI Severity (Ref: Uncomplicated mild) | Complicated mild | 0.147 (0.805) | 0.012 | 0.183 | 0.855 |
| Moderate | 0.170 (1.404) | 0.014 | 0.121 | 0.904 | |
| Severe | 0.945 (1.375) | 0.079 | 0.687 | 0.493 | |
| Injury severity score (ISS) | - | 0.042 (0.032) | 0.052 | 1.315 | 0.189 |
| Cause of injury (Ref: Road traffic accident) | Fall | 0.621 (0.676) | 0.052 | 0.920 | 0.358 |
| Violence/other | 0.436 (0.898) | 0.036 | 0.485 | 0.628 | |
| Clinical care pathways (Ref: ER) | Admission | 0.483 (0.870) | 0.040 | 0.556 | 0.579 |
| ICU | 0.473 (1.265) | 0.039 | 0.374 | 0.709 | |
| Length of hospital stay | - | −0.024 (0.021) | −0.036 | −1.154 | 0.249 |
| Cognition * | |||||
| GOSE (linear) | - | 3.365 (0.904) | 0.213 | 3.722 | <0.001 |
| GOSE (ordinal) | - | −0.758 (0.680) | −0.048 | −1.114 | 0.265 |
| Age | - | 0.025 (0.036) | 0.031 | 0.704 | 0.482 |
| Sex (Ref: Female) | Male | −1.030 (0.846) | −0.065 | −1.218 | 0.223 |
| Marital status (Ref: Partnered) | Partnered | 1.244 (0.871) | 0.079 | 1.429 | 0.153 |
| Education level (Ref: College/university) | At least secondary/high school | −1.153 (1.114) | −0.073 | −1.035 | 0.304 |
| None/primary school | −2.023 (1.337) | −0.128 | −1.514 | 0.131 | |
| Post-high school training | −1.930 (1.207) | −0.122 | −1.599 | 0.111 | |
| Employment status (Ref: Full-time employed) | In training | 0.714 (1.689) | 0.045 | 0.423 | 0.673 |
| Part-time employed | 0.757 (1.396) | 0.048 | 0.542 | 0.589 | |
| Retired | −0.269 (1.369) | −0.017 | −0.196 | 0.845 | |
| Unemployed | −0.023 (1.600) | −0.001 | −0.014 | 0.989 | |
| TBI Severity (Ref: Uncomplicated mild) | Complicated mild | 0.687 (1.060) | 0.043 | 0.648 | 0.517 |
| Moderate | −0.510 (1.945) | −0.032 | −0.262 | 0.794 | |
| Severe | 2.033 (1.788) | 0.129 | 1.137 | 0.257 | |
| Injury severity score (ISS) | - | −0.004 (0.042) | −0.003 | −0.085 | 0.932 |
| Cause of injury (Ref: Road traffic accident) | Fall | −0.634 (0.899) | −0.040 | −0.705 | 0.481 |
| Violence/other | -0.763 (1.195) | -0.048 | -0.639 | 0.523 | |
| Clinical care pathways (Ref: ER) | Admission | 0.342 (1.159) | 0.022 | 0.295 | 0.768 |
| ICU | 1.143 (1.675) | 0.072 | 0.682 | 0.495 | |
| Length of hospital stay | - | −0.035 (0.028) | −0.040 | −1.252 | 0.211 |
| Self * | |||||
| GOSE (linear) | - | 4.725 (0.932) | 0.289 | 5.070 | <0.001 |
| GOSE (ordinal) | - | −0.223 (0.701) | −0.014 | −0.318 | 0.750 |
| Age | - | 0.011 (0.037) | 0.012 | 0.284 | 0.777 |
| Sex (Ref: Female) | Male | −0.176 (0.871) | −0.011 | −0.202 | 0.840 |
| Marital status (Ref: Partnered) | Partnered | 0.639 (0.900) | 0.039 | 0.710 | 0.478 |
| Education level (Ref: College/university) | At least secondary/high school | −0.655 (1.048) | −0.040 | −0.625 | 0.532 |
| None/primary school | −0.948 (1.356) | −0.058 | −0.699 | 0.485 | |
| Post-high school training | −1.908 (1.210) | −0.117 | −1.577 | 0.115 | |
| Employment status (Ref: Full-time employed) | In training | −0.993 (1.715) | −0.061 | −0.579 | 0.563 |
| Part-time employed | −0.554 (1.361) | −0.034 | −0.407 | 0.684 | |
| Retired | −0.015 (1.441) | −0.001 | −0.010 | 0.992 | |
| Unemployed | 0.255 (1.642) | 0.016 | 0.155 | 0.877 | |
| TBI Severity (Ref: Uncomplicated mild) | Complicated mild | 0.107 (1.103) | 0.007 | 0.097 | 0.923 |
| Moderate | 0.454 (1.822) | 0.028 | 0.249 | 0.803 | |
| Severe | −0.632 (1.884) | −0.039 | −0.336 | 0.738 | |
| Injury severity score (ISS) | - | −0.034 (0.028) | −0.038 | −1.196 | 0.232 |
| Cause of injury (Ref: Road traffic accident) | Fall | 1.240 (0.926) | 0.076 | 1.339 | 0.181 |
| Violence/other | 0.560 (1.229) | 0.034 | 0.456 | 0.649 | |
| Clinical care pathways (Ref: ER) | Admission | 0.706 (1.193) | 0.043 | 0.591 | 0.554 |
| ICU | 0.777 (1.730) | 0.048 | 0.449 | 0.653 | |
| Length of hospital stay | - | −0.034 (0.028) | −0.038 | −1.196 | 0.232 |
| Daily Life & Autonomy * | |||||
| GOSE (linear) | - | 6.384 (0.977) | 0.365 | 6.536 | <0.001 |
| GOSE (ordinal) | - | 1.204 (0.735) | 0.069 | 1.639 | 0.102 |
| Age | - | −0.072 (0.038) | −0.079 | −1.875 | 0.061 |
| Sex (Ref: Female) | Male | 0.004 (0.916) | 0.000 | 0.005 | 0.996 |
| Marital status (Ref: Partnered) | Partnered | −1.174 (0.948) | −0.067 | −1.239 | 0.216 |
| Education level (Ref: College/university) | At least secondary/high school | −0.796 (1.116) | −0.045 | −0.713 | 0.476 |
| None/primary school | 0.498 (1.545) | 0.028 | 0.323 | 0.748 | |
| Post-high school training | −2.608 (1.275) | −0.149 | −2.046 | 0.041 | |
| Employment status (Ref: Full-time employed) | In training | −1.046 (1.784) | −0.060 | −0.586 | 0.558 |
| Part-time employed | 0.474 (1.449) | 0.027 | 0.327 | 0.744 | |
| Retired | 2.578 (1.497) | 0.147 | 1.721 | 0.086 | |
| Unemployed | 0.768 (1.680) | 0.044 | 0.457 | 0.648 | |
| TBI Severity (Ref: Uncomplicated mild) | Complicated mild | 1.277 (1.223) | 0.073 | 1.044 | 0.298 |
| Moderate | 1.369 (2.141) | 0.078 | 0.640 | 0.524 | |
| Severe | 2.013 (1.952) | 0.115 | 1.031 | 0.304 | |
| Injury severity score (ISS) | - | 0.086 (0.046) | 0.073 | 1.878 | 0.061 |
| Cause of injury (Ref: Road traffic accident) | Fall | −0.386 (0.971) | −0.022 | −0.398 | 0.691 |
| Violence/other | −0.266 (1.289) | −0.015 | −0.207 | 0.836 | |
| Clinical care pathways (Ref: ER) | Admission | 1.713 (1.263) | 0.098 | 1.356 | 0.175 |
| ICU | 2.060 (1.846) | 0.118 | 1.116 | 0.265 | |
| Length of hospital stay | - | −0.024 (0.029) | −0.025 | −0.832 | 0.405 |
| Social Relationships * | |||||
| GOSE (linear) | - | 2.646 (0.900) | 0.168 | 2.942 | 0.003 |
| GOSE (ordinal) | - | 0.035 (0.676) | 0.002 | 0.051 | 0.959 |
| Age | - | −0.035 (0.036) | −0.042 | −0.965 | 0.335 |
| Sex (Ref: Female) | Male | 0.203 (0.841) | 0.013 | 0.242 | 0.809 |
| Marital status (Ref: Partnered) | Partnered | 1.192 (0.865) | 0.076 | 1.377 | 0.169 |
| Education level (Ref: College/university) | At least secondary/high school | −0.237 (1.056) | −0.015 | −0.225 | 0.822 |
| None/primary school | −1.068 (1.418) | −0.068 | −0.753 | 0.453 | |
| Post-high school training | −2.181 (1.151) | −0.139 | −1.895 | 0.058 | |
| Employment status (Ref: Full-time employed) | In training | 0.408 (1.654) | 0.026 | 0.247 | 0.805 |
| Part-time employed | −0.350 (1.295) | −0.022 | −0.270 | 0.787 | |
| Retired | 2.075 (1.410) | 0.132 | 1.472 | 0.142 | |
| Unemployed | 0.458 (1.568) | 0.029 | 0.292 | 0.770 | |
| TBI Severity (Ref: Uncomplicated mild) | Complicated mild | −0.912 (1.267) | −0.058 | −0.720 | 0.477 |
| Moderate | −0.353 (1.976) | −0.022 | −0.178 | 0.859 | |
| Severe | 0.489 (1.969) | 0.031 | 0.248 | 0.805 | |
| Injury severity score (ISS) | - | 0.055 (0.042) | 0.052 | 1.305 | 0.192 |
| Cause of injury (Ref: Road traffic accident) | Fall | 0.771 (0.894) | 0.049 | 0.862 | 0.389 |
| Violence/other | 1.047 (1.187) | 0.067 | 0.883 | 0.378 | |
| Clinical care pathways (Ref: ER) | Admission | 0.645 (1.185) | 0.041 | 0.544 | 0.587 |
| ICU | −1.019 (1.758) | −0.065 | −0.580 | 0.563 | |
| Length of hospital stay | - | −0.008 (0.027) | −0.009 | −0.296 | 0.767 |
| Emotions * | |||||
| GOSE (linear) | - | 2.985 (1.177) | 0.145 | 2.536 | 0.011 |
| GOSE (ordinal) | - | 0.259 (0.886) | 0.013 | 0.293 | 0.770 |
| Age | - | −0.038 (0.047) | −0.035 | −0.803 | 0.422 |
| Sex (Ref: Female) | Male | 0.901 (1.101) | 0.044 | 0.818 | 0.414 |
| Marital status (Ref: Partnered) | Partnered | 0.481 (1.132) | 0.023 | 0.425 | 0.671 |
| Education level (Ref: College/university) | At least secondary/high school | −2.149 (1.360) | −0.105 | −1.580 | 0.115 |
| None/primary school | −1.548 (1.745) | −0.075 | −0.887 | 0.375 | |
| Post-high school training | −1.348 (1.493) | −0.066 | −0.903 | 0.367 | |
| Employment status (Ref: Full-time employed) | In training | 1.807 (2.222) | 0.088 | 0.813 | 0.417 |
| Part-time employed | −0.334 (1.675) | −0.016 | −0.200 | 0.842 | |
| Retired | 1.127 (1.805) | 0.055 | 0.624 | 0.532 | |
| Unemployed | 1.514 (2.059) | 0.074 | 0.735 | 0.462 | |
| TBI Severity (Ref: Uncomplicated mild) | Complicated mild | −0.800 (1.436) | −0.039 | −0.557 | 0.578 |
| Moderate | −1.690 (2.412) | −0.082 | −0.701 | 0.484 | |
| Severe | 0.075 (2.172) | 0.004 | 0.035 | 0.972 | |
| Injury severity score (ISS) | - | 0.052 (0.056) | 0.038 | 0.928 | 0.354 |
| Cause of injury (Ref: Road traffic accident) | Fall | 1.728 (1.173) | 0.084 | 1.473 | 0.141 |
| Violence/other | 1.182 (1.560) | 0.058 | 0.757 | 0.449 | |
| Clinical care pathways (Ref: ER) | Admission | 0.237 (1.513) | 0.012 | 0.157 | 0.875 |
| ICU | −0.779 (2.186) | −0.038 | −0.357 | 0.722 | |
| Length of hospital stay | - | −0.019 (0.035) | −0.017 | −0.532 | 0.595 |
| Physical Problems * | |||||
| GOSE (linear) | - | 3.960 (1.024) | 0.219 | 3.866 | <0.001 |
| GOSE (ordinal) | - | 1.207 (0.771) | 0.067 | 1.565 | 0.118 |
| Age | - | −0.059 (0.040) | −0.063 | −1.471 | 0.141 |
| Sex (Ref: Female) | Male | 0.095 (0.958) | 0.005 | 0.099 | 0.921 |
| Marital status (Ref: Partnered) | Partnered | −1.675 (0.991) | −0.093 | −1.689 | 0.091 |
| Education level (Ref: College/university) | At least secondary/high school | −2.352 (1.209) | −0.130 | −1.945 | 0.053 |
| None/primary school | −3.125 (1.506) | −0.173 | −2.075 | 0.038 | |
| Post-high school training | −2.365 (1.397) | −0.131 | −1.692 | 0.092 | |
| Employment status (Ref: Full-time employed) | In training | −0.444 (1.869) | −0.025 | −0.238 | 0.812 |
| Part-time employed | 2.336 (1.551) | 0.129 | 1.506 | 0.134 | |
| Retired | 1.498 (1.563) | 0.083 | 0.958 | 0.338 | |
| Unemployed | −2.687 (1.841) | −0.149 | −1.459 | 0.146 | |
| TBI Severity (Ref: Uncomplicated mild) | Complicated mild | 0.059 (1.377) | 0.003 | 0.043 | 0.966 |
| Moderate | 1.819 (2.153) | 0.101 | 0.845 | 0.399 | |
| Severe | 1.909 (1.973) | 0.106 | 0.967 | 0.334 | |
| Injury severity score (ISS) | - | 0.032 (0.048) | 0.026 | 0.665 | 0.506 |
| Cause of injury (Ref: Road traffic accident) | Fall | 1.692 (1.018) | 0.094 | 1.662 | 0.097 |
| Violence/other | 1.249 (1.353) | 0.069 | 0.923 | 0.356 | |
| Clinical care pathways (Ref: ER) | Admission | −1.375 (1.337) | −0.076 | −1.028 | 0.304 |
| ICU | −0.395 (1.942) | −0.022 | −0.203 | 0.839 | |
| Length of hospital stay | - | −0.023 (0.031) | −0.023 | −0.726 | 0.468 |


References
- Hays, R.D.; Morales, L.S. The RAND-36 Measure of Health-Related Quality of Life. Ann. Med. 2001, 33, 350–357. [Google Scholar] [CrossRef] [PubMed]
- Cella, D.F.; Bonomi, A.E. Measuring Quality of Life: 1995 Update. Oncol. Williston Park N 1995, 9, 47–60. [Google Scholar]
- Maas, A.I.R.; Menon, D.K.; Adelson, P.D.; Andelic, N.; Bell, M.J.; Belli, A.; Bragge, P.; Brazinova, A.; Büki, A.; Chesnut, R.M.; et al. Traumatic Brain Injury: Integrated Approaches to Improve Prevention, Clinical Care, and Research. Lancet Neurol. 2017, 16, 987–1048. [Google Scholar] [CrossRef] [PubMed]
- von Steinbuechel, N.; Covic, A.; Polinder, S.; Kohlmann, T.; Cepulyte, U.; Poinstingl, H.; Backhaus, J.; Bakx, W.; Bullinger, M.; Christensen, A.-L.; et al. Assessment of Health-Related Quality of Life after TBI: Comparison of a Disease-Specific (QOLIBRI) with a Generic (SF-36) Instrument. Behav. Neurol. 2016, 2016, 7928014. [Google Scholar] [CrossRef]
- von Steinbuechel, N.; Petersen, C.; Bullinger, M.; the QOLIBRI Group. Assessment of Health-Related Quality of Life in Persons after Traumatic Brain Injury—Development of the Qolibri, a Specific Measure. Acta Neurochir. Suppl. 2005, 93, 43–49. [Google Scholar] [CrossRef] [PubMed]
- Maas, A.I.R.; Stocchetti, N.; Bullock, R. Moderate and Severe Traumatic Brain Injury in Adults. Lancet Neurol. 2008, 7, 728–741. [Google Scholar] [CrossRef]
- Coronado, V.G.; Xu, L.; Basavaraju, S.V.; McGuire, L.C.; Wald, M.M.; Faul, M.D.; Guzman, B.R.; Hemphill, J.D.; Centers for Disease Control and Prevention (CDC). Surveillance for Traumatic Brain Injury-Related Deaths—United States, 1997–2007. Morb. Mortal. Wkly. Rep. Surveill. Summ. 2011, 60, 1–32. [Google Scholar]
- Brooks, J.C.; Strauss, D.J.; Shavelle, R.M.; Paculdo, D.R.; Hammond, F.M.; Harrison-Felix, C.L. Long-Term Disability and Survival in Traumatic Brain Injury: Results from the National Institute on Disability and Rehabilitation Research Model Systems. Arch. Phys. Med. Rehabil. 2013, 94, 2203–2209. [Google Scholar] [CrossRef]
- Majdan, M.; Plancikova, D.; Brazinova, A.; Rusnak, M.; Nieboer, D.; Feigin, V.; Maas, A. Epidemiology of Traumatic Brain Injuries in Europe: A Cross-Sectional Analysis. Lancet Public Health 2016, 1, e76–e83. [Google Scholar] [CrossRef]
- Hyder, A.A.; Wunderlich, C.A.; Puvanachandra, P.; Gururaj, G.; Kobusingye, O.C. The Impact of Traumatic Brain Injuries: A Global Perspective. NeuroRehabilitation 2007, 22, 341–353. [Google Scholar] [CrossRef]
- Reilly, P. The Impact of Neurotrauma on Society: An International Perspective. In Progress in Brain Research; Elsevier: Amsterdam, The Netherlands, 2007; Volume 161, pp. 3–9. ISBN 978-0-444-53017-2. [Google Scholar]
- Brooks, J.C.; Shavelle, R.M.; Strauss, D.J.; Hammond, F.M.; Harrison-Felix, C.L. Long-Term Survival After Traumatic Brain Injury Part II: Life Expectancy. Arch. Phys. Med. Rehabil. 2015, 96, 1000–1005. [Google Scholar] [CrossRef] [PubMed]
- Langlois, J.A.; Rutland-Brown, W.; Wald, M.M. The Epidemiology and Impact of Traumatic Brain Injury: A Brief Overview. J. Head Trauma Rehabil. 2006, 21, 375–378. [Google Scholar] [CrossRef] [PubMed]
- Ma, V.Y.; Chan, L.; Carruthers, K.J. Incidence, Prevalence, Costs, and Impact on Disability of Common Conditions Requiring Rehabilitation in the United States: Stroke, Spinal Cord Injury, Traumatic Brain Injury, Multiple Sclerosis, Osteoarthritis, Rheumatoid Arthritis, Limb Loss, and Back Pain. Arch. Phys. Med. Rehabil. 2014, 95, 986–995.e1. [Google Scholar] [CrossRef] [PubMed]
- Dawson, D.R.; Schwartz, M.L.; Winocur, G.; Stuss, D.T. Return to Productivity Following Traumatic Brain Injury: Cognitive, Psychological, Physical, Spiritual, and Environmental Correlates. Disabil. Rehabil. 2007, 29, 301–313. [Google Scholar] [CrossRef]
- Draper, K.; Ponsford, J.; Schönberger, M. Psychosocial and Emotional Outcomes 10 Years Following Traumatic Brain Injury. J. Head Trauma Rehabil. 2007, 22, 278–287. [Google Scholar] [CrossRef]
- Wood, R.L.; Rutterford, N. Psychosocial Adjustment 17 Years after Severe Brain Injury. J. Neurol. Neurosurg. Psychiatry 2006, 77, 71–73. [Google Scholar] [CrossRef]
- Polinder, S.; Cnossen, M.C.; Real, R.G.L.; Covic, A.; Gorbunova, A.; Voormolen, D.C.; Master, C.L.; Haagsma, J.A.; Diaz-Arrastia, R.; von Steinbuechel, N. A Multidimensional Approach to Post-Concussion Symptoms in Mild Traumatic Brain Injury. Front. Neurol. 2018, 9, 1113. [Google Scholar] [CrossRef]
- Walker, W.C.; Pickett, T.C. Motor Impairment after Severe Traumatic Brain Injury: A Longitudinal Multicenter Study. J. Rehabil. Res. Dev. 2007, 44, 975–982. [Google Scholar] [CrossRef]
- Moore, E.L.; Terryberry-Spohr, L.; Hope, D.A. Mild Traumatic Brain Injury and Anxiety Sequelae: A Review of the Literature. Brain Inj. 2006, 20, 117–132. [Google Scholar] [CrossRef]
- Teymoori, A.; Real, R.; Gorbunova, A.; Haghish, E.F.; Andelic, N.; Wilson, L.; Asendorf, T.; Menon, D.; von Steinbüchel, N. Measurement Invariance of Assessments of Depression (PHQ-9) and Anxiety (GAD-7) across Sex, Strata and Linguistic Backgrounds in a European-Wide Sample of Patients after Traumatic Brain Injury. J. Affect. Disord. 2020, 262, 278–285. [Google Scholar] [CrossRef]
- Wang, B.; Zeldovich, M.; Rauen, K.; Wu, Y.-J.; Covic, A.; Muller, I.; Haagsma, J.A.; Polinder, S.; Menon, D.; Asendorf, T.; et al. Longitudinal Analyses of the Reciprocity of Depression and Anxiety after Traumatic Brain Injury and Its Clinical Implications. J. Clin. Med. 2021, 10, 5597. [Google Scholar] [CrossRef] [PubMed]
- Jorge, R.E.; Robinson, R.G.; Moser, D.; Tateno, A.; Crespo-Facorro, B.; Arndt, S. Major Depression Following Traumatic Brain Injury. Arch. Gen. Psychiatry 2004, 61, 42–50. [Google Scholar] [CrossRef] [PubMed]
- van der Vlegel, M.; Polinder, S.; Mikolic, A.; Kaplan, R.; von Steinbuechel, N.; Plass, A.; Zeldovich, M.; van Praag, D.; Bockhop, F.; Cunitz, K.; et al. The Association of Post-Concussion and Post-Traumatic Stress Disorder Symptoms with Health-Related Quality of Life, Health Care Use and Return-to-Work after Mild Traumatic Brain Injury. J. Clin. Med. 2021, 10, 2473. [Google Scholar] [CrossRef] [PubMed]
- Verhaeghe, S.; Defloor, T.; Grypdonck, M. Stress and Coping among Families of Patients with Traumatic Brain Injury: A Review of the Literature. J. Clin. Nurs. 2005, 14, 1004–1012. [Google Scholar] [CrossRef] [PubMed]
- von Steinbuechel, N.; Wilson, L.; Gibbons, H.; Hawthorne, G.; Höfer, S.; Schmidt, S.; Bullinger, M.; Maas, A.; Neugebauer, E.; Powell, J.; et al. Quality of Life after Brain Injury (QOLIBRI): Scale Development and Metric Properties. J. Neurotrauma 2010, 27, 1167–1185. [Google Scholar] [CrossRef]
- von Steinbuechel, N.; Wilson, L.; Gibbons, H.; Hawthorne, G.; Höfer, S.; Schmidt, S.; Bullinger, M.; Maas, A.; Neugebauer, E.; Powell, J.; et al. Quality of Life after Brain Injury (QOLIBRI): Scale Validity and Correlates of Quality of Life. J. Neurotrauma 2010, 27, 1157–1165. [Google Scholar] [CrossRef]
- von Steinbuechel, N.; Rauen, K.; Krenz, U.; Wu, Y.-J.; Covic, A.; Plass, A.; Cunitz, K.; Mueller, I.; Bockhop, F.; Polinder, S.; et al. Translation and Linguistic Validation of Outcome Instruments for Traumatic Brain Injury Research and Clinical Practice: A Step-by-Step Approach within the Observational CENTER-TBI Study. J. Clin. Med. 2021, 10, 2863. [Google Scholar] [CrossRef]
- von Steinbuechel, N.; Rauen, K.; Bockhop, F.; Covic, A.; Krenz, U.; Plass, A.; Cunitz, K.; Polinder, S.; Wilson, L.; Steyerberg, E.; et al. Psychometric Characteristics of the Patient-Reported Outcome Measures Applied in the CENTER-TBI Study. J. Clin. Med. 2021, 10, 2396. [Google Scholar] [CrossRef]
- Giustini, M.; Longo, E.; Azicnuda, E.; Silvestro, D.; D’Ippolito, M.; Rigon, J.; Cedri, C.; Bivona, U.; Barba, C.; Formisano, R. Health-Related Quality of Life after Traumatic Brain Injury: Italian Validation of the QOLIBRI. Funct. Neurol. 2014, 29, 167–176. [Google Scholar]
- Hawthorne, G.; Kaye, A.H.; Gruen, R.; Houseman, D.; Bauer, I. Traumatic Brain Injury and Quality of Life: Initial Australian Validation of the QOLIBRI. J. Clin. Neurosci. 2011, 18, 197–202. [Google Scholar] [CrossRef]
- Siponkoski, S.; Wilson, L.; Steinbüchel, N.; Sarajuuri, J.; Koskinen, S. Quality of Life after Traumatic Brain Injury: Finnish Experience of the QOLIBRI in Residential Rehabilitation. J. Rehabil. Med. 2013, 45, 835–842. [Google Scholar] [CrossRef] [PubMed]
- Soberg, H.L.; Roe, C.; Brunborg, C.; von Steinbüchel, N.; Andelic, N. The Norwegian Version of the QOLIBRI—A Study of Metric Properties Based on a 12 Month Follow-up of Persons with Traumatic Brain Injury. Health Qual. Life Outcomes 2017, 15, 14. [Google Scholar] [CrossRef] [PubMed]
- Castaño-León, A.M.; Navarro-Main, B.; Gomez, P.A.; Gil, A.; Soler, M.D.; Lagares, A.; Bernabeu, M.; Steinbüchel, N.v.; Real, R.G.L. Quality of Life After Brain Injury: Psychometric Properties of the Spanish Translation of the QoLIBRI. Eval. Health Prof. 2018, 41, 456–473. [Google Scholar] [CrossRef] [PubMed]
- von Steinbuechel, N.; Rauen, K.; Covic, A.; Krenz, U.; Bockhop, F.; Mueller, I.; Cunitz, K.; Polinder, S.; Steyerberg, E.W.; Vester, J.; et al. Sensitivity of Outcome Instruments in a Priori Selected Patient Groups after Traumatic Brain Injury: Results from the CENTER-TBI Study. PLoS ONE 2023, 18, e0280796. [Google Scholar] [CrossRef] [PubMed]
- Brazier, J.E.; Harper, R.; Jones, N.M.; O’Cathain, A.; Thomas, K.J.; Usherwood, T.; Westlake, L. Validating the SF-36 Health Survey Questionnaire: New Outcome Measure for Primary Care. BMJ 1992, 305, 160–164. [Google Scholar] [CrossRef] [PubMed]
- von Steinbüchel, N.; Meeuwsen, M.; Zeldovich, M.; Vester, J.C.; Maas, A.; Koskinen, S.; Covic, A. Differences in Health-Related Quality of Life after Traumatic Brain Injury between Varying Patient Groups: Sensitivity of a Disease-Specific (QOLIBRI) and a Generic (SF-36) Instrument. J. Neurotrauma 2020, 37, 1242–1254. [Google Scholar] [CrossRef] [PubMed]
- Albrecht, G.L.; Devlieger, P.J. The Disability Paradox: High Quality of Life against All Odds. Soc. Sci. Med. 1999, 48, 977–988. [Google Scholar] [CrossRef] [PubMed]
- Ahmed, S.; Mayo, N.E.; Wood-Dauphinee, S.; Hanley, J.A.; Robin Cohen, S. Response Shift Influenced Estimates of Change in Health-Related Quality of Life Poststroke. J. Clin. Epidemiol. 2004, 57, 561–570. [Google Scholar] [CrossRef]
- Ring, L.; Höfer, S.; Heuston, F.; Harris, D.; O’Boyle, C.A. Response Shift Masks the Treatment Impact on Patient Reported Outcomes (PROs): The Example of Individual Quality of Life in Edentulous Patients. Health Qual. Life Outcomes 2005, 3, 55. [Google Scholar] [CrossRef]
- Postulart, D.; Adang, E.M.M. Response Shift and Adaptation in Chronically III Patients. Med. Decis. Mak. 2000, 20, 186–193. [Google Scholar] [CrossRef]
- Schwartz, C.E.; Sprangers, M.A.G. (Eds.) Adaptation to Changing Health: Response Shift in Quality-of-Life Research, 1st ed.; American Psychological Association: Washington, DC, USA, 2000; ISBN 978-1-55798-710-5. [Google Scholar]
- Schwartz, C.E.; Andresen, E.M.; Nosek, M.A.; Krahn, G.L. Response Shift Theory: Important Implications for Measuring Quality of Life in People with Disability. Arch. Phys. Med. Rehabil. 2007, 88, 529–536. [Google Scholar] [CrossRef] [PubMed]
- Terwee, C.B.; Dekker, F.W.; Wiersinga, W.M.; Prummel, M.F.; Bossuyt, P.M.M. On Assessing Responsiveness of Health-Related Quality of Life Instruments: Guidelines for Instrument Evaluation. Qual. Life Res. Int. J. Qual. Life Asp. Treat. Care Rehabil. 2003, 12, 349–362. [Google Scholar] [CrossRef] [PubMed]
- Husted, J.A.; Cook, R.J.; Farewell, V.T.; Gladman, D.D. Methods for Assessing Responsiveness: A Critical Review and Recommendations. J. Clin. Epidemiol. 2000, 53, 459–468. [Google Scholar] [CrossRef] [PubMed]
- Wilson, J.T.L.; Pettigrew, L.E.L.; Teasdale, G. Structured Interviews for the Glasgow Outcome Scale and the Extended Glasgow Outcome Scale: Guidelines for Their Use. J. Neurotrauma 1998, 15, 573–585. [Google Scholar] [CrossRef] [PubMed]
- Maas, A.I.R.; Menon, D.K.; Steyerberg, E.W.; Citerio, G.; Lecky, F.; Manley, G.T.; Hill, S.; Legrand, V.; Sorgner, A. Collaborative European NeuroTrauma Effectiveness Research in Traumatic Brain Injury (CENTER-TBI): A Prospective Longitudinal Observational Study. Neurosurgery 2015, 76, 67–80. [Google Scholar] [CrossRef]
- Steyerberg, E.W.; Wiegers, E.; Sewalt, C.; Buki, A.; Citerio, G.; De Keyser, V.; Ercole, A.; Kunzmann, K.; Lanyon, L.; Lecky, F.; et al. Case-Mix, Care Pathways, and Outcomes in Patients with Traumatic Brain Injury in CENTER-TBI: A European Prospective, Multicentre, Longitudinal, Cohort Study. Lancet Neurol. 2019, 18, 923–934. [Google Scholar] [CrossRef]
- Teasdale, G.; Jennett, B. Assessment of Coma and Impaired Consciousness. A Practical Scale. Lancet 1974, 2, 81–84. [Google Scholar] [CrossRef]
- Marmarou, A.; Lu, J.; Butcher, I.; McHugh, G.S.; Murray, G.D.; Steyerberg, E.W.; Mushkudiani, N.A.; Choi, S.; Maas, A.I.R. Prognostic Value of The Glasgow Coma Scale and Pupil Reactivity in Traumatic Brain Injury Assessed Pre-Hospital and on Enrollment: An IMPACT Analysis. J. Neurotrauma 2007, 24, 270–280. [Google Scholar] [CrossRef]
- Baker, S.P.; O’Neill, B.; Haddon, W.; Long, W.B. The Injury Severity Score: A Method for Describing Patients with Multiple Injuries and Evaluating Emergency Care. J. Trauma 1974, 14, 187–196. [Google Scholar] [CrossRef]
- Wilson, J.T.L.; Edwards, P.; Fiddes, H.; Stewart, E.; Teasdale, G.M. Reliability of Postal Questionnaires for the Glasgow Outcome Scale. J. Neurotrauma 2002, 19, 999–1005. [Google Scholar] [CrossRef]
- Rosseel, Y. Lavaan: An R Package for Structural Equation Modeling. J. Stat. Softw. 2012, 48, 1–36. [Google Scholar] [CrossRef]
- R Core Team. R: A Language and Environment for Statistical Computing; R Foundation for Statistical Computing: Vienna, Austria, 2022; Available online: https://www.R-project.org/ (accessed on 27 April 2023).
- Hu, L.; Bentler, P. Evaluating Model Fit. In Structural Equation Modeling; Hoyle, R.H., Ed.; Sage Publications: Thousand Oaks, CA, USA, 1995; pp. 76–99. ISBN 0-8039-5318-6. [Google Scholar]
- Brown, T.A. Confirmatory Factor Analysis for Applied Research, 2nd ed.; Methodology in the Social Sciences; The Guilford Press: New York, NY, USA; London, UK, 2015; ISBN 978-1-4625-1779-4. [Google Scholar]
- Hu, L.; Bentler, P.M. Cutoff Criteria for Fit Indexes in Covariance Structure Analysis: Conventional Criteria versus New Alternatives. Struct. Equ. Model. Multidiscip. J. 1999, 6, 1–55. [Google Scholar] [CrossRef]
- Liu, Y.; Millsap, R.E.; West, S.G.; Tein, J.-Y.; Tanaka, R.; Grimm, K.J. Testing Measurement Invariance in Longitudinal Data with Ordered-Categorical Measures. Psychol. Methods 2017, 22, 486–506. [Google Scholar] [CrossRef]
- Oort, F.J. Using Structural Equation Modeling to Detect Response Shifts and True Change. Qual. Life Res. Int. J. Qual. Life Asp. Treat. Care Rehabil. 2005, 14, 587–598. [Google Scholar] [CrossRef] [PubMed]
- Wu, H.; Estabrook, R. Identification of Confirmatory Factor Analysis Models of Different Levels of Invariance for Ordered Categorical Outcomes. Psychometrika 2016, 81, 1014–1045. [Google Scholar] [CrossRef] [PubMed]
- Bates, D.; Mächler, M.; Bolker, B.; Walker, S. Fitting Linear Mixed-Effects Models Using Lme4. J. Stat. Softw. 2015, 67, 48. [Google Scholar] [CrossRef]
- Van Buuren, S.; Groothuis-Oudshoorn, K. Mice: Multivariate Imputation by Chained Equations in R. J. Stat. Softw. 2011, 45, 1–67. [Google Scholar] [CrossRef]
- Robin, X.; Turck, N.; Hainard, A.; Tiberti, N.; Lisacek, F.; Sanchez, J.-C.; Müller, M. PROC: An Open-Source Package for R and S+ to Analyze and Compare ROC Curves. BMC Bioinform. 2011, 12, 77. [Google Scholar] [CrossRef]
- van der Windt, D.A.W.M.; van der Heijden, G.J.M.G.; de Winter, A.F.; Koes, B.W.; Deville, W.; Bouter, L.M. The Responsiveness of the Shoulder Disability Questionnaire. Ann. Rheum. Dis. 1998, 57, 82–87. [Google Scholar] [CrossRef]
- Kassambara, A. Rstatix: Pipe-Friendly Framework for Basic Statistical Tests. 2022. R Package Version 0.7.2. Available online: https://CRAN.R-project.org/package=rstatix (accessed on 27 April 2023).
- Cohen, J. Statistical Power Analysis for the Behavioral Sciences, 2nd ed.; L. Erlbaum Associates: Hillsdale, NJ, USA, 1988; ISBN 978-0-8058-0283-2. [Google Scholar]
- Gardner, R.C.; Cheng, J.; Ferguson, A.R.; Boylan, R.; Boscardin, J.; Zafonte, R.D.; Manley, G.T.; The Citicoline Brain Injury Treatment Trial Investigators; Zafonte, R.D.; Bagiella, E.; et al. Divergent Six Month Functional Recovery Trajectories and Predictors after Traumatic Brain Injury: Novel Insights from the Citicoline Brain Injury Treatment Trial Study. J. Neurotrauma 2019, 36, 2521–2532. [Google Scholar] [CrossRef]
- Losoi, H.; Silverberg, N.D.; Wäljas, M.; Turunen, S.; Rosti-Otajärvi, E.; Helminen, M.; Luoto, T.M.; Julkunen, J.; Öhman, J.; Iverson, G.L. Recovery from Mild Traumatic Brain Injury in Previously Healthy Adults. J. Neurotrauma 2016, 33, 766–776. [Google Scholar] [CrossRef] [PubMed]
- Vedantam, A.; Robertson, C.S.; Gopinath, S.P. Clinical Characteristics and Temporal Profile of Recovery in Patients with Favorable Outcomes at 6 Months after Severe Traumatic Brain Injury. J. Neurosurg. 2018, 129, 234–240. [Google Scholar] [CrossRef] [PubMed]
- McCrea, M.A.; Giacino, J.T.; Barber, J.; Temkin, N.R.; Nelson, L.D.; Levin, H.S.; Dikmen, S.; Stein, M.; Bodien, Y.G.; Boase, K.; et al. Functional Outcomes Over the First Year After Moderate to Severe Traumatic Brain Injury in the Prospective, Longitudinal TRACK-TBI Study. JAMA Neurol. 2021, 78, 982. [Google Scholar] [CrossRef] [PubMed]
- Cassidy, J.D.; Boyle, E.; Carroll, L.J. Population-Based, Inception Cohort Study of the Incidence, Course, and Prognosis of Mild Traumatic Brain Injury After Motor Vehicle Collisions. Arch. Phys. Med. Rehabil. 2014, 95, S278–S285. [Google Scholar] [CrossRef] [PubMed]
- von Steinbuechel, N.; Real, R.G.L.; Sasse, N.; Wilson, L.; Otto, C.; Mullins, R.; Behr, R.; Deinsberger, W.; Martinez-Olivera, R.; Puschendorf, W.; et al. German Validation of Quality of Life after Brain Injury (QOLIBRI) Assessment and Associated Factors. PLoS ONE 2017, 12, e0176668. [Google Scholar] [CrossRef]
- Wilson, L.; Marsden-Loftus, I.; Koskinen, S.; Bakx, W.; Bullinger, M.; Formisano, R.; Maas, A.; Neugebauer, E.; Powell, J.; Sarajuuri, J.; et al. Interpreting Quality of Life after Brain Injury Scores: Cross-Walk with the Short Form-36. J. Neurotrauma 2017, 34, 59–65. [Google Scholar] [CrossRef]
- von Steinbuechel, N.; Hahm, S.; Muehlan, H.; Arango-Lasprilla, J.C.; Bockhop, F.; Covic, A.; Schmidt, S.; Steyerberg, E.W.; Maas, A.I.R.; Menon, D.; et al. Impact of Sociodemographic, Premorbid, and Injury-Related Factors on Patient-Reported Outcome Trajectories after Traumatic Brain Injury (TBI). J. Clin. Med. 2023, 12, 2246. [Google Scholar] [CrossRef]
- Williams, M.W.; Rapport, L.J.; Millis, S.R.; Hanks, R.A. Psychosocial Outcomes after Traumatic Brain Injury: Life Satisfaction, Community Integration, and Distress. Rehabil. Psychol. 2014, 59, 298–305. [Google Scholar] [CrossRef]
- Andelic, N.; Røe, C.; Tenovuo, O.; Azouvi, P.; Dawes, H.; Majdan, M.; Ranta, J.; Howe, E.I.; Wiegers, E.J.A.; Tverdal, C.; et al. Unmet Rehabilitation Needs after Traumatic Brain Injury across Europe: Results from the CENTER-TBI Study. J. Clin. Med. 2021, 10, 1035. [Google Scholar] [CrossRef]
- Howe, E.I.; Zeldovich, M.; Andelic, N.; von Steinbuechel, N.; Fure, S.C.R.; Borgen, I.M.H.; Forslund, M.V.; Hellstrøm, T.; Søberg, H.L.; Sveen, U.; et al. Rehabilitation and Outcomes after Complicated vs. Uncomplicated Mild TBI: Results from the CENTER-TBI Study. BMC Health Serv. Res. 2022, 22, 1536. [Google Scholar] [CrossRef]
- Born, K.; Amsler, F.; Gross, T. Prospective Evaluation of the Quality of Life after Brain Injury (QOLIBRI) Score: Minor Differences in Patients with Major versus No or Mild Traumatic Brain Injury at One-Year Follow Up. Health Qual. Life Outcomes 2018, 16, 136. [Google Scholar] [CrossRef] [PubMed]
- Tulsky, D.S.; Kisala, P.A.; Victorson, D.; Carlozzi, N.; Bushnik, T.; Sherer, M.; Choi, S.W.; Heinemann, A.W.; Chiaravalloti, N.; Sander, A.M.; et al. TBI-QOL: Development and Calibration of Item Banks to Measure Patient Reported Outcomes Following Traumatic Brain Injury. J. Head Trauma Rehabil. 2016, 31, 40–51. [Google Scholar] [CrossRef] [PubMed]
- McCullagh, S. Outcome after Mild Traumatic Brain Injury: An Examination of Recruitment Bias. J. Neurol. Neurosurg. Psychiatry 2003, 74, 39–43. [Google Scholar] [CrossRef] [PubMed][Green Version]


| Included in the Study Sample | ||||
|---|---|---|---|---|
| Value/Group | Yes (n = 1659) | No (n = 2850) | p | |
| Age | M (SD) | 49.61 (19.15) | 48.59 (22.45) | 0.219 |
| Sex | Male | 1077 (64.92%) | 1946 (68.28%) | 0.022 |
| Female | 582 (35.08%) | 904 (31.72%) | ||
| Marital status | Partnered | 889 (53.59%) | 1181 (41.44%) | <0.001 |
| Single | 767 (46.23%) | 1647 (57.79%) | ||
| Missing | 3 (0.18%) | 22 (0.77%) | ||
| Education level | At least secondary/high school | 547 (32.97%) | 832 (29.19%) | <0.001 |
| College/university | 464 (27.97%) | 386 (13.54%) | ||
| None/primary school | 207 (12.48%) | 434 (15.23%) | ||
| Post-high school training | 293 (17.66%) | 403 (14.14%) | ||
| Missing | 148 (8.92%) | 795 (27.90%) | ||
| Employment status | Full-time employed | 718 (43.28%) | 867 (30.42%) | <0.001 |
| In training | 154 (9.28%) | 332 (11.65%) | ||
| Part-time employed | 196 (11.82%) | 195 (6.84%) | ||
| Retired | 389 (23.45%) | 723 (25.37%) | ||
| Unemployed | 123 (7.41%) | 283 (9.93%) | ||
| Missing | 79 (4.76%) | 450 (15.79%) | ||
| TBI severity (Glasgow Coma Scale; GCS) | Uncomplicated mild | 546 (32.91%) | 729 (25.58%) | <0.001 |
| Complicated mild | 501 (30.20%) | 563 (19.75%) | ||
| Moderate | 113 (6.81%) | 276 (9.68%) | ||
| Severe | 236 (14.23%) | 750 (26.32%) | ||
| Missing | 263 (15.85%) | 532 (18.67%) | ||
| Injury severity score (ISS) | M (SD) | 18.04 (14.85) | 22.72 (17.79) | <0.001 |
| Functional status change (Glasgow Outcome Scale–Extended; GOSE) | Improved | 516 (31.10%) | 494 (17.33%) | <0.001 |
| Stable | 918 (55.34%) | 1521 (53.37%) | ||
| Worsened | 225 (13.56%) | 113 (3.97%) | ||
| Missing | 0 (0%) | 722 (25.33%) | ||
| Cause of injury | Fall | 715 (43.10%) | 1309 (45.93%) | <0.001 |
| Road traffic accident | 692 (41.71%)) | 990 (34.74%) | ||
| Violent/other | 251 (15.13%) | 532 (18.67%) | ||
| Missing | 1 (0.06%) | 19 (0.66%) | ||
| Clinical care pathways | ER | 383 (23.09%) | 465 (16.32%) | <0.001 |
| Admission | 640 (38.58%) | 883 (30.98%) | ||
| ICU | 636 (38.34%) | 1502 (52.70%) | ||
| Length of hospital stay (in days) | M (SD) | 10.56 (18.18) | 13.30 (22.60) | <0.001 |
| Missing | 29 (1.75%) | 89 (3.12%) | ||
| Confirmatory Factor Analysis | χ2 Difference Test | |||||
|---|---|---|---|---|---|---|
| Model | χ2 | CFI | RMSEA [CI90%] | SRMR | ∆χ2 (∆df) | p |
| 3 months post-injury | ||||||
| One Factor | 15,281.52 (629) | 0.821 | 0.130 [0.128; 0.131] | 0.096 | - | - |
| Two Factor | 10,939.70 (628) | 0.874 | 0.109 [0.107; 0.111] | 0.078 | 460.77 (1) | <0.001 |
| Six Factor | 4121.54 (614) | 0.954 | 0.064 [0.062; 0.066] | 0.041 | 1766.03 (14) | <0.001 |
| Two Level | 4532.72 (623) | 0.949 | 0.067 [0.065; 0.069] | 0.052 | 251.92 (9) | <0.001 |
| 6 months post-injury | ||||||
| One Factor | 14,024.43 (629) | 0.842 | 0.124 [0.122; 0.126] | 0.086 | - | - |
| Two Factor | 10,358.82 (628) | 0.885 | 0.106 [0.104; 0.107] | 0.070 | 414.20 (1) | <0.001 |
| Six Factor | 3775.89 (614) | 0.963 | 0.061 [0.059; 0.063] | 0.037 | 1854.56 (14) | <0.001 |
| Two Level | 4153.73 (623) | 0.958 | 0.064 [0.062; 0.066] | 0.047 | 229.28 (9) | <0.001 |
| Measurement Invariance Analysis | χ2 Difference Test | |||||
|---|---|---|---|---|---|---|
| Model | χ2 (df) | CFI | RSMEA [CI90%] | SRMR | ∆χ2 (∆df) | p |
| Cognition | ||||||
| Configural | 594.04 (69) | 0.988 | 0.074 [0.069; 0.080] | 0.027 | - | - |
| Loading | 598.08 (75) | 0.988 | 0.071 [0.066; 0.076] | 0.027 | 3.34 (6) | 0.766 |
| Threshold | 577.46 (95) | 0.989 | 0.060 [0.056; 0.065] | 0.027 | 14.50 (20) | 0.804 |
| Residual | 545.55 (102) | 0.990 | 0.056 [0.051; 0.061] | 0.028 | 27.26 (7) | <0.001 |
| Self | ||||||
| Configural | 1357.32 (69) | 0.971 | 0.116 [0.111; 0.121] | 0.039 | - | - |
| Loading | 1372.96 (75) | 0.971 | 0.112 [0.106; 0.117] | 0.039 | 5.63 (6) | 0.466 |
| Threshold | 1397.01 (95) | 0.972 | 0.099 [0.095; 0.104] | 0.039 | 31.11 (20) | 0.054 |
| Residual | 1260.64 (102) | 0.980 | 0.090 [0.086; 0.095] | 0.040 | 20.41 (7) | 0.005 |
| Daily Life & Autonomy | ||||||
| Configural | 558.81 (69) | 0.988 | 0.071 [0.066; 0.077] | 0.027 | - | - |
| Loading | 565.64 (75) | 0.988 | 0.069 [0.063; 0.074] | 0.027 | 6.69 (6) | 0.350 |
| Threshold | 592.84 (95) | 0.989 | 0.061 [0.057; 0.066] | 0.027 | 33.41 (20) | 0.030 |
| Residual * | - | - | - | - | - | - |
| Social Relationships | ||||||
| Configural | 718.35 (47) | 0.971 | 0.101 [0.095; 0.108] | 0.039 | - | - |
| Loading | 736.49 (52) | 0.971 | 0.097 [0.091; 0.104] | 0.039 | 7.06 (5) | 0.216 |
| Threshold | 728.63 (68) | 0.972 | 0.084 [0.078; 0.089] | 0.039 | 31.13 (16) | 0.010 |
| Residual * | - | - | - | - | - | - |
| Emotions | ||||||
| Configural | 196.23 (29) | 0.988 | 0.064 [0.056; 0.073] | 0.024 | - | - |
| Loading | 198.94 (33) | 0.988 | 0.060 [0.052; 0.068] | 0.024 | 3.74 (4) | 0.443 |
| Threshold | 195.40 (47) | 0.989 | 0.048 [0.041; 0.055] | 0.024 | 13.02 (14) | 0.525 |
| Residual | 200.39 (52) | 0.990 | 0.045 [0.039; 0.052] | 0.025 | 15.10 (5) | 0.010 |
| Physical Problems | ||||||
| Configural | 228.77 (29) | 0.988 | 0.070 [0.062; 0.079] | 0.035 | - | - |
| Loading | 228.48 (33) | 0.988 | 0.065 [0.057; 0.073] | 0.034 | 3.86 (4) | 0.426 |
| Threshold | 259.25 (47) | 0.989 | 0.057 [0.050; 0.064] | 0.035 | 30.04 (14) | 0.008 |
| Residual * | - | - | - | - | - | - |
| Scale | Predictor | B (SE) | b | t | p |
|---|---|---|---|---|---|
| Total | GOSE (linear) | 4.129 (0.680) | 0.344 | 6.073 | <0.001 |
| GOSE (quadratic) | 0.223 (0.511) | 0.019 | 0.436 | 0.663 | |
| Cognition * | GOSE (linear) | 3.365 (0.904) | 0.213 | 3.722 | <0.001 |
| GOSE (quadratic) | −0.758 (0.680) | −0.048 | −1.114 | 0.265 | |
| Self * | GOSE (linear) | 4.725 (0.932) | 0.289 | 5.070 | <0.001 |
| GOSE (quadratic) | −0.223 (0.701) | −0.014 | −0.318 | 0.750 | |
| Daily Life & Autonomy * | GOSE (linear) | 6.384 (0.977) | 0.365 | 6.536 | <0.001 |
| GOSE (quadratic) | 1.204 (0.735) | 0.069 | 1.639 | 0.102 | |
| Social Relationships * | GOSE (linear) | 2.646 (0.900) | 0.168 | 2.942 | 0.003 |
| GOSE (quadratic) | 0.035 (0.676) | 0.002 | 0.051 | 0.959 | |
| Emotions * | GOSE (linear) | 2.985 (1.177) | 0.145 | 2.536 | 0.011 |
| GOSE (quadratic) | 0.259 (0.886) | 0.013 | 0.293 | 0.770 | |
| Physical Problems * | GOSE (linear) | 3.960 (1.024) | 0.219 | 3.866 | <0.001 |
| GOSE (quadratic) | 1.207 (0.771) | 0.067 | 1.565 | 0.118 |
Disclaimer/Publisher’s Note: The statements, opinions and data contained in all publications are solely those of the individual author(s) and contributor(s) and not of MDPI and/or the editor(s). MDPI and/or the editor(s) disclaim responsibility for any injury to people or property resulting from any ideas, methods, instructions or products referred to in the content. |
© 2023 by the authors. Licensee MDPI, Basel, Switzerland. This article is an open access article distributed under the terms and conditions of the Creative Commons Attribution (CC BY) license (https://creativecommons.org/licenses/by/4.0/).
Share and Cite
Zeldovich, M.; Hahm, S.; Mueller, I.; Krenz, U.; Bockhop, F.; von Steinbuechel, N.; the CENTER-TBI Participants and Investigators. Longitudinal Internal Validity of the Quality of Life after Brain Injury: Response Shift and Responsiveness. J. Clin. Med. 2023, 12, 3197. https://doi.org/10.3390/jcm12093197
Zeldovich M, Hahm S, Mueller I, Krenz U, Bockhop F, von Steinbuechel N, the CENTER-TBI Participants and Investigators. Longitudinal Internal Validity of the Quality of Life after Brain Injury: Response Shift and Responsiveness. Journal of Clinical Medicine. 2023; 12(9):3197. https://doi.org/10.3390/jcm12093197
Chicago/Turabian StyleZeldovich, Marina, Stefanie Hahm, Isabelle Mueller, Ugne Krenz, Fabian Bockhop, Nicole von Steinbuechel, and the CENTER-TBI Participants and Investigators. 2023. "Longitudinal Internal Validity of the Quality of Life after Brain Injury: Response Shift and Responsiveness" Journal of Clinical Medicine 12, no. 9: 3197. https://doi.org/10.3390/jcm12093197
APA StyleZeldovich, M., Hahm, S., Mueller, I., Krenz, U., Bockhop, F., von Steinbuechel, N., & the CENTER-TBI Participants and Investigators. (2023). Longitudinal Internal Validity of the Quality of Life after Brain Injury: Response Shift and Responsiveness. Journal of Clinical Medicine, 12(9), 3197. https://doi.org/10.3390/jcm12093197