Article

Dysnatremia in COVID-19 Patients—An Analysis of the COLOS Study

by
Anna Królicka
1,
Krzysztof Letachowicz
2,*,
Barbara Adamik
3,
Adrian Doroszko
4,
Krzysztof Kaliszewski
5,
Katarzyna Kiliś-Pstrusińska
6,
Krzysztof Kujawa
7,
Agnieszka Matera-Witkiewicz
8,
Marcin Madziarski
9,
Michał Pomorski
10,
Marcin Protasiewicz
11,
Janusz Sokołowski
12,
Małgorzata Trocha
13,
Ewa Anita Jankowska
14,† and
Katarzyna Madziarska
2,†
1
Faculty of Medicine, Wroclaw Medical University, Borowska Street 213, 50-556 Wroclaw, Poland
2
Clinical Department of Nephrology and Transplantation Medicine, Wroclaw Medical University, Borowska Street 213, 50-556 Wroclaw, Poland
3
Clinical Department of Anaesthesiology and Intensive Therapy, Wroclaw Medical University, Borowska Street 213, 50-556 Wroclaw, Poland
4
Clinical Department of Internal and Occupational Diseases, Hypertension and Clinical Oncology, Wroclaw Medical University, Borowska 213, 50-556 Wroclaw, Poland
5
Clinical Department of General, Minimally Invasive and Endocrine Surgery, Wroclaw Medical University, Borowska Street 213, 50-556 Wroclaw, Poland
6
Clinical Department of Pediatric Nephrology, Wroclaw Medical University, Borowska Street 213, 50-556 Wroclaw, Poland
7
Statistical Analysis Centre, Wroclaw Medical University, K. Marcinkowski Street 2-6, 50-368 Wroclaw, Poland
8
Screening of Biological Activity Assays and Collection of Biological Material Laboratory, Wroclaw Medical University Biobank, Wroclaw Medical University, Borowska Street 211A, 50-556 Wroclaw, Poland
9
Clinical Department of Rheumatology and Internal Medicine, University Hospital, Borowska Street 213, 50-556 Wroclaw, Poland
10
Clinical Department of Gynecology and Obstetrics, Wroclaw Medical University, Borowska Street 213, 50-556 Wroclaw, Poland
11
Clinical Department of Cardiology, Wroclaw Medical University, Borowska Street 213, 50-556 Wroclaw, Poland
12
Clinical Department of Emergency Medicine, Wroclaw Medical University, Borowska Street 213, 50-556 Wroclaw, Poland
13
Department of Pharmacology, Wroclaw Medical University, Mikulicz-Radecki Street 2, 50-345 Wroclaw, Poland
14
Institute of Heart Diseases, University Hospital, Borowska Street 213, 50-556 Wroclaw, Poland
*
Author to whom correspondence should be addressed.
These authors contributed equally to this study.
J. Clin. Med. 2023, 12(8), 2802; https://doi.org/10.3390/jcm12082802
Submission received: 17 February 2023 / Revised: 31 March 2023 / Accepted: 5 April 2023 / Published: 10 April 2023
(This article belongs to the Section Hematology)

Abstract

:
Background: Sodium imbalance is one of the most common electrolyte disturbances encountered in the medical practice, and it may present with either hyponatremia or hypernatremia. Both sodium abnormalities are related with unfavorable outcomes. Objective: Elucidation of the prevalence of dysnatremia among COVID-19 patients and its impact on 30- and 90-day mortality and need for ICU admission was the goal. Design and participants: A single-center, retrospective, observational study was conducted. A total of 2026 adult, SARS-CoV-2 positive patients, admitted to Wroclaw University Hospital between 02.2020 and 06.2021, were included. On admission, patients were divided into groups: normonatremic (N), hyponatremic (L), and hypernatremic (H). Acquired data was processed, and Cox hazards regression and logistic regression were implemented. Key results: Hyponatremia on admission occurred in 17.47% (n = 354) of patients and hypernatremia occurred in 5.03% (n = 102). Dysnatremic patients presented with more comorbidities, used more drugs, and were statistically more often admitted to the ICU. Level of consciousness was the strongest predictor of ICU admission (OR = 1.21, CI: 1.16–1.27, p < 0.001). Thirty-day mortality was significantly higher in both the L and H groups (28.52%, p = 0.0001 and 47.95%, p < 0.0001, respectively), in comparison to 17.67% in the N group. Ninety-day mortality showed a similar trend in all study groups: 34.37% in the L group (p = 0.0001), 60.27% (p < 0.0001) in the H group, and 23.32% in the N group. In multivariable analyses, hypo- and hypernatremia were found to be independent predictors of 30- and 90-day mortality. Conclusions: Both hypo- and hypernatremia are strong predictors of mortality and disease severity in COVID-19 patients. Extraordinary care should be taken when dealing with hypernatremic, COVID-positive patients, as this group exhibits the highest mortality rates.

1. Introduction

Sodium imbalance is one of the most common electrolyte disturbances encountered in the medical practice and may present with either hyponatremia or hypernatremia. Hyponatremia is defined as serum sodium below 135 mEq/L. The etiology of hyponatremia often remains unclear. Apart from systemic disorders, it has been observed in a variety of infectious diseases. Studies show that hyponatremia is associated with prolonged length of in-hospital stay, higher risk of hospital readmission, significantly higher mean hospital cost, and higher in-hospital as well as overall mortality. Moreover, it has been proved that correction of previously lowered serum sodium could reduce the length of hospital stay, costs, and all-cause mortality risk [1]. Hypernatremia is defined as serum sodium above 145 mmol/L. The most common causes of hypernatremia are loss of pure water and/or hypotonic fluids, excessive salt intake, and hypodipsia [2]. Hypernatremia in the ICU is associated with poorer outcomes, including greater mortality and prolonged in-hospital stays [3]. Correction of sodium level, slow as well as rapid, is associated with better clinical outcomes [4]. The aim of this study was to assess the prevalence of dysnatremia among COVID-19 patients and to elucidate its impact on patients’ outcomes.

2. Materials and Methods

2.1. Study Design

A single-center, retrospective, observational study was carried out. A total of 2026 patients who were at least 18 years old, had a laboratory-confirmed SARS-CoV-2, and were admitted to any of hospital wards including the emergency department between February 2020 and June 2021, were included. The study protocol for the COLOS (COronavirus in the LOwer Silesia registry) study has been approved by the Institutional Review Board and Ethics Committee at the Wroclaw Medical University, Wroclaw, Poland (No.: KB-444/2021). The Bioethics Committee approved the publication of fully anonymized data. Written informed consent to participate in the study was waived. Dysnatremia was defined as serum sodium below 135 mmol/L (hyponatremia) or above 145 mmol/L (hypernatremia). The COVID-19 disease was diagnosed using RT-PCR assay of a specimen collected via nasopharyngeal swab.
The patients were divided into three groups, depending on natremia on admission: normonatremic (N group), hyponatremic (L group) and hypernatremic (H group).

2.2. Data Collection

The dataset was obtained from patients’ charts and included demographics, comorbidities, procedures, vital signs, and laboratory measurements during hospitalization. In this study, the following variables were included: age, gender, heart rate (HR) and blood pressure, consciousness (a zero-one classification: preserved/impaired consciousness as part of triage of patients), as well as comorbidities, namely hypertension, history of myocardial infarction, history of stroke, diabetes mellitus (DM), chronic kidney disease (CKD), heart failure (HF), chronic obstructive pulmonary disease (COPD) or asthma, peripheral occlusive arterial disease (POAD), history of stroke or transient ischemic attack (TIA), and history of neoplastic disorder. Laboratory measurements were also considered, namely white blood cell (WBC) and platelet counts, hemoglobin, creatinine, C-reactive protein (CRP), and sodium concentrations, along with preadmission treatment, including angiotensin converting enzyme inhibitors (ACEIs), aldosterone receptor blockers (ARBs), beta-blockers, calcium blockers, mineral receptor antagonists (MRAs), diuretics, statins, acetylsalicylic acid (ASA), anticoagulants, steroids, or immunosuppressants. Procedures performed during hospitalization, such as ICU admission, respiratory support, use of catecholamine, intravenous (IV) loop diuretic, start of renal replacement therapy (RRT), steroids, and antibiotics were also considered. Cardiovascular disease was defined as HF, PAOD, and a history of myocardial infarction or stroke.

2.3. Follow Up and Outcomes

The follow–up period started from the day of admission and ended on the day of discharge or death. The entire hospitalization was analyzed. Further information regarding the patients’ deaths was collected after 90 days after the admission. Primary outcomes were 30-day and 90-day mortality. Secondary outcomes were the need for respiratory support, use of catechol amines, ICU admission, use of steroids, use of antibiotics, use of IV loop diuretics, and need for RRT.

2.4. Statistical Analysis

Data was presented either using the mean with SD, median with IQR, or with frequencies and percentages. Due to the large sample size, the normal data distribution was not checked. Instead, the between-group differences in the variance were verified with the use of the Brown–Forsythe test. Quantitative variables were tested by the analysis of variance (ANOVA or Welch’s ANOVA for equal and unequal variances, respectively), and Tukey’s post hoc test. The differences in occurrence frequency (for qualitative variables) were tested by the chi-square test. The p-value of <0.05 was considered significant. In each patient group (N, L, H) a univariate and multivariate analysis was carried out. Variables with a p < 0.05 in the univariate analysis were entered into the regression model. In each of the N, L, and H groups, 3 regression models were tested: logistic regression considering the prediction of sodium levels, Cox regression for recognizing survival predictors (30-day and 90-day), and logistic regression for assessing the significance of the predictors on the need for treatment in the ICU. In the multivariate logistic regression, the best subset selection model was performed with the use of the MuMIn R-package (Bartoń 2020). The models have been ranked with the use of the Akaike information criterion (AIC), and the best models were averaged according to Akaike weights.
For survival analyses, we generated Kaplan–Meier curves, the comparison of which was performed using the log-rank test. For the control of the Type I error, the Bonferroni correction was applied to the p-values of log-rank test results. The significance of the survival time predictors was estimated using the Cox regression. Statistical analysis was performed with the use of the Statistica (Tibco Software Inc., Palo Alto, CA, USA, 2017) and R package “MuMIn” (Bartoń 2020) run in the R environment v. 4.1.2 (R Core Team 2021).

3. Results

3.1. Patient Characteristics

Patient characteristics alongside with a comparison of the N, L, and H patient groups are presented in Table 1. Median age of all patients was 65 (IQR: 48.0–74.0), while 50.4% were male and 49.6% were female. On admission, 17.47% of patients were hyponatremic and 5.03% were hypernatremic. Mean sodium level equaled 130.39 ± 5.27 in the L group, 150.14 ± 5.45 in the H group, and 139.04 ± 2.55 in the N group. Among vital signs, SBP was statistically lower in the H group than in the N and L groups (121.13 ± 26.72 vs. 132.33 ± 22.46 p = 0.0000 and 134.28 ± 23.13. p = 0.0000, respectively). Dysnatremic patients had more comorbidities than normonatremic patients. They suffered more often from hypertension, HF, DM and had myocardial infarction histories (Table 1). Long-term use of drugs was also more common among dysnatremic patients, with statistical difference considering ARNI/ARB/ACEI, beta-blocker, diuretic, and anticoagulant use. Among laboratory findings, dysnatremic patients had significantly higher creatinine and CRP values on admission (Table 1).
Among all 2026 patients, 212 (10.5%) were admitted to the ICU, 383 (18.9%) needed respiratory support, 217 (10.7%) needed vasopressors, 333 (16.4%) needed IV loop diuretics, and in 72 (3.6%) of the cases RRT had to be started. Steroids were used for 1090 patients (53.8%), and antibiotics for 1229 (60.7%) patients. Dysnatremic patients were statistically more often admitted to the ICU, with 13.0% in the L group and 21.6% in the H group vs. 9.2% in the N group. p = 0.0001. They also needed respiratory support more often, with 21.3% in the L group and 34.3% in the H group vs. 17.4% in the N group, p = 0.0001. IV loop diuretics were used more commonly in the L and H groups, in comparison to the N group, with 20.3% and 31.4% of patients vs. 14.65 p = 0.0000, respectively. RRT was started more frequently in dysnatremic patients, with 14.8% in the L group and 9.8% in the H group vs. 2.9% in the N group, p = 0.0005.

3.2. Univariate Analyses

Univariate analyses were carried out in the hyponatremic and hypernatremic groups, considering mortality predictors and predictors of sodium levels, as well as ICU admission predictors. The results of these analyses are presented in Table 2, Table 3 and Table 4.

3.3. Kaplan-Meyer Curve

Thirty-day mortality equaled 28.52% in the L group and 47.95% in the H group, compared to 17.67% in the N group, p = 0.00036 and p = 0.0000, respectively (Figure 1). Ninety-day mortality equaled 34.37% in the L group, 60.27% in the H group, and 23.32% in the N patients, p = 0.00045 and p = 0.0000, respectively (Figure 1).

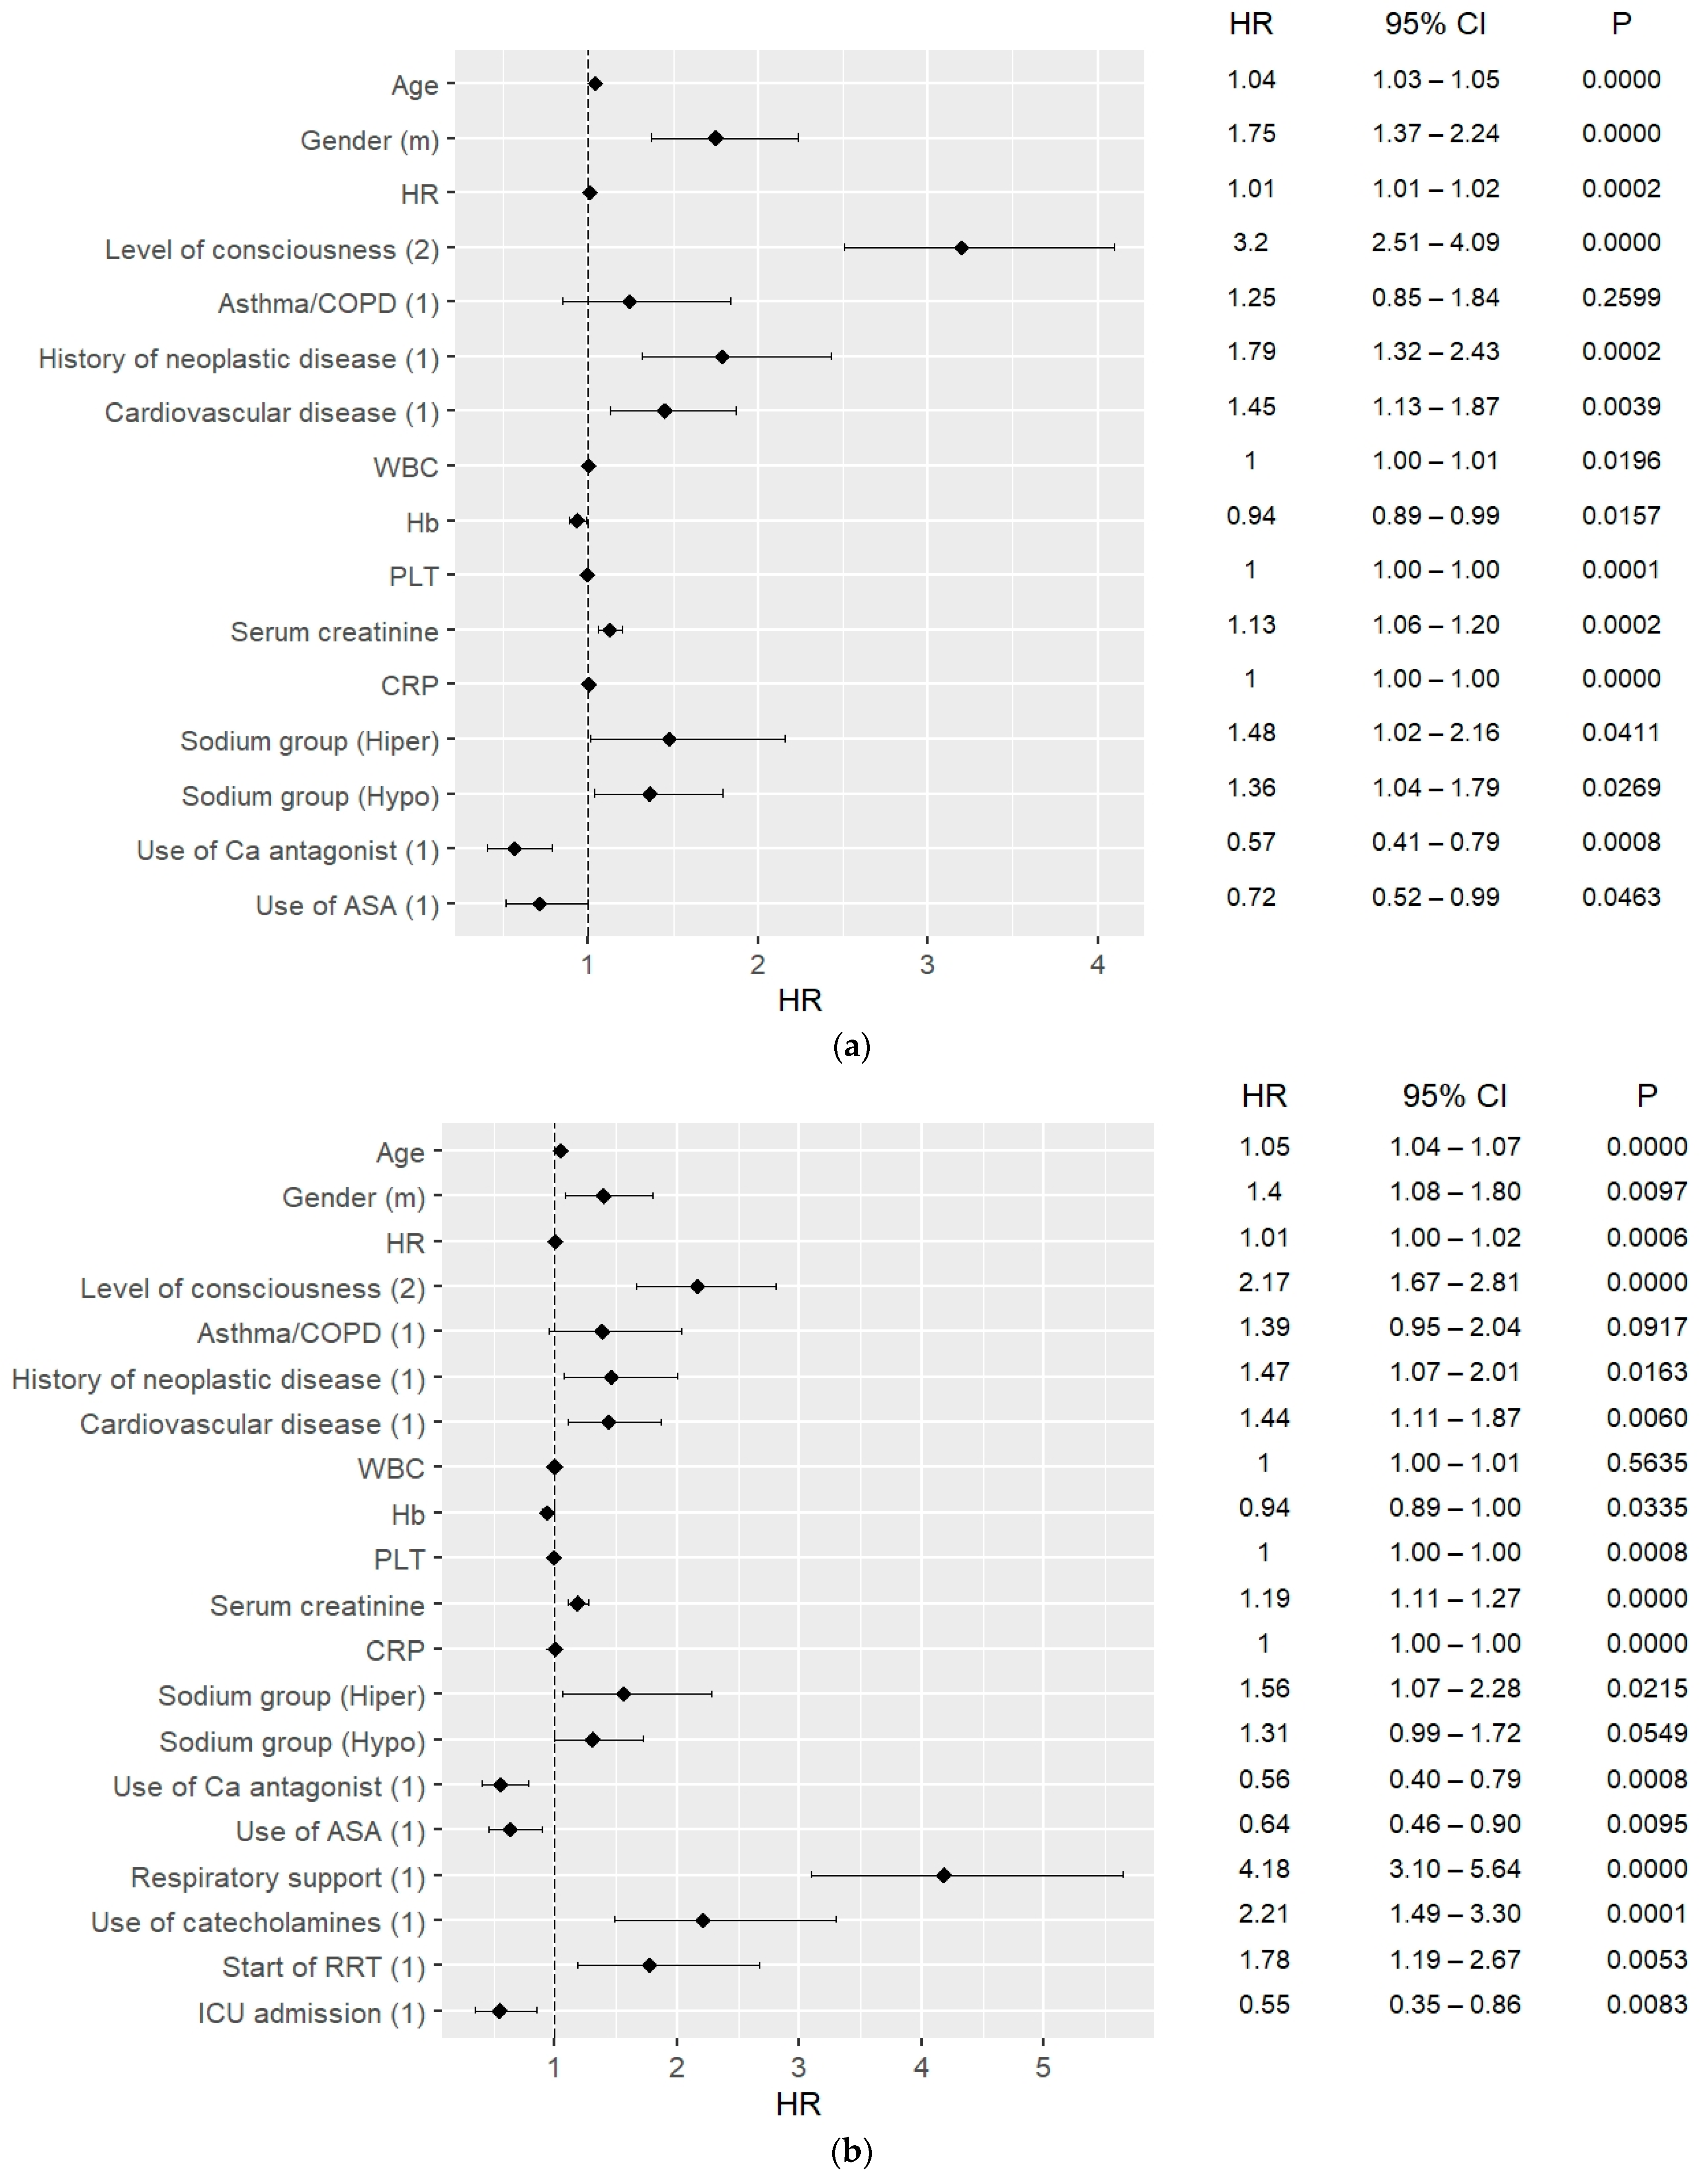
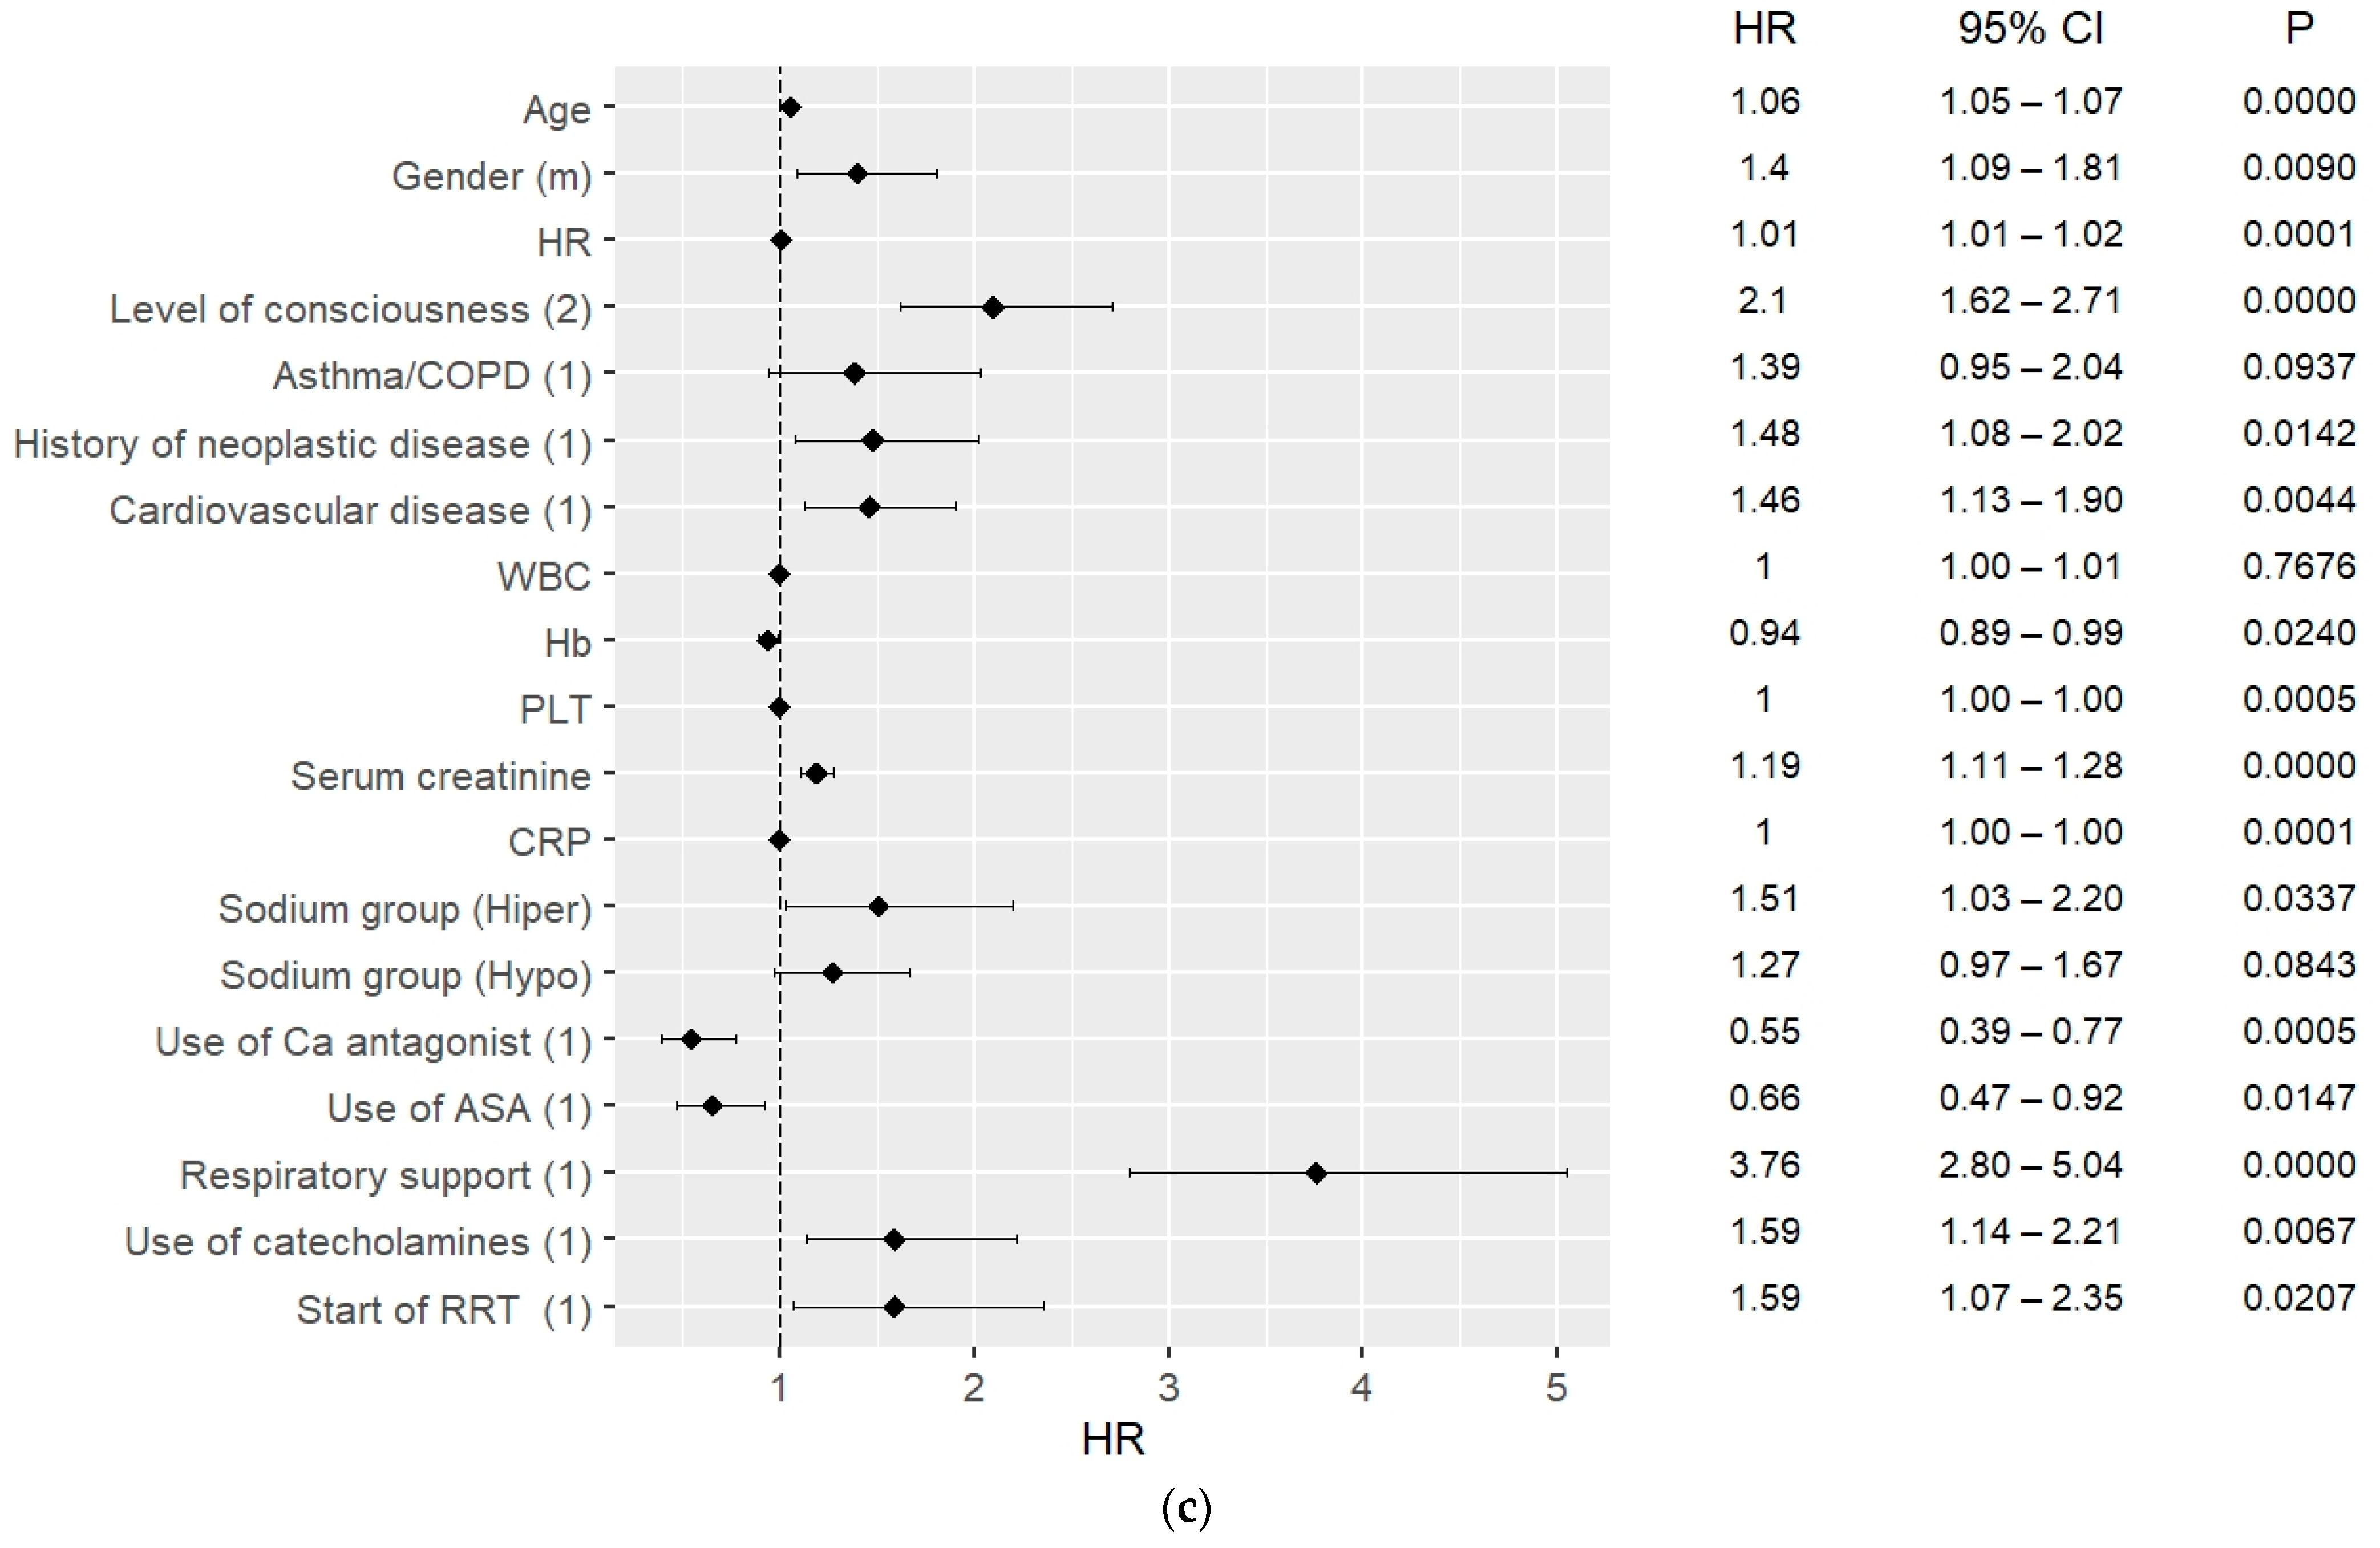
3.4. 30-Day and 90-Day Mortality Predictors

The results of the multivariate Cox hazard analysis are presented in Figure 2a–c and Figure 3a–c. The analysis was carried out considering 30-day and 90-day mortality, and when including ICU admission and excluding ICU admission.
Hypernatremia was a strong mortality predictor for both 30-day and 90-day mortality, including for ICU patients as well as outside the ICU. For the 30-day mortality, HR = 1.58, CI: 1.13–2.21, p = 0.0070 excluding ICU and HR = 1.60, CI: 1.14–2.24, p = 0.006 including ICU admissions; for the 90-day mortality, HR = 1.55; CI: 1.11–2.24 p = 0.0100 excluding ICU admission, and HR = 1.61; CI: 1.15–2.25 p = 0.0050 including ICU admissions. Moreover, hyponatremia on admission could predict 30-day mortality with HR = 1.30, CI: 1.02–1.66, p = 0.037.
One of the strongest predictors for both 30- and 90-day mortality was the need for respiratory support, both considering ICU hospitalizations and non-ICU patients. For the 30-day mortality, the need for respiratory support could predict mortality with HR = 3.09, CI: 2.36–4.03, p < 0.0010 excluding ICU patients and HR = 3.44, CI: 2.62–4.52, p < 0.0010 including ICU patients. For the 90-day mortality, the need for respiratory support could predict mortality with similar values, including as well as excluding ICU patients (Figure 3a,b). Other strong mortality predictors among in-hospital procedures were the use of catecholamines for the 30- and 90-day mortality and start of RRT for the 90-day mortality (Figure 2a–c and Figure 3a–c). ICU admission could predict survival in both 30-day and 90-day analyses, with HR = 0.5, CI: 0.34–0.78, p = 0.002 for both.
In the analysis of vital signs, DBP, HR, and level of consciousness were found to be factors predicting mortality, the strongest one being the level of consciousness, with HR = 2.11, CI: 1.68–2.64, p < 0.0010 for 30-day mortality outside the ICU.
Considering the comorbidities, the strongest mortality predictor of them was CVD (HR = 2.62, CI: 2.10–3.28, p = 0.0000, HR = 2.67; CI: 2.19–3.26, p = 0.0000). Furthermore, history of neoplastic disorder had the ability to predict 90-day mortality with HR = 1.91, CI: 1.46–2.50, p < 0.001. Diagnosis of asthma/COPD could predict 90-day mortality including ICU admissions with HR = 1.46, CI: 1.05–2.02, p = 0.023.
Considering long-term use of drugs, the use of calcium blockers and ASA were mortality predictors in all analyses with HR = 0.69, CI: 0.53–0.91, p = 0.009, and HR = 0.66, CI: 0.49–0.88, p = 0.004 for 30-day mortality, respectively.
Some of the laboratory findings which were analyzed were also found to predict 30-day and 90-day mortality. These were platelets (HR = 1.00; CI: 1.00–1.00 p < 0.001), CRP (HR = 1.00; CI: 1.00–1.00 p < 0.001), and creatinine (HR = 1.18; CI: 1.12–1.25 p < 0.001) for 30-day mortality. WBC level on admission was also a 30-day mortality predictor (HR = 1.01; CI: 1.00–1.01 p = 0.015). The level of hemoglobin was found to predict 30-day mortality with HR = 0.92, CI: 0.88–0.97, p < 0.0010 including ICU admissions, HR = 0.93, CI: 0.89–0.97, p = 0.0010 excluding ICU admissions, and 90-day mortality with similar values (Figure 3b,c).

3.5. ICU Admission Predictors

Univariate and multivariate analysis of predictors of ICU admission are presented in Table 3. Among the vital signs, level of consciousness was the strongest predictor of ICU admission (OR = 1.2050, CI: 1.1558–1.2564, p = 0.0000). WBC and CRP concentration were also able to predict ICU admission, with OR = 1.0037, CI: 1.0024–1.0050, p = 0.0000 and OR = 1.0005, CI: 1.0003–1.0007, p = 0.0000, respectively.

3.6. Possible Dysnatremia Predictors

The results of the multivariate analysis revealed possible predictors of hyponatremia and hypernatremia, which are presented in Table 5. Low sodium level was strongly associated with diagnosis of DM and intake of ACEI/ARB/ARNI, with OR = 1.40, CI: 1.02–1.93, p = 0.0376 and OR = 1.52, CI: 1.08–2.15, p = 0.0170, respectively. Impaired consciousness was very strongly correlated with hypernatremia, with OR = 8.54, CI: 4.83–15.09, p = 0.0000, alongside SBP and CRP (Table 5).

4. Discussion

Our analysis of 2026 COVID-19 positive patients, admitted to the Wroclaw University Hospital, revealed that sodium imbalance is not a rare finding and influences survival. The prevalence of hyponatremia (17.47%) and hypernatremia (5.03%) in our study is coherent with previous studies, in which hyponatremia is reported to occur in 9.9–35.8% and hypernatremia in 2.4–5.3% of COVID-19 positive inpatients [5]. In our study, a majority of the admitted patients suffered from mild-to-moderate hyponatremia and hypernatremia. According to Ruiz-Sánchez, J.G. et al., dysnatremic patients in the HOPE study suffered statistically more often from hypertension, CKD, DM, and CVD [6]. Our findings are partially consistent with the mentioned paper, as in our cohort dysnatremic patients suffered more often from hypertension, HF, DM, and had myocardial infarction histories. The differences between dysnatremic and normonatremic groups regarding long-term intake of drugs seem to be in line with the underlying comorbidities. Mainly, ACEI/ARB/ARNI, beta-blockers, and diuretics are used in the treatment of hypertension, HF, and CVD.
In our study, both hypo- and hypernatremia were found to be mortality predictors. It is important to remember that hyponatremia and hypernatremia are themselves pathophysiologic processes indicating disturbed water homeostasis [7]. Both 30- and 90-day mortality rates among hypo- and hypernatremic patients were significantly higher than in normonatremic patients. Early recognition of dysnatremia is a strong warning for the fatal course of disease, which is why physicians should exhibit extra caution with such patients. Here, a question on the possible correction of dysnatremia on admission arises. Some studies show that correction of hyponatremia results in a reduction in overall mortality in this patient group [8]. However, Chewcharat A. et al., have proved that both patients with uncorrected as well as corrected hyponatremia have significantly higher, and most importantly similar, in-hospital and 1-year mortality rates compared to normonatremic patients [9]. To our knowledge, there are no randomized trials on the correction of dysnatremia in COVID-19 patients and its impact on illness severity, outcomes, and mortality. In one retrospective study, de La Flor, J.C. et al., found that the absence of correction of hyponatremia in the first 72–96 h is associated with higher mortality in COVID-19 patients [10]. According to a recent study carried out in the Wroclaw Medical University Hospital, sodium concentration could predict prolonged length of in-hospital stay in patients with atrial fibrillation [11].
Another important and easily detected mortality predictor was found to be impaired level of consciousness, which is coherent with previous studies [12]. COVID-19 positive patients may present with a number of neurological symptoms, such as seizures, altered mentation with normal imaging, or a neuro-COVID-19 complex [12]. The most common manifestation is reported to be altered mentation, which in 23.6% of cases has no reasonable explanation [12]. Therefore, impaired consciousness is an indicator of illness severity and should raise clinicians’ concerns.
It has been broadly proven, that many common preexisting comorbidities, such as hypertension, DM, CVD, COPD, and CKD, are mortality predictors in COVID-19 patients [13]. Our results are partially consistent with these findings, as in our cohort history of neoplastic disease, CVD, and asthma/COPD could predict mortality. Long-term use of certain drugs, such as calcium blockers or ASA, being either a 30-day or 90-day mortality predictor could be explained by the fact that these drugs are used in the treatment of certain medical conditions, such as hypertension or CVD [14,15]. These conditions were listed above as they themselves are COVID-19 mortality predictors. The dilemma on whether the renin–angiotensin system blockade could worsen the patients’ outcomes and whether it should be discontinued after admission rose in the early phase of the pandemic. Our study shows no correlation between the long-term use of ACEI/ARNI/ARB and increased mortality as a result of possible increased patients’ susceptibility to SARS-CoV infection. A metanalysis of observational studies suggests that a therapy aimed at blocking the RAA system should not be discontinued; however, randomized trials are crucial for confirmation of this theory [16].
Another important finding in our study was the establishment of predictors of ICU admission. Impaired consciousness was found to strongly predict ICU admission, along with WBC and CRP.
Regarding laboratory findings, WBC was able to predict both increased mortality as well as ICU admission, while CRP was an ICU admission predictor. Both WBC and CRP are signs of possible bacterial co-infection, which is known to be a COVID-19 complication occurring more often in critically ill patients [17]. Therefore, higher WBC values should draw clinicians’ attention, as they may suggest fatal outcomes in COVID-19 patients. It has been previously reported that the degree of lymphopenia as well as increased neutrophil levels may be used to predict illness severity in COVID-19 patients [13].
Our study has some strengths and limitations. The main drawback of the study is the lack of measurement of patients’ osmolarity/tonicity profile, and, therefore, a lack of diagnosis of mechanism of the underlying dysnatremia. Furthermore, the observation of the influence of impaired consciousness on fluid intake is missing. In this study, dysnatremia is solely a laboratory finding indicating severe outcomes. Osmolarity measurement was impossible to carry out, due to the retrospective character of the study. However, the study analyses a huge patient probe, namely 2026 individuals. We identified predictors of 30- and 90-day mortality, dysnatremia, and ICU admission, which are quick and easy to implement in daily practice, as well as inexpensive.

5. Conclusions

Dysnatremia is a common finding in COVID-19 patients. Hyponatremia occurs more often than hypernatremia; however, hypernatremia is found to be more severe and fatal. Both hypo- and hypernatremia are strong mortality predictors in COVID-19 patients. Impaired level of consciousness as well as high WBC levels are strong predictors of both increased mortality and ICU admission. Hypernatremia was strongly associated with impaired level of consciousness, while hyponatremia was associated with a diagnosis of DM and ACEI/ARB/ARNI intake. Patients suffering from dysnatremia should be recognized early as they require more meticulous care.

Author Contributions

Conceptualization, K.L., A.D., E.A.J. and K.M.; methodology, A.K., K.L., K.K. (Krzysztof Kujawa), A.D., E.A.J. and K.M.; software, K.K. (Krzysztof Kujawa); validation formal analysis, K.K.; investigation, K.L., B.A., A.D., K.K. (Krzysztof Kaliszewski), K.K.-P., A.M.-W., M.M., M.P. (Michał Pomorski), M.P. (Marcin Protasiewicz), J.S. and M.T.; resources, K.L., B.A., A.D., K.K. (Krzysztof Kaliszewski), K.K.-P., A.M.-W., M.M., M.P. (Michał Pomorski), M.P. (Marcin Protasiewicz), J.S. and M.T.; data curation, M.M., M.P. (Michał Pomorski), M.P. (Marcin Protasiewicz), K.L., B.A., A.D., K.K. (Krzysztof Kaliszewski), K.K.-P., A.M.-W., J.S. and M.T.; writing—original draft preparation, A.K. and K.L.; writing—review and editing, A.K., K.L., E.A.J. and K.M.; visualization, A.K., K.L. and K.K.; Supervision, A.D., E.A.J. and K.M.; project administration, K.L., A.D., E.A.J. and K.M. All authors have read and agreed to the published version of the manuscript.

Funding

This research received no external funding.

Institutional Review Board Statement

Institutional Review Board and Ethics Committee at the Wroclaw Medical University, Wroclaw, Poland, No.: KB-444/2021.

Informed Consent Statement

Patient consent was waived due to the retrospective character of the study.

Data Availability Statement

The datasets used and/or analyzed during the current study are available from the authors upon reasonable request.

Conflicts of Interest

The authors declare no conflict of interest.

References

  1. Peri, A. Morbidity and Mortality of Hyponatremia. Front. Horm. Res. 2019, 52, 36–48. [Google Scholar] [CrossRef] [PubMed]
  2. Muhsin, S.A.; Mount, D.B. Diagnosis and treatment of hypernatremia. Best Pract. Res. Clin. Endocrinol. Metab. 2016, 30, 189–203. [Google Scholar] [CrossRef] [PubMed]
  3. Lindner, G.; Funk, G.-C. Hypernatremia in critically ill patients. J. Crit. Care 2013, 28, 216.e11–216.e20. [Google Scholar] [CrossRef] [PubMed]
  4. Chauhan, K.; Pattharanitima, P.; Patel, N.; Duffy, A.; Saha, A.; Chaudhary, K.; Debnath, N.; Van Vleck, T.; Chan, L.; Nadkarni, G.N.; et al. Rate of Correction of Hypernatremia and Health Outcomes in Critically Ill Patients. Clin. J. Am. Soc. Nephrol. 2019, 14, 656–663. [Google Scholar] [CrossRef] [PubMed]
  5. Tzoulis, P.; Grossman, A.B.; Baldeweg, S.E.; Bouloux, P.; Kaltsas, G. Management of Endocrine Disease: Dysnatraemia in COVID-19: Prevalence, prognostic impact, pathophysiology, and management. Eur. J. Endocrinol. 2021, 185, R103–R111. [Google Scholar] [CrossRef] [PubMed]
  6. Ruiz-Sánchez, J.G.; Núñez-Gil, I.J.; Cuesta, M.; Rubio, M.A.; Maroun-Eid, C.; Arroyo-Espliguero, R.; Romero, R.; Becerra-Muñoz, V.M.; Uribarri, A.; Feltes, G.; et al. Prognostic Impact of Hyponatremia and Hypernatremia in COVID-19 Pneumonia. A HOPE-COVID-19 (Health Outcome Predictive Evaluation for COVID-19) Registry Analysis. Front. Endocrinol. 2020, 11, 599255. [Google Scholar] [CrossRef]
  7. Hoorn, E.J.; Zietse, R. Diagnosis and Treatment of Hyponatremia: Compilation of the Guidelines. J. Am. Soc. Nephrol. 2017, 28, 1340–1349. [Google Scholar] [CrossRef] [Green Version]
  8. Corona, G.; Giuliani, C.; Verbalis, J.G.; Forti, G.; Maggi, M.; Peri, A. Hyponatremia Improvement Is Associated with a Reduced Risk of Mortality: Evidence from a Meta-Analysis. PLoS ONE 2015, 10, e0124105. [Google Scholar] [CrossRef] [PubMed]
  9. Chewcharat, A.; Thongprayoon, C.; Cheungpasitporn, W.; Mao, M.A.; Thirunavukkarasu, S.; Kashani, K.B. Trajectories of Serum Sodium on In-Hospital and 1-Year Survival among Hospitalized Patients. Clin. J. Am. Soc. Nephrol. 2020, 15, 600–607. [Google Scholar] [CrossRef] [PubMed]
  10. de La Flor, J.C.; Gomez-Berrocal, A.; Marschall, A.; Valga, F.; Linares, T.; Albarracin, C.; Ruiz, E.; Gallegos, G.; Gómez, A.; de Los Santos, A.; et al. Smart RBN. The impact of the correction of hyponatremia during hospital admission on the prognosis of SARS-CoV-2 infection. Ann. Oncol. 2020, 159, 19–21. [Google Scholar]
  11. Czapla, M.; Uchmanowicz, I.; Juárez-Vela, R.; Durante, A.; Kałużna-Oleksy, M.; Łokieć, K.; Baeza-Trinidad, R.; Smereka, J. Relationship between nutritional status and length of hospital stay among patients with atrial fibrillation—A result of the nutritional status heart study. Front. Nutr. 2022, 9, 1086715. [Google Scholar] [CrossRef] [PubMed]
  12. Eskandar, E.N.; Altschul, D.J.; Ramos, R.D.L.G.; Cezayirli, P.; Unda, S.R.; Benton, J.; Dardick, J.; Toma, A.; Patel, N.; Malaviya, A.; et al. Neurologic Syndromes Predict Higher In-Hospital Mortality in COVID-19. Neurology 2020, 96, e1527–e1538. [Google Scholar] [CrossRef] [PubMed]
  13. Marin, B.G.; Aghagoli, G.; Lavine, K.; Yang, L.; Siff, E.J.; Chiang, S.S.; Salazar-Mather, T.P.; Dumenco, L.; Savaria, M.C.; Aung, S.N.; et al. Predictors of COVID-19 severity: A literature review. Rev. Med. Virol. 2021, 31, 1–10. [Google Scholar] [CrossRef] [PubMed]
  14. McDonagh, T.A.; Metra, M.; Adamo, M.; Gardner, R.S.; Baumbach, A.; Böhm, M.; Burri, H.; Butler, J.; Čelutkienė, J.; Chioncel, O.; et al. 2021 ESC Guidelines for the diagnosis and treatment of acute and chronic heart failure. Eur. Heart J. 2021, 42, 3599–3726. [Google Scholar] [CrossRef] [PubMed]
  15. Visseren, F.L.J.; Mach, F.; Smulders, Y.M.; Carballo, D.; Koskinas, K.C.; Bäck, M.; Benetos, A.; Biffi, A.; Boavida, J.-M.; Capodanno, D.; et al. ESC Guidelines on cardiovascular disease prevention in clinical practice. Eur. Heart J. 2021, 42, 3227–3337. [Google Scholar] [CrossRef] [PubMed]
  16. Cohen, J.B.; South, A.M.; Shaltout, H.A.; Sinclair, M.R.; Sparks, M.A. Renin–angiotensin system blockade in the COVID-19 pandemic. Clin. Kidney J. 2021, 14 (Suppl. S1), i48–i59. [Google Scholar] [CrossRef] [PubMed]
  17. Chandrasekaran, B.; Fernandes, S. Bacterial coinfection and secondary infection in patient with COVID-19. Diabetes Metab. Syndr. 2020, 14, 8. [Google Scholar]
Figure 1. Kaplan–Meyer curves for 30- and 90-day mortality and results of the log-rank tests.
Jcm 12 02802 g001
Figure 2. (a) 30-day mortality predictors in COVID patients, data on admission; (b) 30-day mortality predictors in COVID patients, including ICU patients; (c) 30-day mortality predictors in COVID patients, excluding ICU patients.
Jcm 12 02802 g002aJcm 12 02802 g002b
Figure 3. (a) 90-day mortality predictors in COVID patients, data on admission; (b) 90-day mortality predictors in COVID patients, including ICU patients; (c) 90-day mortality predictors in COVID patients, excluding ICU patients.
Jcm 12 02802 g003aJcm 12 02802 g003b
Table 1. Patient characteristics.
CharacteristicAllNormonatremiaHyponatremiaHypernatremiap-Value (ANOVA/Chi Square)Hypo vs. NormoHyper vs. NormoHypo vs. Hyper
Mean ± SD; median (Q1–Q3) or n (%) 1570 (77.49%)354 (17.47%)102 (5.03%)
Age, yr. 61.21 ± 18.2159.34 ± 18.5566.70 ± 15.1070.96 ± 15.860.0000 w0.00000.00000.2036
65.0 (48.0–74.0)63.00 (45.00–73.00)68.00 (61.00–77.00)70.50 (63.00–83.00)
Gender
Male1021 (50.4%)767 (48.9%)197 (55.6%)57 (55.9%) 0.0363
Female1005 (49.6%)803 (51.1%)157 (44.4%)45 (44.1%)
Vital signs
Systolic BP, mm Hg132.10 ± 22.93132.33 ± 22.46134.28 ± 23.13121.13 ± 26.720.00000.20330.00000.0000
130.0 (120.0–145.0)130.0 (120.0–144.0)130.0 (120.0–150.0)122.5 (110.0–134.0)
Diastolic BP 78.02 ± 13.4178.21 ± 13.1078.11 ± 13.0774.54 ± 18.510.2389 w
80.0 (70.0–85.0)80.0 (70.0–85.0) 80.0 (70.0–85.0)72.5 (60.0–85.5)
Heart rate, BPM 85.64 ± 16.3884.97 ± 15.7187.53 ± 17.1490.04 ± 22.390.0164 w0.01980.00750.2300
82.0 (75.0–94.0)81.0 (75.0–92.0)83.0 (76.0–96.0)82.0 (74.0–105.0)
Impaired consciousness323 (15.6%)197 (12.56%)60 (16.95%)66 (64.71%)0.0000
Comorbidities
Hypertension 988 (48.8%)730 (46.5%) 204 (57.6%)54 (52.9%)0.0005
History of myocardial
infarction
189 (9.3%)134 (8.5%)47 (13.3%)8 (7.8%) 0.0187
Heart failure 250 (12.3%)174 (11.1%) 59 (16.7%)17 (16.7%)0.0061
History of stroke or TIA 160 (7.9%)116 (7.4%)32 (9.0%)12 (11.8%)0.1929
Diabetes mellitus 467 (23.1%)331 (21.1%)112 (31.7%)24 (23.5%)0.0001
Chronic kidney disease 226 (11.2%)165 (10.5%)47 (13.3%)14 (13.7%)0.2290
Chronic obstructive
pulmonary disease or asthma
148 (7.3%)110 (7.0%)28 (7.9%)10 (9.8%)0.5121
Peripheral occlusive arterial disease 99 (4.9%)69 (4.4%)24 (6.8%)6 (5.9%)0.1523
History of cancer 196 (9.7%)147 (9.4%)37 (10.5%)12 (11.8%)0.6284
Charlson Comorbidity
Index
3.25 ± 2.693.00 ± 2.653.98 ± 2.654.45 ± 2.640.0000
3(1–5)3 (1–5)4(2–5)4(2–6)
Drugs
ACEI/ARB/ARNI 492 (24.3%)355 (22.6%)112 (31.6%)25 (24.5%)0.0017
Beta-blockers 522 (25.8%)383 (24.4%)111 (31.4%)28 (27.5%)0.0238
Calcium blockers 289 (14.3%)217 (13.8%)55 (15.5%)17 (16.7%)0.5484
Mineral receptor
antagonists
100 (4.9%)74 (4.7%)24 (6.8%)2 (2.0%)0.0976
Diuretics 317 (15.7%)226 (14.4%)76 (21.5%)15 (14.7%)0.0040
Statins349 (17.2%)270 (17.2%)59 (16.7%)20 (19.6%)0.7849
Acetylsalicylic acid 254 (12.5%)195 (12.4%)47 (13.3%)12 (11.8%)0.8818
Anticoagulants282 (13.9%)203 (12.9%)58 (16.4%)21 (20.6%)0.0323
Steroids or
immunosuppressants
119 (5.9%)99 (6.3%)18 (5.1%)2 (2.0%)0.1531
Laboratory values
White blood cell count, 103/mL 9.14 ± 11.728.98 ± 12.758.88 ± 6.5712.45 ± 8.190.01350.87980.00380.0067
7.36 (5.37–10.30)7.21 (5.30–9.99)7.30 (5.17–10.77)10.59 (7.82–14.88)
Hemoglobin, g/dL 12.93 ± 2.2912.94 ± 2.2512.84 ± 2.4312.98 ± 2.420.7570 w
13.10 (11.70–14.50)13.20 (11.90–14.40)13.05 (11.20–14.7)13.15 (11.40–14.20)
Platelets, 103/L 232.17 ± 108.40232.19 ± 107.53230.32 ± 114.69238.20 ± 99.850.8116
211.00 (163.00–282.00)211.0 (164.0–282.0)204.5 (160.0–275.0)229.0 (173.0–300.0)
Sodium, mEq/L138.08 ± 5.45139.04 ± 2.55130.39 ± 5.27150.14 ± 5.450.0000
138.00 (136.00–141.00)139.0 (137.0–141.0)132.0 (129.0–134.0)148.0 (147.0–152.0)
Serum creatinine, mg/dL1.32 ± 1.301.26 ± 1.221.47 ± 1.521.70 ± 1.520.0017 w0.00630.00080.1070
0.94 (0.76–1.28)0.92 (0.75–1.22)1.00 (0.82–1.46)1.11 (0.83–2.06)
CRP 78.67 ± 84.7770.63 ± 78.2597.96 ± 93.02133.39 ± 114.570.0000 w0.00000.00000.0002
49.28 (13.27–116.40)43.36 (10.03–105.07)68.69 (27.52–141.25)99.05 (46.00–203.60)
In-hospital procedures
ICU admission 212 (10.5%)144 (9.2%)46 (13.0%)22 (21.6%)0.0001
Respiratory support 383 (18.9%)273 (17.4%)75 (21.3%)35 (34.3%)0.0001
No support887 (43.85%)736 (46.94%)131 (37.11%)20 (19.61%)
Passive oxygen therapy753 (37.22%)559 (35.65%)147 (41.64%)47 (46.08%)
HFNC131 (6.48%)99 (6.31%)22 (6.23%)10 (9.80%)
BiPAP/CPAP42 (2.08%)27 (1,72%)13 (3.68%)2 (1.96%)
Respiratory therapy210 (10.38%)147 (9.38%)40 (11.33%)23 (22.55%)
Vasopressors 217 (10.7%)147 (9.4%)41 (11.6%)29 (28.4%)0.0000
Intravenous loop diuretic 333 (16.4%)229 (14.6%)72 (20.3%)32 (31.4%)0.0000
Start of renal replacement therapy 72 (3.6%)45 (2.9%)17 (14.8%)10 (9.8%)0.0005
Steroids 1090 (53.8%)834 (53.1%)194 (54.8%)62 (60.8%)0.2958
Antibiotics 1229 (60.7%)931 (59.3%) 213 (60.2%)85 (83.3%)0.0000
BP—blood pressure; BPM—beats per minute; TIA—transient ischemic attack; ACEI—angiotensin—converting enzyme inhibitor; ARB—angiotensin II receptor blocker; ARNI—angiotensin receptor—nephrilysin inhibitor; CRP—C reactive protein; ICU—intensive care unit; HFNC—high flow nasal cannula; BiPAP—bilevel positive airway pressure; CPAP—continuous positive airway pressure; w—Welch’s ANOVA.
Table 2. Results of the univariate analysis of 30- and 90-day mortality predictors. See the Section 2.4 for details on the multivariate model.
30-Day Mortality Predictors90-Day Mortality Predictors
CharacteristicsHazard Ratio (HR)Standard Error (SE)95% HR Lower Bound95% HR Upper Boundp ValueHazard Ratio (HR)Standard Error (SE)95% HR Lower Bound95% HR Upper Boundp Value
Hyponatremia1.690.101.292.210.42041.600.091.262.040.1657
Hypernatremia3.630.122.545.200.00003.730.112.715.140.0000
Demographic data and vital signs
Age1.050.001.041.060.00001.050.001.051.060.0000
Sex (female)1.540.061.221.940.00020.730.050.590.890.0019
HR1.010.001.011.020.00001.010.001.011.020.0001
SBP0.990.000.991.000.01531.000.000.991.000.0448
DBP0.970.000.960.980.00000.980.000.970.990.0000
Consciousness5.210.064.176.520.00005.130.054.206.270.0000
Comorbidities
Hypertension1.890.061.492.400.00002.060.051.672.550.0000
History of myocardial infarction2.510.071.913.290.00002.520.061.973.220.0000
History of stroke/TIA1.600.081.152.230.00571.730.071.292.300.0002
Diabetes mellitus1.680.061.332.130.00001.780.051.452.190.0000
Chronic kidney disease2.000.071.532.630.00002.240.061.772.830.0000
Heart failure2.550.061.993.270.00002.650.062.133.300.0000
Asthma/COBP1.190.100.821.740.35871.340.080.971.840.0748
Peripheral obstructive arterial disease2.490.091.753.540.00002.230.081.603.100.0000
History of neoplastic disease2.400.071.823.170.00002.500.061.953.210.0000
Cardiovascular disease2.620.062.103.280.00002.670.052.193.260.0000
Long-term use of drugs
ACEI/ARB/ARNI1.120.060.881.420.35531.170.050.951.440.1490
Beta-blockers1.330.061.061.670.01521.500.051.231.840.0001
Calcium antagonists0.770.080.561.070.11620.950.070.731.240.6906
MRAs1.240.110.821.880.31551.560.091.112.190.0098
Diuretics1.450.071.121.870.00521.550.061.241.950.0001
Statins1.240.070.961.610.10551.340.061.071.680.0115
ASA0.990.080.731.360.96861.080.070.831.420.5503
Anticoagulants1.500.071.151.950.00301.620.061.292.050.0000
GCS/immunosupressants1.090.110.711.680.70031.190.090.821.730.3500
Laboratory findings
WBC1.020.001.021.030.00001.020.001.021.020.0000
Hemoglobin0.870.020.840.910.00000.870.020.830.900.0000
PLT1.000.001.001.000.00631.000.001.001.000.0024
Creatinine1.180.021.121.230.00001.170.021.131.220.0000
CRP1.000.001.001.010.00001.000.001.001.010.0000
Sodium1.020.011.001.040.06351.030.011.011.050.0082
In-hospital procedures
ICU admission3.840.063.014.910.00003.840.063.014.910.0000
Respiratory support6.050.064.847.580.00006.050.064.847.580.0000
Use of catecholamines5.600.064.447.060.00005.600.064.447.060.0000
IV loop diuretic3.930.063.144.910.00003.930.063.144.910.0000
Start of RRT 3.980.092.815.630.00003.980.092.815.630.0000
Use of steroids1.290.061.021.630.03601.290.061.021.630.0360
Use of antibiotics3.380.082.454.690.00003.380.082.454.690.0000
HR—heart rate; SBP—systolic blood pressure; DBP—diastolic blood pressure; TIA—transient ischemic attack; COPD—chronic obstructive pulmonary disease; ACEI—angiotensin-converting enzyme inhibitor; ARB—angiotensin II receptor blocker; ARNI—angiotensin receptor-nephrilysin inhibitor; MRA—mineralocorticoid receptor antagonist; ASA—acetylsalicylic acid; GCS—glucocorticoids; WBC—white blood cells count; PLT—platelet count; CRP—C reactive protein; ICU—intensive care unit; IV—intravenous; RRT—renal replacement therapy.
Table 3. Results of the univariate and multivariate analysis of ICU admission predictors in COVID-19 patients.
Univariate AnalysisMultivariate Analysis—Averaged Best Subset
Selection Models (with the Use of AIC)
CharacteristicsORCI 95 LowerCI 95 UpperpORCI 95 LowerCI 95 Upperp
Basic demographic data and vital signs
Age0.990.991.000.1877
Sex (M)1.941.382.720.00011.05501.02311.08780.00063
HR1.000.991.010.7279
SBP0.990.981.000.00991.00141.00051.00230.00183
DBP0.950.940.960.00000.99490.99340.99640.00000
Consciousness0.180.130.250.00001.20501.15581.25640.00000
Comorbidities
Hypertension1.280.921.760.1380
Diabetes mellitus1.390.981.970.0626
Chronic kidney disease0.860.521.400.5366
Asthma/COPD1.040.591.820.9022
History of neoplastic
disorder
0.940.551.600.8170
Cardiovascular disease1.050.741.500.7823
Laboratory findings
WBC1.061.041.080.00001.00371.00241.00500.00000
Hemoglobin0.940.881.010.0733
PLT1.001.001.000.1625
Creatinine1.030.921.160.6180
CRP1.011.011.010.00001.00051.00031.00070.00000
Hyponatremia1.350.902.020.35981.00610.96641.04740.76825
Hypernatremia2.791.594.910.00261.00200.93131.07820.95654
HR—heart rate; SBP—systolic blood pressure; DBP—diastolic blood pressure; COPD—chronic obstructive pulmonary disease; WBC—white blood cells count; PLT—platelet count; CRP—C reactive protein.
Table 4. Results of univariate analysis, predictors of hyponatremia and hypernatremia.
CharacteristicHyponatremiaHypernatremia
ORCI 95 UpperCI 95 LowerpORCI 95 UpperCI 95 Lower p
Age1.021.011.030.00001.041.021.050.0000
Sex (female)0.860.661.140.29780.900.561.440.6510
HR1.011.001.020.01821.011.001.030.0894
SBP1.000.991.010.89260.980.970.990.0018
DBP1.000.991.010.59170.980.961.000.0294
Consciousness1.491.052.100.024811.206.7218.660.0000
Comorbidities
Hypertension1.401.061.850.01701.240.771.990.3854
MI1.761.192.590.00431.130.532.430.7452
Stroke/TIA1.080.671.740.75301.940.993.810.0542
DM1.711.282.300.00031.010.581.770.9712
CKD1.300.891.900.17140.610.261.430.2574
Heart failure1.571.112.230.01151.370.732.550.3237
Asthma/COBP0.880.531.460.61501.740.863.490.1222
POAD1.630.962.770.07011.420.553.650.4721
CVD1.581.182.120.00221.731.052.840.0313
Neoplastic disorder 1.320.872.000.19821.300.632.680.4831
Laboratory findings
WBC1.000.991.010.79571.011.001.020.0613
Hb0.990.941.050.77181.010.911.120.9051
PLT1.001.001.000.91141.001.001.000.2087
Creatinine1.121.021.230.01411.120.971.290.1215
CRP1.001.001.000.00031.011.001.010.0000
Long-term use of drugs
ACEI/ARB/ARNI1.641.232.180.00071.260.752.090.3821
Beta-blockers1.411.061.870.01851.050.621.750.8629
Ca blockers1.160.821.650.40781.340.742.410.3362
MRAs1.270.762.130.36570.420.101.750.2353
Diuretics1.401.011.940.04530.920.491.740.7943
Statins1.060.761.470.73821.170.672.060.5757
ASA1.130.781.630.52091.020.531.980.9529
Anticoagulants1.380.981.940.06771.771.013.080.0442
Steroids/immunosuppressants0.990.571.710.97170.390.091.630.1977
HR—heart rate; SBP—systolic blood pressure; DBP—diastolic blood pressure; MI—myocardial infarction; TIA—transient ischemic attack; DM—diabetes mellitus; CKD—chronic kidney disease; COPD—chronic obstructive pulmonary disease; POAD—peripheral occlusive arterial disease; CVD—cardiovascular disease; WBC—white blood cells count; Hb—hemoglobin; PLT—platelet count; CRP—C reactive protein; ACEI—angiotensin—converting enzyme inhibitor; ARB—angiotensin II receptor blocker; ARNI—angiotensin receptor—nephrilysin inhibitor; MRA—mineralocorticoid receptor antagonist; ASA—acetylsalicylic acid.
Table 5. Results of multivariate analyses, possible predictors of hyponatremia and hypernatremia.
CharacteristicsCoefficientSECI-MinCI-MaxpORCI95 LowerCI95 Upperp
Predictors of hyponatremia
Age0.020.000.010.030.00171.021.011.030.0017
HR0.010.000.000.020.01771.011.001.020.0177
Consciousness0.170.19−0.190.540.35381.190.821.720.3538
Hypertension−0.270.19−0.640.090.14580.760.531.100.1458
DM0.340.160.020.660.03761.401.021.930.0376
ACEI/ARB/ARNI0.420.180.080.760.01701.521.082.150.0170
Beta-blockers0.010.17−0.330.360.94001.010.721.430.9400
Diuretics−0.040.19−0.420.340.82280.960.661.400.8228
CRP0.000.000.000.000.00451.001.001.000.0045
Creatinine0.080.05−0.020.180.09871.090.981.200.0987
CVD0.120.17−0.220.460.49041.130.801.580.4904
Predictors of hypernatremia
Age0.020.010.000.030.0511.021.001.030.0510
SBP−0.020.01−0.040.000.0260.980.961.000.0263
DBP0.020.010.000.050.0901.021.001.050.0896
Consciousness2.140.291.582.710.0008.544.8315.090.0000
Anticoagulants0.440.32−0.181.060.1631.550.842.890.1629
CRP0.000.000.000.010.0281.001.001.010.0277
CVD−0.100.29−0.670.470.7280.900.511.600.7279
HR—heart rate; DM—diabetes mellitus; ACEI—angiotensin—converting enzyme inhibitor; ARB—angiotensin II receptor blocker; ARNI—angiotensin receptor—nephrilysin inhibitor; CRP—C reactive protein; CVD—cardiovascular disease; SBP—systolic blood pressure; DBP—diastolic blood pressure.
Disclaimer/Publisher’s Note: The statements, opinions and data contained in all publications are solely those of the individual author(s) and contributor(s) and not of MDPI and/or the editor(s). MDPI and/or the editor(s) disclaim responsibility for any injury to people or property resulting from any ideas, methods, instructions or products referred to in the content.

