
The Significance of CD20 Intensity Variance in Pediatric Patients with B-Cell Precursor Acute Lymphoblastic Leukemia


 ,
, 
 , ,
, ,
Abstract
:1. Introduction
2. Materials and Methods
2.1. Study Design
2.2. Flow Cytometry
2.3. Data Analysis
3. Results
4. Discussion
Supplementary Materials
Author Contributions
Funding
Institutional Review Board Statement
Informed Consent Statement
Data Availability Statement
Conflicts of Interest
References
- Butler, E.; Ludwig, K.; Pacenta, H.L.; Klesse, L.J.; Watt, T.C.; Laetsch, T.W. Recent progress in the treatment of cancer in children. CA A Cancer J. Clin. 2021, 71, 315–332. [Google Scholar] [CrossRef] [PubMed]
- Adamson, P.C. Improving the outcome for children with cancer: Development of targeted new agents. CA A Cancer J. Clin. 2015, 65, 212–220. [Google Scholar] [CrossRef] [PubMed]
- Siegel, R.L.; Miller, K.D.; Jemal, A. Cancer statistics, 2020. CA A Cancer J. Clin. 2020, 70, 7–30. [Google Scholar] [CrossRef] [PubMed]
- Cancer Stat Facts: Childhood Leukemia (Ages 0–19). Available online: https://seer.cancer.gov/statfacts/html/childleuk.html (accessed on 13 December 2022).
- Sun, W.; Malvar, J.; Sposto, R.; Verma, A.; Wilkes, J.J.; Dennis, R.; Heym, K.; Laetsch, T.W.; Widener, M.; Rheingold, S.R.; et al. Outcome of children with multiply relapsed B-cell acute lymphoblastic leukemia: A therapeutic advances in childhood leukemia & lymphoma study. Leukemia 2018, 32, 2316–2325. [Google Scholar] [CrossRef] [PubMed]
- Sun, Y.; Xu, Z.; Jiang, J.; Xu, T.; Xu, J.; Liu, P. High Expression of Succinate Dehydrogenase Subunit A Which Is Regulated by Histone Acetylation, Acts as a Good Prognostic Factor of Multiple Myeloma Patients. Front. Oncol. 2020, 10, 563666. [Google Scholar] [CrossRef]
- Ion, A.; Popa, I.M.; Papagheorghe, L.M.L.; Lisievici, C.; Lupu, M.; Voiculescu, V.; Caruntu, C.; Boda, D. Proteomic Approaches to Biomarker Discovery in Cutaneous T-Cell Lymphoma. Dis. Markers 2016, 2016, 9602472. [Google Scholar] [CrossRef] [PubMed]
- Dworzak, M.N.; Schumich, A.; Printz, D.; Pötschger, U.; Husak, Z.; Attarbaschi, A.; Basso, G.; Gaipa, G.; Ratei, R.; Mann, G.; et al. CD20 up-regulation in pediatric B-cell precursor acute lymphoblastic leukemia during induction treatment: Setting the stage for anti-CD20 directed immunotherapy. Blood 2008, 112, 3982–3988. [Google Scholar] [CrossRef]
- Pavlasova, G.; Mraz, M. The regulation and function of CD20: An “enigma” of B-cell biology and targeted therapy. Haematologica 2020, 105, 1494–1506. [Google Scholar] [CrossRef]
- Gaipa, G.; Basso, G.; Maglia, O.; Leoni, V.; Faini, A.; Cazzaniga, G.; Bugarin, C.; Veltroni, M.; Michelotto, B.; Ratei, R.; et al. Drug-induced immunophenotypic modulation in childhood ALL: Implications for minimal residual disease detection. Leukemia 2005, 19, 49–56. [Google Scholar] [CrossRef]
- Gaipa, G.; Basso, G.; Aliprandi, S.; Migliavacca, M.; Vallinoto, C.; Maglia, O.; Faini, A.; Veltroni, M.; Husak, D.; Schumich, A.; et al. Prednisone induces immunophenotypic modulation of CD10 and CD34 in nonapoptotic B-cell precursor acute lymphoblastic leukemia cells. Cytom. Part B Clin. Cytom. 2008, 74B, 150–155. [Google Scholar] [CrossRef]
- Dworzak, M.N.; Gaipa, G.; Schumich, A.; Maglia, O.; Ratei, R.; Veltroni, M.; Husak, Z.; Basso, G.; Karawajew, L.; Gadner, H.; et al. Modulation of antigen expression in B-cell precursor acute lymphoblastic leukemia during induction therapy is partly transient: Evidence for a drug-induced regulatory phenomenon. Results of the AIEOP-BFM-ALL-FLOW-MRD-Study Group. Cytom. Part B Clin. Cytom. 2010, 78B, 147–153. [Google Scholar] [CrossRef]
- European Society for Paediatric Oncology. Standard Clinical Practice Recommendations Acute Lymphoblastic Leukemia (ALL). Available online: https://www.srohp.ro/wp-content/uploads/2022/01/escp-acute-lymphoblastic-leukemia-all.pdf (accessed on 13 December 2022).
- ALL IC-BFM 2009. A Randomized Trial of the I-BFM-SG for the Management of Childhood non-B Acute Lymphoblastic Leukemia. Final Version of Therapy Protocol from August-14-2009. Available online: https://www.bialaczka.org/wp-content/uploads/2016/10/ALLIC_BFM_2009.pdf (accessed on 13 December 2022).
- ClinicalTrials.gov. Bethesda (MD): National Library of Medicine (US). Identifier: NCT03643276, Treatment Protocol for Children and Adolescents With Acute Lymphoblastic Leukemia—AIEOP-BFM ALL 2017. Available online: https://clinicaltrials.gov/ct2/show/NCT03643276 (accessed on 13 December 2022).
- Bene, M.C.; Castoldi, G.; Knapp, W.; Ludwig, W.D.; Matutes, E.; Orfao, A.; van’t Veer, M.B. Proposals for the immunological classification of acute leukemias. European Group for the Immunological Characterization of Leukemias (EGIL). Leukemia 1995, 9, 1783–1786. [Google Scholar]
- Kakaje, A.; Alhalabi, M.M.; Ghareeb, A.; Karam, B.; Mansour, B.; Zahra, B.; Hamdan, O. Rates and trends of childhood acute lymphoblastic leukaemia: An epidemiology study. Sci. Rep. 2020, 10, 6756. [Google Scholar] [CrossRef] [PubMed]
- Garniasih, D.; Susanah, S.; Sribudiani, Y.; Hilmanto, D. The incidence and mortality of childhood acute lymphoblastic leukemia in Indonesia: A systematic review and meta-analysis. PLoS ONE 2022, 17, e0269706. [Google Scholar] [CrossRef] [PubMed]
- Oettgen, H.C.; Bayard, P.J.; Van Ewijk, W.; Nadler, L.M.; Terhorst, C.P. Further biochemical studies of the human B-cell differentiation antigens B1 and B2. Hybridoma 1983, 2, 17–28. [Google Scholar] [CrossRef] [PubMed]
- Tedder, T.F.; Engel, P. CD20: A regulator of cell-cycle progression of B lymphocytes. Immunol. Today 1994, 15, 450–454. [Google Scholar] [CrossRef]
- Anolik, J.; Looney, R.J.; Bottaro, A.; Sanz, I.; Young, F. Down-regulation of CD20 on B cells upon CD40 activation. Eur. J. Immunol. 2003, 33, 2398–2409. [Google Scholar] [CrossRef]
- Jeha, S.; Behm, F.; Pei, D.; Sandlund, J.T.; Ribeiro, R.C.; Razzouk, B.I.; Rubnitz, J.E.; Hijiya, N.; Howard, S.C.; Cheng, C.; et al. Prognostic significance of CD20 expression in childhood B-cell precursor acute lymphoblastic leukemia. Blood 2006, 108, 3302–3304. [Google Scholar] [CrossRef] [PubMed]
- Borowitz, M.J.; Shuster, J.; Carroll, A.J.; Nash, M.; Look, A.T.; Camitta, B.; Mahoney, D.; Lauer, S.J.; Pullen, D.J. Prognostic significance of fluorescence intensity of surface marker expression in childhood B-precursor acute lymphoblastic leukemia. A Pediatric Oncology Group Study. Blood 1997, 89, 3960–3966. [Google Scholar] [CrossRef]
- Watt, T.C.; Park, S.; Cooper, T. CD20 up-Regulation In Induction Therapy for Childhood B Lymphoblastic Leukemia. Blood 2010, 116, 2124. [Google Scholar] [CrossRef]
- Thomas, D.A.; Faderl, S.; O’Brien, S.; Bueso-Ramos, C.; Cortes, J.; Garcia-Manero, G.; Giles, F.J.; Verstovsek, S.; Wierda, W.G.; Pierce, S.A.; et al. Chemoimmunotherapy with hyper-CVAD plus rituximab for the treatment of adult Burkitt and Burkitt-type lymphoma or acute lymphoblastic leukemia. Cancer 2006, 106, 1569–1580. [Google Scholar] [CrossRef] [PubMed]
- Radu, L.E.; Colita, A.; Pasca, S.; Tomuleasa, C.; Popa, C.; Serban, C.; Gheorghe, A.; Serbanica, A.; Jercan, C.; Marcu, A.; et al. Day 15 and Day 33 Minimal Residual Disease Assessment for Acute Lymphoblastic Leukemia Patients Treated According to the BFM ALL IC 2009 Protocol: Single-Center Experience of 133 Cases. Front. Oncol. 2020, 10, 923. [Google Scholar] [CrossRef] [PubMed]
- Thomas, D.A.; O’Brien, S.; Jorgensen, J.L.; Cortes, J.; Faderl, S.; Garcia-Manero, G.; Verstovsek, S.; Koller, C.; Pierce, S.; Huh, Y.; et al. Prognostic significance of CD20 expression in adults with de novo precursor B-lineage acute lymphoblastic leukemia. Blood 2009, 113, 6330–6337. [Google Scholar] [CrossRef] [PubMed]
- Maecker, H.T.; Trotter, J. Flow cytometry controls, instrument setup, and the determination of positivity. Cytom. Part A J. Int. Soc. Anal. Cytol. 2006, 69, 1037–1042. [Google Scholar] [CrossRef] [PubMed]


| Category | Variable | Value (Percentage) |
|---|---|---|
| Gender | Female | 45 (39.5%) |
| Male | 69 (60.5%) | |
| Region | Urban | 56 (49.1%) |
| Rural | 58 (50.9%) | |
| Age at diagnosis | Over 6 years | 45 (39.5%) |
| Under 6 years | 69 (60.5%) | |
| Leukocytes/µL | [880–3860] | 22 (19.3%) |
| (3860–10,000] | 28 (24.6%) | |
| (10,000–20,000] | 27 (23.7%) | |
| (20,000–50,000] | 22 (19.3%) | |
| (50,000–100,000] | 8 (7%) | |
| Over 100,000 | 7 (6.1%) | |
| Peripheral blasts (percentage) | Median (Q1, Q3) | 54 (10, 78) |
| Hemoglobin (g/dL) | Under 5 | 15 (13.2%) |
| [5–7) | 25 (21.9%) | |
| [7–10) | 53 (46.5%) | |
| [10–13) | 17 (14.9%) | |
| Over 13 | 4 (3.5%) | |
| Platelets/uL | Under 10,000 | 7 (6.1%) |
| [10,000–20,000) | 10 (8.8%) | |
| [20,000–50,000) | 42 (36.8%) | |
| [50,000–100,000) | 28 (24.6%) | |
| [100,000–350,000) | 27 (23.7%) | |
| FAB | L1 | 107 (93.9%) |
| L2 | 7 (6.1%) | |
| Immunophenotype | B common | 89 (78.1%) |
| preB | 22 (19.3%) | |
| proB | 3 (2.6%) | |
| Cytogenetics | No metaphases | 31 (27.2%) |
| Hyperdiploid | 21 (18.4%) | |
| Hypodiploid | 1 (0.9%) | |
| Normal | 34 (29.8%) | |
| Other | 27 (23.7%) | |
| Molecular biology | No molecular alterations | 77 (67.5%) |
| ETV6::RUNX1 | 27 (23.7%) | |
| BCR::ABL | 7 (6.1%) | |
| TCF3::PBX1 | 2 (1.8%) | |
| FLT3-ITD | 1 (0.9%) | |
| Prednisone response | PGR | 96 (84.2%) |
| PPR | 18 (15.8%) | |
| Risk group | SRG | 50 (43.9%) |
| IRG | 30 (26.3%) | |
| HRG | 34 (29.8%) | |
| Protocol | ALL-IC-BFM 2009 | 59 (51.8%) |
| AIEOP-BFM 2017 | 55 (48.2%) | |
| MRD day 15 | MRD < 0.1% | 28 (24.6%) |
| MRD ≥ 0.1–10% | 60 (52.6%) | |
| MRD > 10% | 26 (22.8%) | |
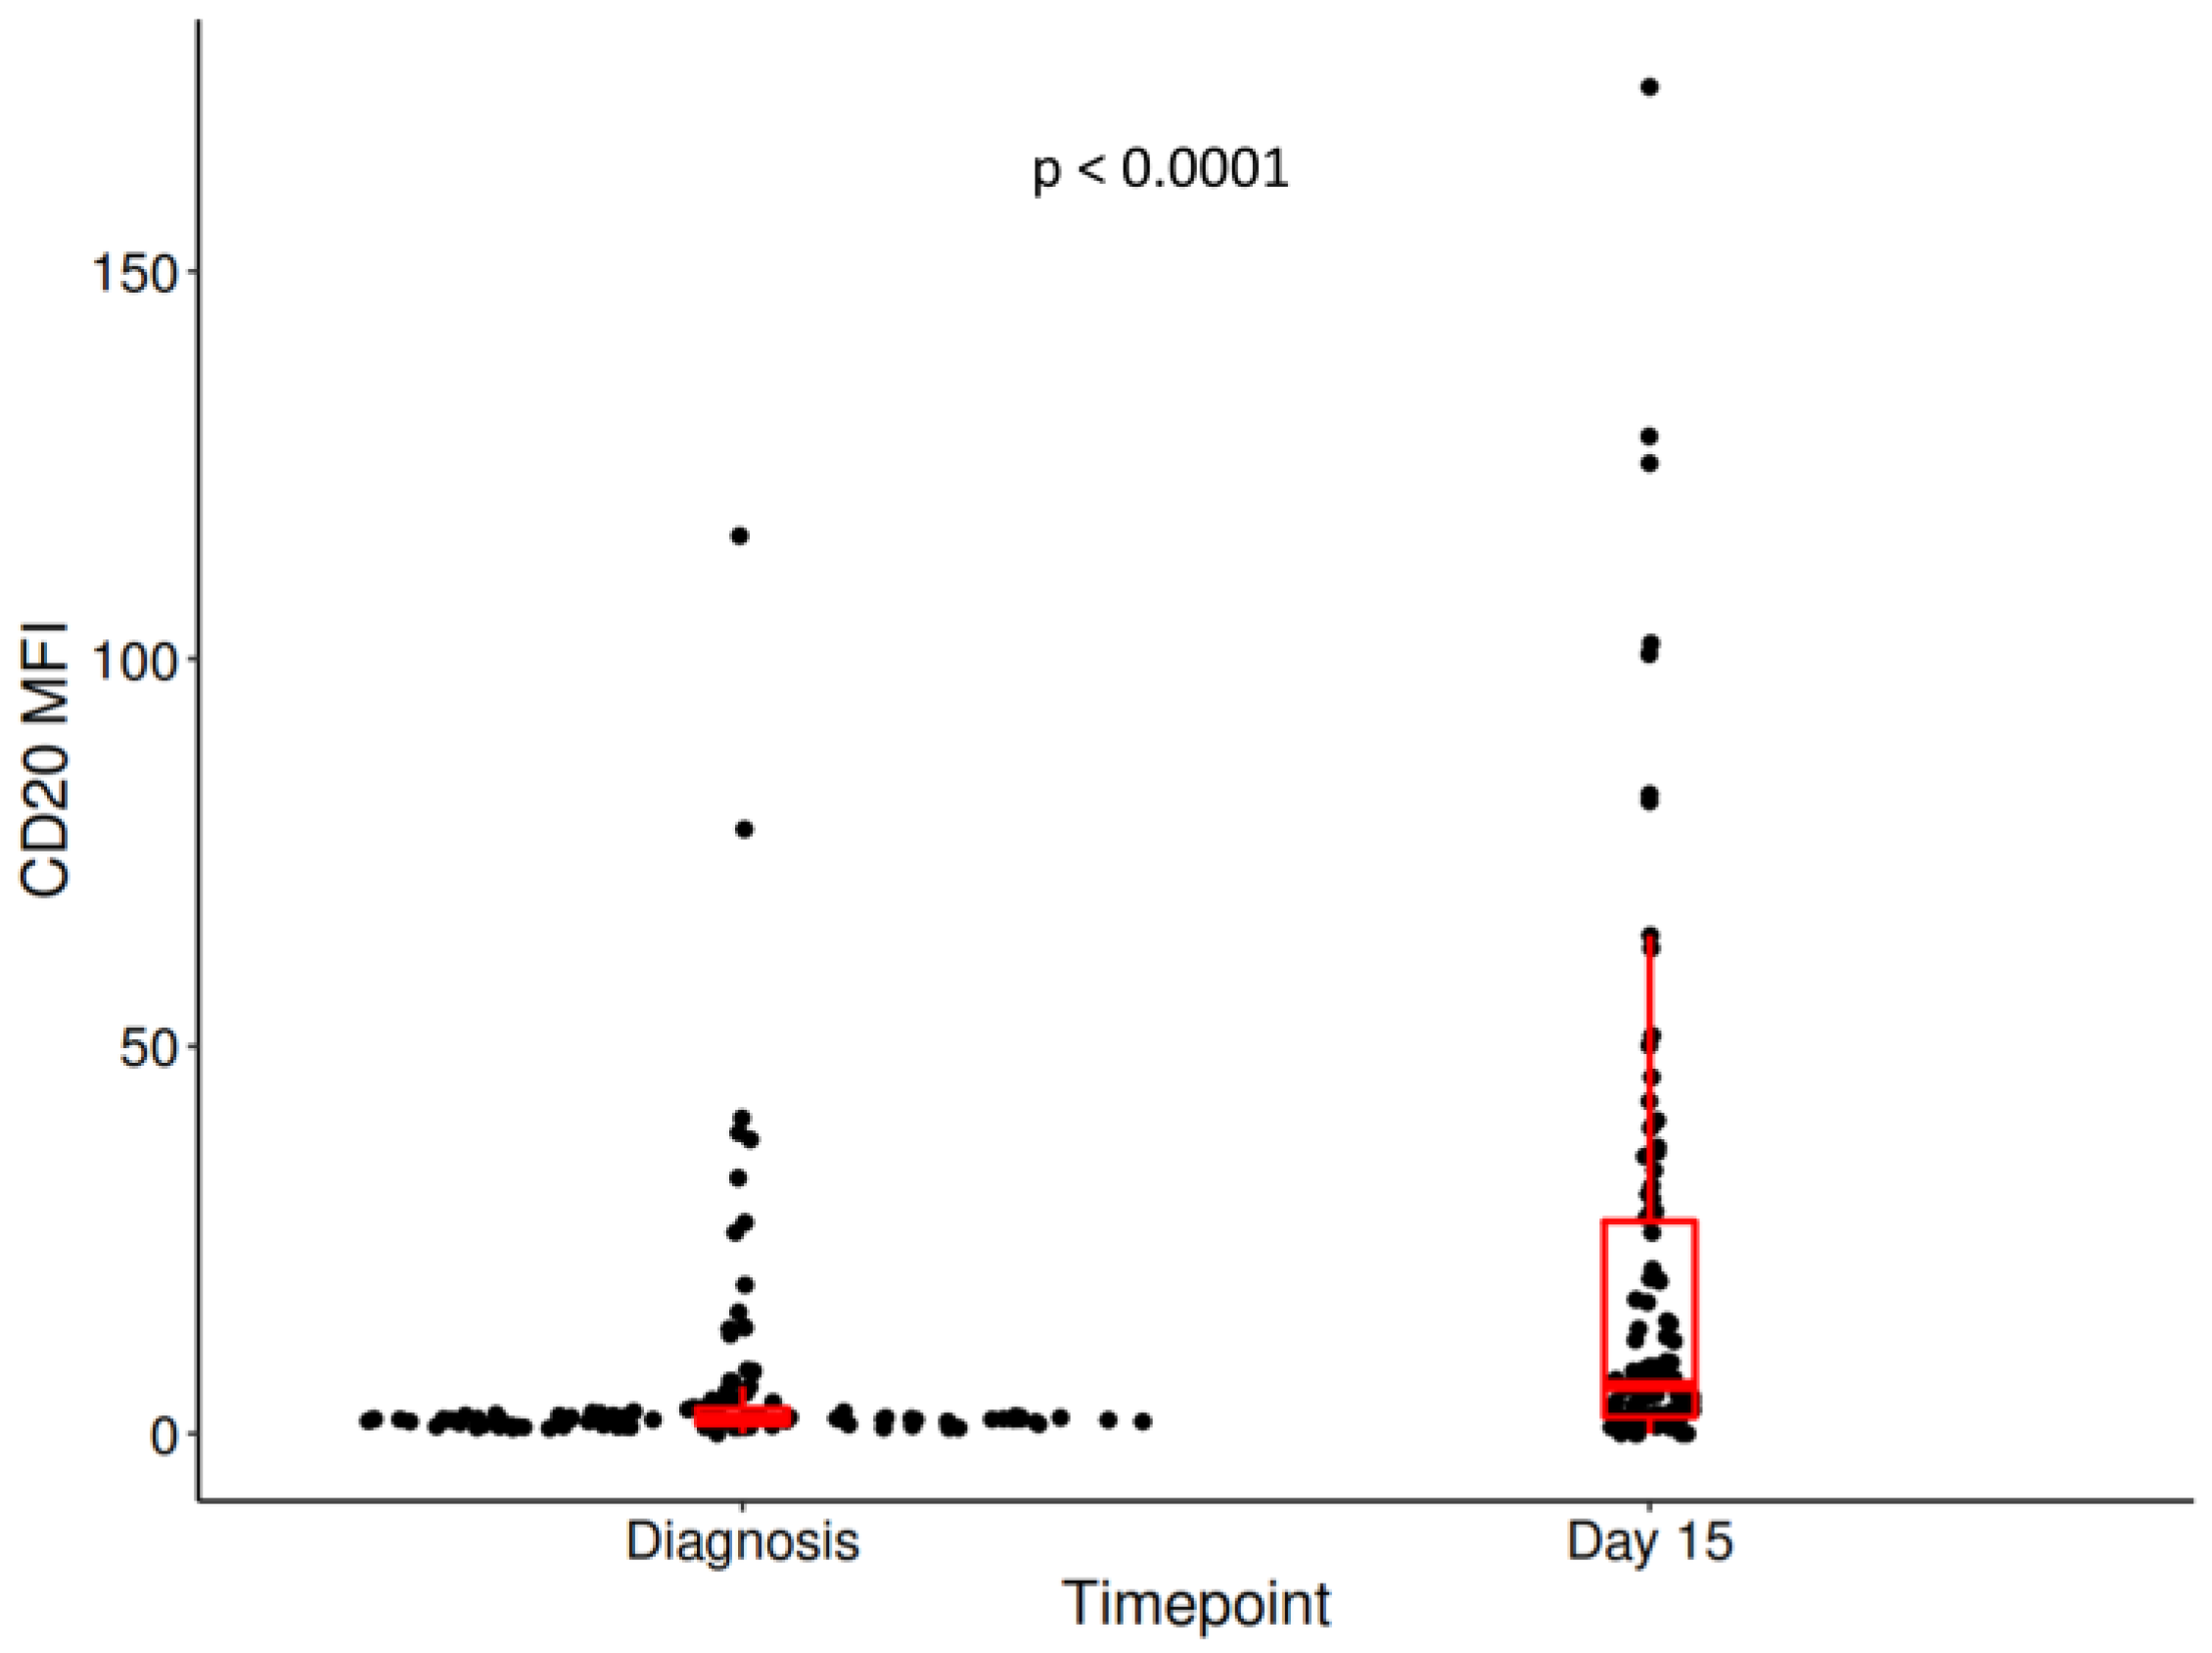
| MFI CD20 diagnosis | Median (Q1, Q3) | 1.90 (1.20, 3.26) |
| Percentage CD20+ blasts diagnosis | Median (Q1, Q3) | 1.34 (0.35, 9.34) |
| MFI CD20 day 15 | Median (Q1, Q3) | 6.17 (2.14, 27.4) |
| Percent CD20+ blasts day 15 | Median (Q1, Q3) | 33.10 (5.24, 76.33) |
| Delta MFI CD20 | Median (Q1, Q3) | 2.66 (0.27, 17.25) |
| Variable | Relapse Free Survival | Overall Survival | ||
|---|---|---|---|---|
| HR (95% CI) | p-Value | HR (95% CI) | p-Value | |
| Male gender | 0.85 (0.3, 2.46) | 0.77 | 0.5 (0.13, 1.87) | 0.30 |
| Urban region | 0.64 (0.22, 1.85) | 0.41 | 0.7 (0.19, 2.6) | 0.59 |
| Over 6 years at diagnosis | 4.25 (1.33, 13.56) | 0.01 | 13.67 (1.71, 109.42) | 0.01 |
| Leukocytes | 1.6 (1.11, 2.31) | 0.01 | 1.9 (1.2, 3.02) | <0.01 |
| Hemoglobin | 1.12 (0.66, 1.89) | 0.68 | 1.05 (0.54, 2.04) | 0.89 |
| Platelets | 0.96 (0.59, 1.56) | 0.87 | 1.23 (0.64, 2.36) | 0.53 |
| L2 FAB | 2.76 (0.62, 12.41) | 0.18 | 1.91 (0.24, 15.28) | 0.54 |
| PPR | 5.76 (1.98, 16.72) | <0.01 | 5.84 (1.56, 21.85) | <0.01 |
| Risk group | 3.12 (1.41, 6.92) | <0.01 | 2.37 (0.96, 5.83) | 0.06 |
| ALL-IC-BFM 2017 protocol | 0.75 (0.24, 2.31) | 0.61 | 1.12 (0.28, 4.54) | 0.87 |
| MRD day 15 | 2.81 (1.2, 6.55) | 0.02 | 2.22 (0.8, 6.19) | 0.13 |
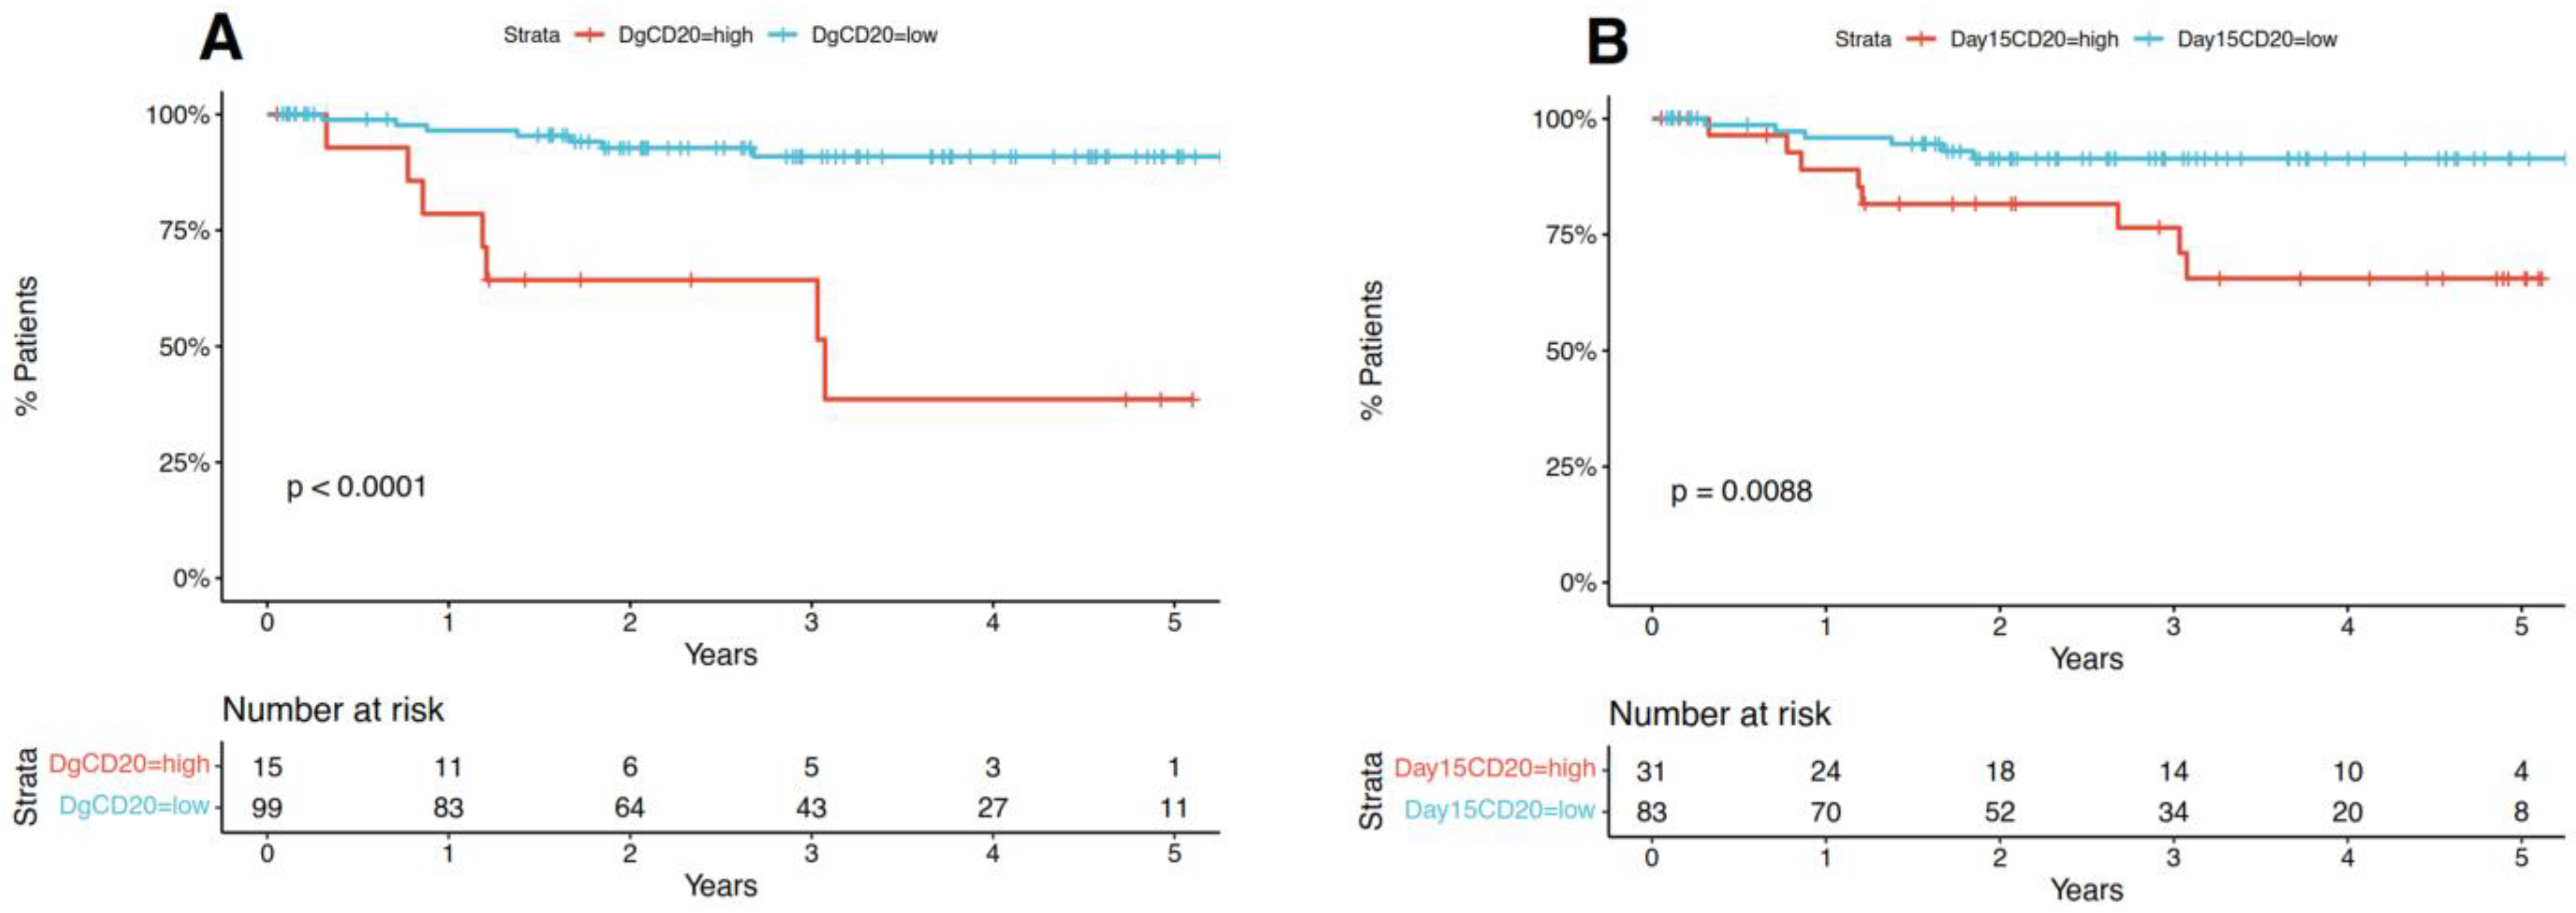
| MFI CD20 diagnosis >8.08 | 8.23 (2.87, 23.61) | <0.0001 | 9.89 (2.64, 37.07) | <0.001 |
| MFI CD20 day 15 >19.99 | 3.74 (1.3, 10.79) | 0.01 | 3.55 (0.95, 13.26) | 0.06 |
| MFI deltaCD20 day 15 >28.65 | 3.65 (1.28, 10.42) | 0.02 | 4.59 (1.23, 17.19) | 0.02 |
| Variable | Diagnosis CD20 MFI | Day 15 CD20 MFI | Day 15 CD20 MFI | |||||||
|---|---|---|---|---|---|---|---|---|---|---|
| Over 8.08 | Under 8.08 | p-Value | Over 19.99 | Under 19.99 | p-Value | Over 28.65 | Under 28.65 | p-Value | ||
| n = 15 | n = 99 | n = 31 | n = 83 | n = 26 | n = 88 | |||||
| Age at diagnosis | >6 years | 6 (40%) | 39 (39.4%) | 1 | 13 (41.9%) | 32 (38.6%) | 0.83 | 11 (42.3%) | 34 (38.6%) | 0.82 |
| <6 years | 9 (60%) | 60 (60.6%) | 18 (58.1%) | 51 (61.4%) | 15 (57.7%) | 54 (61.4%) | ||||
| Leukocytes | 2 (1, 3) | 2 (1, 3) | 0.23 | 2 (1, 3) | 2 (1, 3) | 0.55 | 2 (1, 3) | 2 (1, 3) | 0.54 | |
| Prednisone response | PGR | 10 (66.7%) | 86 (86.9%) | 0.06 | 23 (74.2%) | 73 (88%) | 0.09 | 18 (69.2%) | 78 (88.6%) | 0.03 |
| PPR | 5 (33.3%) | 13 (13.1%) | 8 (25.8%) | 10 (12%) | 8 (30.8%) | 10 (11.4%) | ||||
| Risk group | 2 (1, 3) | 2 (1, 3) | 0.35 | 2 (1, 3) | 2 (1, 3) | 0.07 | 2 (1, 3) | 2 (1, 3) | 0.15 | |
| MRD day 15 | 2 (2, 3) | 2 (2, 2) | 0.20 | 2 (2, 3) | 2 (1, 2) | 0.05 | 2 (2, 3) | 2 (2, 2) | 0.16 | |
| ETV6::RUNX1 | 0 (0%) | 27 (27.3%) | 0.02 | 5 (16.1%) | 22 (26.5%) | 0.33 | 3 (11.5%) | 24 (27.3%) | 0.12 | |
| Diagnosis CD20 MFI >8.08 | Day 15 CD20 MFI >19.99 | Day 15 CD20 MFI >28.65 | ||||
|---|---|---|---|---|---|---|
| Variable | HR (95% CI) | p-Value | HR (95% CI) | p-Value | HR (95% CI) | p-Value |
| Over 6 years at diagnosis | 15.25 (4.47, 52.05) | <0.0001 | 4.33 (1.49, 12.59) | <0.01 | 4.19 (1.46, 12.06) | <0.01 |
| Leukocytes | 7.23 (2.5, 20.93) | <0.001 | 3.93 (1.35, 11.39) | 0.01 | 3.7 (1.29, 10.6) | 0.01 |
| PPR | 6.08 (2.02, 18.33) | <0.01 | 3.18 (1.09, 9.28) | 0.03 | 2.84 (0.97, 8.34) | 0.06 |
| Risk group | 6.92 (2.37, 20.16) | <0.001 | 2.98 (1.02, 8.68) | 0.05 | 2.86 (0.99, 8.25) | 0.05 |
| MRD day 15 | 6.33 (2.13, 18.8) | <0.001 | 2.82 (0.95, 8.42) | 0.06 | 2.77 (0.94, 8.18) | 0.07 |
| ETV6::RUNX1 | 5.68 (1.98, 16.29) | <0.01 | 3.45 (1.20, 9.96) | 0.02 | 3.11 (1.09, 8.87) | 0.03 |
| Diagnosis CD20 MFI >8.08 | Day 15 CD20 MFI >19.99 | Day 15 CD20 MFI >28.65 | ||||
|---|---|---|---|---|---|---|
| Variable | HR (95% CI) | p-Value | HR (95% CI) | p-Value | HR (95% CI) | p-Value |
| Over 6 years at diagnosis | 21.44 (4.49, 102.44) | <0.001 | 4.38 (1.16, 16.55) | 0.03 | 5.73 (1.5, 21.92) | 0.01 |
| Leukocytes | 8.64 (2.26, 33.07) | <0.01 | 4.16 (1.09, 15.91) | 0.04 | 5.03 (1.32, 19.18) | 0.02 |
| PPR | 7.49 (1.88, 29.76) | <0.01 | 3.02 (0.8, 11.47) | 0.10 | 3.62 (0.94, 13.99) | 0.06 |
| Risk group | 8.79 (2.31, 33.53) | <0.01 | 2.94 (0.77, 11.13) | 0.11 | 3.75 (0.98, 14.32) | 0.05 |
| MRD day 15 | 8.41 (2.16, 32.84) | <0.01 | 2.9 (0.74, 11.31) | 0.12 | 3.83 (0.98, 14.94) | 0.05 |
| ETV6::RUNX1 | 6.80 (1.81, 25.49) | <0.01 | 3.28 (0.88, 12.27) | 0.08 | 3.90 (1.04, 14.59) | 0.04 |
Disclaimer/Publisher’s Note: The statements, opinions and data contained in all publications are solely those of the individual author(s) and contributor(s) and not of MDPI and/or the editor(s). MDPI and/or the editor(s) disclaim responsibility for any injury to people or property resulting from any ideas, methods, instructions or products referred to in the content. |
© 2023 by the authors. Licensee MDPI, Basel, Switzerland. This article is an open access article distributed under the terms and conditions of the Creative Commons Attribution (CC BY) license (https://creativecommons.org/licenses/by/4.0/).
Share and Cite
Serbanica, A.N.; Popa, D.C.; Caruntu, C.; Pasca, S.; Scheau, C.; Serbanica, I.V.; Suciu, R.; Tica, V.; Busescu, E.; Cima, L.N.; et al. The Significance of CD20 Intensity Variance in Pediatric Patients with B-Cell Precursor Acute Lymphoblastic Leukemia. J. Clin. Med. 2023, 12, 1451. https://doi.org/10.3390/jcm12041451
Serbanica AN, Popa DC, Caruntu C, Pasca S, Scheau C, Serbanica IV, Suciu R, Tica V, Busescu E, Cima LN, et al. The Significance of CD20 Intensity Variance in Pediatric Patients with B-Cell Precursor Acute Lymphoblastic Leukemia. Journal of Clinical Medicine. 2023; 12(4):1451. https://doi.org/10.3390/jcm12041451
Chicago/Turabian StyleSerbanica, Andreea Nicoleta, Delia Codruta Popa, Constantin Caruntu, Sergiu Pasca, Cristian Scheau, Ionut Vlad Serbanica, Raluca Suciu, Valeria Tica, Elisa Busescu, Luminita Nicoleta Cima, and et al. 2023. "The Significance of CD20 Intensity Variance in Pediatric Patients with B-Cell Precursor Acute Lymphoblastic Leukemia" Journal of Clinical Medicine 12, no. 4: 1451. https://doi.org/10.3390/jcm12041451
APA StyleSerbanica, A. N., Popa, D. C., Caruntu, C., Pasca, S., Scheau, C., Serbanica, I. V., Suciu, R., Tica, V., Busescu, E., Cima, L. N., Jardan, C., Dragomir, M., Coriu, D., Colita, A., & Colita, A. (2023). The Significance of CD20 Intensity Variance in Pediatric Patients with B-Cell Precursor Acute Lymphoblastic Leukemia. Journal of Clinical Medicine, 12(4), 1451. https://doi.org/10.3390/jcm12041451