
The Impact of Pre-Chemotherapy Body Composition and Immunonutritional Markers on Chemotherapy Adherence in Stage III Colorectal Cancer Patients

 , , , ,
Abstract
1. Introduction
2. Materials and Methods
2.1. Study Population
2.2. Chemotherapy Adherence and Outcomes
2.3. Markers and Parameters of Nutrition and Inflammation-Related CRC
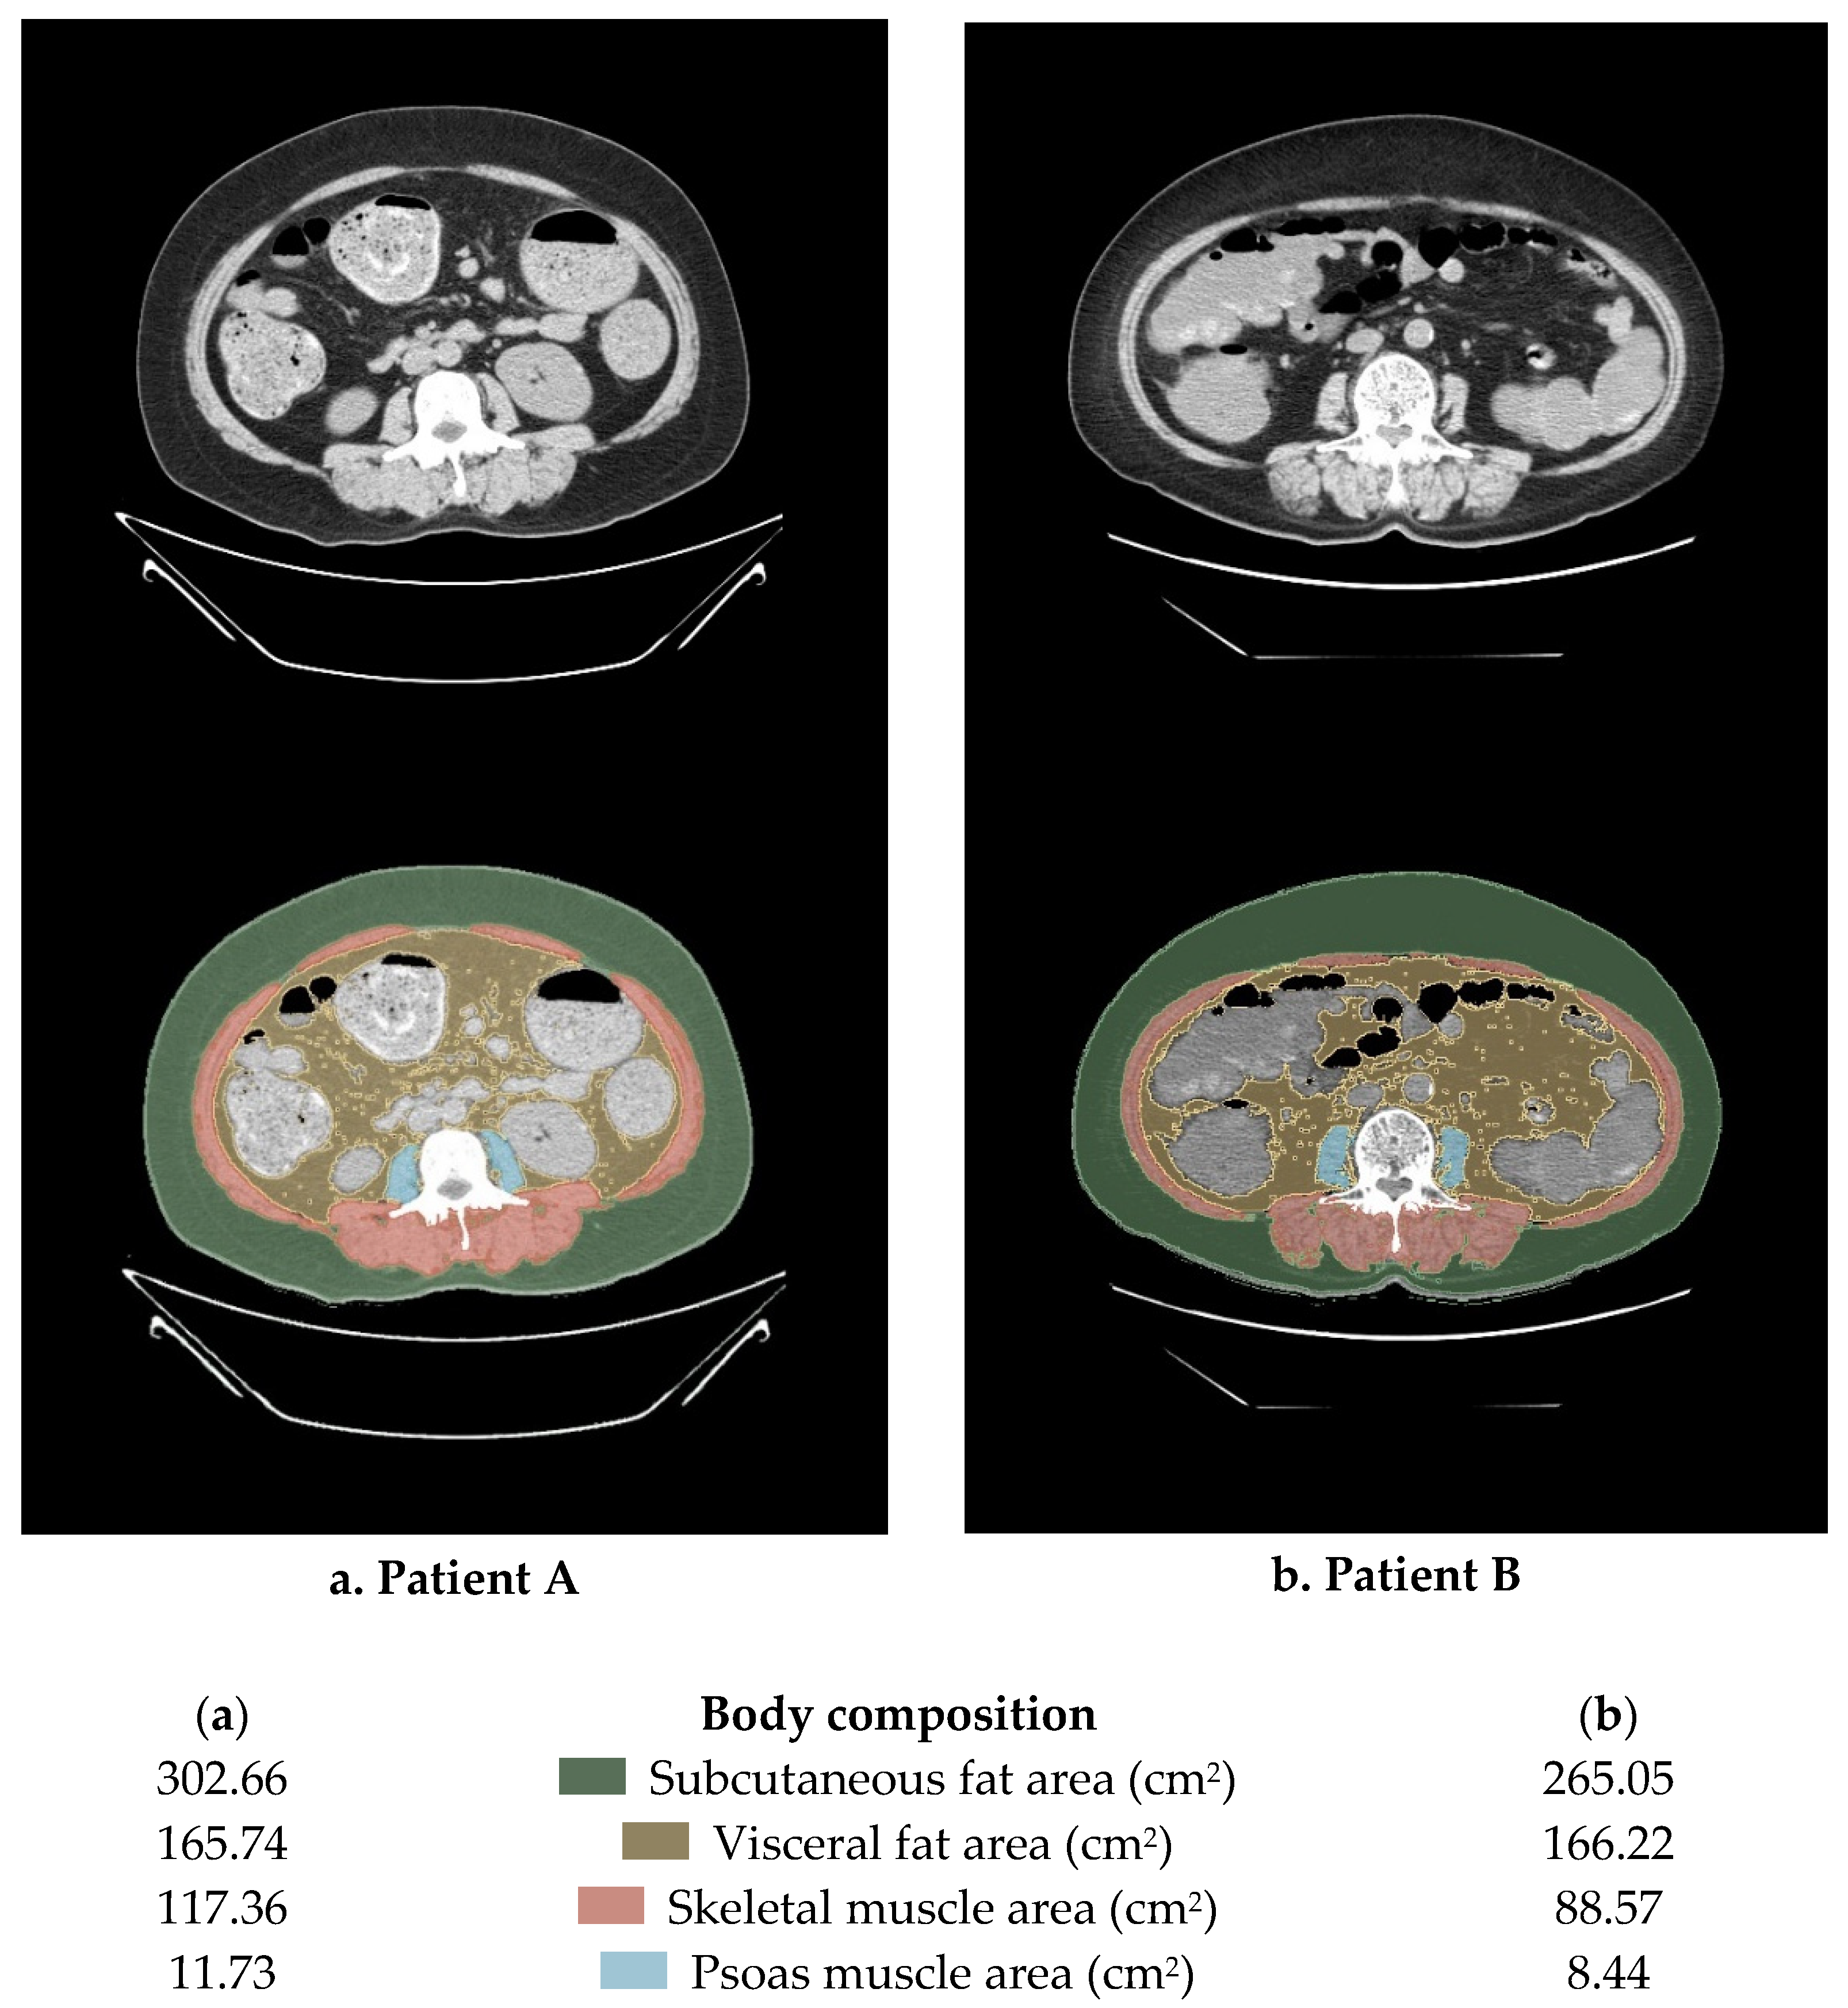
2.4. Measures of Body Composition
2.5. Statistical Analysis
3. Results
4. Discussion
5. Conclusions
Supplementary Materials
Author Contributions
Funding
Institutional Review Board Statement
Informed Consent Statement
Data Availability Statement
Conflicts of Interest
References
- Siegel, R.L.; Miller, K.D.; Fuchs, H.E.; Jemal, A. Cancer Statistics, 2021. CA Cancer J. Clin. 2021, 71, 7–33. [Google Scholar] [CrossRef]
- Yoshino, T.; Argilés, G.; Oki, E.; Martinelli, E.; Taniguchi, H.; Arnold, D.; Mishima, S.; Li, Y.; Smruti, B.; Ahn, J.; et al. Pan-Asian adapted ESMO Clinical Practice Guidelines for the diagnosis treatment and follow-up of patients with localised colon cancer. Ann. Oncol. 2021, 32, 1496–1510. [Google Scholar] [CrossRef] [PubMed]
- Luo, X.-J.; Zhao, Q.; Liu, J.; Zheng, J.-B.; Qiu, M.-Z.; Ju, H.-Q.; Xu, R.-H. Novel Genetic and Epigenetic Biomarkers of Prognostic and Predictive Significance in Stage II/III Colorectal Cancer. Mol. Ther. 2020, 29, 587–596. [Google Scholar] [CrossRef] [PubMed]
- Gunderson, L.L.; Jessup, J.M.; Sargent, D.J.; Greene, F.L.; Stewart, A.K. Revised TN Categorization for Colon Cancer Based on National Survival Outcomes Data. J. Clin. Oncol. 2010, 28, 264–271. [Google Scholar] [CrossRef] [PubMed]
- Mari, G.M.; The AIMS Academy Clinical Research Network; Maggioni, D.; Crippa, J.; Costanzi, A.T.M.; Scotti, M.A.; Giardini, V.; Garancini, M.; Cocozza, E.; Borroni, G.; et al. Compliance to Adjuvant Chemotherapy of Patients Who Underwent Surgery for Rectal Cancer: Report from a Multi-institutional Research Network. World J. Surg. 2019, 43, 2544–2551. [Google Scholar] [CrossRef]
- Soubeyran, P.; Fonck, M.; Blanc-Bisson, C.; Blanc, J.-F.; Ceccaldi, J.; Mertens, C.; Imbert, Y.; Cany, L.; Vogt, L.; Dauba, J.; et al. Predictors of Early Death Risk in Older Patients Treated With First-Line Chemotherapy for Cancer. J. Clin. Oncol. 2012, 30, 1829–1834. [Google Scholar] [CrossRef]
- Dotan, E.; Tew, W.P.; Mohile, S.G.; Ma, H.; Kim, H.; Sun, C.; Caan, B.; Dale, W.; Gajra, A.; Klepin, H.D.; et al. Associations between nutritional factors and chemotherapy toxicity in older adults with solid tumors. Cancer 2020, 126, 1708–1716. [Google Scholar] [CrossRef]
- Miller, L.J.; Douglas, C.; McCullough, F.S.; Stanworth, S.J.; Calder, P.C. Impact of enteral immunonutrition on infectious complications and immune and inflammatory markers in cancer patients undergoing chemotherapy: A systematic review of randomised controlled trials. Clin. Nutr. 2022, 41, 2135–2146. [Google Scholar] [CrossRef]
- Bracci, L.; Schiavoni, G.; Sistigu, A.; Belardelli, F. Immune-based mechanisms of cytotoxic chemotherapy: Implications for the design of novel and rationale-based combined treatments against cancer. Cell Death Differ. 2013, 21, 15–25. [Google Scholar] [CrossRef]
- Sawyer, M.; Ratain, M.J. Body Surface Area as a Determinant of Pharmacokinetics and Drug Dosing. Investig. New Drugs 2001, 19, 171–177. [Google Scholar] [CrossRef]
- Ali, R.; Baracos, V.E.; Sawyer, M.B.; Bianchi, L.; Roberts, S.; Assenat, E.; Mollevi, C.; Senesse, P. Lean body mass as an independent determinant of dose-limiting toxicity and neuropathy in patients with colon cancer treated with FOLFOX regimens. Cancer Med. 2016, 5, 607–616. [Google Scholar] [CrossRef]
- Usiskin, I.; Li, F.; Irwin, M.L.; Cartmel, B.; Sanft, T. Association of relative dose intensity with BMI and pathologic complete response in patients treated with neoadjuvant chemotherapy for breast cancer. Breast Cancer Res. Treat. 2020, 186, 191–197. [Google Scholar] [CrossRef]
- Brown, J.C.; Meyerhardt, J.A.; Feliciano, E.M.C.; Cheng, E.; Caan, B.J. The association of abdominal adiposity with premature discontinuation of postoperative chemotherapy in colon cancer. Clin. Nutr. 2022, 41, 1600–1604. [Google Scholar] [CrossRef]
- Lee, D.-W.; Cho, S.; Shin, A.; Han, S.-W.; Kim, T.-Y. Body mass index and body weight change during adjuvant chemotherapy in colon cancer patients: Results from the AVANT trial. Sci. Rep. 2020, 10, 19467. [Google Scholar] [CrossRef]
- Takagi, K.; Buettner, S.; Ijzermans, J.N. Prognostic significance of the controlling nutritional status (CONUT) score in patients with colorectal cancer: A systematic review and meta-analysis. Int. J. Surg. 2020, 78, 91–96. [Google Scholar] [CrossRef]
- Peng, J.; Zhang, R.; Zhao, Y.; Wu, X.; Chen, G.; Wan, D.; Lu, Z.; Pan, Z. Prognostic value of preoperative prognostic nutritional index and its associations with systemic inflammatory response markers in patients with stage III colon cancer. Chin. J. Cancer 2017, 36, 96. [Google Scholar] [CrossRef]
- Fujiwara, N.; Nakagawa, H.; Kudo, Y.; Tateishi, R.; Taguri, M.; Watadani, T.; Nakagomi, R.; Kondo, M.; Nakatsuka, T.; Minami, T.; et al. Sarcopenia, intramuscular fat deposition, and visceral adiposity independently predict the outcomes of hepatocellular carcinoma. J. Hepatol. 2015, 63, 131–140. [Google Scholar] [CrossRef]
- Pedersen, B.K.; Febbraio, M.A. Muscles, exercise and obesity: Skeletal muscle as a secretory organ. Nat. Rev. Endocrinol. 2012, 8, 457–465. [Google Scholar] [CrossRef] [PubMed]
- Frontera, W.R.; Ochala, J. Skeletal Muscle: A Brief Review of Structure and Function. Calcif. Tissue Int. 2015, 96, 183–195. [Google Scholar] [CrossRef] [PubMed]
- Prado, C.M.M.; Liefers, J.R.; McCargar, L.J.; Reiman, T.; Sawyer, M.B.; Martin, L.; Baracos, V.E. Prevalence and clinical implications of sarcopenic obesity in patients with solid tumours of the respiratory and gastrointestinal tracts: A population-based study. Lancet Oncol. 2008, 9, 629–635. [Google Scholar] [CrossRef] [PubMed]
- Brown, J.C.; Caan, B.J.; Meyerhardt, J.A.; Weltzien, E.; Xiao, J.; Feliciano, E.M.C.; Kroenke, C.H.; Castillo, A.; Kwan, M.L.; Prado, C.M. The deterioration of muscle mass and radiodensity is prognostic of poor survival in stage I-III colorectal cancer: A population-based cohort study (C-SCANS). J. Cachexia Sarcopenia Muscle 2018, 9, 664–672. [Google Scholar] [CrossRef]
- Barreto, R.; Waning, D.L.; Gao, H.Y.; Liu, Y.L.; Zimmers, T.A.; Bonetto, A. Chemotherapy-Related cachexia is associated with mitochondrial depletion and the activation of ERK1/2 and p38 MAPKs. Oncotarget 2016, 7, 43442–43460. [Google Scholar] [CrossRef] [PubMed]
- Waning, D.L.; Mohammad, K.S.; Reiken, S.; Xie, W.; Andersson, D.C.; John, S.; Chiechi, A.; Wright, L.E.; Umanskaya, A.; Niewolna, M.; et al. Excess TGF-beta mediates muscle weakness associated with bone metastases in mice. Nat. Med. 2015, 21, 1262–1271. [Google Scholar] [CrossRef] [PubMed]
- Feliciano, E.M.C.; Lee, V.S.; Prado, C.M.; Meyerhardt, J.A.; Alexeeff, S.; Kroenke, C.H.; Xiao, J.; Rd, A.L.C.; Caan, B. Muscle mass at the time of diagnosis of nonmetastatic colon cancer and early discontinuation of chemotherapy, delays, and dose reductions on adjuvant FOLFOX: The C-SCANS study. Cancer 2017, 123, 4868–4877. [Google Scholar] [CrossRef] [PubMed]
- Prado, C.M.; Purcell, S.A.; Laviano, A. Nutrition interventions to treat low muscle mass in cancer. J. Cachex- Sarcopenia Muscle 2020, 11, 366–380. [Google Scholar] [CrossRef]
- Gourdier, I.; Crabbe, L.; Andreau, K.; Pau, B.; Kroemer, G. Oxaliplatin-induced mitochondrial apoptotic response of colon carcinoma cells does not require nuclear DNA. Oncogene 2004, 23, 7449–7457. [Google Scholar] [CrossRef]
- Vanderveen, B.N.; Sougiannis, A.T.; Velazquez, K.T.; Carson, J.A.; Fan, D.; Murphy, E.A. The Acute Effects of 5 Fluorouracil on Skeletal Muscle Resident and Infiltrating Immune Cells in Mice. Front. Physiol. 2020, 11, 593468. [Google Scholar] [CrossRef]
- Bruno, K.D.A.; da Silva, M.J.S.; Chaves, G.V. Association of body composition with toxicity to first-line chemotherapy and three-year survival in women with ovarian adenocarcinoma. Acta Oncol. 2021, 60, 1611–1620. [Google Scholar] [CrossRef] [PubMed]
- Jung, H.-W.; Kim, J.W.; Kim, J.-Y.; Kim, S.-W.; Yang, H.K.; Lee, J.W.; Lee, K.-W.; Kim, D.-W.; Kang, S.-B.; Kim, K.-I.; et al. Effect of muscle mass on toxicity and survival in patients with colon cancer undergoing adjuvant chemotherapy. Support. Care Cancer 2014, 23, 687–694. [Google Scholar] [CrossRef]
- Benedek, Z.; Todor-Boér, S.; Kocsis, L.; Bauer, O.; Suciu, N.; Coroș, M. Psoas Muscle Index Defined by Computer Tomography Predicts the Presence of Postoperative Complications in Colorectal Cancer Surgery. Medicina 2021, 57, 472. [Google Scholar] [CrossRef]
- Miyata, H.; Sugimura, K.; Motoori, M.; Fujiwara, Y.; Omori, T.; Yanagimoto, Y.; Ohue, M.; Yasui, M.; Miyoshi, N.; Tomokuni, A.; et al. Clinical Assessment of Sarcopenia and Changes in Body Composition During Neoadjuvant Chemotherapy for Esophageal Cancer. Anticancer. Res. 2017, 37, 3053–3059. [Google Scholar] [CrossRef] [PubMed]
- Wajchenberg, B.L. Subcutaneous and visceral adipose tissue: Their relation to the metabolic syndrome. Endocr. Rev. 2000, 21, 697–738. [Google Scholar] [CrossRef]
- Feliciano, E.M.C.; Chen, W.Y.; Lee, V.; Albers, K.B.; Prado, C.M.; Alexeeff, S.; Xiao, J.; Shachar, S.S.; Caan, B. Body Composition, Adherence to Anthracycline and Taxane-Based Chemotherapy, and Survival After Nonmetastatic Breast Cancer. JAMA Oncol. 2020, 6, 264–270. [Google Scholar] [CrossRef] [PubMed]
- Yamamoto, N.; Fujii, S.; Sato, T.; Oshima, T.; Rino, Y.; Kunisaki, C.; Masuda, M.; Imada, T. Impact of body mass index and visceral adiposity on outcomes in colorectal cancer. Asia-Pacific J. Clin. Oncol. 2012, 8, 337–345. [Google Scholar] [CrossRef] [PubMed]
- Kim, J.-M.; Chung, E.; Cho, E.-S.; Lee, J.-H.; Shin, S.-J.; Lee, H.S.; Park, E.J.; Baik, S.H.; Lee, K.Y.; Kang, J. Impact of subcutaneous and visceral fat adiposity in patients with colorectal cancer. Clin. Nutr. 2021, 40, 5631–5638. [Google Scholar] [CrossRef]
- Chiara, S.; Nobile, M.T.; Vincenti, M.; Lionetto, R.; Gozza, A.; Barzacchi, M.C.; Sanguineti, O.; Repetto, L.; Rosso, R. Advanced colorectal cancer in the elderly: Results of consecutive trials with 5-fluorouracil-based chemotherapy. Cancer Chemother. Pharmacol. 1998, 42, 336–340. [Google Scholar] [CrossRef]
- Feliciano, E.M.C.; Kroenke, C.H.; Meyerhardt, J.A.; Prado, C.M.; Bradshaw, P.T.; Kwan, M.L.; Xiao, J.; Alexeeff, S.; Corley, D.; Weltzien, E.; et al. Association of Systemic Inflammation and Sarcopenia with Survival in Nonmetastatic Colorectal Cancer Results from the C SCANS Study. Jama Oncol. 2017, 3, e172319. [Google Scholar] [CrossRef]


| Characteristics | Overall (n = 107) | Low RDI (n = 22) | High RDI (n = 85) | p-Value | OR (95% CI) | |
|---|---|---|---|---|---|---|
| (No (%)) | (No (%)) | (No (%)) | ||||
| Age | ≥65 | 56 (52.3) | 17 (77.3) | 39 (45.9) | 0.009 | 4.010 (1.356–11.863) |
| <65 | 51 (47.7) | 5 (22.7) | 46 (54.1) | |||
| Sex | Male | 53 (49.5) | 10 (45.5) | 43 (50.6) | 0.668 | 0.814 (0.318–2.085) |
| Female | 54 (50.5) | 12 (54.5) | 42 (49.4) | |||
| DM | Yes | 31 (29.0) | 7 (31.8) | 24 (28.2) | 0.741 | 1.186 (0.430–3.269) |
| No | 76 (71.0) | 15 (68.2) | 61 (71.8) | |||
| HTN | Yes | 43 (40.2) | 8 (36.4) | 35 (41.2) | 0.682 | 0.816 (0.309–2.154) |
| No | 64 (59.8) | 14 (63.6) | 50 (58.8) | |||
| Pre-chemotherapy BMI (kg/m2) | Underweight (<18.5) | 8 (7.5) | 2 (9.1) | 6 (7.1) | 0.949 | - |
| Normal (18.5–24.9) | 74 (69.2) | 15 (68.2) | 59 (69.4) | |||
| Obese (≥25.0) | 25 (23.4) | 5 (22.7) | 20 (23.5) | |||
| Tumor location 1 | Right side | 34 (31.8) | 9 (40.9) | 25 (29.4) | 0.302 | 0.602 (0.228–1.587) |
| Left side | 73 (68.2) | 13 (59.1) | 60 (70.6) | |||
| Name of operation | Right hemicolectomy | 32 (29.9) | 9 (40.9) | 23 (27.1) | 0.361 | - |
| Transverse colectomy | 2 (1.9) | 0 (0.0) | 2 (2.4) | |||
| Left hemicolectomy | 4 (3.7) | 1 (4.5) | 3 (3.5) | |||
| Anterior resection | 43 (40.2) | 6 (27.3) | 37 (43.5) | |||
| Low anterior resection | 25 (23.4) | 6 (27.3) | 19 (22.3) | |||
| Hartmann’s operation | 1 (0.9) | 0 (0.0) | 1 (1.2) | |||
| Presence of stoma | Yes | 14 (13.1) | 4 (18.2) | 10 (11.8) | 0.431 | 1.667 (0.469–5.926) |
| No | 93 (86.9) | 18 (81.8) | 75 (88.2) | |||
| Stage III risk 2 | Low risk | 67 (62.6) | 14 (63.6) | 53 (62.4) | 0.912 | 0.946 (0.358–2.505) |
| High risk | 40 (37.4) | 8 (36.4) | 32 (37.6) | |||
| Lymphatic invasion | Yes | 46 (43.0) | 10 (45.5) | 36 (42.4) | 0.793 | 1.134 (0.442–2.913) |
| No | 61 (57.0) | 12 (54.5) | 49 (57.6) | |||
| Venous invasion | Yes | 18 (16.8) | 7 (31.8) | 11 (12.9) | 0.052 | 3.139 (1.047–9.414) |
| No | 89 (83.2) | 15 (68.2) | 74 (87.1) | |||
| Perineural invasion | Yes | 41 (38.3) | 7 (31.8) | 34 (40.0) | 0.482 | 0.700 (0.258–1.896) |
| No | 66 (61.7) | 15 (68.2) | 51 (60.0) | |||
| CEA (ng/mL) | Median (range) | 9.83 (0.54–164.60) | 6.69 (1.06–40.97) | 10.64 (0.54–164.60) | 0.429 | 0.794 (−5.92–13.83) |
| CA19-9 (U/mL) | Median (range) | 85.87 (0.60–7098.0) | 14.77 (0.60–54.64) | 104.94 (0.60–7098.0) | 0.591 | 0.539 (−81.77–262.12) |
| Variable | Low RDI | High RDI | p-Value | |
|---|---|---|---|---|
| (Mean ± SD) | (Mean ± SD) | |||
| Total protein (g/dL) | 6.57 ± 0.40 | 6.85 ± 0.44 | 0.010 | |
| Serum albumin (g/dL) | 3.85 ± 0.30 | 4.05 ± 0.34 | 0.005 | |
| Total cholesterol (mg/dL) | 156.09 ± 39.41 | 175.52 ± 38.67 | 0.070 | |
| Hemoglobin (g/dL) | 11.86 ± 1.39 | 11.94 ± 1.36 | 0.686 | |
| WBC count (103/µL) | 5.61 ± 1.71 | 6.81 ± 2.05 | 0.013 | |
| Pre-chemotherapy CONUT score 1 (N (%)) | Normal (0–1) | 18 (81.8) | 76 (89.4) | 0.462 |
| High (≥2) | 4 (18.2) | 9 (10.6) | ||
| PNI | 70.02 ± 105.73 | 50.15 ± 4.94 | 0.072 | |
| NLR | 2.28 ± 2.25 | 2.32 ± 1.17 | 0.903 | |
| PLR | 206.45 ± 167.47 | 185.63 ± 85.82 | 0.419 | |
| SFI (cm2/m2) | 60.33 ± 23.93 | 58.55 ± 28.66 | 0.595 | |
| VFI (cm2/m2) | 51.56 ± 27.44 | 47.65 ± 26.48 | 0.541 | |
| TFI (cm2/m2) | 111.90 ± 45.96 | 106.20 ± 46.25 | 0.649 | |
| Visceral–subcutaneous Fat ratio | 0.90 ± 0.44 | 0.89 ± 0.51 | 0.635 | |
| SMI (cm2/m2) | 39.71 ± 7.62 | 44.63 ± 8.82 | 0.037 | |
| PMI (cm2/m2) | 4.39 ± 0.97 | 5.60 ± 3.86 | 0.024 |
| Variable | Univariate Analysis | Multivariate Analysis | ||
|---|---|---|---|---|
| OR (95% CI) | p-Value | OR (95% CI) | p-Value | |
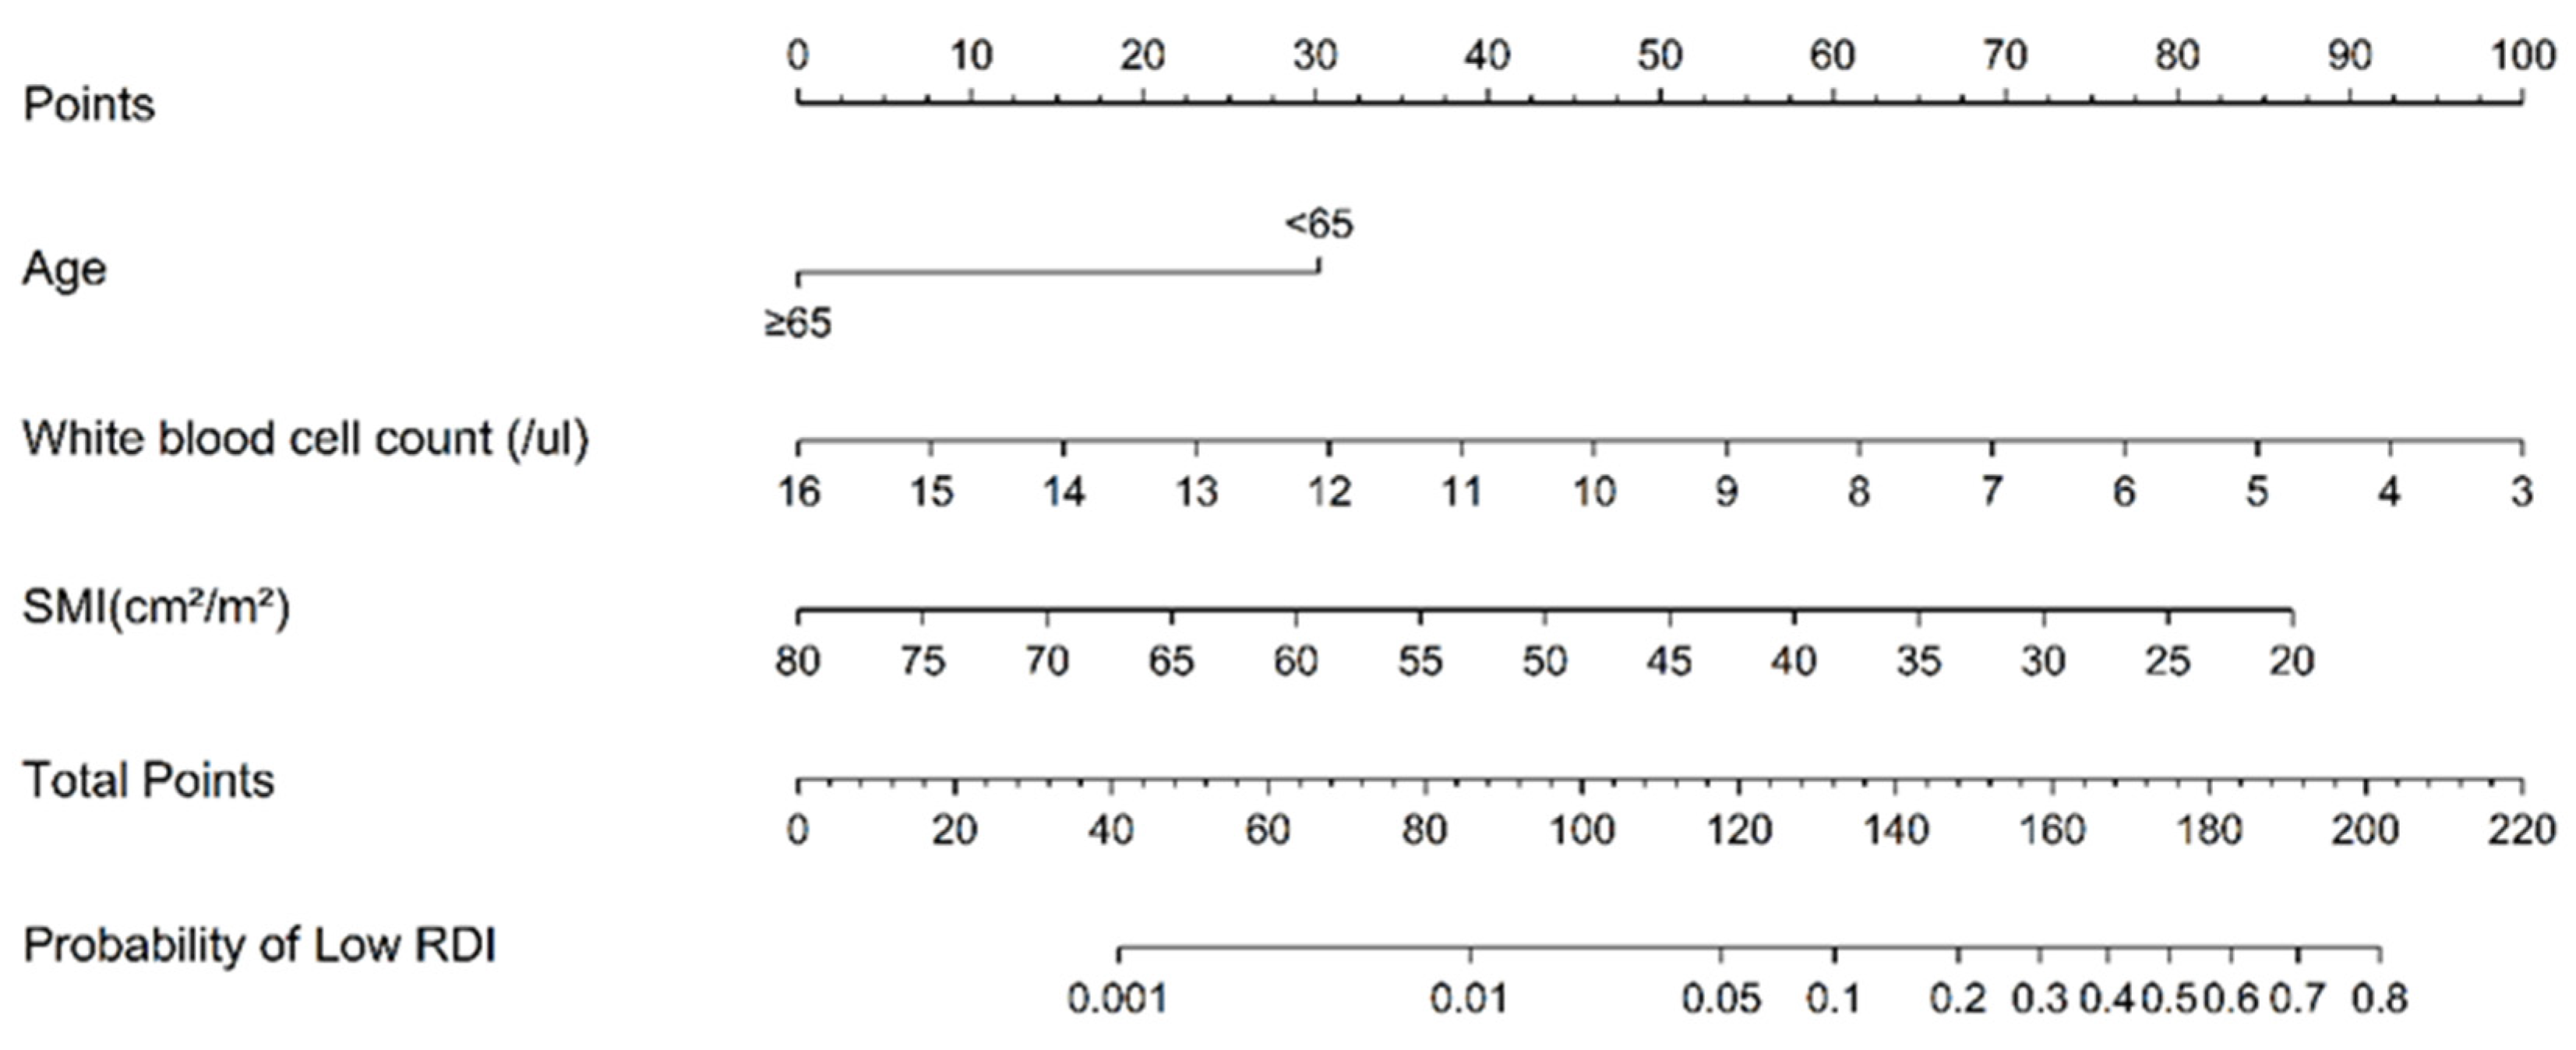
| Age | 4.010 (1.356–11.863) | 0.012 | 3.795 (1.152–12.495) | 0.028 |
| Sex | 0.814 (0.318–2.085) | 0.668 | 0.903 | |
| Pre-chemotherapy—BMI (1) | 0.763 (0.140–4.165) | 0.754 | ||
| Pre-chemotherapy—BMI (2) | 0.750 (0.115–4.898) | 0.764 | ||
| Tumor location | 0.602 (0.228–1.587) | 0.305 | ||
| Stage III risk | 0.946 (0.358–2.505) | 0.912 | ||
| CEA | 0.985 (0.948–1.024) | 0.446 | ||
| CA19-9 | 0.990 (0.964–1.017) | 0.483 | ||
| Total protein (g/dL) | 0.235 (0.075–0.730) | 0.012 | 0.218 | |
| Serum albumin (g/dL) | 0.186 (0.046–0.750) | 0.018 | 0.537 | |
| Total cholesterol (mg/dL) | 0.987 (0.974–1.000) | 0.043 | 0.987 (0.972–1.002) | 0.086 |
| Hemoglobin (g/dL) | 0.958 (0.679–1.352) | 0.808 | ||
| White blood cell count (103/µL) | 0.649 (0.462–0.913) | 0.013 | 0.671 (0.474–0.949) | 0.024 |
| Pre-chemotherapy CONUT score(points) | 1.877 (0.519–6.783) | 0.337 | 0.909 | |
| PNI | 1.007 (0.994–1.021) | 0.281 | ||
| NLR | 0.979 (0.699–1.371) | 0.902 | ||
| PLR | 1.002 (0.998–1.006) | 0.423 | ||
| SFI (cm2/m2) | 1.002 (0.986–1.019) | 0.787 | ||
| VFI (cm2/m2) | 1.005 (0.988–1.023) | 0.538 | ||
| TFI (cm2/m2) | 1.003 (0.993–1.013) | 0.604 | ||
| Visceral–subcutaneous Fat ratio | 1.026 (0.395–2.667) | 0.958 | ||
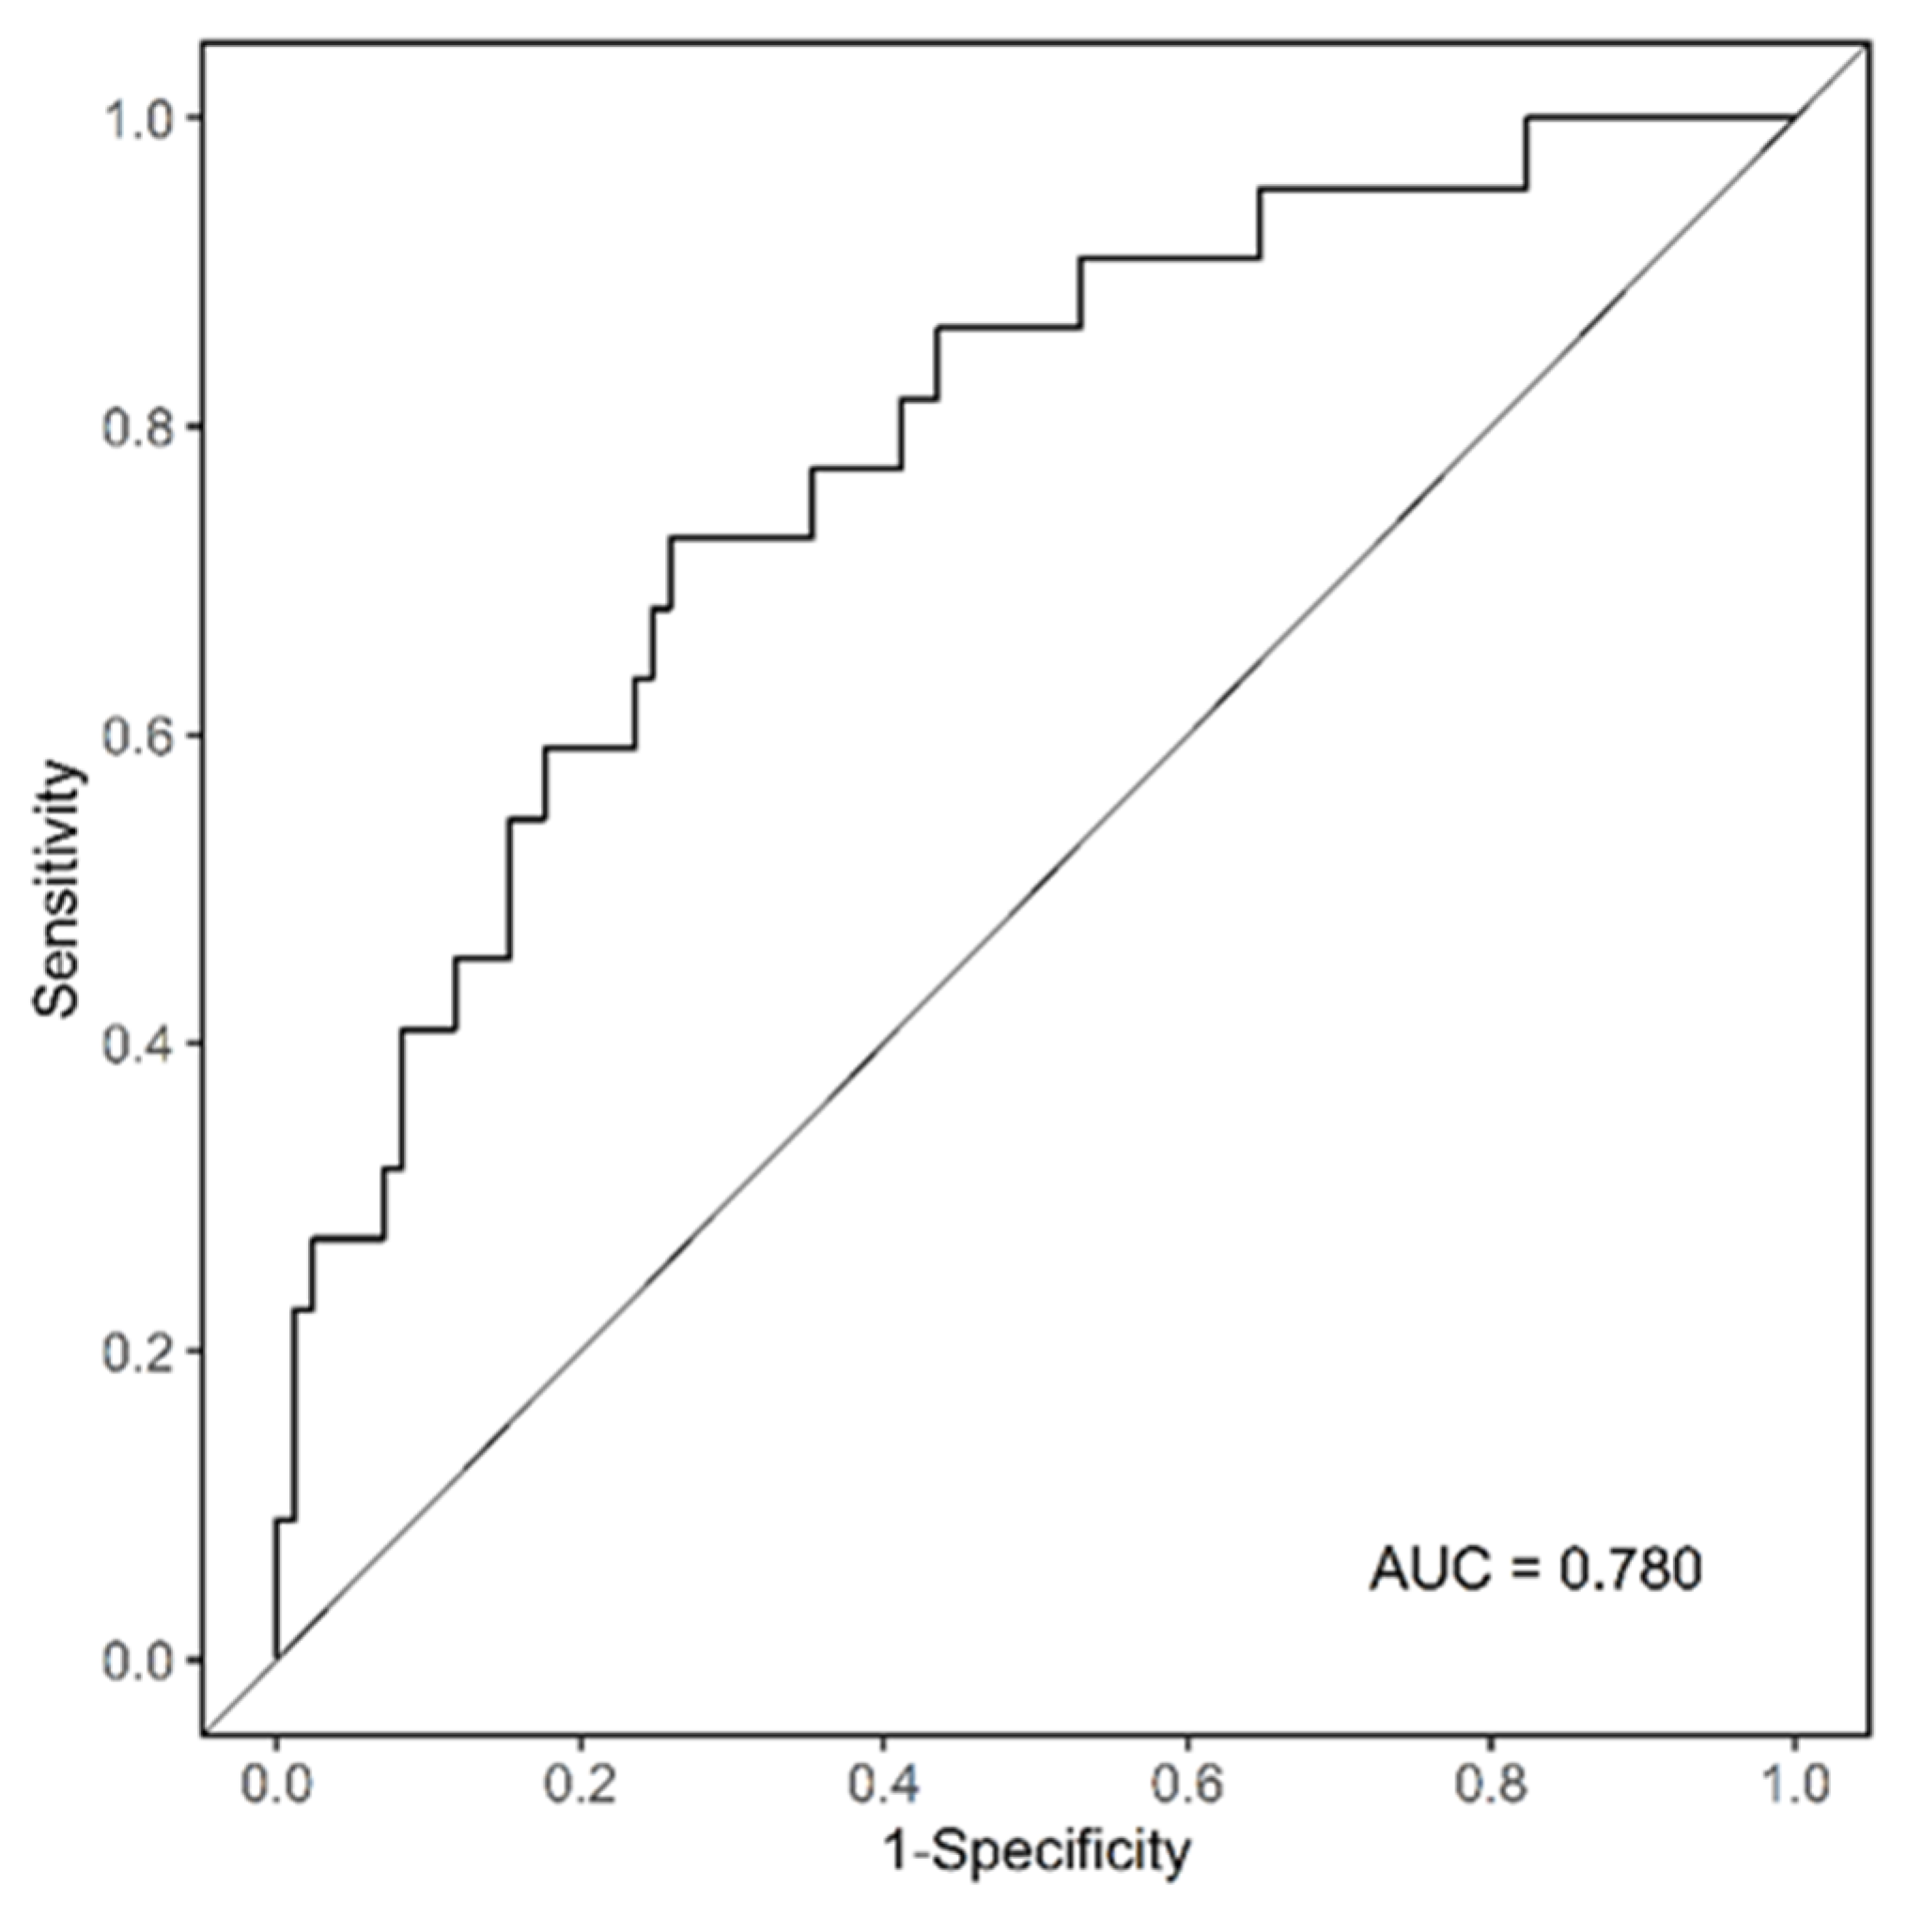
| SMI (cm2/m2) | 0.921 (0.859–0.987) | 0.020 | 0.915 (0.846–0.989) | 0.025 |
| PMI (cm2/m2) | 0.635 (0.425–0.947) | 0.026 | 0.545 | |
Disclaimer/Publisher’s Note: The statements, opinions and data contained in all publications are solely those of the individual author(s) and contributor(s) and not of MDPI and/or the editor(s). MDPI and/or the editor(s) disclaim responsibility for any injury to people or property resulting from any ideas, methods, instructions or products referred to in the content. |
© 2023 by the authors. Licensee MDPI, Basel, Switzerland. This article is an open access article distributed under the terms and conditions of the Creative Commons Attribution (CC BY) license (https://creativecommons.org/licenses/by/4.0/).
Share and Cite
Lee, S.; Kang, D.H.; Ahn, T.S.; Kim, S.S.; Yun, J.H.; Kim, H.J.; Seo, S.H.; Kim, T.W.; Kong, H.J.; Baek, M.J. The Impact of Pre-Chemotherapy Body Composition and Immunonutritional Markers on Chemotherapy Adherence in Stage III Colorectal Cancer Patients. J. Clin. Med. 2023, 12, 1423. https://doi.org/10.3390/jcm12041423
Lee S, Kang DH, Ahn TS, Kim SS, Yun JH, Kim HJ, Seo SH, Kim TW, Kong HJ, Baek MJ. The Impact of Pre-Chemotherapy Body Composition and Immunonutritional Markers on Chemotherapy Adherence in Stage III Colorectal Cancer Patients. Journal of Clinical Medicine. 2023; 12(4):1423. https://doi.org/10.3390/jcm12041423
Chicago/Turabian StyleLee, Soohyeon, Dong Hyun Kang, Tae Sung Ahn, Seung Soo Kim, Jong Hyuk Yun, Hyun Jung Kim, Seoung Hee Seo, Tae Wan Kim, Hye Jeong Kong, and Moo Jun Baek. 2023. "The Impact of Pre-Chemotherapy Body Composition and Immunonutritional Markers on Chemotherapy Adherence in Stage III Colorectal Cancer Patients" Journal of Clinical Medicine 12, no. 4: 1423. https://doi.org/10.3390/jcm12041423
APA StyleLee, S., Kang, D. H., Ahn, T. S., Kim, S. S., Yun, J. H., Kim, H. J., Seo, S. H., Kim, T. W., Kong, H. J., & Baek, M. J. (2023). The Impact of Pre-Chemotherapy Body Composition and Immunonutritional Markers on Chemotherapy Adherence in Stage III Colorectal Cancer Patients. Journal of Clinical Medicine, 12(4), 1423. https://doi.org/10.3390/jcm12041423