Soft- and Hard-Tissue Thicknesses in Patients with Different Vertical Facial Patterns and the Transverse Deficiencies, An Integrated CBCT-3D Digital Model Analysis
Abstract
1. Introduction
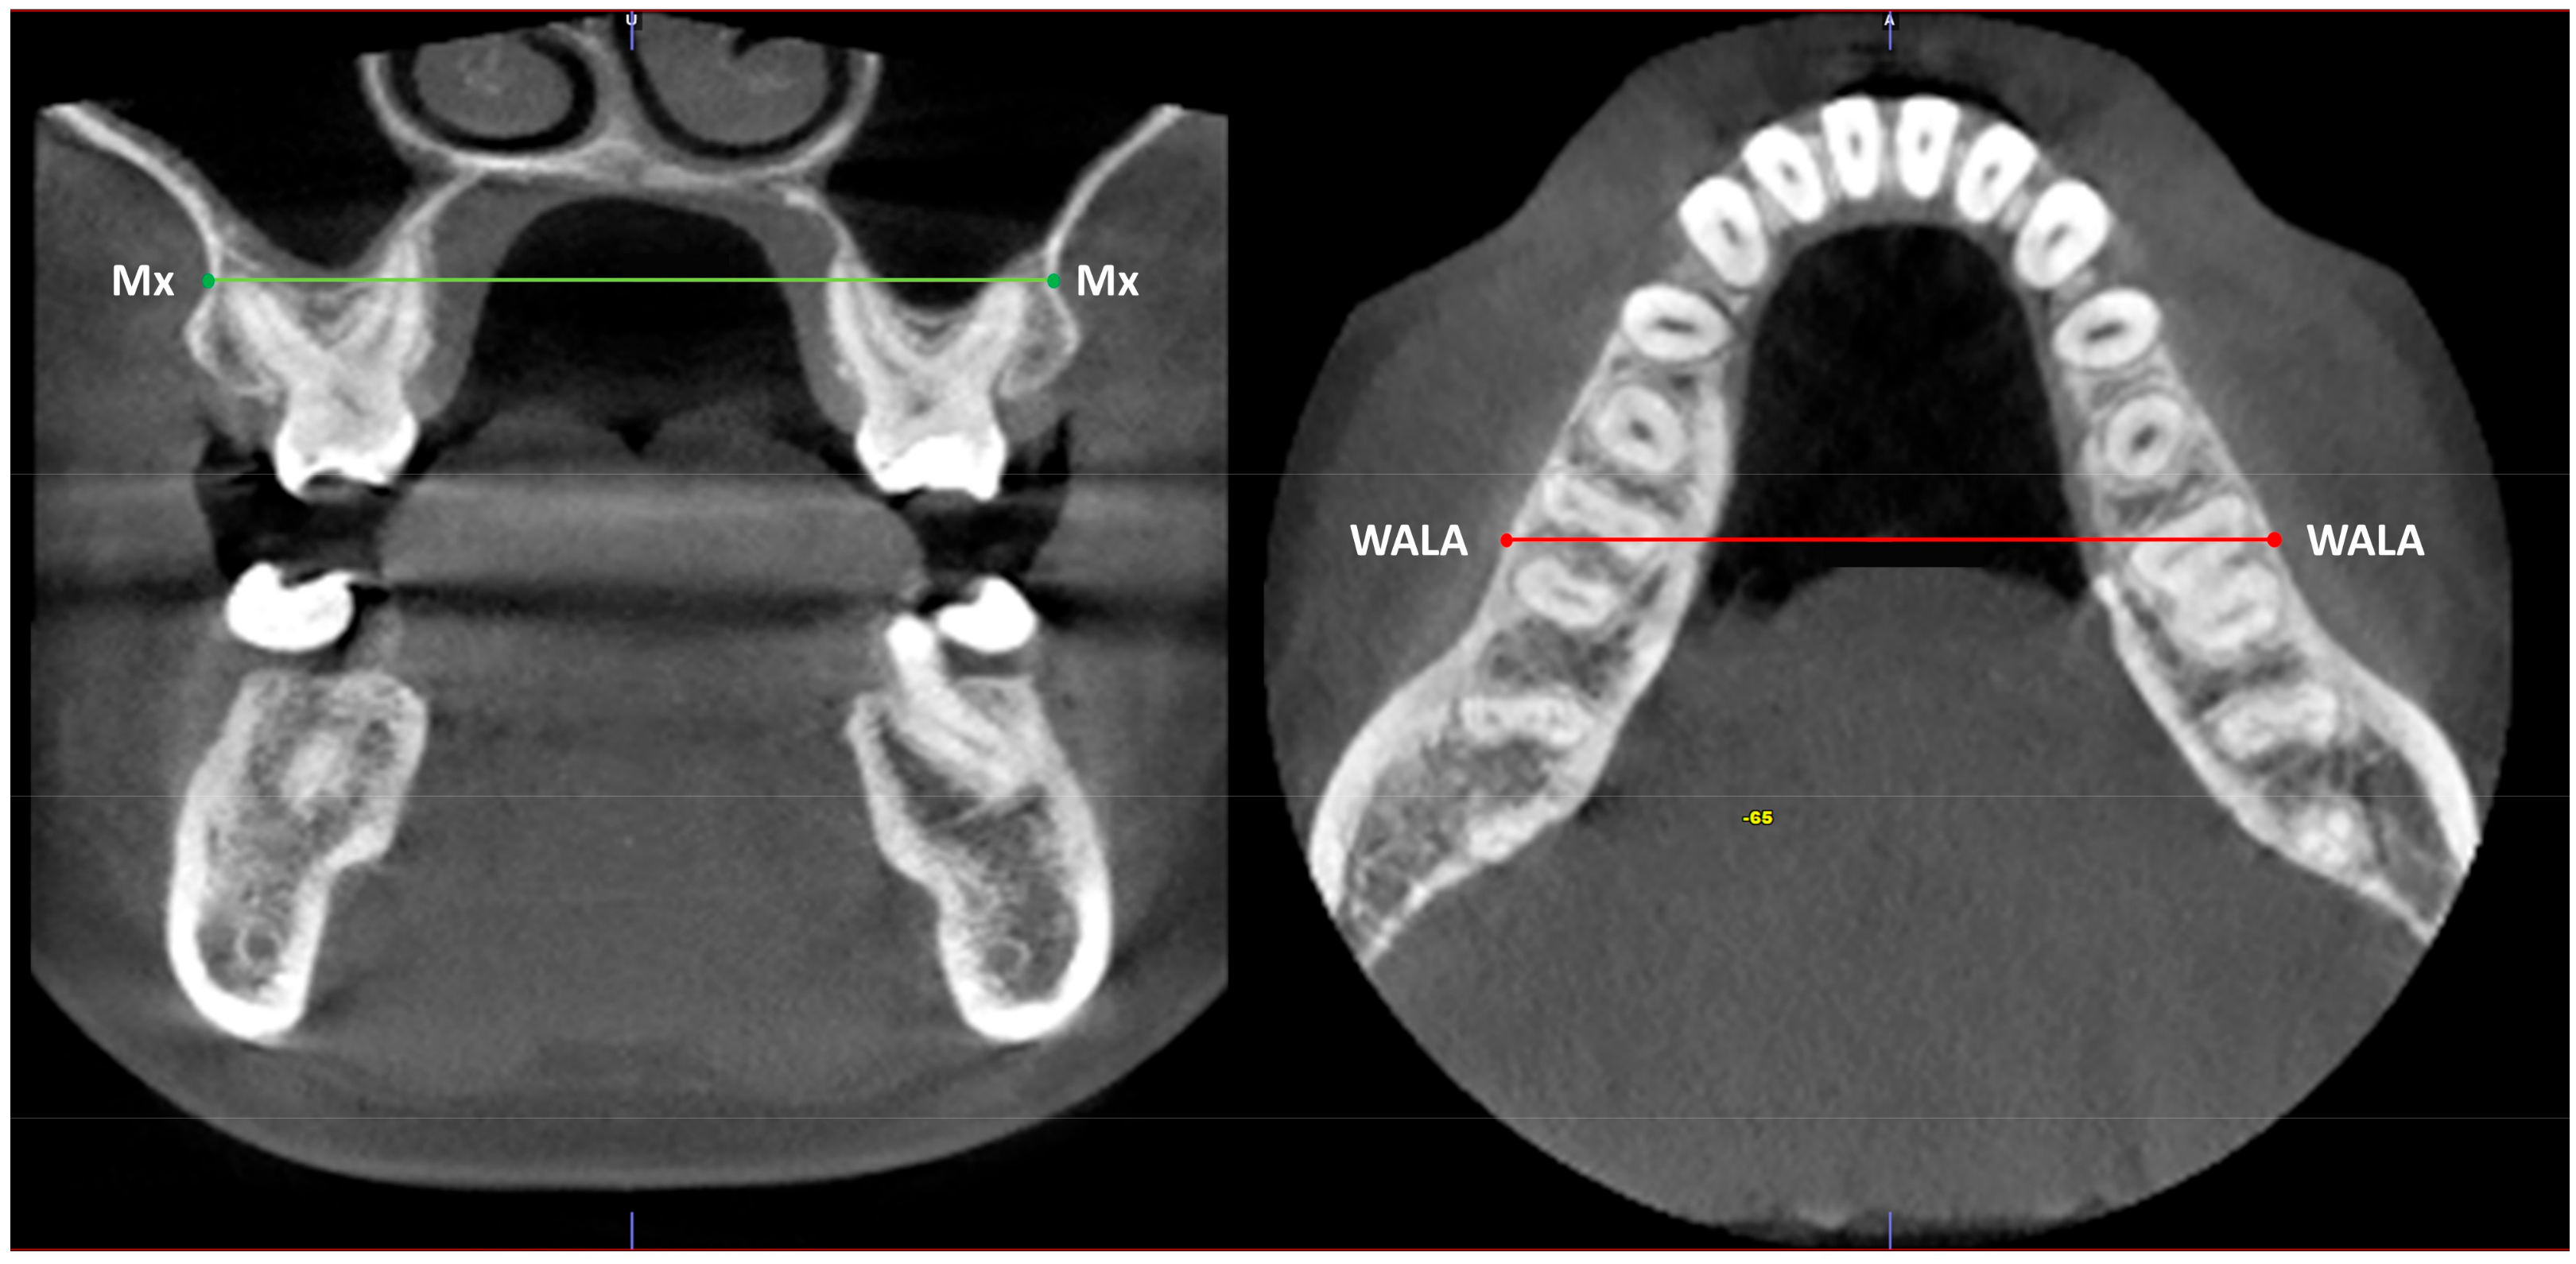
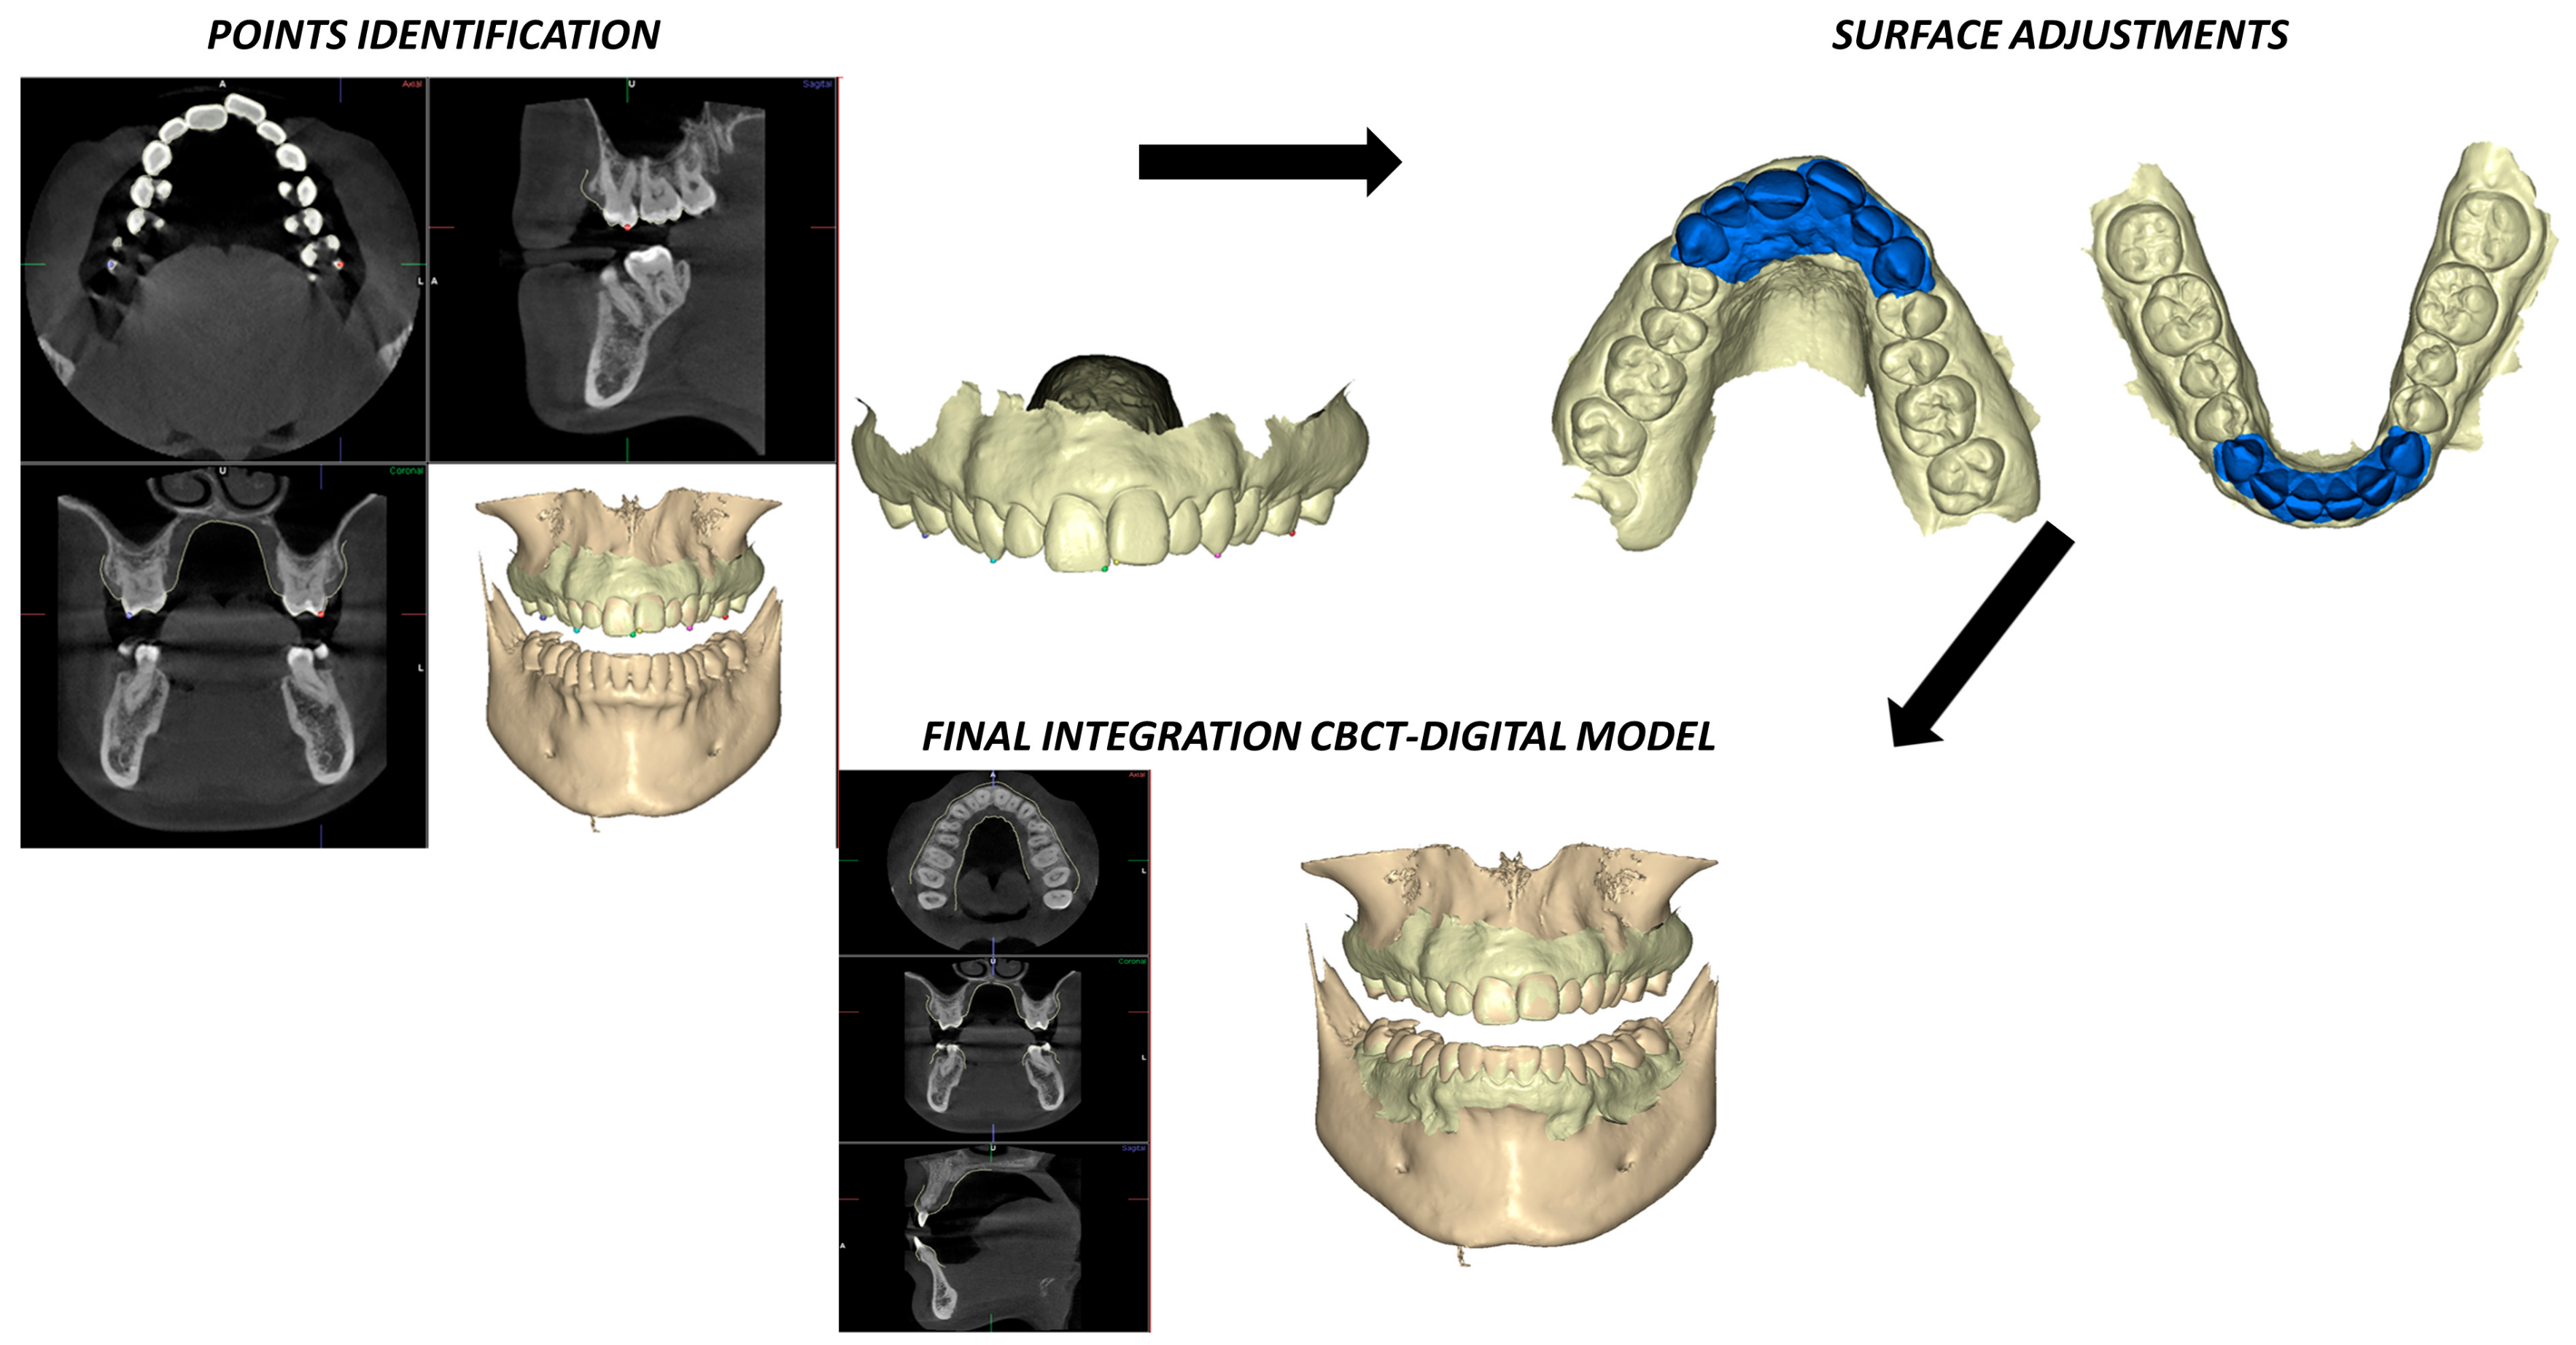
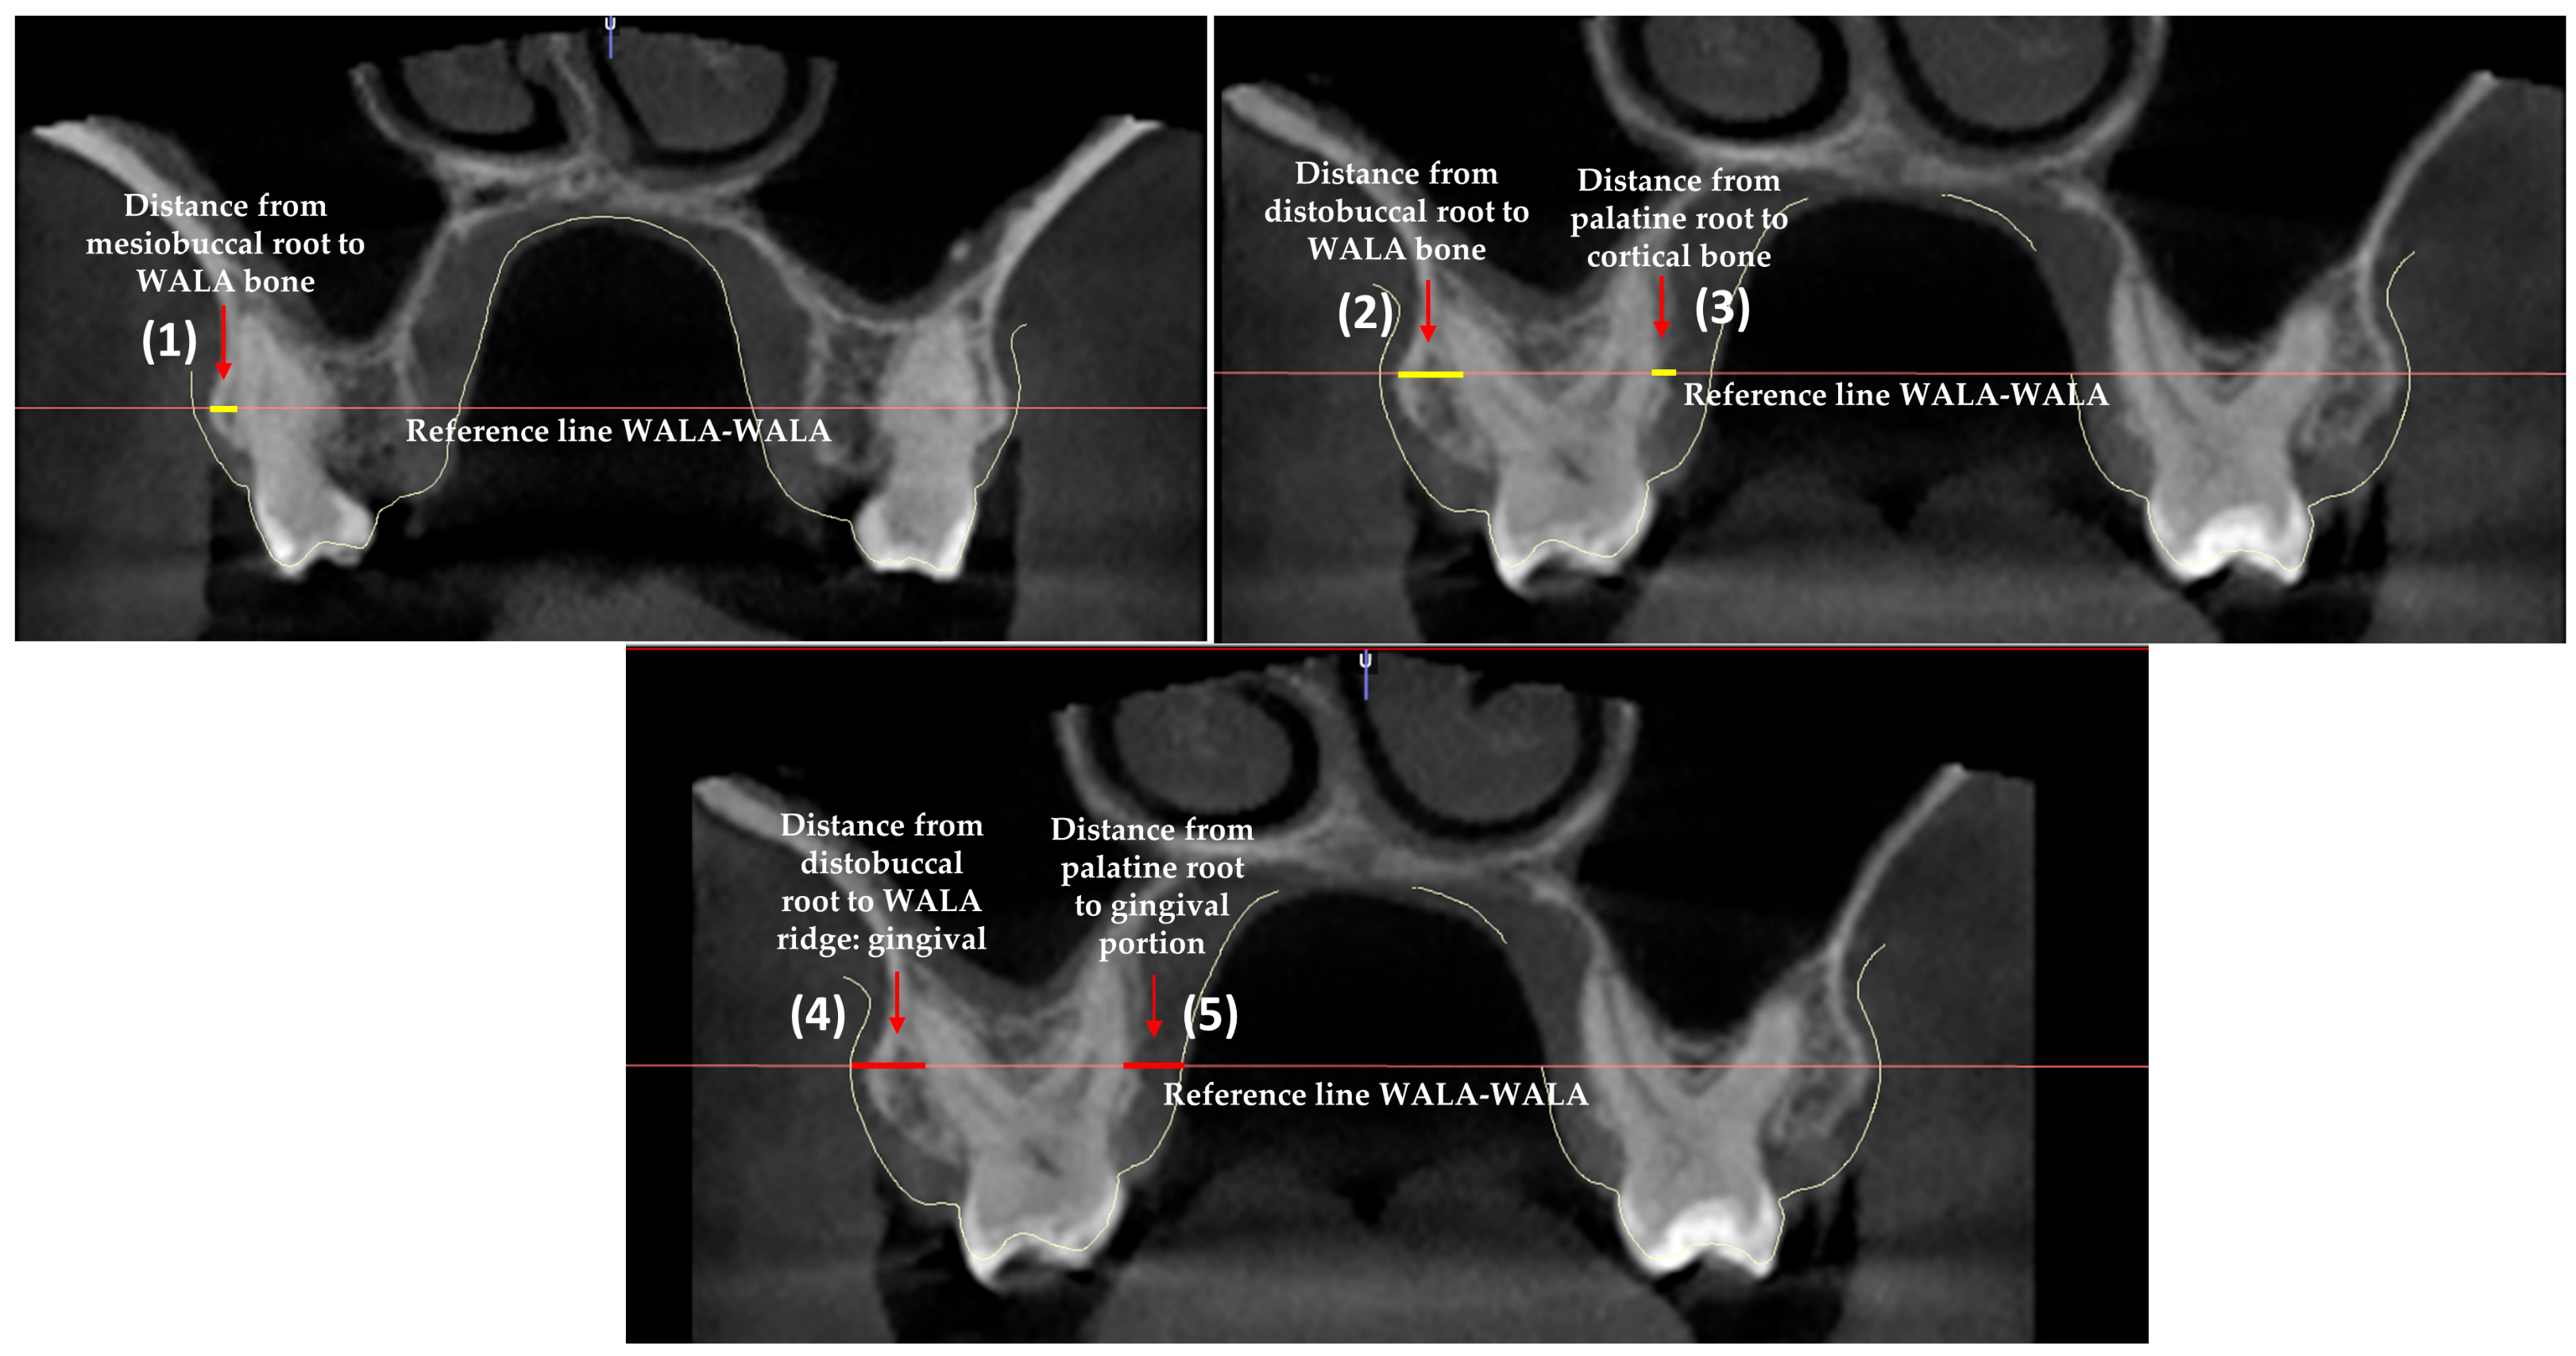
2. Materials and Methods
Statistical Analysis
3. Results
4. Discussion
5. Conclusions
Author Contributions
Funding
Institutional Review Board Statement
Informed Consent Statement
Data Availability Statement
Conflicts of Interest
References
- Arun, T.; Isik, F.; Sayinsu, K. Vertical growth changes after adenoidectomy. Angle Orthod. 2003, 73, 146–150. [Google Scholar] [PubMed]
- Tsunori, M.; Mashita, M.; Kasai, K. Relationship between facial types and tooth and bone characteristics of the mandible obtained by CT scanning. Angle Orthod. 1998, 68, 557–562. [Google Scholar] [PubMed]
- Jee, W.S. Principles in bone physiology. J. Musculoskelet. Neuronal Interact. 2000, 1, 11–13. [Google Scholar] [PubMed]
- Bresin, A.; Kiliaridis, S.; Strid, K.G. Effect of masticatory function on the internal bone structure in the mandible of the growing rat. Eur. J. Oral Sci. 1999, 107, 35–44. [Google Scholar] [CrossRef]
- Mavropoulos, A.; Kiliaridis, S.; Bresin, A.; Ammann, P. Effect of different masticatory functional and mechanical demands on the structural adaptation of the mandibular alveolar bone in young growing rats. Bone 2004, 35, 191–197. [Google Scholar] [CrossRef]
- Masumoto, T.; Hayashi, I.I.; Kawamura, A.A.; Tanaka, K.; Kasai, K. Relationships among facial type, buccolingual molar inclination, and cortical bone thickness of the mandible. Eur. J. Orthod. 2001, 23, 15–23. [Google Scholar] [CrossRef]
- Swasty, D.; Lee, J.; Huang, J.C.; Maki, K.; Gansky, S.A.; Hatcher, D.; Miller, A.J. Cross-sectional human mandibular morphology as assessed in vivo by cone-beam computed tomography in patients with different vertical facial dimensions. Am. J. Orthod. Dentofac. Orthop. 2011, 139, 377–389. [Google Scholar] [CrossRef]
- Ozdemir, F.; Tozlu, M.; Germec-Cakan, D. Cortical bone thickness of the alveolar process measured with cone-beam computed tomography in patients with different facial types. Am. J. Orthod. Dentofac. Orthop. 2013, 143, 190–196. [Google Scholar] [CrossRef]
- Renkema, A.M.; Fudalej, P.S.; Renkema, A.A.P.; Abbas, F.; Bronkhorst, E.; Katsaros, C. Gingival labial recessions in orthodontically treated and untreated individuals: A case—Control study. J. Clin. Periodontol. 2013, 40, 631–637. [Google Scholar] [CrossRef]
- Borges, G.J.; Ruiz, L.F.N.; De Alencar, A.H.G.; Porto, O.C.L.; Estrela, C. Cone-beam computed tomography as a diagnostic method for determination of gingival thickness and distance between gingival margin and bone crest. Sci. World J. 2015, 2015, 142108. [Google Scholar] [CrossRef]
- Kim, Y.-J.; Park, J.-M.; Kim, S.; Koo, K.-T.; Seol, Y.-J.; Lee, Y.-M.; Rhyu, I.-C.; Ku, Y. New method of assessing the relationship between buccal bone thickness and gingival thickness. J. Periodontal. Implant. Sci. 2016, 46, 372–381. [Google Scholar] [CrossRef] [PubMed]
- Shah, S.R.; Fishel, D.; Tamburrino, R.; Tamburrino, R.K.; Shah, S.R.; Fishel, D.L.W. Periodontal rationale for transverse skeletal normalization. Orthod. Pract. 2014, 5, 50–53. [Google Scholar]
- Ronay, V.; Miner, R.M.; Will, L.A.; Arai, K. Mandibular arch form: The relationship between dental and basal anatomy. Am. J. Orthod. Dentofac. Orthop. 2008, 134, 430–438. [Google Scholar] [CrossRef] [PubMed]
- Ball, R.L.; Miner, R.M.; Will, L.A.; Arai, K. Comparison of dental and apical base arch forms in Class II Division 1 and Class i malocclusions. Am. J. Orthod. Dentofac. Orthop. 2010, 138, 41–50. [Google Scholar] [CrossRef]
- Andrews, L.F. The six elements of orofacial harmony. Andrews J. 2000, 1, 13–22. [Google Scholar]
- Horner, K.A.; Behrents, R.G.; Kim, K.B.; Buschang, P.H. Cortical bone and ridge thickness of hyperdivergent and hypodivergent adults. Am. J. Orthod. Dentofac. Orthop. 2012, 142, 170–178. [Google Scholar] [CrossRef]
- Sadek, M.; Sabet, N.E.; Hassan, I.T. Alveolar bone mapping in subjects with different vertical facial dimensions. Eur. J. Orthod. 2014, 37, 194–201. [Google Scholar] [CrossRef]
- Ricketts, R.M. Cephalometric analysis and synthesis. Angle Orthod. 1961, 21, 141–156. [Google Scholar]
- Glass, T.R.; Tremont, T.; Martin, C.A.; Ngan, P.W. A CBCT evaluation of root position in bone, long axis inclination and relationship to the WALA Ridge. Semin. Orthod. 2019, 25, 24–35. [Google Scholar] [CrossRef]
- Al-Hilal, L.H.; Sultan, K.; Hajeer, M.Y.; Mahmoud, G.; Wanli, A.A. An Evaluation of Mandibular Dental and Basal Arch Dimensions in Class I and Class II Division 1 Adult Syrian Patients using Cone-beam Computed Tomography. J. Contemp. Dent. Pract. 2018, 19, 431–437. [Google Scholar]
- Nahas, B.D.; Hajeer, M.Y.; Ajaj, M.A.; Alsabbagh, A.Y. Volumetric Analysis of the Jaws in Skeletal Class I and Class II Patients using CBCT and Derived Lateral Cephalograms. J. Clin. Diagn. Res. 2017, 11, 13–16. [Google Scholar] [CrossRef]
- Alhawasli, R.Y.; Ajaj, M.A.; Hajeer, M.Y.; Al-Zahabi, A.M.R.; Mahaini, L. Volumetric Analysis of the Jaws in Skeletal Class I and III Patients with Different Facial Divergence Using CBCT Imaging. Radiol. Res. Pract. 2022, 2022, 2416555. [Google Scholar] [CrossRef]
- El-Schallah, A.A.-S.; Ajaj, M.A.; Hajeer, M.Y. The Relationship between Vertical Facial Type and Maxillary Anterior Alveolar Angle in Adults Using Cone-Beam Computed Tomography. Cureus 2022, 14, e30356. [Google Scholar] [CrossRef] [PubMed]
- Janson, G.; Bombonatti, R.; Cruz, K.S.; Hassunuma, C.Y.; Del Santo, M. Buccolingual inclinations of posterior teeth in subjects with different facial patterns. Am. J. Orthod. Dentofac. Orthop. 2004, 125, 316–322. [Google Scholar] [CrossRef] [PubMed]
- Mitra, S.; Ravi, M.S. Evaluation of buccolingual inclination of posterior teeth in different facial patterns using computed tomography. Indian J. Dent. Res. 2011, 22, 376–380. [Google Scholar] [PubMed]
- Eraydin, F.; Cakan, D.G.; Tozlu, M.; Ozdemir, F. Evaluation of buccolingual molar inclinations among different vertical facial types. Korean J. Orthod. 2018, 48, 333–338. [Google Scholar] [CrossRef]
- Miner, R.M.; Al Qabandi, S.; Rigali, P.H.; Will, L.A. Cone-beam computed tomography transverse analysis. Part I: Normative data. Am. J. Orthod. Dentofac. Orthop. 2012, 142, 300–307. [Google Scholar] [CrossRef]
- Renkema, A.M.; Fudalej, P.S.; Renkema, A.; Kiekens, R.; Katsaros, C. Development of labial gingival recessions in orthodontically treated patients. Am. J. Orthod. Dentofac. Orthop. 2013, 143, 206–212. [Google Scholar] [CrossRef]
- Zawawi, K.H.; Al-Zahrani, M.S. Gingival biotype in relation to incisors’ inclination and position. Saudi Med. J. 2014, 35, 1378–1383. [Google Scholar]
- Assiri, M.; Shafik, S.; Tawfig, A. Association between gingival tissue biotype and different facial phenotypes. Saudi Dent. J. 2019, 31, 476–480. [Google Scholar] [CrossRef]

| Total (n = 120) | Mesofacial (n = 40) | Dolichofacial (n = 40) | Brachyfacial (n = 40) | p-Value | |||||||||
|---|---|---|---|---|---|---|---|---|---|---|---|---|---|
| Sex (%) Male/Female | 37.5%/62.5% | 42.5%/57.5% | 27.5%/72.5% | 42.5%/57.5% | 0.278 | ||||||||
| Age (Median [IQR]) | 25.5 [20.0–33.0] | 26.0 [19.5–32.5] | 22.5 [18.0–33.5] | 26.5 [21.0–32.5] | 0.657 | ||||||||
| Maxilla (mean ± SD) | 58.10 ± 3.23 | 57.82 ± 2.84 | 57.96 ± 3.32 | 58.52 ± 3.55 | 0.602 | ||||||||
| Mandible (mean ± SD) | 54.20 ± 2.85 | 53.72 ± 2.72 | 54.41 ± 2.87 | 54.48 ± 2.95 | 0.425 | ||||||||
| Mx-Md (mean ± SD) | 3.90 ± 3.13 | 4.10 ± 2.90 | 3.55 ± 3.26 | 4.04 ± 3.27 | 0.692 | ||||||||
| With transverse maxillo-mandibular deficit (n = 60) | Without transverse maxillo-mandibular deficit (n = 60) | p-value | With transverse maxillo-mandibular deficit (n = 20) | Without transverse maxillo-mandibular deficit (n = 20) | p-value | With transverse maxillo-mandibular deficit (n = 20) | Without transverse maxillo-mandibular deficit (n = 20) | p-value | With transverse maxillo-mandibular deficit (n = 20) | Without transverse maxillo-mandibular deficit (n = 20) | p-value | ||
| Sex (%) Male/Female | 40.0%/60.0% | 35.0%/65.0% | 0.572 | 40%/60% | 45%/55% | 0.759 | 35%/65% | 20%/80% | 0.288 | 45%/55% | 40%/60% | 0.749 | |
| Age (Median [IQR]) | 28.0 [20.5–35.0] | 23.0 [19.0–30.0] | 0.052 | 26.5 [21.0–34.0] | 24.5 [18.5–29.5] | 0.398 | 29.5 [19.5–38.5] | 21.5 [18.0–26.5] | 0.046 * | 27.5 [20.5–32.0] | 25.5 [21.0–32.5] | 0.925 | |
| Maxilla (mean ± SD) | 56.42 ± 2.87 | 59.78 ± 2.67 | 0.000 ** | 56.49 ± 2.80 | 59.16 ± 2.21 | 0.002 ** | 56.41 ± 3.13 | 59.52 ± 2.78 | 0.002 ** | 56.36 ± 2.80 | 60.67 ± 2.87 | 0.002 ** | |
| Mandible (mean ± SD) | 55.14 ± 2.92 | 53.26 ± 2.45 | 0.000 ** | 54.82 ± 2.94 | 52.62 ± 2.00 | 0.009 ** | 55.56 ± 2.72 | 53.26 ± 2.60 | 0.002 ** | 55.04 ± 3.20 | 53.91 ± 2.64 | 0.234 | |
| Mx-Md (mean ± SD) | 1.28 ± 1.68 | 6.52 ± 1.72 | 0.000 ** | 1.66 ± 1.63 | 6.54 ± 1.45 | 0.000 ** | 0.84 ± 1.96 | 6.26 ± 1.58 | 0.000 ** | 45%/55% | 6.76 ± 2.10 | 0.000 ** | |
| Pattern | p-Value | |||||
|---|---|---|---|---|---|---|
| Total | Brachyfacial | Dolichofacial | Mesofacial | |||
| 16-OSSEOUS V (DV) | N | 120 | 40 | 40 | 40 | |
| Mean | 2.55 | 2.51 | 2.46 | 2.68 | 0.438 | |
| SD | 0.79 | 0.79 | 0.91 | 0.63 | ||
| 95%CI | (2.41, 2.69) | (2.26, 2.77) | (2.17, 2.75) | (2.48, 2.88) | ||
| 16-GINGIVAL (DV) | Mean | 3.29 | 3.27 | 3.16 | 3.42 | 0.433 |
| SD | 0.9 | 0.94 | 0.98 | 0.77 | ||
| 95%CI | (3.12, 3.45) | (2.97, 3.57) | (2.85, 3.48) | (3.18, 3.67) | ||
| 16-OSSEOUS V (MV) | Mean | 1.48 | 1.57 | 1.36 | 1.53 | 0.286 |
| SD | 0.63 | 0.63 | 0.67 | 0.59 | ||
| 95%CI | (1.37, 1.6) | (1.37, 1.77) | (1.14, 1.57) | (1.34, 1.72) | ||
| 16-OSSEOUS P | Mean | 1.12 | 1.27 | 1.06 | 1.03 | 0.024 * |
| SD | 0.43 | 0.51 | 0.36 | 0.36 | ||
| 95%CI | (1.04, 1.2) | (1.1, 1.43) | (0.95, 1.18) | (0.91, 1.15) | ||
| 16-GINGIVAL P | Mean | 4.05 | 3.82 | 4.34 | 4.01 | 0.063 |
| SD | 1 | 0.96 | 0.98 | 1.02 | ||
| 95%CI | (3.87, 4.24) | (3.51, 4.12) | (4.02, 4.65) | (3.69, 4.34) | ||
| 17-OSSEOUS V (DV) | Mean | 2.66 | 2.52 | 2.78 | 2.69 | 0.546 |
| SD | 1.13 | 1.09 | 1.13 | 1.19 | ||
| 95%CI | (2.46, 2.87) | (2.17, 2.87) | (2.42, 3.14) | (2.31, 3.07) | ||
| 17-OSSEOUS P | Mean | 1.69 | 1.75 | 1.8 | 1.53 | 0.405 |
| SD | 0.93 | 0.92 | 1.06 | 0.78 | ||
| 95%CI | (1.52, 1.86) | (1.45, 2.04) | (1.46, 2.13) | (1.28, 1.78) | ||
| 17-OSSEOUS (MV) | Mean | 2.45 | 2.44 | 2.38 | 2.54 | 0.792 (ANOVA) |
| SD | 1.01 | 1.04 | 0.91 | 1.1 | ||
| 95%CI | (2.27, 2.64) | (2.1, 2.77) | (2.09, 2.68) | (2.19, 2.89) | ||
| Pattern | p-Value | |||||
|---|---|---|---|---|---|---|
| Total | Brachyfacial | Dolichofacial | Mesofacial | |||
| 26-OSSEOUS V (DV) | Mean | 2.53 | 2.49 | 2.6 | 2.49 | 0.802 |
| SD | 0.83 | 0.89 | 0.93 | 0.66 | ||
| 95%CI | (2.38, 2.68) | (2.2, 2.78) | (2.3, 2.9) | (2.28, 2.7) | ||
| 26-GINGIVAL V (DV) | Mean | 3.32 | 3.4 | 3.25 | 3.31 | 0.826 |
| SD | 1.09 | 1.09 | 1.14 | 1.07 | ||
| 95%CI | (3.12, 3.52) | (3.05, 3.75) | (2.89, 3.61) | (2.97, 3.65) | ||
| 26-OSSEOUS V (MV) | Mean | 1.95 | 2.03 | 1.97 | 1.83 | 0.718 |
| SD | 1.12 | 1.12 | 1.24 | 1 | ||
| 95%CI | (1.74, 2.15) | (1.67, 2.39) | (1.58, 2.37) | (1.51, 2.15) | ||
| 26-OSSEOUS P | Mean | 2.17 | 1.98 | 2.33 | 2.21 | 0.615 |
| SD | 1.6 | 1.29 | 1.89 | 1.58 | ||
| 95%CI | (1.88, 2.46) | (1.57, 2.39) | (1.72, 2.93) | (1.7, 2.71) | ||
| 26-GINGIVAL P | Mean | 4.37 | 4.32 | 4.49 | 4.3 | 0.836 |
| SD | 1.53 | 1.38 | 1.62 | 1.61 | ||
| 95%CI | (4.09, 4.65) | (3.88, 4.76) | (3.97, 5.01) | (3.79, 4.82) | ||
| 27-OSSEOUS (DV) | Mean | 2.59 | 2.43 | 2.76 | 2.57 | 0.393 |
| SD | 1.08 | 0.93 | 1 | 1.28 | ||
| 95%CI | (2.39, 2.78) | (2.13, 2.73) | (2.44, 3.08) | (2.16, 2.98) | ||
| 27-OSSEOUS (MV) | Mean | 2.29 | 2.3 | 2.34 | 2.23 | 0.852 |
| SD | 0.92 | 1.04 | 0.79 | 0.94 | ||
| 95%CI | (2.12, 2.45) | (1.96, 2.63) | (2.09, 2.59) | (1.93, 2.53) | ||
| 27-OSSEOUS P | Mean | 1.61 | 1.63 | 1.54 | 1.67 | 0.768 |
| SD | 0.82 | 0.7 | 0.8 | 0.95 | ||
| 95%CI | (1.47, 1.76) | (1.41, 1.86) | (1.29, 1.79) | (1.37, 1.97) | ||
| Discrepancy | p-Value | ||||
|---|---|---|---|---|---|
| Total | With Transverse Discrepancy | Without Transverse Discrepancy | |||
| 16-OSSEOUS V (DV) | N | 120 | 60 | 60 | |
| Mean | 2.55 | 2.59 | 2.52 | 0.627 | |
| SD | 0.79 | 0.82 | 0.75 | ||
| 95%CI | (2.41, 2.69) | (2.37, 2.8) | (2.32, 2.71) | ||
| 16-GINGIVAL(DV) | Mean | 3.29 | 3.32 | 3.25 | 0.714 |
| SD | 0.9 | 0.98 | 0.81 | ||
| 95%CI | (3.12, 3.45) | (3.06, 3.57) | (3.04, 3.47) | ||
| 16-OSSEOUS V (MV) | Mean | 1.48 | 1.51 | 1.46 | 0.631 |
| SD | 0.63 | 0.64 | 0.62 | ||
| 95%CI | (1.37, 1.6) | (1.35, 1.68) | (1.3, 1.62) | ||
| 16-OSSEOUS P | Mean | 1.12 | 1.1 | 1.14 | 0.619 |
| SD | 0.43 | 0.4 | 0.46 | ||
| 95%CI | (1.04, 1.2) | (1, 1.2) | (1.02, 1.26) | ||
| 16-GINGIVAL P | Mean | 4.05 | 4.21 | 3.9 | 0.095 |
| SD | 1 | 1.01 | 0.98 | ||
| 95%CI | (3.87, 4.24) | (3.95, 4.47) | (3.65, 4.15) | ||
| 17-OSSEOUS V (DV) | Mean | 2.66 | 2.66 | 2.66 | 0.998 |
| SD | 1.13 | 1.21 | 1.07 | ||
| 95%CI | (2.46, 2.87) | (2.35, 2.97) | (2.39, 2.94) | ||
| 17-OSSEOUS P | Mean | 1.69 | 1.73 | 1.65 | 0.621 |
| SD | 0.93 | 0.9 | 0.96 | ||
| 95%CI | (1.52, 1.86) | (1.5, 1.97) | (1.4, 1.9) | ||
| 17-OSSEOUS (MV) | Mean | 2.45 | 2.47 | 2.43 | 0.827 (ANOVA) |
| SD | 1.01 | 1.03 | 1.01 | ||
| 95%CI | (2.27, 2.64) | (2.21, 2.74) | (2.17, 2.69) | ||
| Discrepancy | p-Value | ||||
|---|---|---|---|---|---|
| Total | With Transverse Discrepancy | Without Transverse Discrepancy | |||
| 26-OSSEOUS V (DV) | Mean | 2.53 | 2.54 | 2.52 | 0.911 |
| SD | 0.83 | 0.82 | 0.85 | ||
| 95%CI | (2.38, 2.68) | (2.32, 2.75) | (2.3, 2.74) | ||
| 26-GINGIVAL V (DV) | Mean | 3.32 | 3.48 | 3.16 | 0.116 |
| SD | 1.09 | 1.01 | 1.15 | ||
| 95%CI | (3.12, 3.52) | (3.22, 3.74) | (2.87, 3.46) | ||
| 26-OSSEOUS V (MV) | Mean | 1.95 | 2.14 | 1.75 | 0.059 |
| SD | 1.12 | 1.2 | 1.01 | ||
| 95%CI | (1.74, 2.15) | (1.83, 2.45) | (1.49, 2.01) | ||
| 26-OSSEOUS P | Mean | 2.17 | 2.62 | 1.72 | 0.002 ** |
| SD | 1.6 | 1.74 | 1.31 | ||
| 95%CI | (1.88, 2.46) | (2.17, 3.07) | (1.38, 2.06) | ||
| 26-GINGIVAL P | Mean | 4.37 | 4.99 | 3.75 | 0.000 ** |
| SD | 1.53 | 1.39 | 1.42 | ||
| 95%CI | (4.09, 4.65) | (4.63, 5.35) | (3.38, 4.12) | ||
| 27-OSSEOUS (DV) | Mean | 2.59 | 2.77 | 2.41 | 0.064 |
| SD | 1.08 | 1.21 | 0.9 | ||
| 95%CI | (2.39, 2.78) | (2.46, 3.08) | (2.17, 2.64) | ||
| 27-OSSEOUS (MV) | Mean | 2.29 | 2.34 | 2.24 | 0.576 |
| SD | 0.92 | 0.92 | 0.93 | ||
| 95%CI | (2.12, 2.45) | (2.1, 2.57) | (2, 2.48) | ||
| 27-OSSEOUS P | Mean | 1.61 | 1.53 | 1.7 | 0.276 |
| SD | 0.82 | 0.73 | 0.89 | ||
| 95%CI | (1.47, 1.76) | (1.34, 1.72) | (1.46, 1.93) | ||
| Pattern | Brachyfacial | Dolichofacial | Mesofacial | p-Value | |||||
|---|---|---|---|---|---|---|---|---|---|
| Total | With Transverse Discrepancy | Without Transverse Discrepancy | With Transverse Discrepancy | Without Transverse Discrepancy | With Transverse Discrepancy | Without Transverse Discrepancy | |||
| 16-OSSEOUS V (DV) | N | 120 | 20 | 20 | 20 | 20 | 20 | 20 | |
| Mean | 2.55 | 2.5 | 2.53 | 2.48 | 2.44 | 2.78 | 2.58 | 0.815 | |
| SD | 0.79 | 0.68 | 0.9 | 1 | 0.84 | 0.75 | 0.48 | ||
| 95%CI | (2.41, 2.69) | (2.18, 2.82) | (2.1, 2.95) | (2.02, 2.95) | (2.05, 2.83) | (2.42, 3.13) | (2.36, 2.81) | ||
| 16-GINGIVAL(DV) | Mean | 3.29 | 3.24 | 3.3 | 3.18 | 3.15 | 3.53 | 3.32 | 0.8 |
| SD | 0.9 | 0.89 | 1.01 | 1.11 | 0.86 | 0.95 | 0.52 | ||
| 95%CI | (3.12, 3.45) | (2.82, 3.66) | (2.82, 3.77) | (2.66, 3.7) | (2.74, 3.55) | (3.08, 3.98) | (3.08, 3.56) | ||
| 16-OSSEOUS V (MV) | Mean | 1.48 | 1.2 | 1.34 | 1.03 | 1.09 | 1.07 | 0.99 | 0.637 |
| SD | 0.63 | 0.47 | 0.55 | 0.3 | 0.41 | 0.39 | 0.34 | ||
| 95%CI | (1.37, 1.6) | (0.98, 1.42) | (1.08, 1.59) | (0.89, 1.17) | (0.9, 1.28) | (0.88, 1.25) | (0.83, 1.15) | ||
| 16-OSSEOUS P | Mean | 1.12 | 3.94 | 3.69 | 4.71 | 3.96 | 3.97 | 4.06 | 0.513 |
| SD | 0.43 | 0.9 | 1.02 | 0.96 | 0.88 | 1.01 | 1.05 | ||
| 95%CI | (1.04, 1.2) | (3.52, 4.36) | (3.21, 4.17) | (4.27, 5.16) | (3.55, 4.37) | (3.49, 4.44) | (3.57, 4.55) | ||
| 16-GINGIVAL P | Mean | 4.05 | 1.66 | 1.47 | 1.32 | 1.4 | 1.56 | 1.5 | 0.15 |
| SD | 1 | 0.55 | 0.71 | 0.65 | 0.7 | 0.71 | 0.46 | ||
| 95%CI | (3.87, 4.24) | (1.41, 1.92) | (1.14, 1.8) | (1.02, 1.62) | (1.07, 1.72) | (1.22, 1.89) | (1.29, 1.72) | ||
| 17-OSSEOUS V (DV) | Mean | 2.66 | 2.61 | 2.42 | 2.64 | 2.92 | 2.74 | 2.64 | 0.621 |
| SD | 1.13 | 1.02 | 1.18 | 1.28 | 0.98 | 1.35 | 1.03 | ||
| 95%CI | (2.46, 2.87) | (2.13, 3.09) | (1.87, 2.98) | (2.04, 3.24) | (2.46, 3.38) | (2.11, 3.37) | (2.16, 3.12) | ||
| 17-OSSEOUS P | Mean | 1.69 | 1.83 | 1.66 | 1.65 | 1.94 | 1.72 | 1.35 | 0.279 |
| SD | 0.93 | 0.91 | 0.95 | 0.92 | 1.18 | 0.9 | 0.61 | ||
| 95%CI | (1.52, 1.86) | (1.41, 2.26) | (1.22, 2.11) | (1.22, 2.09) | (1.39, 2.49) | (1.29, 2.14) | (1.07, 1.63) | ||
| 17-OSSEOUS (MV) | Mean | 2.45 | 2.35 | 2.53 | 2.34 | 2.43 | 2.74 | 2.34 | 0.389 |
| SD | 1.01 | 0.95 | 1.15 | 1 | 0.82 | 1.12 | 1.06 | ||
| 95%CI | (2.27, 2.64) | (1.9, 2.79) | (1.99, 3.07) | (1.87, 2.81) | (2.04, 2.82) | (2.21, 3.26) | (1.84, 2.83) | ||
| Pattern | Brachyfacial | Dolichofacial | Mesofacial | p-Value | |||||
|---|---|---|---|---|---|---|---|---|---|
| Total | With Transverse Discrepancy | Without Transverse Discrepancy | With Transverse Discrepancy | Without Transverse Discrepancy | With Transverse Discrepancy | Without Transverse Discrepancy | |||
| 26-OSSEOUS V (DV) | Mean | 2.53 | 2.61 | 2.37 | 2.47 | 2.73 | 2.53 | 2.46 | 0.417 |
| SD | 0.83 | 0.85 | 0.94 | 0.91 | 0.95 | 0.72 | 0.61 | ||
| 95%CI | (2.38, 2.68) | (2.21, 3.01) | (1.93, 2.81) | (2.04, 2.9) | (2.28, 3.17) | (2.19, 2.86) | (2.17, 2.74) | ||
| 26-GINGIVAL V (DV) | Mean | 3.32 | 3.58 | 3.23 | 3.4 | 3.1 | 3.45 | 3.16 | 0.990 |
| SD | 1.09 | 1.15 | 1.03 | 1.07 | 1.21 | 0.83 | 1.26 | ||
| 95%CI | (3.12, 3.52) | (3.04, 4.12) | (2.74, 3.71) | (2.9, 3.9) | (2.54, 3.67) | (3.07, 3.84) | (2.57, 3.75) | ||
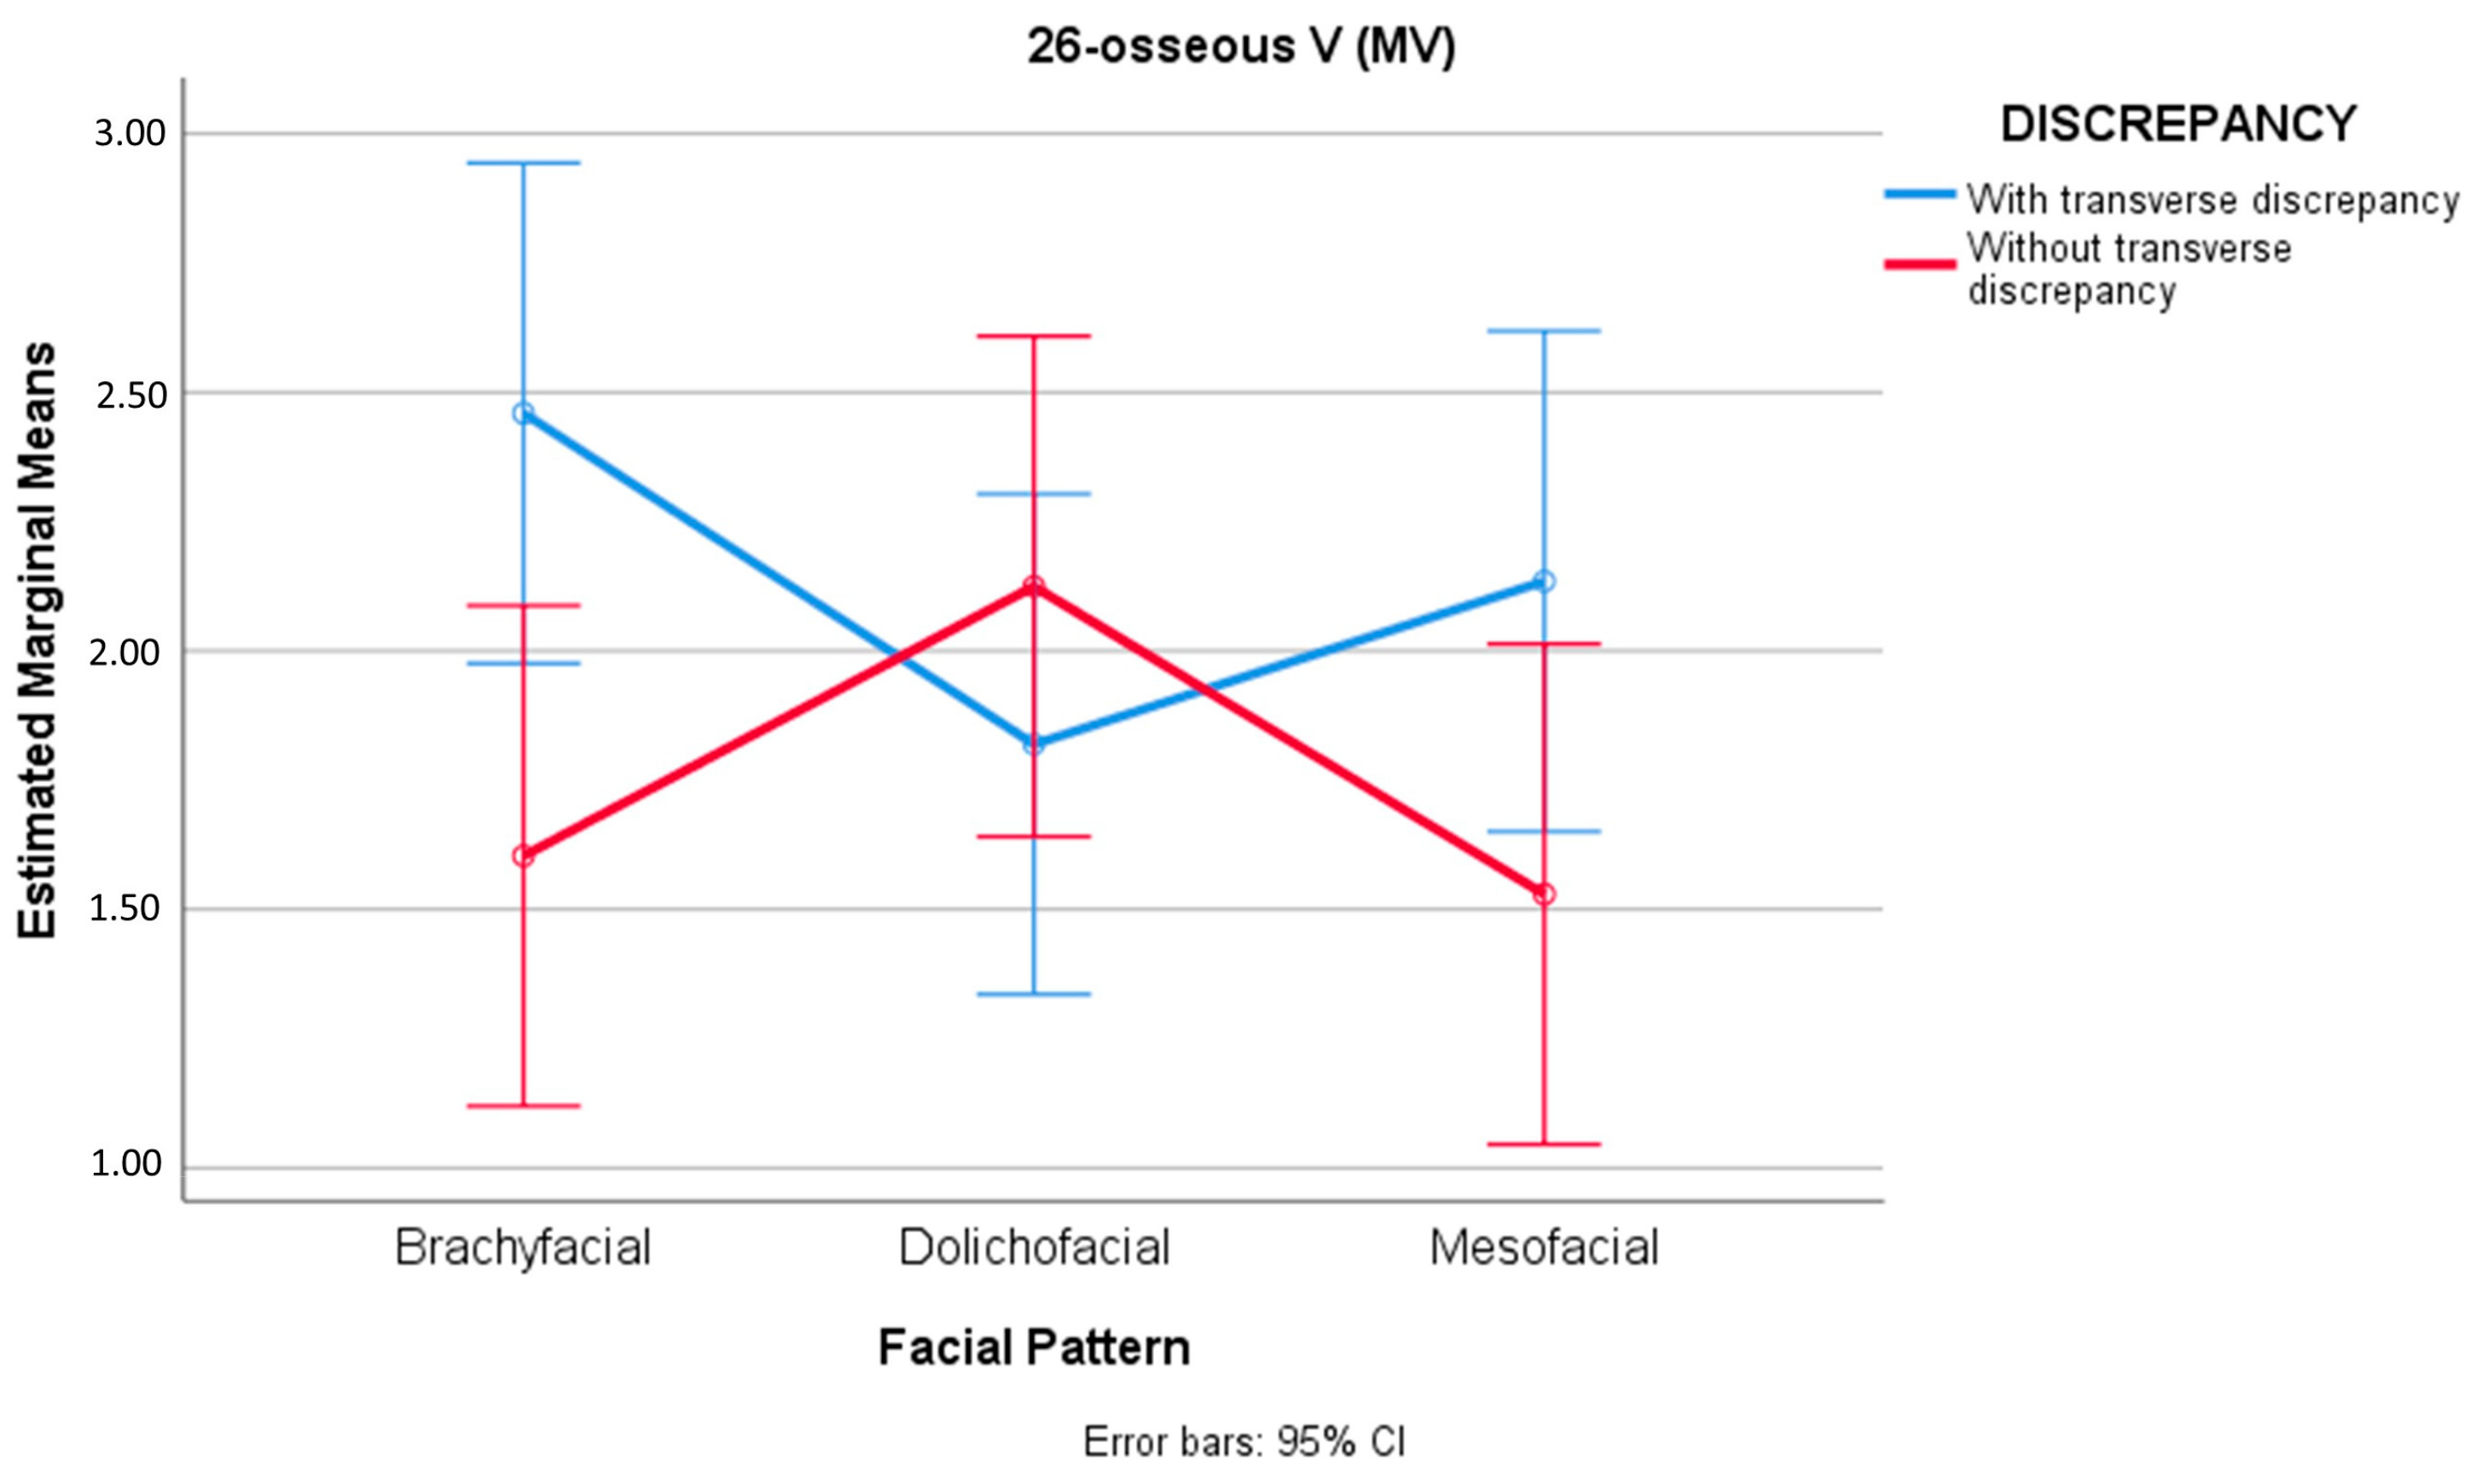
| 26-OSSEOUS V (MV) | Mean | 1.95 | 2.46 | 1.6 | 1.82 | 2.12 | 2.13 | 1.53 | 0.048 * |
| SD | 1.12 | 1.15 | 0.94 | 1.25 | 1.25 | 1.17 | 0.69 | ||
| 95%CI | (1.74, 2.15) | (1.92, 3) | (1.16, 2.04) | (1.24, 2.4) | (1.54, 2.71) | (1.59, 2.68) | (1.2, 1.85) | ||
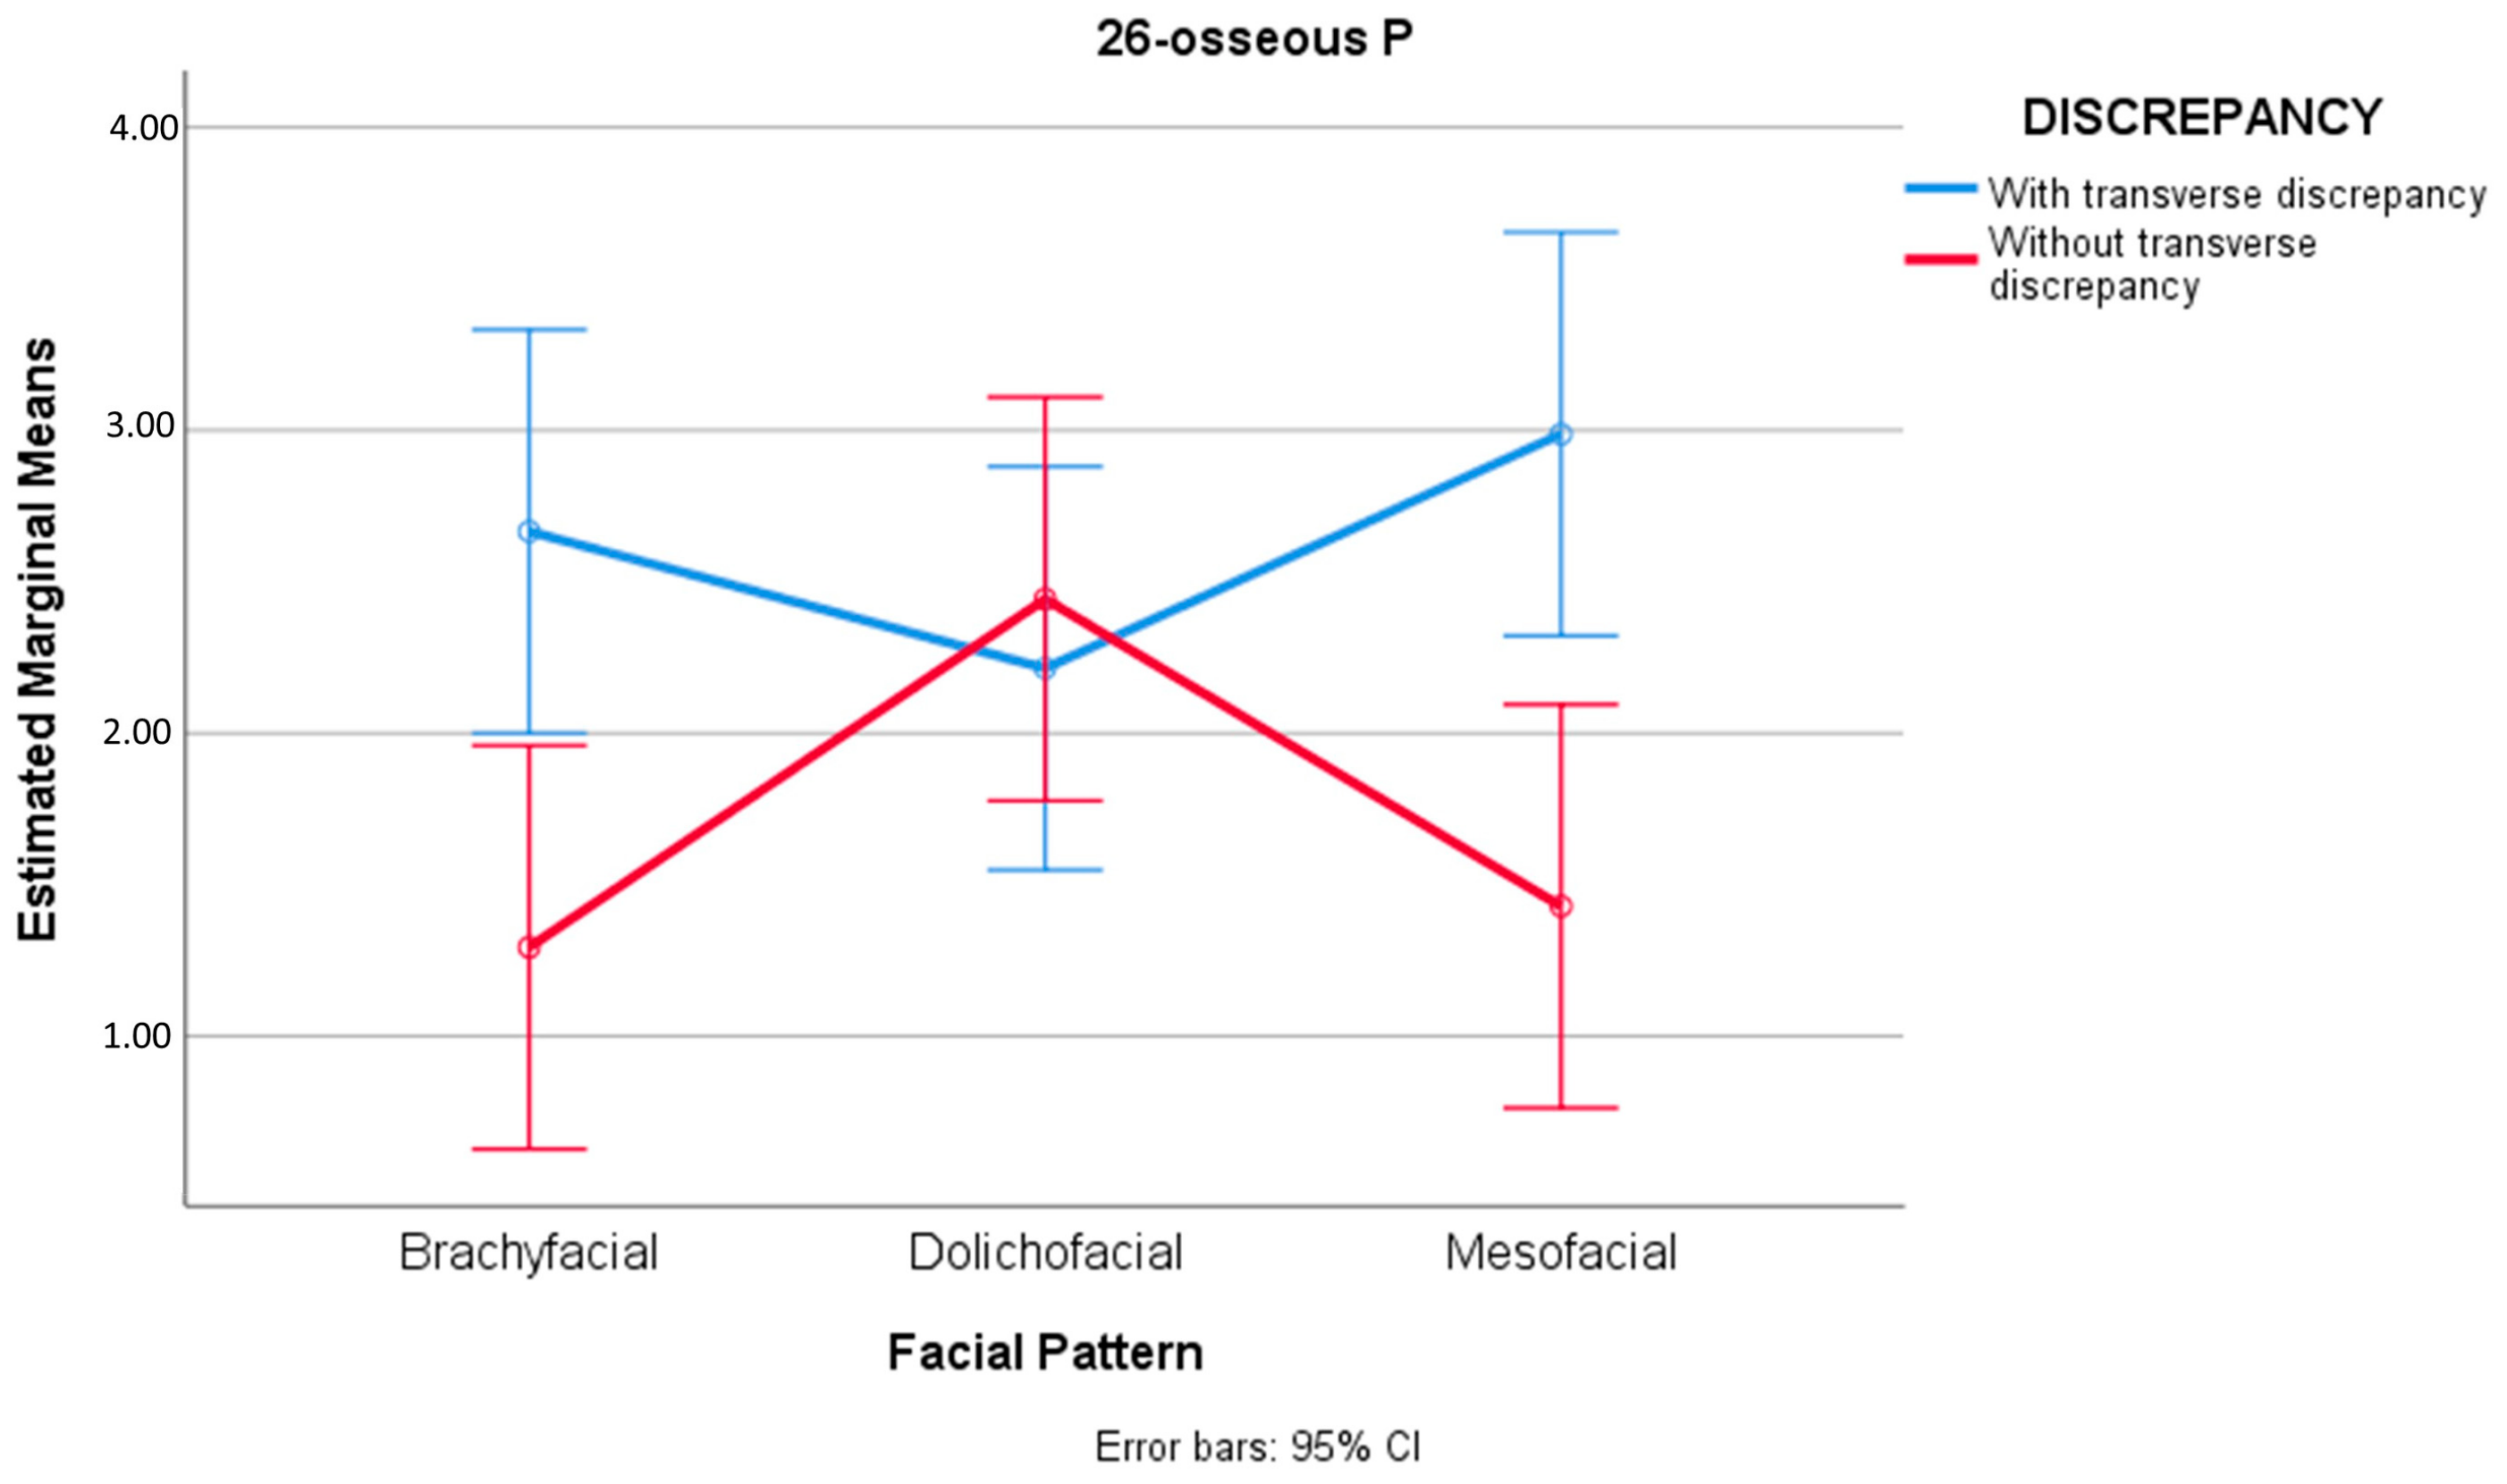
| 26-OSSEOUS P | Mean | 2.17 | 2.67 | 1.29 | 2.21 | 2.44 | 2.99 | 1.43 | 0.016 |
| SD | 1.6 | 1.48 | 0.48 | 1.97 | 1.85 | 1.74 | 0.92 | ||
| 95%CI | (1.88, 2.46) | (1.98, 3.36) | (1.07, 1.52) | (1.29, 3.14) | (1.58, 3.31) | (2.17, 3.8) | (1, 1.86) | ||
| 26-GINGIVAL P | Mean | 4.37 | 4.88 | 3.75 | 5.19 | 3.79 | 4.9 | 3.71 | 0.909 |
| SD | 1.53 | 1.33 | 1.22 | 1.36 | 1.59 | 1.51 | 1.51 | ||
| 95%CI | (4.09, 4.65) | (4.26, 5.51) | (3.18, 4.33) | (4.55, 5.82) | (3.05, 4.54) | (4.19, 5.61) | (3, 4.41) | ||
| 27-OSSEOUS (DV) | Mean | 2.59 | 2.65 | 2.21 | 2.97 | 2.55 | 2.69 | 2.45 | 0.890 |
| SD | 1.08 | 0.88 | 0.94 | 1.13 | 0.84 | 1.57 | 0.93 | ||
| 95%CI | (2.39, 2.78) | (2.24, 3.06) | (1.77, 2.65) | (2.45, 3.5) | (2.16, 2.94) | (1.95, 3.42) | (2.02, 2.89) | ||
| 27-OSSEOUS (MV) | Mean | 2.29 | 2.38 | 2.21 | 2.25 | 2.43 | 2.37 | 2.08 | 0.500 |
| SD | 0.92 | 0.99 | 1.11 | 0.61 | 0.94 | 1.13 | 0.7 | ||
| 95%CI | (2.12, 2.45) | (1.92, 2.84) | (1.69, 2.73) | (1.96, 2.54) | (1.99, 2.87) | (1.85, 2.9) | (1.75, 2.41) | ||
| 27-OSSEOUS P | Mean | 1.61 | 1.6 | 1.66 | 1.39 | 1.69 | 1.61 | 1.73 | 0.792 |
| SD | 0.82 | 0.64 | 0.77 | 0.74 | 0.84 | 0.82 | 1.08 | ||
| 95%CI | (1.47, 1.76) | (1.3, 1.9) | (1.3, 2.02) | (1.04, 1.73) | (1.3, 2.08) | (1.22, 1.99) | (1.23, 2.24) | ||
| 95%CI | (2.27, 2.64) | (1.9, 2.79) | (1.99, 3.07) | (1.87, 2.81) | (2.04, 2.82) | (2.21, 3.26) | (1.84, 2.83) | ||
Disclaimer/Publisher’s Note: The statements, opinions and data contained in all publications are solely those of the individual author(s) and contributor(s) and not of MDPI and/or the editor(s). MDPI and/or the editor(s) disclaim responsibility for any injury to people or property resulting from any ideas, methods, instructions or products referred to in the content. |
© 2023 by the authors. Licensee MDPI, Basel, Switzerland. This article is an open access article distributed under the terms and conditions of the Creative Commons Attribution (CC BY) license (https://creativecommons.org/licenses/by/4.0/).
Share and Cite
Zaragoza Ballester, A.; Ferrando Cascales, Á.; Barrera Mora, J.M.; Friedlander, I.; Agustín-Panadero, R.; Ferrando Cascales, R. Soft- and Hard-Tissue Thicknesses in Patients with Different Vertical Facial Patterns and the Transverse Deficiencies, An Integrated CBCT-3D Digital Model Analysis. J. Clin. Med. 2023, 12, 1383. https://doi.org/10.3390/jcm12041383
Zaragoza Ballester A, Ferrando Cascales Á, Barrera Mora JM, Friedlander I, Agustín-Panadero R, Ferrando Cascales R. Soft- and Hard-Tissue Thicknesses in Patients with Different Vertical Facial Patterns and the Transverse Deficiencies, An Integrated CBCT-3D Digital Model Analysis. Journal of Clinical Medicine. 2023; 12(4):1383. https://doi.org/10.3390/jcm12041383
Chicago/Turabian StyleZaragoza Ballester, Alejandro, Álvaro Ferrando Cascales, José María Barrera Mora, Itamar Friedlander, Rubén Agustín-Panadero, and Raúl Ferrando Cascales. 2023. "Soft- and Hard-Tissue Thicknesses in Patients with Different Vertical Facial Patterns and the Transverse Deficiencies, An Integrated CBCT-3D Digital Model Analysis" Journal of Clinical Medicine 12, no. 4: 1383. https://doi.org/10.3390/jcm12041383
APA StyleZaragoza Ballester, A., Ferrando Cascales, Á., Barrera Mora, J. M., Friedlander, I., Agustín-Panadero, R., & Ferrando Cascales, R. (2023). Soft- and Hard-Tissue Thicknesses in Patients with Different Vertical Facial Patterns and the Transverse Deficiencies, An Integrated CBCT-3D Digital Model Analysis. Journal of Clinical Medicine, 12(4), 1383. https://doi.org/10.3390/jcm12041383


