Abstract
At present, clinicians are expected to manage a large volume of complex clinical, laboratory, and imaging data, necessitating sophisticated analytic approaches. Machine learning-based models can use this vast amount of data to create forecasting models. We aimed to predict short- and medium-term functional outcomes in acute ischemic stroke (AIS) patients with proximal middle cerebral artery (MCA) occlusions using machine learning models with clinical, laboratory, and quantitative imaging data as inputs. Included were consecutive AIS patients with MCA M1 and proximal M2 occlusions. The XGBoost, LightGBM, CatBoost, and Random Forest were used to predict the outcome. Minimum redundancy maximum relevancy was used for selecting features. The primary outcomes were the National Institutes of Health Stroke Scale (NIHSS) shift and the modified Rankin Score (mRS) at 90 days. The algorithm with the highest area under the receiver operating characteristic curve (AUROC) for predicting the favorable and unfavorable outcome groups at 90 days was LightGBM. Random Forest had the highest AUROC when predicting the favorable and unfavorable groups based on the NIHSS shift. Using clinical, laboratory, and imaging parameters in conjunction with machine learning, we accurately predicted the functional outcome of AIS patients with proximal MCA occlusions.
1. Introduction
With 12.2 million new cases yearly, acute ischemic stroke (AIS) is a significant cause of morbidity worldwide [1]. In approximately 30% of AIS patients, the underlying cause is large vessel occlusion. Furthermore, the most common artery involved in AIS is the middle cerebral artery (MCA) [2]. Due to the high incidence of large vessel MCA occlusions and treatment advancements in M1 and proximal M2 occlusions, outcome prognostication in patients affected by these specific occlusions has become increasingly significant [3,4,5,6].
Research has been conducted to identify methods for enhancing the precision of clinical predictions of short-term and mid-term outcomes following an AIS, which may be helpful in treatment decisions and handling the expectations of the patients and their families. Clinicians are increasingly expected to handle a greater volume of complex clinical, lab, and imaging data, resulting in the use of more sophisticated analytical approaches. This significant volume of clinical, lab, and imaging data can be utilized by machine learning (ML)-based prediction models to generate effective prognostication models. In the future, it might be possible to incorporate these models into clinical practice, where they can be utilized as decision-support aids. ML and deep learning models have been utilized in AIS research for tasks including diagnosis, radiological outcome prediction, morbidity and mortality prediction, and functional outcome prediction. Recently, Mainali et al. reviewed thirteen papers that predicted the functional outcome of AIS patients using ML or deep learning [7]. Adopting ML algorithms, according to them, allows us to efficiently process the vast amount of information that surrounds us [7].
According to our review of the literature, no study has investigated the ability of ML models to predict short-term and mid-term functional outcomes in AIS patients due to isolated MCA occlusions. As AIS due to MCA occlusions is approximately five times more prevalent than AIS due to isolated anterior and posterior cerebral artery occlusions, the development of ML models that predict outcomes in MCA occlusions is beneficial from a clinical perspective [8]. Functional outcomes in AIS patients with MCA occlusions were predicted by Forkert et al.; however, magnetic resonance imaging (MRI) scans were used as the input [9]. In this study, we aimed to predict short-term and mid-term functional outcomes in AIS patients due to proximal MCA occlusions with ML models using the clinical, lab, and quantitative imaging data as inputs.
2. Materials and Methods
2.1. The Patient Selection
In this retrospective cohort study, two comprehensive stroke centers including consecutive AIS patients admitted to Johns Hopkins Hospital (JHH) and Johns Hopkins Bayview Medical Center (JHBMC) between 1 October 2017 and 30 September 2022, were evaluated for eligibility. We searched for patients with MCA M1 and proximal M2 occlusions. The M1 segment of the MCA is defined as the horizontal portion of the proximal MCA from the bifurcation of the internal carotid artery (ICA) to the genu of the MCA branch or branches at the entrance to the insula [5]. M2 section was defined as vertical MCA branches within the Sylvian fissure that extend from the genu to the next genu at the level of the operculum [5]. Proximal M2 occlusions were defined as occlusions within 1 cm of the bifurcation of the MCA in the horizontal M2 section [10]. An anterior temporal artery arising from the horizontal M1 segment was not considered an M2 branch. AIS was diagnosed clinically and confirmed by brain computed tomography (CT). Patients who met the following inclusion criteria were included in the study: (1) Admitted within 24 h of symptom onset; (2) minimum 18 years old; (3) initial non-contrast brain CT scan excluded intracranial hemorrhage; (4) diagnosed with primary AIS due to M1 and proximal M2 occlusion based on CT angiography (CTA) and CT perfusion (CTP); (5) hypoperfusion analysis was performed utilizing an automated perfusion software platform based on CTP (RAPID 4.9, iSchemaView, Menlo Park, CA, USA); and (6) as the outcome measures, the National Institutes of Health Stroke Scale (NIHSS) shift or modified Rankin Score (mRS) at 90 days were available as the outcome measures. Patients with missing outcome data, secondary AIS due to emboli caused by endovascular treatment of another occlusion, and those discharged with a diagnosis of transient ischemic attack (TIA) were excluded. The Institutional Review Board at JHH approved the study. The study complied with the Health Insurance Portability and Accountability Act.
2.2. Data Extraction
From electronic medical records, demographic and clinical information were extracted retrospectively. The following variables were obtained: Sex, age, race, alcohol consumption, smoking status, whether JHH or JHBMC was the initial hospital, stroke etiology based on TOAST criteria [11], medical history (hypertension, diabetes mellitus, atrial fibrillation, heart disease, dyslipidemia, chronic kidney disease, deep venous thrombosis or pulmonary embolus at the time of admission, hepatitis C virus [HCV] and human immunodeficiency virus [HIV] status, sleep apnea, prior stroke or TIA, peripheral vascular disease, obesity, history of malignancy, anticoagulation or antiplatelet use), admission vitals (heart rate, systolic blood pressure, diastolic blood pressure, respiratory rate), admission shock index (SI), age-related admission SI, admission SpO2, admission body mass index (BMI), discharge vitals (heart rate, systolic blood pressure, diastolic blood pressure, respiratory rate), discharge BMI, discharge SpO2, admission NIHSS score, discharge NIHSS score, intravenous (IV) tissue plasminogen activator (tPA) treatment, mechanical thrombectomy (MT), and the mRS at 90 days following hospital discharge.
All patients had peripheral venous blood drawn in accordance with our local stroke care standard protocol at the emergency department. All blood samples were collected, processed, and analyzed using the same procedures. The following admission and discharge lab parameters were retrospectively extracted: Sodium, potassium, glucose, calcium, blood urea nitrogen (BUN), creatinine, hematocrit, hemoglobin, white blood cell (WBC) count, platelet count, and platelet count to WBC count ratio.
To collect radiologic variables, imaging reports were used. In addition, all CTAs were evaluated by a board-certified neuroradiologist (Vivek Srikar Yedavalli, 6 years of experience) in conjunction with all available imaging and clinical data for each patient in the study. The existence and precise location of any AIS were noted. The same neuroradiologist collected and confirmed the baseline Alberta Stroke Program Early CT Score (ASPECTS), the occluded vessel, the occluded segment, the occlusion laterality, the presence of hyperdense MCA on thin cuts, the presence of hemorrhagic transformation, and the type of hemorrhagic transformation. The time from admission to CT in minutes was extracted retrospectively.
At the discretion of the neurointerventionalist, thrombectomy was performed by one of four experienced interventional neuroradiologists or endovascular neurosurgeons using any FDA-approved thrombectomy device. Extracted data included reperfusion grade as evaluated by the treating interventionalist after the procedure using the modified treatment in cerebral ischemia (mTICI) score, the number of passes during the thrombectomy procedure, time from admission to groin puncture in minutes, time from groin puncture to recanalization in minutes, time from admission to recanalization in minutes, and type of anesthesia during thrombectomy. If IV-tPA was administered, time from admission to needle time in minutes was extracted.
2.3. Imaging Protocols
Comprehensive CT imaging was performed at JHH and JHBMC from 1 October 2017 to 30 September 2022, utilizing helical scanners on the Siemens Flash and Drive systems (Siemens Healthineers, Erlangen, Germany). The parameters listed below are applicable to both Siemens scanners. Parameters for non-contrast CT: Helical mode at 5-mm slice thickness (ST), 120 kVp, 365 mAs, rotation time 1 s, acquisition time 6–8 s, collimation 128 × 0.6 mm, pitch value 0.55, scan direction CC. CTP parameters: Injection of 50 mL non-ionic iodinated contrast with 30 mL saline flush at 5–6 mL/s with 70–100 mm coverage at 5-mm ST. CTP parameters: 70 kVp, 200 mAs effective, rotation time 0.25 s, average acquisition time 60 s, collimation 48 × 1.2 mm, pitch value 0.70, 4D range 114 mm × 1.5 s. CTP images are then post-processed with commercial software RAPID 4.9 (IschemaView, Menlo Park, CA, USA) to generate Tmax maps. CTA head and neck parameters: Non-ionic iodinated contrast with 50–70 mL injected at 5–6 mL/s from the aortic arch to the vertex using a bolus-triggered injection technique at 3 mm ST. CTA parameters: 90/150 kVp, Sn filter, quality reference mAs 180, rotation time 0.25 s, average acquisition time 3–5 s, collimation 128 × 0.6 mm, pitch value 0.70, scan direction CC.
Extracted data included relative cerebral blood flow (rCBF) < 20%, rCBF < 30%, rCBF < 34%, rCBF < 38%, time to the maximum of the residue function (Tmax) > 4 s, Tmax > 6 s, Tmax > 8 s, Tmax > 10 s, cerebral blood volume (CBV) < 34%, CBV < 38%, CBV < 42%, mismatch volume, mismatch ratio, hypoperfusion index (HI), digital subtraction angiography (DSA) collateral score, clot burden score, and single-phase CTA collateral score [12]. The American Society of Interventional and Therapeutic Neuroradiology/Society of Interventional Radiology (ASITN/SIR) score was used for the collateral score for DSA. The mismatch volume was calculated by subtracting the perfusion deficit volume from the ischemic core volume. The mismatch ratio was calculated by dividing the perfusion deficit by the infarct core volume. HI is defined as the volumetric ratio of tissue with a Tmax > 10 s and Tmax > 6 s.
2.4. Outcome of Interest
NIHSS shift and mRS at 90 days were the primary outcomes. NIHSS shift (admission NIHSS score − discharge NIHSS score) was computed based on the recent study from Meyer et al. for each patient [13,14]. With a cut-off defined by the median NIHSS shift, patients with an NIHSS shift above the median score and patients with an NIHSS shift below the median score were assigned to the favorable outcome group and the unfavorable outcome group, respectively. Regarding mRS, the favorable outcome was defined as mRS 0 to 2 [15]. Our study aims to evaluate the effectiveness of ML algorithms in predicting favorable and unfavorable outcome groups based on mRS and NIHSS shift.
2.5. Data Preprocessing
Imputation was utilized to prevent the introduction of bias by removing missing data from patients. Values regarding MT related time-sensitive variables (time from admission to groin puncture, time from groin puncture to recanalization, time from admission to recanalization) for the patients who did not undergo MT, were assigned as the maximum value of the total patient cohort. Similarly, values regarding IV-tPA treatment related time-sensitive variables (time from admission to needle time) were assigned as the maximum value of the total patient cohort. After this manual imputation for the non-applicable variables, missing values for the remaining continuous variables were imputed with the nearest neighbor (NN) method after removing variables with missing values for more than 25% of the patient cohort [16].
The robust scaler was used for continuous data to adjust outliers [17]. The Min-Max normalization method was applied to normalize the data, and each continuous variable was set between the 0 and 1 range [18]. Ordinal categorical variables (such as mTICI) were coded with the ordinal encoder [19], while non-binary variables (e.g., race, sex) were one-hot-encoded [20]. Minimum redundancy maximum relevance feature selection approach was utilized for feature selection [21]. Since the NIHSS shift is an outcome obtained at the time of discharge, other parameters obtained at the time of discharge were not used to predict the groups stratified based on the NIHSS shift. Parameters obtained at discharge were used to predict mRS at 90 days.
2.6. Modeling, Training, Validation, and Test Sets
We divided our sample at a ratio of 60:20:20. Therefore, 60% of the data were allocated to the training set, 20% to the validation set, and the remaining 20% to the test set. The training set was used to build the models, the validation set to fine-tune the hyperparameters, and the test set to evaluate the models’ performance.
Python 3.7.15 was used to run ML analyses. We used four supervised ML algorithms: CatBoost, XGBoost, LightGBM, and Random Forest. With the Optuna optimization package, the area under the receiver operating characteristic curve was optimized (AUROC). The Optuna streamlines the utilization of various cutting-edge optimization methods for efficient and rapid hyperparameter optimization [22]. The Bayesian optimization algorithm Tree-Structured Parzen Estimator Sampler (TPESampler) was used to create AUROC estimations that served as a guide for the optimization phase. The final models were formed using the training set and optimized hyperparameters.
2.7. Performance Evaluation
Visually, algorithms were assessed using the receiver operating characteristic (ROC) curve and the precision-recall curve (PRC); and numerically, using the AUROC, the area under the PRC (AUPRC), accuracy, Matthew’s correlation coefficient (MCC), recall, and precision. In addition to performance charts and metrics, we utilized SHapley Additive exPlanations (SHAP) to assess the relative significance of predictor factors. SHAP is a method for illustrating how ML algorithms yield predictions.
2.8. Statistical Analysis
All statistical analyses were performed in Python version 3.7.15. The descriptive analyses were shown as means (± standard deviations) for normally distributed continuous variables, medians (interquartile ranges) for non-normally distributed continuous variables, and the number of patients (% percentages). The independent t-test for normally distributed continuous variables with equal variances and the Welch’s t-test for normally distributed continuous variables with unequal variances were used to assess group differences in outcomes. Group differences in outcomes were investigated using the Mann-Whitney U test for non-normally distributed continuous variables and Pearson’s chi-squared test for categorical variables. Levene’s test was used to evaluate the equality of variances for a variable, whereas the Shapiro-Wilk test was utilized to assess normality. The differences were considered statistically significant at a p-value of less than 0.05.
3. Results
Initially, 279 patients admitted to JHH and JHBMC with AIS due to an M1 or proximal M2 occlusion or both were included in the study. Forty-nine patients were excluded due to unavailable outcome data. Additionally, 45 patients had only the NIHSS shift, 42 patients had only the mRS, and 143 patients had both the NIHSS shift and the mRS available. Therefore, our study included a total of 230 patients, 185 of whom were included in predicting favorable and unfavorable outcomes based on mRS and 188 based on NIHSS shift. Using the minimum redundancy maximum relevance feature selection approach, each model used 20 features as input.
3.1. mRS as the Outcome Measure
There were 99 patients in the group with a favorable outcome (mRS 0–2) and 86 patients in the group with an unfavorable outcome (mRS 3–6). Table 1 displays the characteristics of the patient population, both by group and in total. The best predicting algorithm in terms of AUROC was LightGBM, with an AUROC of 0.958 (confidence interval [CI] = 0.886–1). Once again, LightGBM had the highest AUPRC value of 0.958. Table 2 provides detailed metrics regarding the performance of the algorithms. Figure 1A depicts the ROC curve, while Figure 2A depicts the PRC. After feature selection, the models utilized the 20 most significant features for outcome prediction. Figure 3A displays SHAP plot of the LightGBM algorithm with 20 selected features. SHAP plots of other algorithms predicting mRS at 90 days can be found in Supplementary Figure S1.

Table 1.
The characteristics of the patient population utilized in mRS prediction.
Table 2.
Performance metrics of the algorithms.
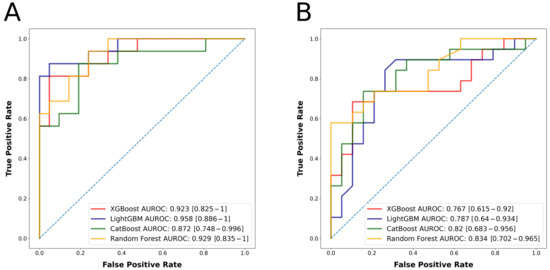
Figure 1.
(A) Algorithms’ receiver operating characteristic curves for the outcome mRS at 90 days. (B) Algorithms’ receiver operating characteristic curves for the outcome NIHSS shift.
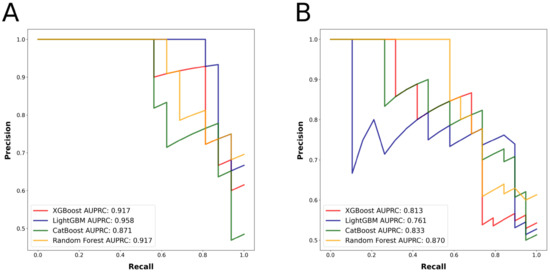
Figure 2.
(A) Algorithms’ precision-recall curves for the outcome mRS at 90 days. (B) Algorithms’ precision-recall curves for the outcome NIHSS shift.
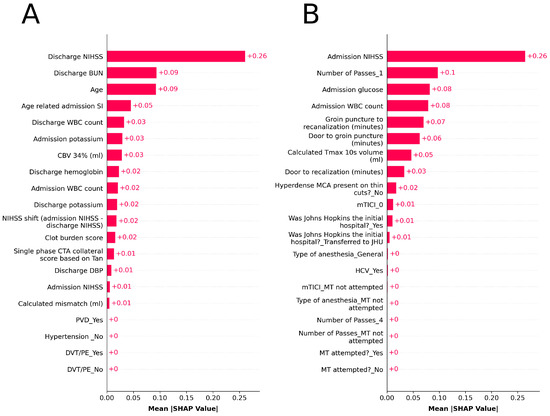
Figure 3.
Sorted feature importance and their mean SHAP values (A) for the model predicting the mRS at 90 days with the LightGBM algorithm, (B) for the model predicting the NIHSS shift with the Random Forest algorithm.
3.2. NIHSS Shift as the Outcome Measure
There were 89 patients in the group with a favorable outcome and 99 patients in the group with an unfavorable outcome. The characteristics of the patient population, both by group and overall, are presented in Table 3. The best predicting algorithm in terms of AUROC was Random Forest, with an AUROC of 0.834 (CI = 0.702–0.965). Once again, Random Forest algorithm had the highest AUPRC value of 0.870. Table 2 provides comprehensive performance metrics for the models. Figure 1B displays the ROC curve, while 2B shows the PRC curve. After feature selection, models used the 20 most significant features to predict the outcome. Figure 3B depicts SHAP plot of the Random Forest algorithm with 20 selected features. SHAP plots of other algorithms predicting the NIHSS shift can be found in Supplementary Figure S2.
Table 3.
The characteristics of the patient population utilized in NIHSS shift prediction.
4. Discussion
To the best of our knowledge, this is the first study to predict functional outcomes in AIS patients with isolated proximal MCA occlusions. This study presents a series of ML models that accurately predict the groups stratified based on NIHSS shift (short-term functional outcome) and mRS at 90 days (mid-term functional outcome) in AIS patients with isolated proximal MCA occlusions. Managing massive and varied data, detecting subtle and hidden patterns, and forecasting complicated events are the primary benefits of ML models. ML models have the potential to enhance clinical management by providing patient-centered, individualized management based on the outcomes of the model. Physicians may be able to personalize better patient care plans for those at risk of unfavorable outcomes, and they can provide patients with more accurate information regarding the prognosis of their functional status. On the other hand, physicians may direct ML models by identifying crucial features to include and the appropriate sources to represent those features. This study adds to the body of knowledge by describing the advantages and efficacy of incorporating ML into patient care to predict outcomes in AIS patients [7]. The most successful algorithm was LightGBM in predicting the favorable and unfavorable outcome groups based on mRS at 90 days with an AUROC of 0.958 (CI = 0.886–1) and an AUPRC of 0.958. The algorithm with the highest AUROC and AUPRC was Random Forest, with 0.834 (CI = 0.702–0.965) and 0.870, respectively, when predicting the favorable and unfavorable groups based on the NIHSS shift.
In the literature, ML and deep learning models have been used to predict favorable (mRS at 90 days 0–2) and unfavorable (mRS at 90 days 3–6) functional outcome groups in AIS patients. Despite the difficulties of directly comparing the performance of this algorithm with the performance of algorithms in other recent studies, based on the metrics reported, our model appeared to achieve similar performance to the best-performing models in other published studies [23,24,25]. Heo et al. used a deep learning model, which yielded an AUROC of 0.888; Monteiro et al. used an ML model, which produced an AUROC of 0.936; and Brugnara et al. used an ML model, which yielded an AUROC of 0.856 [23,24,25]. Our algorithm LightGBM predicted the mRS group with an AUROC of 0.958, outperforming all other models. Notably, while our model included only 20 features, the model of Monteiro et al., which was the most comparable to ours in terms of the AUROC, contained 152 features. Their model with 49 features yielded an AUROC of 0.808. Furthermore, Brugnara et al. reported an accuracy of 0.804 for their ML model, whereas our model achieved an accuracy of 0.892 [25]. Moreover, Brugnara et al. had 246 patients, Monteiro et al. had 399 patients, and Heo et al. had 2604 patients in their best-performing models, whereas we had 185 patients. Although the number of patients in our study was relatively small, we were able to achieve similar results compared to these papers, demonstrating the efficacy of our models. While it is not accurate to directly compare models based on AUROC value, we utilized this metric to compare our model to theirs since they did not report AUPRC and accuracy.
In our study, we also used SHAP to create visual explanations for the predictions of the four different algorithms used in this study. LightGBM was the most accurate model for predicting mRS at 90 days, with discharge NIHSS score, discharge BUN, age, age-related admission SI, and discharge WBC count being the top five most important features according to SHAP results. Brugnara et al. reported their top five features with the greatest importance for predicting mRS, and they were NIHSS score after 24 h, premorbid mRS score, final infarction volume on post-interventional CT after 18 to 36 h, interval from groin puncture to recanalization, and baseline acute ischemic volume on native CT [25]. With the exception of the time between groin puncture and recanalization, we did not utilize four of the top five factors in their analysis. Therefore, comparing our top parameters to theirs is challenging. In their best-performing models, Heo et al. used 38 features, while Monteiro et al. used 152 features, with no SHAP figures or other metrics indicating the importance of distinctive features in predicting the outcome [23,24]. Furthermore, our SHAP results reveal that patient discharge metrics are crucial for predicting the mRS at 90 days. While reliable scores that can predict the patient’s functional outcomes use available metrics at admission, our results indicate that utilization of discharge parameters might increase the accuracy of the prediction [26]. This can be an open area of research.
No prior study has, to our knowledge, utilized ML approaches to analyze the NIHSS shift. Therefore, we cannot compare the performance of our predictive models for the NIHSS shift to what was accomplished before. The SHAP analysis of Random Forest, the best predicting algorithm in terms of AUROC and AUPRC, for the NIHSS shift revealed that the most influential variables were admission NIHSS score, number of passes in thrombectomy, admission glucose, admission WBC count, and groin puncture to recanalization in minutes. As it is well known that stroke severity is a crucial predictor of outcomes in AIS patients, it is not surprising that admission NIHSS was the most important variable [27]. The SHAP analysis revealed that thrombectomy-related parameters were crucial, demonstrating the significance of treatment, which makes intuitive sense given that the NIHSS shift occurs during hospitalization. Furthermore, glucose levels at admission were identified as a crucial parameter, which makes sense given that elevated glucose levels are independent predictors of poor outcome in stroke patients [28]. Furthermore, admission WBC count was identified as a significant predictor of the outcome, consistent with earlier research [29].
Despite the rigor of our methods, our study is not without limitations. Our study has limitations inherent to retrospective studies. To validate our ML models, prospective studies with a larger sample size would be needed. We could not utilize periprocedural vital signs, such as blood pressure since they were not collected. Although the algorithms used in our study are widely regarded as state-of-the-art, it is worth noting that algorithms utilizing gradient boosting are susceptible to outliers and prone to overfitting. The robust scaler was used to handle outliers, and the minimum redundancy maximum relevance feature selection approach was used to prevent overfitting.
5. Conclusions
Using clinical, laboratory, and imaging parameters in conjunction with ML, the functional outcome of AIS patients with proximal MCA occlusions could be accurately predicted. These algorithms have the potential to be implemented in the decision-making process in clinical practice. This can potentially improve prognostic stratification and management.
Supplementary Materials
The following supporting information can be downloaded at: https://www.mdpi.com/article/10.3390/jcm12030839/s1. Figure S1: Sorted feature importance and their mean SHAP values for the model predicting the outcome mRS at 90 days with (A) the XGBoost algorithm, (B) the CatBoost algorithm, and (C) the Random Forest algorithm; Figure S2: Sorted feature importance and their mean SHAP values for the model predicting the outcome NIHSS shift with (A) the XGBoost algorithm, (B) the LightGBM algorithm, and (C) the CatBoost algorithm.
Author Contributions
Conceptualization, B.B.O., M.K., M.W. and V.S.Y.; methodology, B.B.O. and M.K.; software, B.B.O. and M.K.; validation, M.M.C., M.W. and V.S.Y.; formal analysis, B.B.O. and M.K.; investigation, B.B.O., M.K. and V.S.Y.; resources, V.S.Y.; data curation, B.B.O., O.H., R.W., A.K., N.K. and M.H.; writing—original draft preparation, B.B.O. and M.K.; writing—review and editing, M.M.C., M.W. and V.S.Y.; visualization, M.K.; supervision, M.M.C., M.W. and V.S.Y.; project administration, V.S.Y. All authors have read and agreed to the published version of the manuscript.
Funding
This research received no external funding.
Institutional Review Board Statement
The study was conducted in accordance with the Declaration of Helsinki, and approved by the Institutional Review Board of Johns Hopkins Hospital (IRB00269637; 9 March 2021).
Informed Consent Statement
Patient consent was waived due to the study’s retrospective nature, and the analysis used anonymous clinical data.
Data Availability Statement
The data presented in this study are available on request from the corresponding author. The data are not publicly available due to ethical restrictions and legal constraints.
Acknowledgments
The Johns Hopkins Department of Radiology Physician Scientist Incubator Program provided non-financial support for this research (RAD-PSI).
Conflicts of Interest
V.S.Y. is a consultant for RAPID IschemaView (Menlo Park, CA, USA) and MRI Online (Cincinnati, OH, USA). The other authors have no competing interest to declare that are relevant to the content of this article. The funders had no role in the design of the study; in the collection, analyses, or interpretation of data; in the writing of the manuscript; or in the decision to publish the results.
References
- GBD 2019 Stroke Collaborators. Global, Regional, and National Burden of Stroke and Its Risk Factors, 1990–2019: A Systematic Analysis for the Global Burden of Disease Study 2019. Lancet Neurol. 2021, 20, 795–820. [Google Scholar] [CrossRef] [PubMed]
- Nogles, T.E.; Galuska, M.A. Middle Cerebral Artery Stroke. In StatPearls; StatPearls Publishing: Treasure Island, FL, USA, 2022. [Google Scholar]
- Dobrocky, T.; Piechowiak, E.I.; Volbers, B.; Slavova, N.; Kaesmacher, J.; Meinel, T.R.; Arnold, M.; Fischer, U.; Jung, S.; Gralla, J.; et al. Treatment and Outcome in Stroke Patients with Acute M2 Occlusion and Minor Neurological Deficits. Stroke 2021, 52, 802–810. [Google Scholar] [CrossRef]
- de Havenon, A.; Narata, A.P.; Amelot, A.; Saver, J.L.; Bozorgchami, H.; Mattle, H.P.; Ribo, M.; Andersson, T.; Zaidat, O.O. ARISE II investigators Benefit of Endovascular Thrombectomy for M2 Middle Cerebral Artery Occlusion in the ARISE II Study. J. Neurointerv. Surg. 2021, 13, 779–783. [Google Scholar] [CrossRef] [PubMed]
- Coutinho, J.M.; Liebeskind, D.S.; Slater, L.-A.; Nogueira, R.G.; Baxter, B.W.; Levy, E.I.; Siddiqui, A.H.; Goyal, M.; Zaidat, O.O.; Davalos, A.; et al. Mechanical Thrombectomy for Isolated M2 Occlusions: A Post Hoc Analysis of the STAR, SWIFT, and SWIFT PRIME Studies. AJNR Am. J. Neuroradiol. 2016, 37, 667–672. [Google Scholar] [CrossRef]
- Salahuddin, H.; Ramaiah, G.; Slawski, D.E.; Shawver, J.; Buehler, M.; Zaidi, S.F.; Jumaa, M. Mechanical Thrombectomy of M1 and M2 Middle Cerebral Artery Occlusions. J. Neurointerv. Surg. 2018, 10, 330–334. [Google Scholar] [CrossRef] [PubMed]
- Mainali, S.; Darsie, M.E.; Smetana, K.S. Machine Learning in Action: Stroke Diagnosis and Outcome Prediction. Front. Neurol. 2021, 12, 734345. [Google Scholar] [CrossRef]
- Ng, Y.S.; Stein, J.; Ning, M.; Black-Schaffer, R.M. Comparison of Clinical Characteristics and Functional Outcomes of Ischemic Stroke in Different Vascular Territories. Stroke 2007, 38, 2309–2314. [Google Scholar] [CrossRef]
- Forkert, N.D.; Verleger, T.; Cheng, B.; Thomalla, G.; Hilgetag, C.C.; Fiehler, J. Multiclass Support Vector Machine-Based Lesion Mapping Predicts Functional Outcome in Ischemic Stroke Patients. PLoS ONE 2015, 10, e0129569. [Google Scholar] [CrossRef]
- Ospel, J.M.; Menon, B.K.; Demchuk, A.M.; Almekhlafi, M.A.; Kashani, N.; Mayank, A.; Fainardi, E.; Rubiera, M.; Khaw, A.; Shankar, J.J.; et al. Clinical Course of Acute Ischemic Stroke due to Medium Vessel Occlusion with and Without Intravenous Alteplase Treatment. Stroke 2020, 51, 3232–3240. [Google Scholar] [CrossRef]
- Adams, H.P.; Bendixen, B.H.; Kappelle, L.J.; Biller, J.; Love, B.B.; Gordon, D.L.; Marsh, E.E. Classification of Subtype of Acute Ischemic Stroke. Definitions for Use in a Multicenter Clinical Trial. TOAST. Trial of Org 10172 in Acute Stroke Treatment. Stroke 1993, 24, 35–41. [Google Scholar] [CrossRef]
- Tan, I.Y.L.; Demchuk, A.M.; Hopyan, J.; Zhang, L.; Gladstone, D.; Wong, K.; Martin, M.; Symons, S.P.; Fox, A.J.; Aviv, R.I. CT Angiography Clot Burden Score and Collateral Score: Correlation with Clinical and Radiologic Outcomes in Acute Middle Cerebral Artery Infarct. AJNR Am. J. Neuroradiol. 2009, 30, 525–531. [Google Scholar] [CrossRef]
- Haussen, D.C.; Lima, F.O.; Bouslama, M.; Grossberg, J.A.; Silva, G.S.; Lev, M.H.; Furie, K.; Koroshetz, W.; Frankel, M.R.; Nogueira, R.G. Thrombectomy versus Medical Management for Large Vessel Occlusion Strokes with Minimal Symptoms: An Analysis from STOPStroke and GESTOR Cohorts. J. NeuroInterv. Surg. 2018, 10, 325–329. [Google Scholar] [CrossRef]
- Meyer, L.; Stracke, C.P.; Jungi, N.; Wallocha, M.; Broocks, G.; Sporns, P.B.; Maegerlein, C.; Dorn, F.; Zimmermann, H.; Naziri, W.; et al. Thrombectomy for Primary Distal Posterior Cerebral Artery Occlusion Stroke: The TOPMOST Study. JAMA Nerol. 2021, 78, 434–444. [Google Scholar] [CrossRef]
- Weisscher, N.; Vermeulen, M.; Roos, Y.B.; de Haan, R.J. What Should Be Defined as Good Outcome in Stroke Trials; a Modified Rankin Score of 0–1 or 0–2? J. Neurol. 2008, 255, 867–874. [Google Scholar] [CrossRef]
- sklearn.impute.KNNImputer. In: Scikit-Learn. Available online: https://scikit-learn/stable/modules/generated/sklearn.impute.KNNImputer.html (accessed on 10 December 2022).
- sklearn.preprocessing.RobustScaler. In: Scikit-Learn. Available online: https://scikit-learn/stable/modules/generated/sklearn.preprocessing.RobustScaler.html (accessed on 10 December 2022).
- sklearn.preprocessing.MinMaxScaler. In: Scikit-Learn. Available online: https://scikit-learn/stable/modules/generated/sklearn.preprocessing.MinMaxScaler.html (accessed on 10 December 2022).
- sklearn.preprocessing.OrdinalEncoder. In: Scikit-Learn. Available online: https://scikit-learn/stable/modules/generated/sklearn.preprocessing.OrdinalEncoder.html (accessed on 10 December 2022).
- sklearn.preprocessing.OneHotEncoder. In: Scikit-Learn. Available online: https://scikit-learn/stable/modules/generated/sklearn.preprocessing.OneHotEncoder.html (accessed on 10 December 2022).
- Radovic, M.; Ghalwash, M.; Filipovic, N.; Obradovic, Z. Minimum Redundancy Maximum Relevance Feature Selection Approach for Temporal Gene Expression Data. BMC Bioinform. 2017, 18, 9. [Google Scholar] [CrossRef]
- Akiba, T.; Sano, S.; Yanase, T.; Ohta, T.; Koyama, M. Optuna: A Next-Generation Hyperparameter Optimization Framework. In Proceedings of the 25th ACM SIGKDD International Conference on Knowledge Discovery & Data Mining, Anchorage, AK, USA, 4–8 August 2019; pp. 2623–2631. [Google Scholar] [CrossRef]
- Heo, J.; Yoon, J.G.; Park, H.; Kim, Y.D.; Nam, H.S.; Heo, J.H. Machine Learning-Based Model for Prediction of Outcomes in Acute Stroke. Stroke 2019, 50, 1263–1265. [Google Scholar] [CrossRef]
- Monteiro, M.; Fonseca, A.C.; Freitas, A.T.; E Melo, T.P.; Francisco, A.P.; Ferro, J.M.; Oliveira, A.L. Using Machine Learning to Improve the Prediction of Functional Outcome in Ischemic Stroke Patients. IEEE/ACM Trans. Comput. Biol. Bioinform. 2018, 15, 1953–1959. [Google Scholar] [CrossRef]
- Brugnara, G.; Neuberger, U.; Mahmutoglu, M.A.; Foltyn, M.; Herweh, C.; Nagel, S.; Schönenberger, S.; Heiland, S.; Ulfert, C.; Ringleb, P.A.; et al. Multimodal Predictive Modeling of Endovascular Treatment Outcome for Acute Ischemic Stroke Using Machine-Learning. Stroke 2020, 51, 3541–3551. [Google Scholar] [CrossRef]
- Ntaios, G.; Faouzi, M.; Ferrari, J.; Lang, W.; Vemmos, K.; Michel, P. An Integer-Based Score to Predict Functional Outcome in Acute Ischemic Stroke: The ASTRAL Score. Neurology 2012, 78, 1916–1922. [Google Scholar] [CrossRef]
- Rost, N.S.; Bottle, A.; Lee, J.-M.; Randall, M.; Middleton, S.; Shaw, L.; Thijs, V.; Rinkel, G.J.E.; Hemmen, T.M. Global Comparators Stroke GOAL collaborators Stroke Severity Is a Crucial Predictor of Outcome: An International Prospective Validation Study. J. Am. Heart Assoc. 2016, 5, e002433. [Google Scholar] [CrossRef]
- Piironen, K.; Putaala, J.; Rosso, C.; Samson, Y. Glucose and Acute Stroke: Evidence for an Interlude. Stroke 2012, 43, 898–902. [Google Scholar] [CrossRef] [PubMed]
- Furlan, J.C.; Vergouwen, M.D.I.; Fang, J.; Silver, F.L. White Blood Cell Count Is an Independent Predictor of Outcomes after Acute Ischaemic Stroke. Eur. J. Neurol. 2014, 21, 215–222. [Google Scholar] [CrossRef] [PubMed]


Disclaimer/Publisher’s Note: The statements, opinions and data contained in all publications are solely those of the individual author(s) and contributor(s) and not of MDPI and/or the editor(s). MDPI and/or the editor(s) disclaim responsibility for any injury to people or property resulting from any ideas, methods, instructions or products referred to in the content. |
© 2023 by the authors. Licensee MDPI, Basel, Switzerland. This article is an open access article distributed under the terms and conditions of the Creative Commons Attribution (CC BY) license (https://creativecommons.org/licenses/by/4.0/).