
Prevalence of Sleep Disturbances in Latin American Populations and Its Association with Their Socioeconomic Status—A Systematic Review and a Meta-Analysis

 , , , , and
Abstract
:1. Introduction
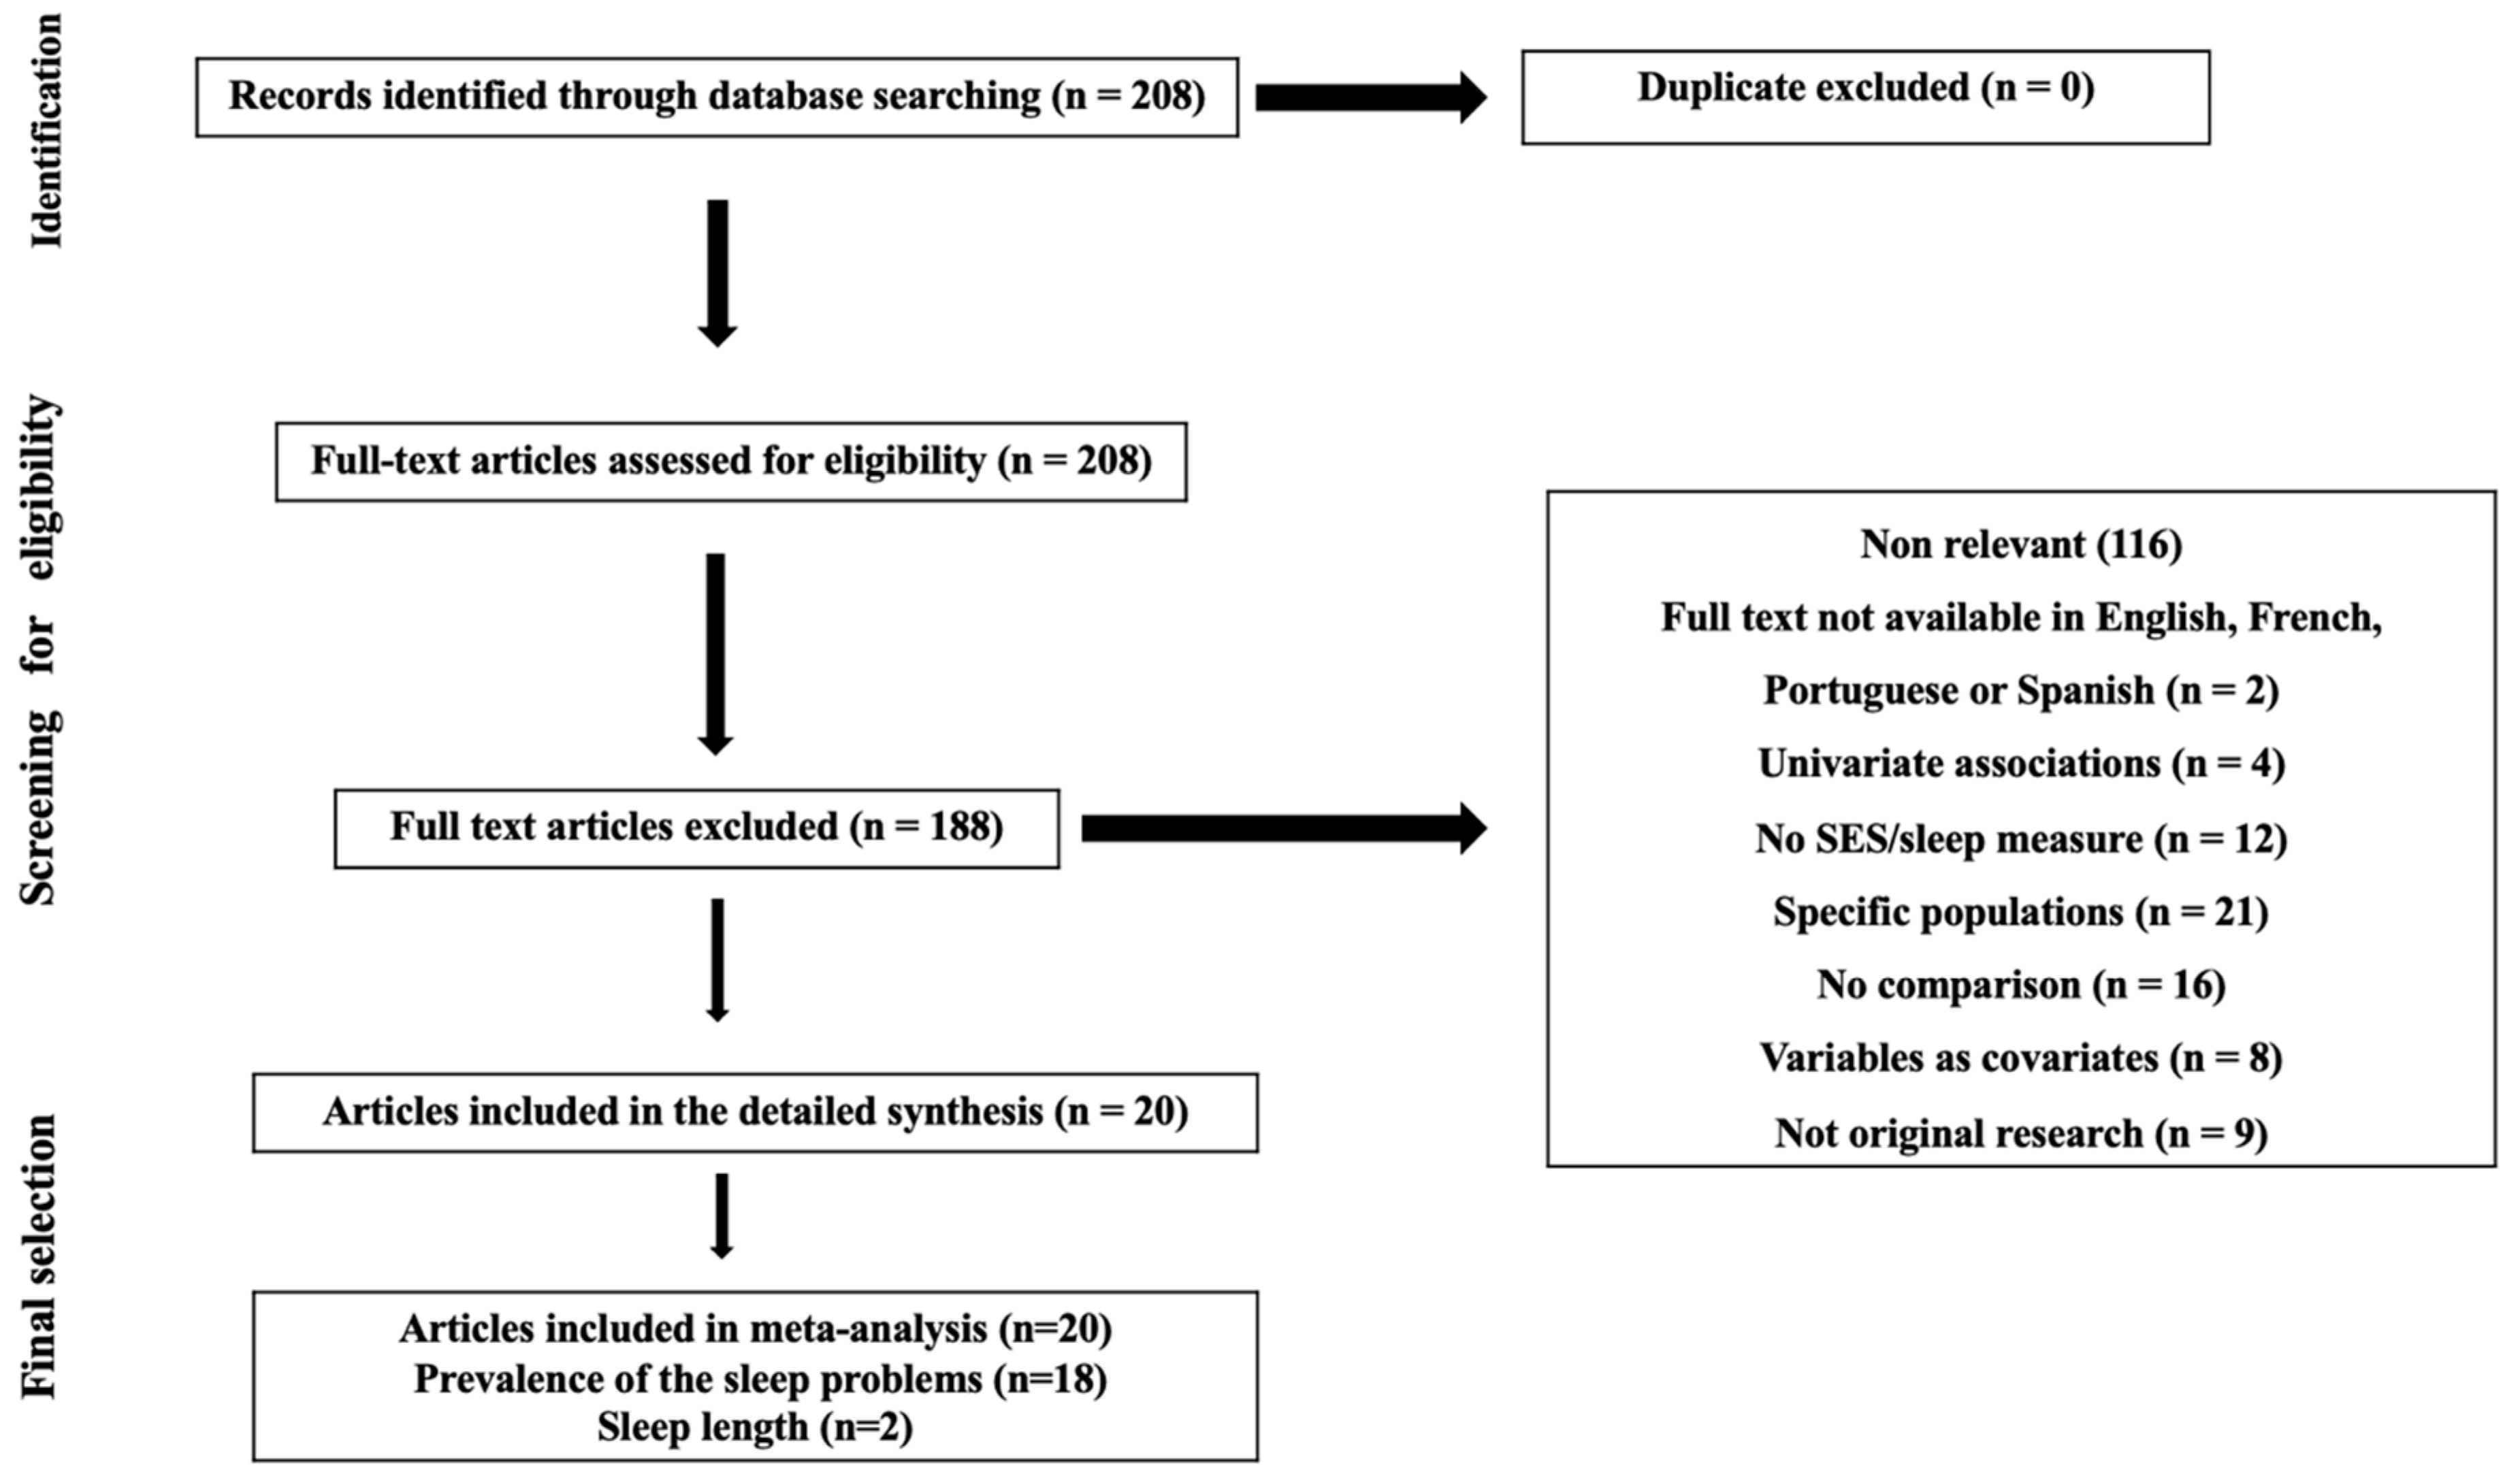
2. Methods
2.1. Literature Search
2.2. Inclusion and Exclusion Criteria
2.3. Selection of Evidence and Data Extraction
2.4. Quality Rating of Studies
2.5. Study Outcomes
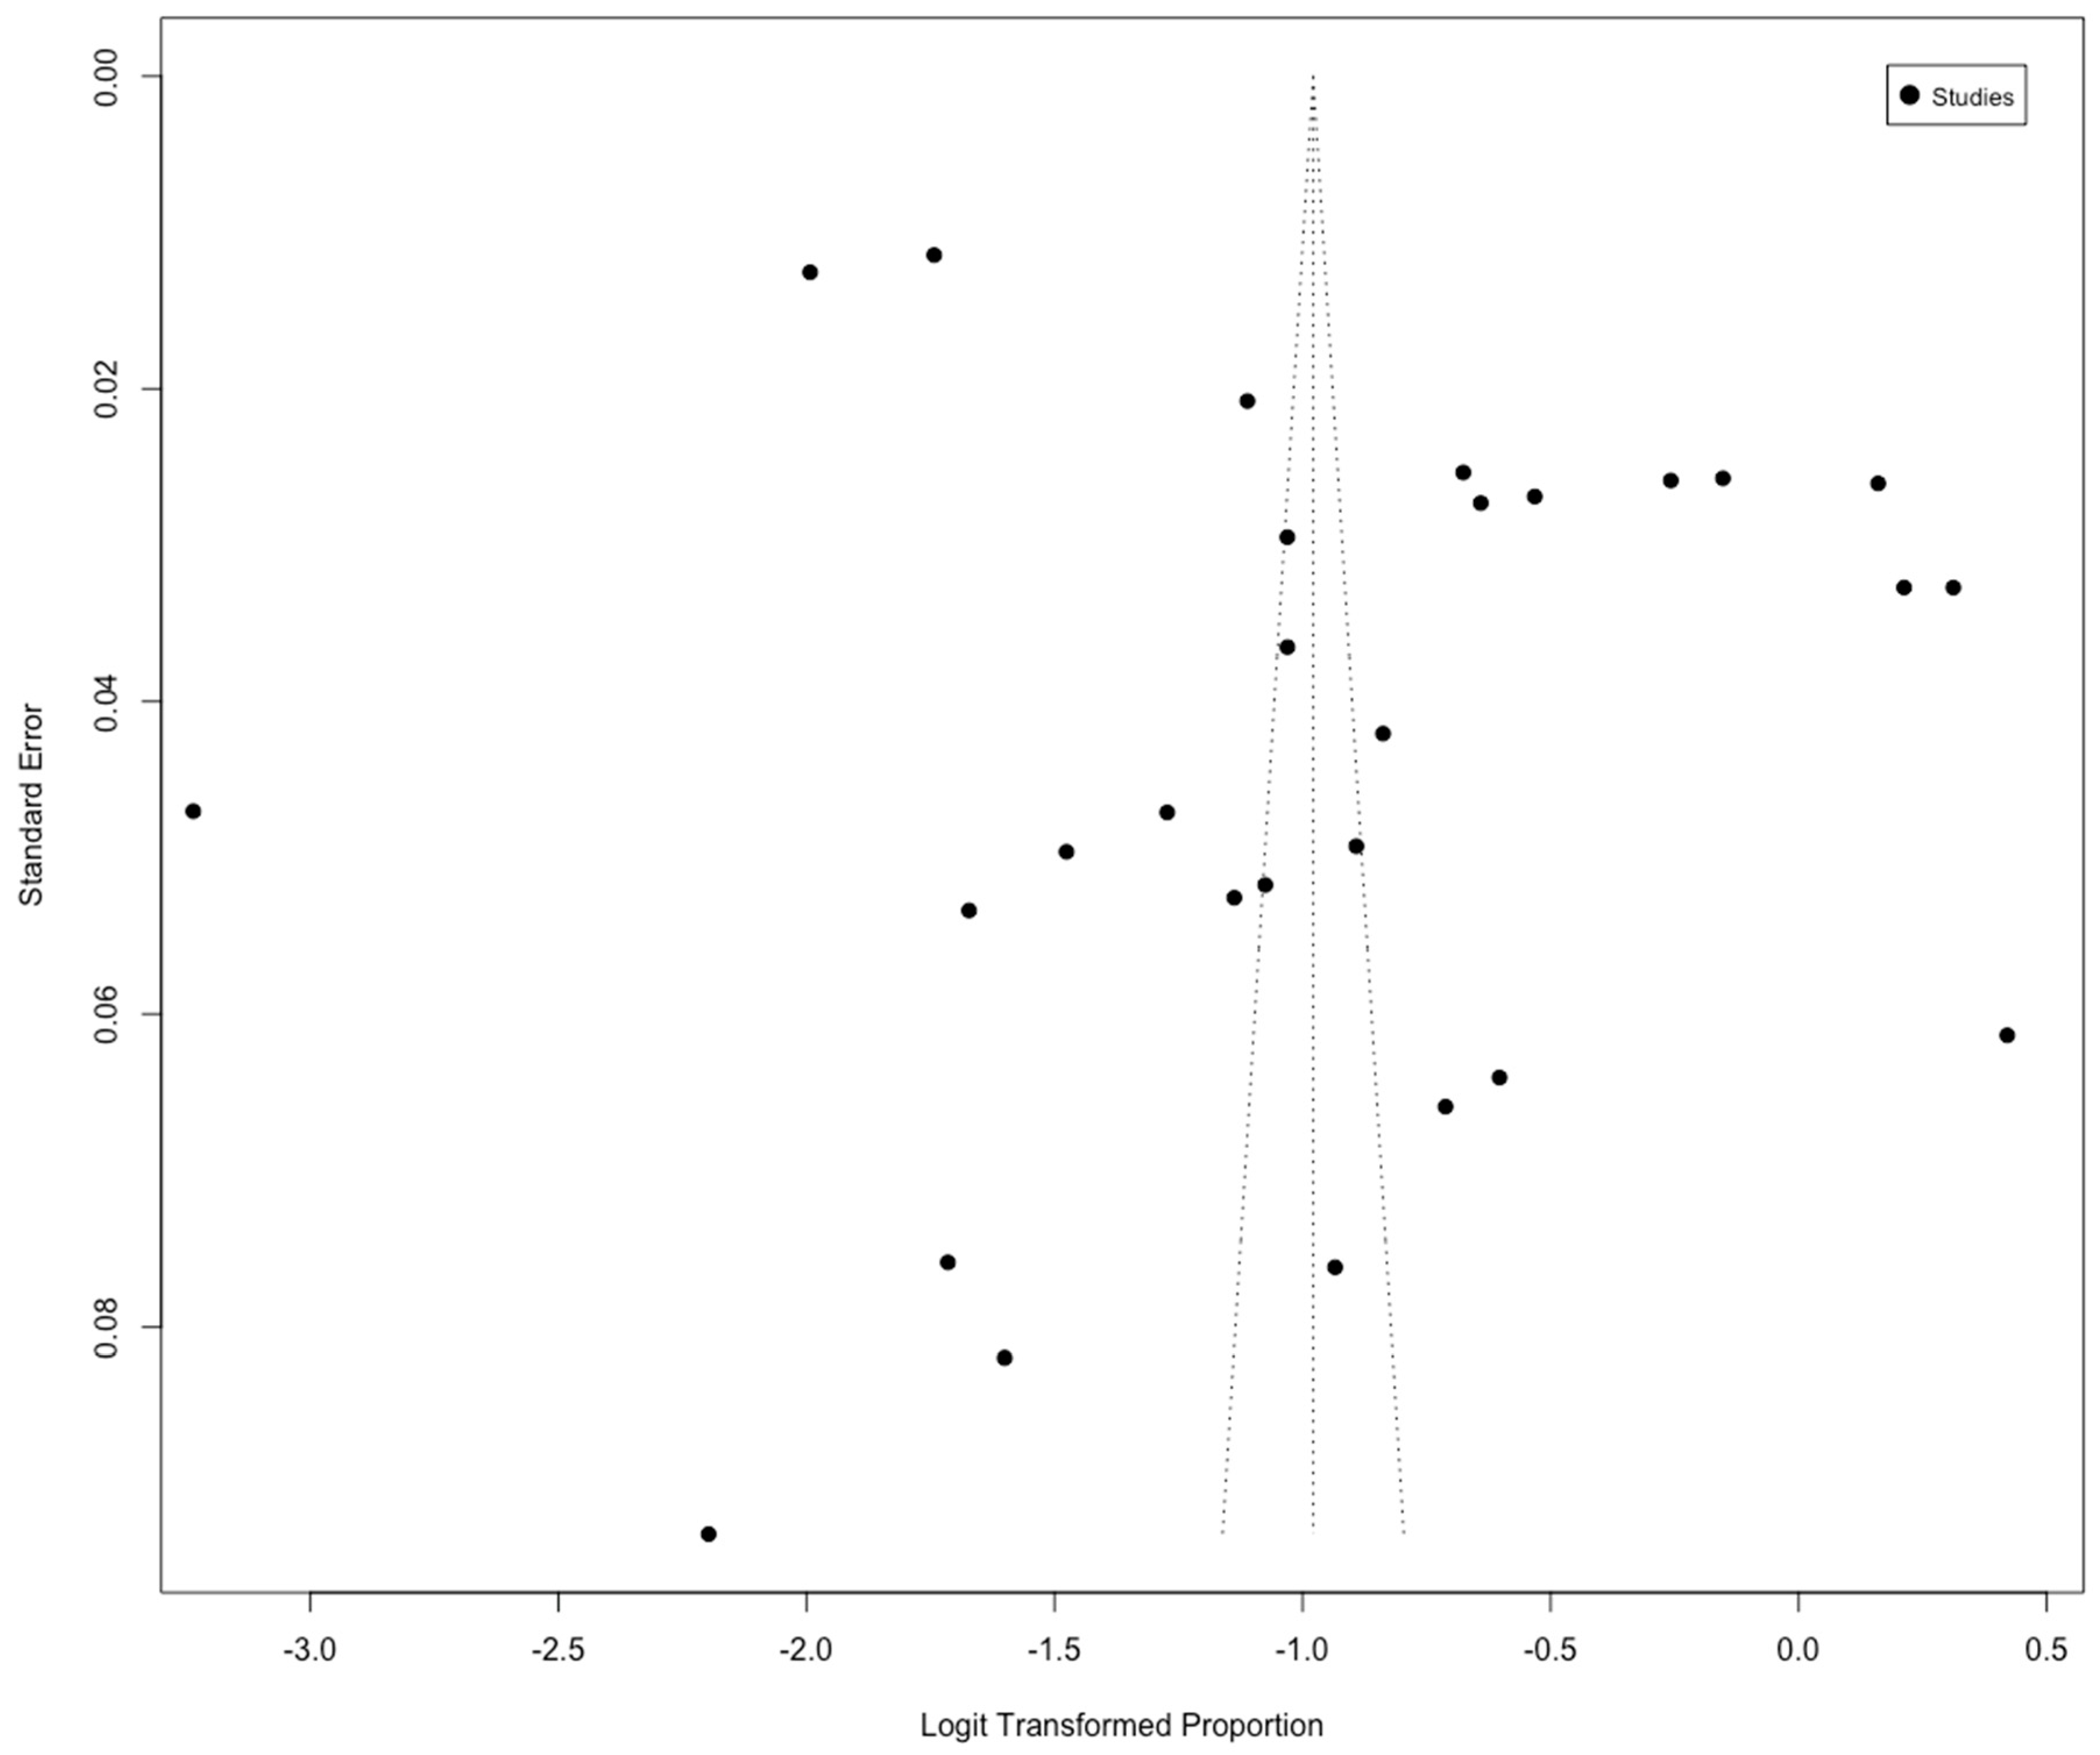
2.6. Data Analysis
3. Results
3.1. Characteristics of Included Articles
3.2. Descriptive Synthesis of Articles
3.2.1. Sleep Duration
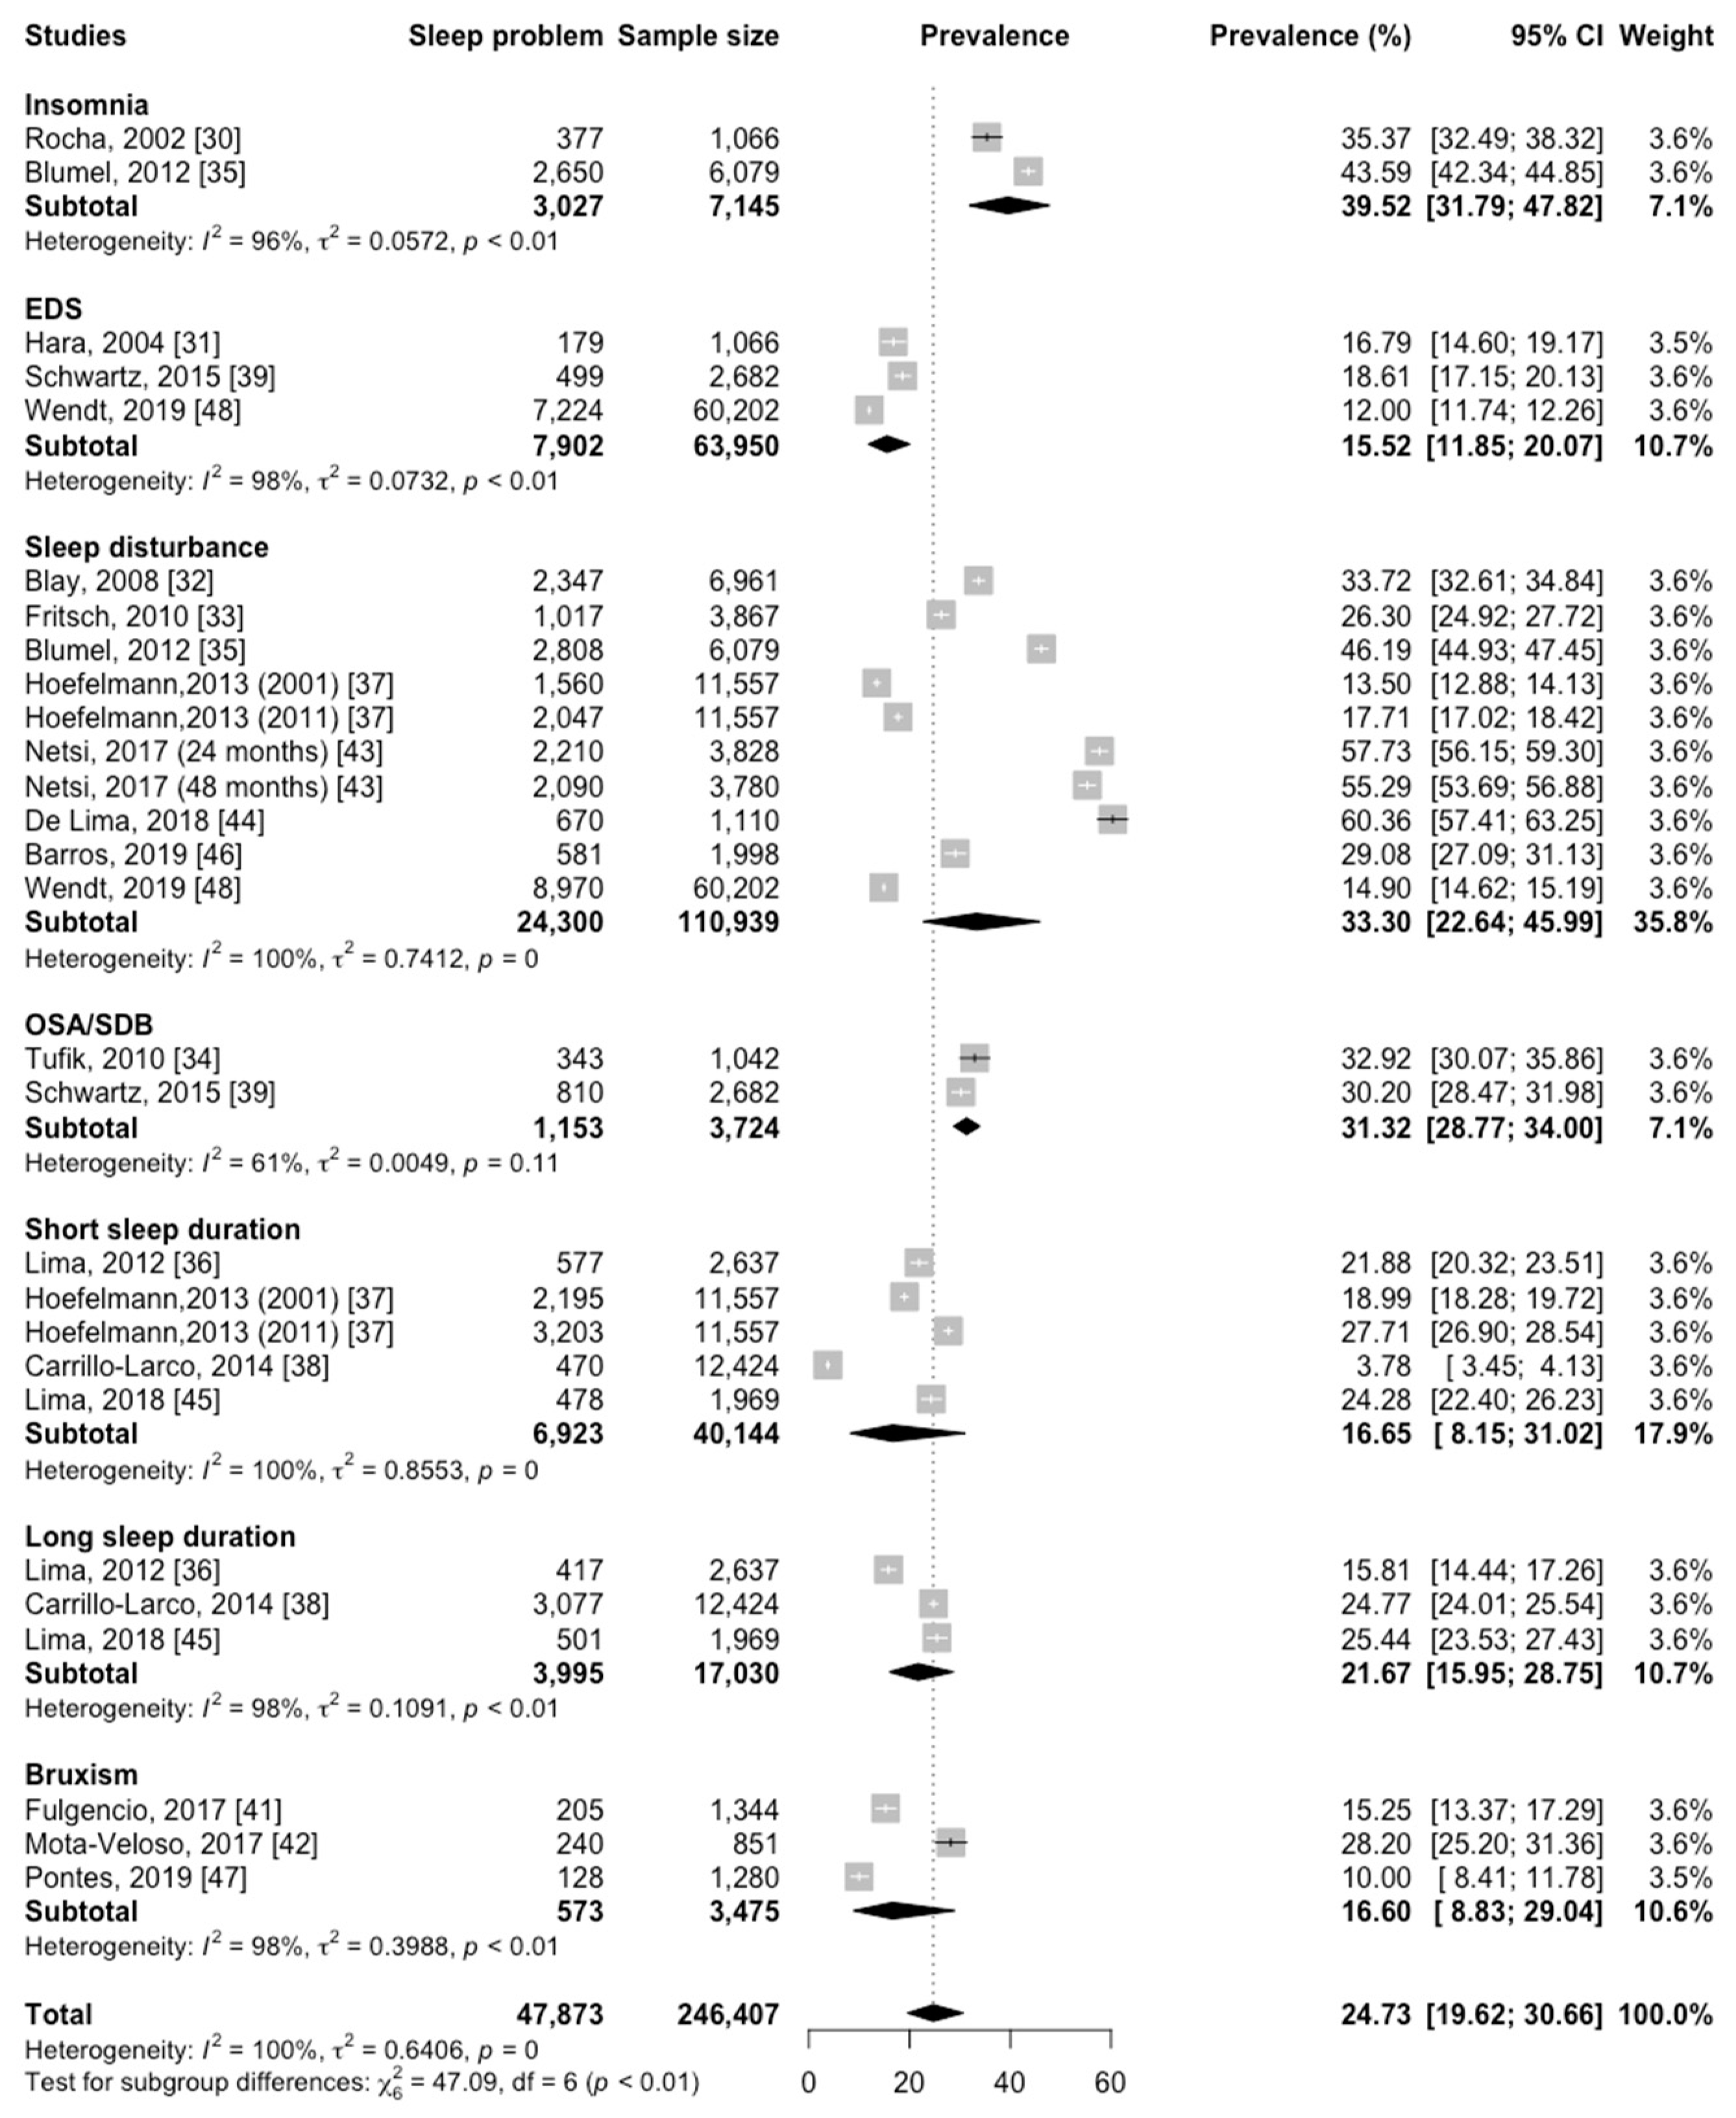
3.2.2. Sleep Quality/Sleep Disturbance
3.2.3. Insomnia
3.2.4. Excessive Daytime Sleepiness
3.2.5. Obstructive Sleep Apnea (OSA)/Sleep-Disordered Breathing (SDB) Symptoms
3.2.6. Bruxism
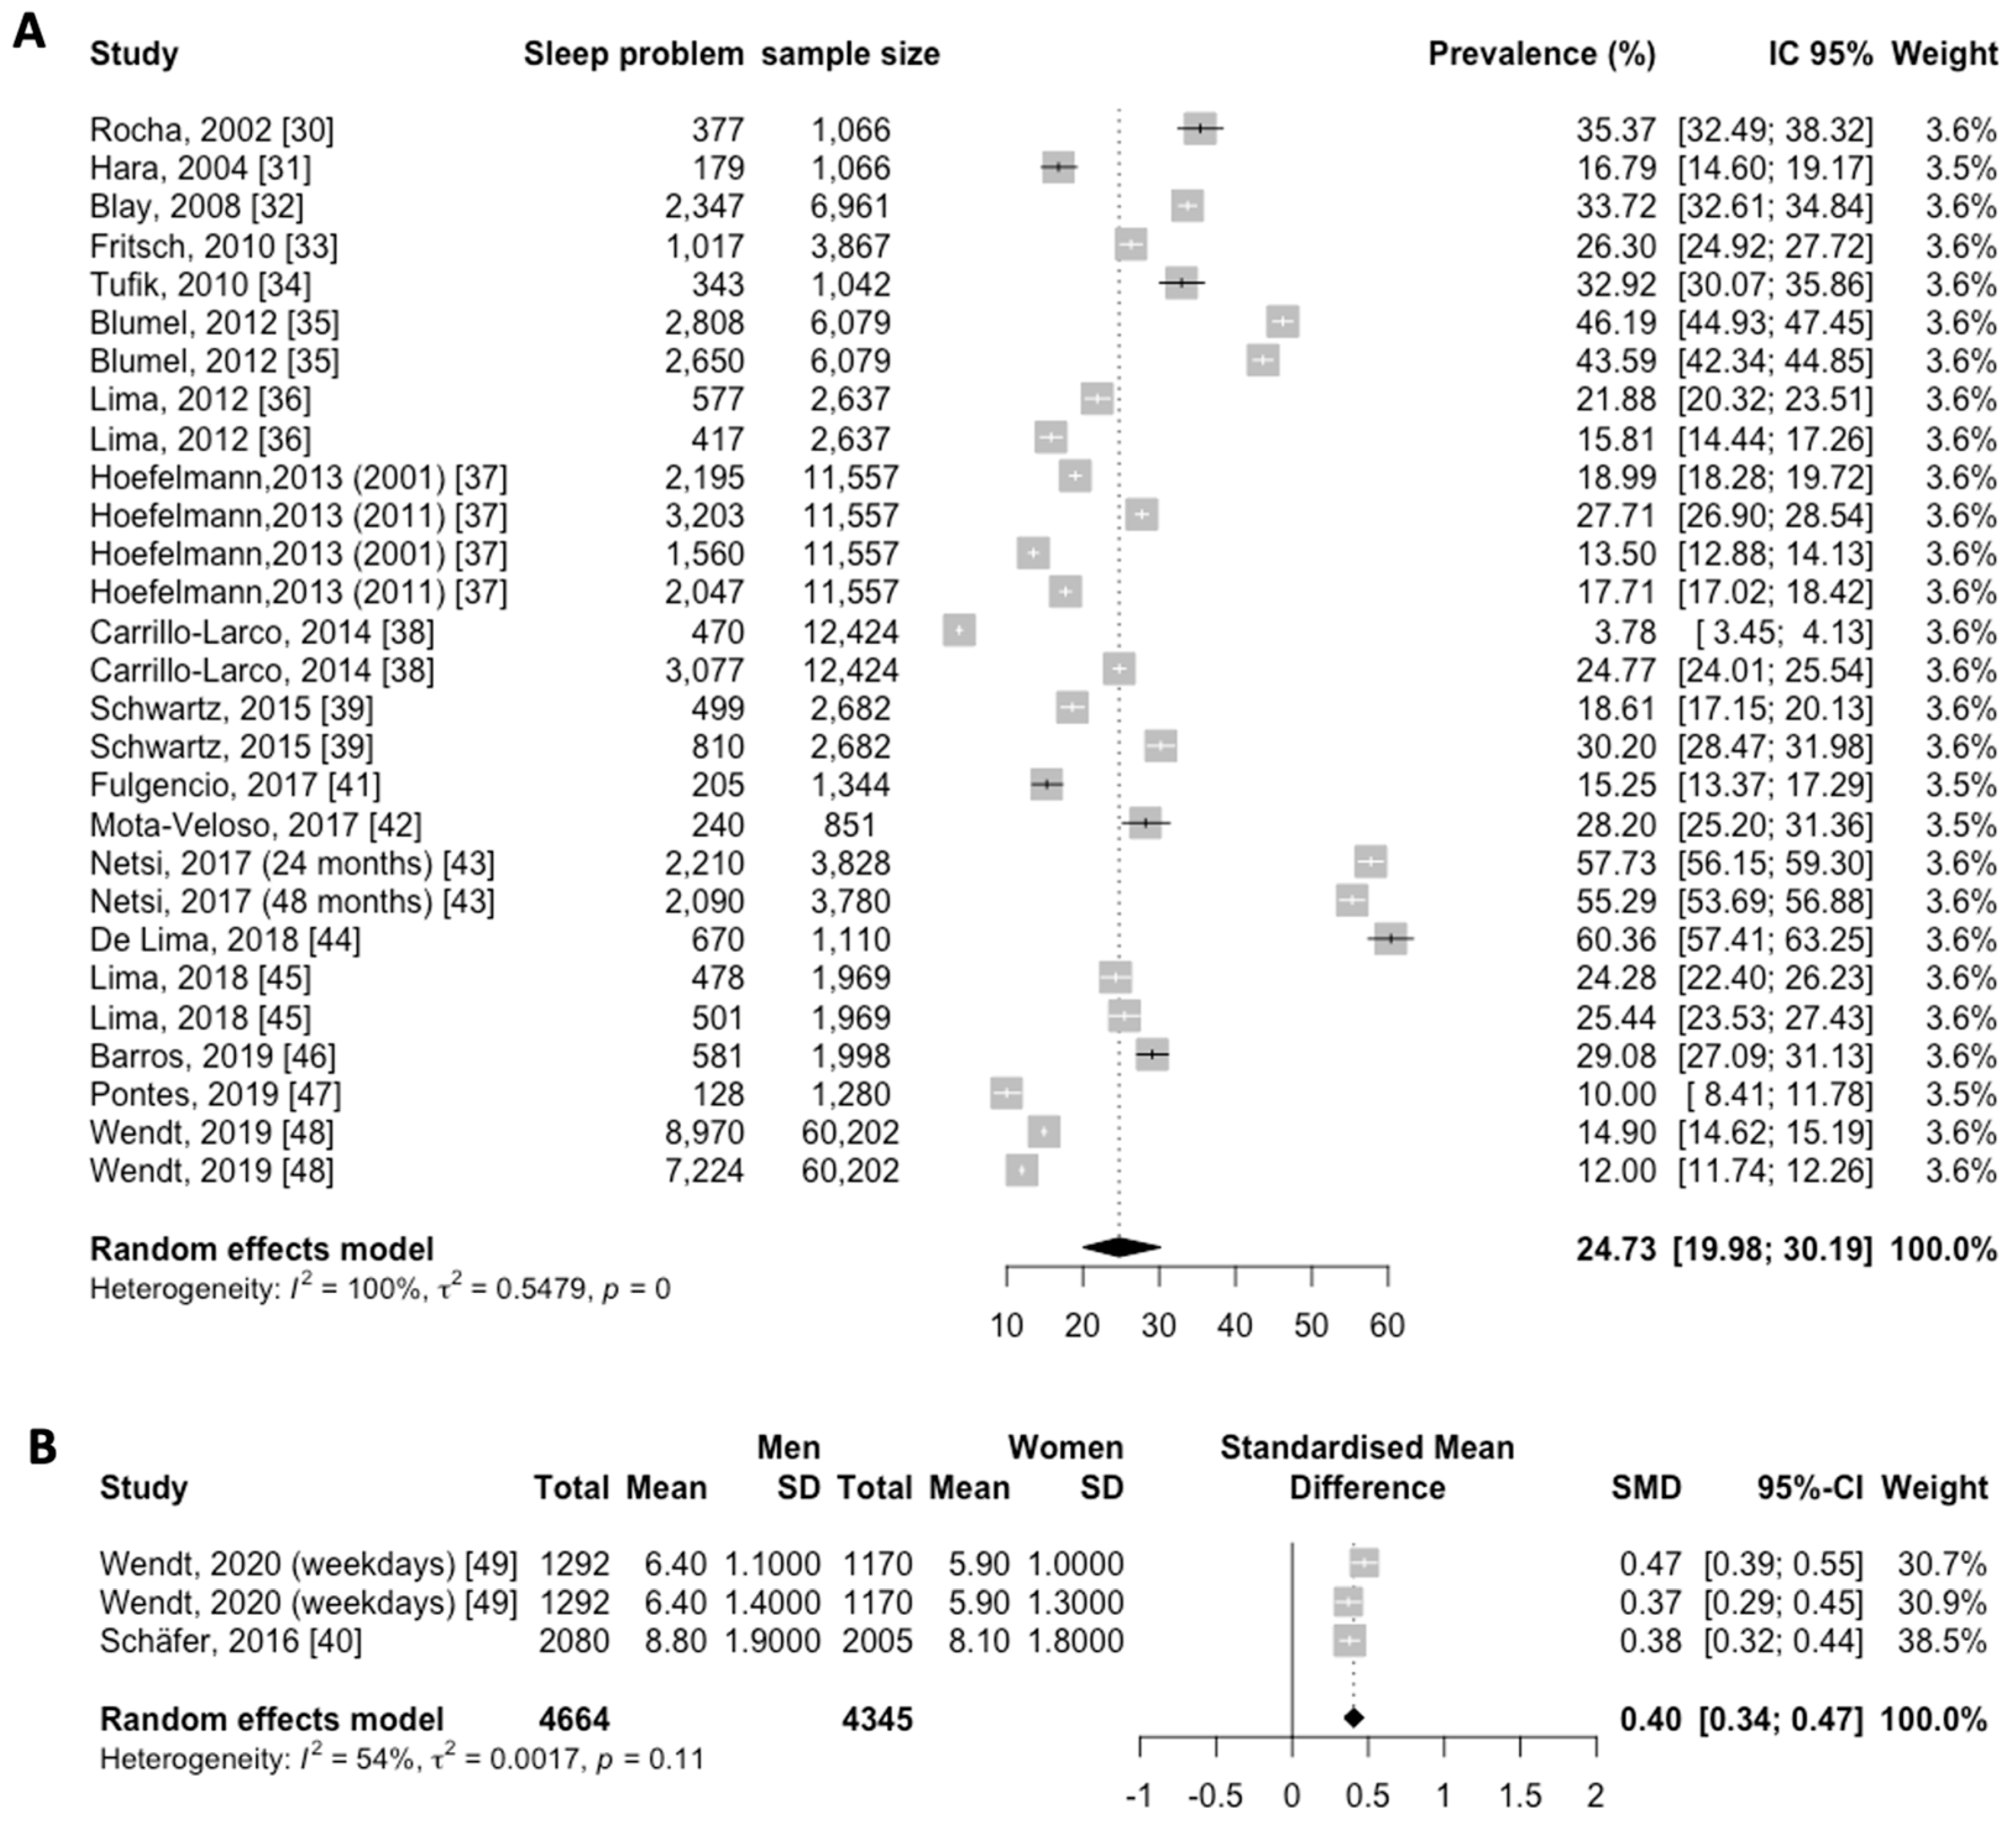
3.3. Prevalence of Sleep Disturbances in Latin America
3.4. Sleep Length in Latin America
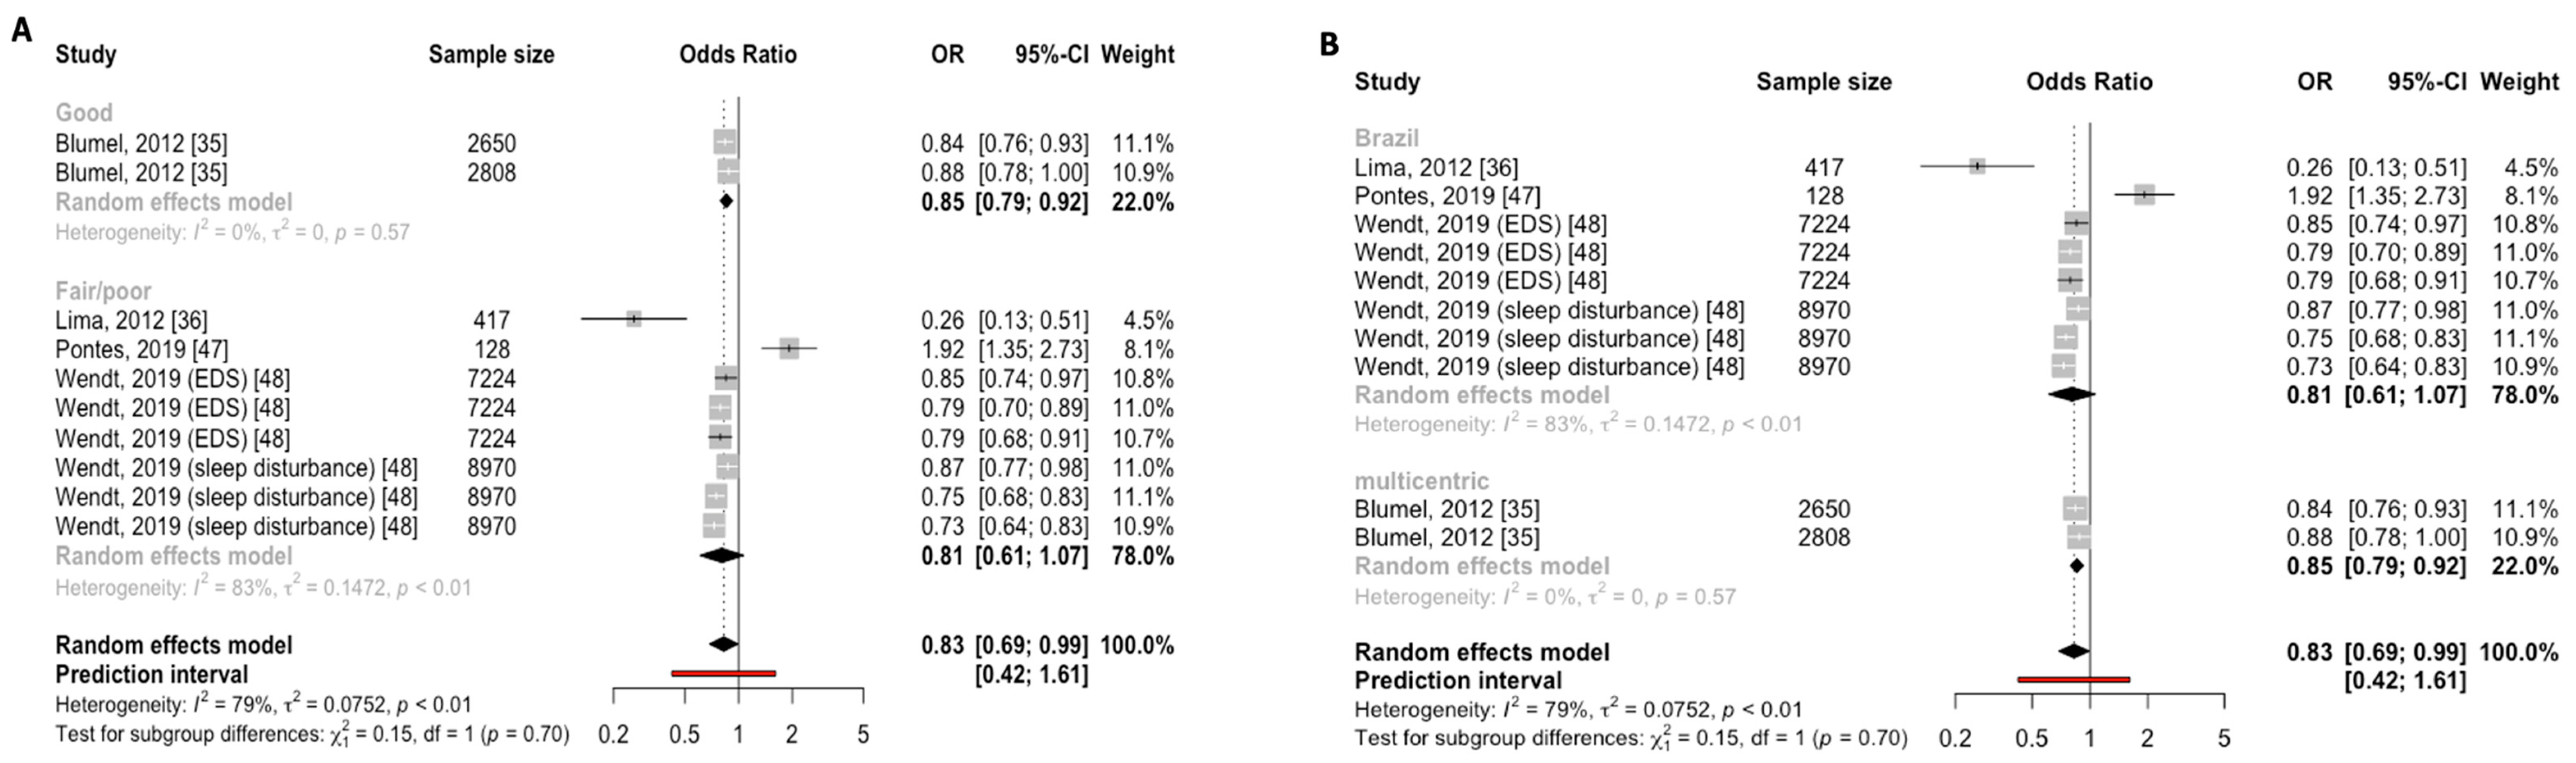
3.5. Subgroup Analysis
3.6. Risk Factors
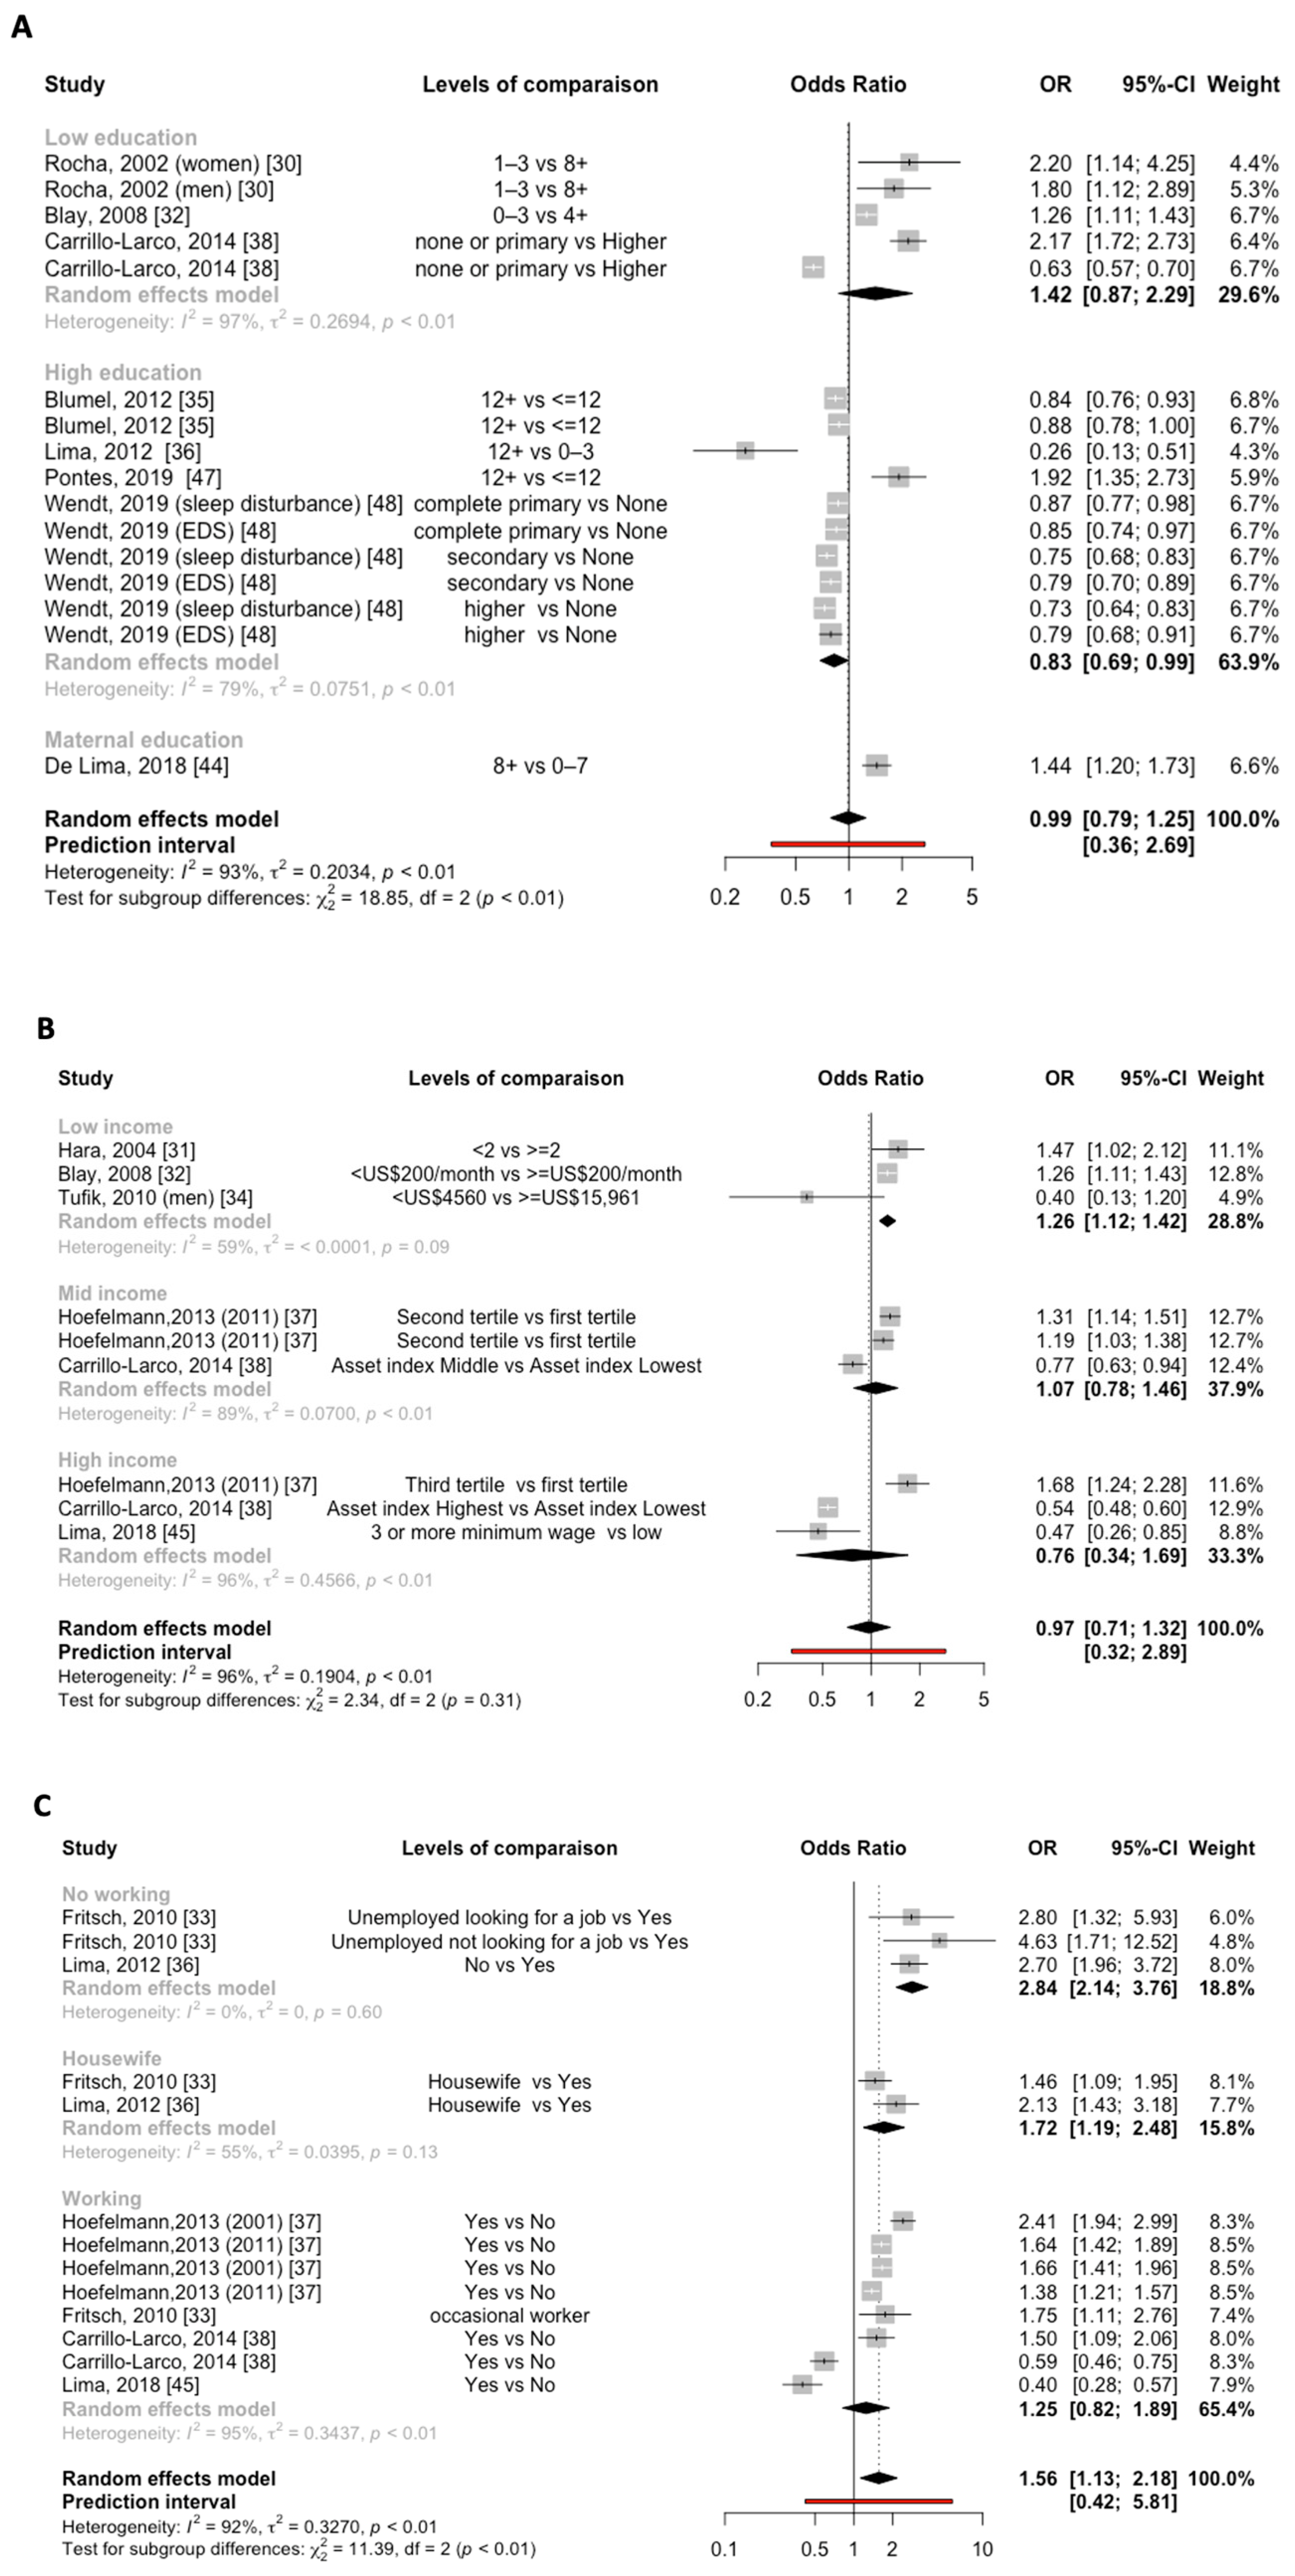
3.6.1. Education and Sleep Disturbances
3.6.2. Income and Sleep Disturbances
3.6.3. Work and Sleep Disturbances

4. Discussion
4.1. Detailed Summary of Findings
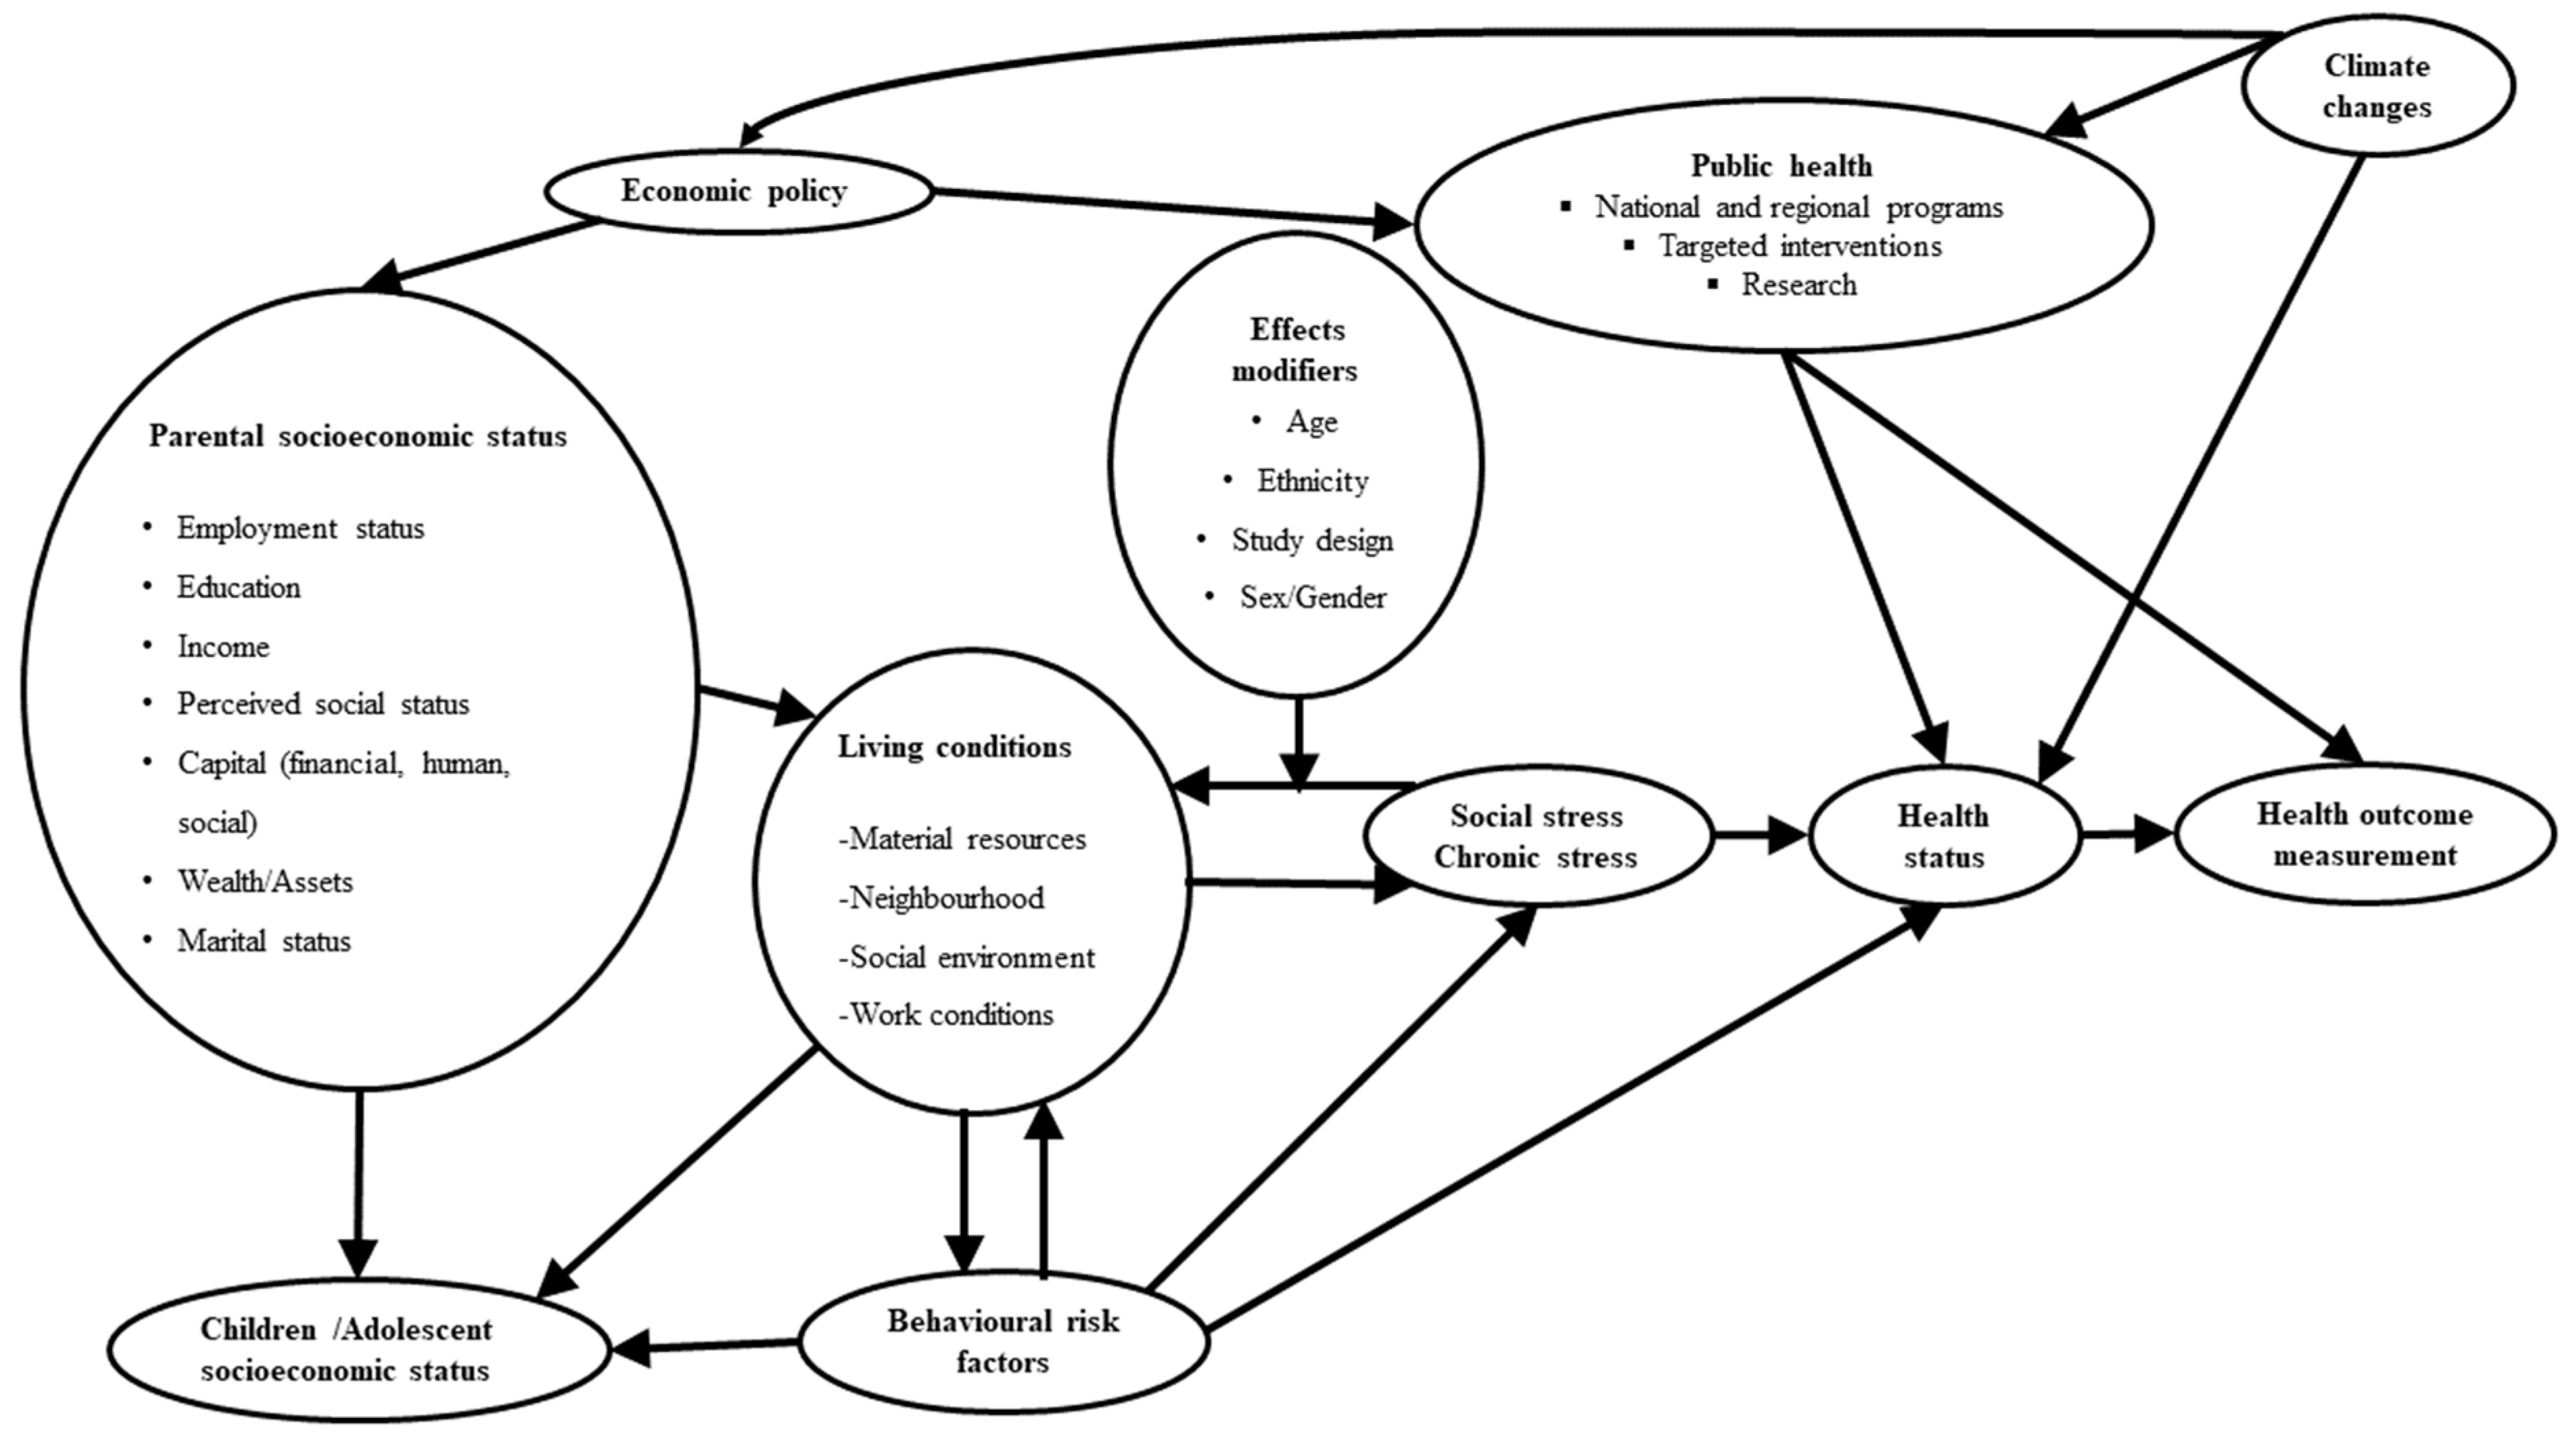
4.2. Relationship with Public Health Literature
4.3. The Necessity of a Multidimensional Sleep Management
5. Conclusions
Author Contributions
Funding
Institutional Review Board Statement
Informed Consent Statement
Data Availability Statement
Conflicts of Interest
References
- Hale, L.; Troxel, W.; Buysse, D.J. Sleep Health: An Opportunity for Public Health to Address Health Equity. Annu. Rev. Public Health 2020, 41, 81–99. [Google Scholar] [CrossRef]
- Grandner, M.A. Sleep, Health, and Society. Sleep Med. Clin. 2020, 15, 319–340. [Google Scholar] [CrossRef]
- Carroll, J.E.; Irwin, M.R.; Merkin, S.S.; Seeman, T.E. Sleep and Multisystem Biological Risk: A Population-Based Study. PLoS ONE 2015, 10, e0118467. [Google Scholar] [CrossRef]
- Lo Martire, V.; Caruso, D.; Palagini, L.; Zoccoli, G.; Bastianini, S. Stress & Sleep: A Relationship Lasting a Lifetime. Neurosci. Biobehav. Rev. 2020, 117, 65–77. [Google Scholar] [CrossRef] [PubMed]
- Vermeiren, A.P.; Willeboordse, M.; Oosterhoff, M.; Bartelink, N.; Muris, P.; Bosma, H. Socioeconomic Multi-Domain Health Inequalities in Dutch Primary School Children. Eur. J. Public Health 2018, 28, 610–616. [Google Scholar] [CrossRef] [PubMed]
- Etindele Sosso, F.A. Measuring Sleep Health Disparities with Polysomnography: A Systematic Review of Preliminary Findings. Clocks Sleep 2022, 4, 80–87. [Google Scholar] [CrossRef] [PubMed]
- Etindele Sosso, F.A.; Holmes, S.D.; Weinstein, A.A. Influence of Socioeconomic Status on Objective Sleep Measurement: A Systematic Review and Meta-Analysis of Actigraphy Studies. Sleep Health 2021, 7, 417–428. [Google Scholar] [CrossRef]
- Etindele-Sosso, F.A. Insomnia, Excessive Daytime Sleepiness, Anxiety, Depression and Socioeconomic Status among Customer Service Employees in Canada. Sleep Sci. 2020, 13, 54–64. [Google Scholar] [CrossRef] [PubMed]
- Berwick, D.M. The Moral Determinants of Health. JAMA 2020, 324, 225–226. [Google Scholar] [CrossRef] [PubMed]
- Rodriguez, J.M.; Karlamangla, A.S.; Gruenewald, T.L.; Miller-Martinez, D.; Merkin, S.S.; Seeman, T.E. Social Stratification and Allostatic Load: Shapes of Health Differences in the MIDUS Study in the United States. J. Biosoc. Sci. 2019, 51, 627–644. [Google Scholar] [CrossRef]
- Etindele Sosso, F.A.; Kreidlmayer, M.; Pearson, D.; Bendaoud, I. Towards A Socioeconomic Model of Sleep Health among the Canadian Population: A Systematic Review of the Relationship between Age, Income, Employment, Education, Social Class, Socioeconomic Status and Sleep Disparities. Eur. J. Investig. Health Psychol. Educ. 2022, 12, 1143–1167. [Google Scholar] [CrossRef] [PubMed]
- Grandner, M.A. Chapter 5—Social-Ecological Model of Sleep Health. In Sleep and Health; Grandner, M.A., Ed.; Academic Press: Cambridge, MA, USA, 2019; pp. 45–53. ISBN 978-0-12-815373-4. [Google Scholar]
- van de Straat, V.; Cheval, B.; Schmidt, R.E.; Sieber, S.; Courvoisier, D.; Kliegel, M.; Burton-Jeangros, C.; Cullati, S.; Bracke, P. Early Predictors of Impaired Sleep: A Study on Life Course Socioeconomic Conditions and Sleeping Problems in Older Adults. Aging Ment. Health 2020, 24, 322–332. [Google Scholar] [CrossRef]
- Papadopoulos, D.; Sosso, F.E.; Khoury, T.; Surani, S.R. Sleep Disturbances Are Mediators Between Socioeconomic Status and Health: A Scoping Review. Int. J. Ment. Health Addict. 2022, 20, 480–504. [Google Scholar] [CrossRef]
- Mayne, S.L.; Mitchell, J.A.; Virudachalam, S.; Williamson, A.A. 0397 Neighborhood Physical and Social Environments and Sleep Among Children and Adolescents: A Systematic Review. Sleep 2020, 43, A152. [Google Scholar] [CrossRef]
- Petrovic, D.; Haba-Rubio, J.; Carmeli, C.; Vollenweider, P.; Heinzer, R.; Stringhini, S. Social Inequalities in Sleep-Disordered Breathing: Evidence from the CoLaus|HypnoLaus Study. J. Sleep Res. 2019, 28, e12799. [Google Scholar] [CrossRef] [PubMed]
- Mai, Q.D.; Hill, T.D.; Vila-Henninger, L.; Grandner, M.A. Employment Insecurity and Sleep Disturbance: Evidence from 31 European Countries. J. Sleep Res. 2019, 28, e12763. [Google Scholar] [CrossRef]
- Papadopoulos, D.; Etindele Sosso, F.A. Socioeconomic Status and Sleep Health: A Narrative Synthesis of Three Decades of Empirical Research. J. Clin. Sleep Med. JCSM Off. Publ. Am. Acad. Sleep Med. 2023, 19, 605–620. [Google Scholar] [CrossRef]
- Wu, W.; Jiang, Y.; Wang, N.; Zhu, M.; Liu, X.; Jiang, F.; Zhao, G.; Zhao, Q. Sleep Quality of Shanghai Residents: Population-Based Cross-Sectional Study. Qual. Life Res. Int. J. Qual. Life Asp. Treat. Care Rehabil. 2020, 29, 1055–1064. [Google Scholar] [CrossRef]
- Visvalingam, N.; Sathish, T.; Soljak, M.; Chua, A.-P.; Dunleavy, G.; Divakar, U.; Nazeha, N.; Bajpai, R.; Soh, C.K.; Woon, K.K.; et al. Prevalence of and Factors Associated with Poor Sleep Quality and Short Sleep in a Working Population in Singapore. Sleep Health 2020, 6, 277–287. [Google Scholar] [CrossRef]
- Metse, A.P.; Bowman, J.A. Prevalence of Self-Reported Suboptimal Sleep in Australia and Receipt of Sleep Care: Results from the 2017 National Social Survey. Sleep Health J. Natl. Sleep Found. 2020, 6, 100–109. [Google Scholar] [CrossRef]
- Muller, D.; Paine, S.-J.; Wu, L.J.; Signal, T.L. How Long Do Preschoolers in Aotearoa/New Zealand Sleep? Associations with Ethnicity and Socioeconomic Position. Sleep Health 2019, 5, 452–458. [Google Scholar] [CrossRef] [PubMed]
- Ribeiro, A.I.; Amaro, J.; Lisi, C.; Fraga, S. Neighborhood Socioeconomic Deprivation and Allostatic Load: A Scoping Review. Int. J. Environ. Res. Public Health 2018, 15, 1092. [Google Scholar] [CrossRef]
- Page, M.J.; McKenzie, J.E.; Bossuyt, P.M.; Boutron, I.; Hoffmann, T.C.; Mulrow, C.D.; Shamseer, L.; Tetzlaff, J.M.; Akl, E.A.; Brennan, S.E.; et al. The PRISMA 2020 Statement: An Updated Guideline for Reporting Systematic Reviews. BMJ 2021, 372, n71. [Google Scholar] [CrossRef] [PubMed]
- National Institute of Health. Study Quality Assessment Tool; National Institutes of Health: Bethesda, MD, USA, 2018.
- Barendregt, J.J.; Doi, S.A.; Lee, Y.Y.; Norman, R.E.; Vos, T. Meta-Analysis of Prevalence. J. Epidemiol. Community Health 2013, 67, 974–978. [Google Scholar] [CrossRef] [PubMed]
- Borenstein, M.; Higgins, J.P.T.; Hedges, L.V.; Rothstein, H.R. Basics of Meta-Analysis: I2 Is Not an Absolute Measure of Heterogeneity. Res. Synth. Methods 2017, 8, 5–18. [Google Scholar] [CrossRef] [PubMed]
- Higgins, J.P.T.; Thompson, S.G.; Spiegelhalter, D.J. A Re-Evaluation of Random-Effects Meta-Analysis. J. R. Stat. Soc. Ser. A Stat. Soc. 2009, 172, 137–159. [Google Scholar] [CrossRef] [PubMed]
- Egger, M.; Davey Smith, G.; Schneider, M.; Minder, C. Bias in Meta-Analysis Detected by a Simple, Graphical Test. BMJ 1997, 315, 629–634. [Google Scholar] [CrossRef]
- Rocha, F.L.; Guerra, H.L.; Lima-Costa, M.F.F. Prevalence of Insomnia and Associated Socio-Demographic Factors in a Brazilian Community: The Bambuí Study. Sleep Med. 2002, 3, 121–126. [Google Scholar] [CrossRef]
- Hara, C.; Lopes Rocha, F.; Lima-Costa, M.F.F. Prevalence of Excessive Daytime Sleepiness and Associated Factors in a Brazilian Community: The Bambuí Study. Sleep Med. 2004, 5, 31–36. [Google Scholar] [CrossRef]
- Blay, S.L.; Andreoli, S.B.; Gastal, F.L. Prevalence of Self-Reported Sleep Disturbance among Older Adults and the Association of Disturbed Sleep with Service Demand and Medical Conditions. Int. Psychogeriatr. 2008, 20, 582–595. [Google Scholar] [CrossRef]
- Fritsch Montero, R.; Lahsen Martínez, P.; Romeo Gómez, R.; Araya Baltra, R.; Rojas Castillo, G. Sleep Disorders in the Adult Population of Santiago of Chile and Its Association with Common Psychiatric Disorders. Actas Esp. Psiquiatr. 2010, 38, 358–364. [Google Scholar]
- Tufik, S.; Santos-Silva, R.; Taddei, J.A.; Bittencourt, L.R.A. Obstructive Sleep Apnea Syndrome in the Sao Paulo Epidemiologic Sleep Study. Sleep Med. 2010, 11, 441–446. [Google Scholar] [CrossRef]
- Blümel, J.E.; Cano, A.; Mezones-Holguín, E.; Barón, G.; Bencosme, A.; Benítez, Z.; Bravo, L.M.; Calle, A.; Flores, D.; Espinoza, M.T.; et al. A Multinational Study of Sleep Disorders during Female Mid-Life. Maturitas 2012, 72, 359–366. [Google Scholar] [CrossRef] [PubMed]
- Lima, M.G.; Bergamo Francisco, P.M.S.; de Azevedo Barros, M.B. Sleep Duration Pattern and Chronic Diseases in Brazilian Adults (ISACAMP, 2008/09). Sleep Med. 2012, 13, 139–144. [Google Scholar] [CrossRef]
- Hoefelmann, L.P.; Lopes, A.D.S.; da Silva, K.S.; Moritz, P.; Nahas, M.V. Sociodemographic Factors Associated with Sleep Quality and Sleep Duration in Adolescents from Santa Catarina, Brazil: What Changed between 2001 and 2011? Sleep Med. 2013, 14, 1017–1023. [Google Scholar] [CrossRef]
- Carrillo-Larco, R.M.; Bernabé-Ortiz, A.; Miranda, J.J.; Rey de Castro, J. Peruvians’ Sleep Duration: Analysis of a Population-Based Survey on Adolescents and Adults. PeerJ 2014, 2, e345. [Google Scholar] [CrossRef]
- Schwartz, N.G.; Rattner, A.; Schwartz, A.R.; Mokhlesi, B.; Gilman, R.H.; Bernabe-Ortiz, A.; Miranda, J.J.; Checkley, W. Sleep Disordered Breathing in Four Resource-Limited Settings in Peru: Prevalence, Risk Factors, and Association with Chronic Diseases. Sleep 2015, 38, 1451–1459. [Google Scholar] [CrossRef]
- Schäfer, A.A.; Domingues, M.R.; Dahly, D.L.; Meller, F.O.; Gonçalves, H.; Wehrmeister, F.C.; Assunção, M.C.F. Correlates of Self-Reported Weekday Sleep Duration in Adolescents: The 18-Year Follow-up of the 1993 Pelotas (Brazil) Birth Cohort Study. Sleep Med. 2016, 23, 81–88. [Google Scholar] [CrossRef]
- Fulgencio, L.B.; Corrêa-Faria, P.; Lage, C.F.; Paiva, S.M.; Pordeus, I.A.; Serra-Negra, J.M. Diagnosis of Sleep Bruxism Can Assist in the Detection of Cases of Verbal School Bullying and Measure the Life Satisfaction of Adolescents. Int. J. Paediatr. Dent. 2017, 27, 293–301. [Google Scholar] [CrossRef] [PubMed]
- Mota-Veloso, I.; Celeste, R.K.; Fonseca, C.P.; Soares, M.E.C.; Marques, L.S.; Ramos-Jorge, M.L.; Ramos-Jorge, J. Effects of Attention Deficit Hyperactivity Disorder Signs and Socio-Economic Status on Sleep Bruxism and Tooth Wear among Schoolchildren: Structural Equation Modelling Approach. Int. J. Paediatr. Dent. 2017, 27, 523–531. [Google Scholar] [CrossRef]
- Netsi, E.; Santos, I.S.; Stein, A.; Barros, F.C.; Barros, A.J.D.; Matijasevich, A. A Different Rhythm of Life: Sleep Patterns in the First 4 Years of Life and Associated Sociodemographic Characteristics in a Large Brazilian Birth Cohort. Sleep Med. 2017, 37, 77–87. [Google Scholar] [CrossRef] [PubMed]
- de Lima, T.R.; Silva, D.A.S. Association of Sleep Quality with Sociodemographic Factors and Lifestyle in Adolescents from Southern Brazil. World J. Pediatr. WJP 2018, 14, 383–391. [Google Scholar] [CrossRef] [PubMed]
- Lima, M.G.; Barros, M.B.D.A.; Ceolim, M.F.; Zancanella, E.; Cardoso, T.A.M.D.O. Sleep Duration, Health Status, and Subjective Well-Being: A Population-Based Study. Rev. Saude Publica 2018, 52, 82. [Google Scholar] [CrossRef] [PubMed]
- Barros, M.B.D.A.; Lima, M.G.; Ceolim, M.F.; Zancanella, E.; Cardoso, T.A.M.D.O. Quality of Sleep, Health and Well-Being in a Population-Based Study. Rev. Saúde Pública 2019, 53, 82. [Google Scholar] [CrossRef] [PubMed]
- Pontes, L.D.S.; Prietsch, S.O.M. Sleep bruxism: Population based study in people with 18 years or more in the city of Rio Grande, Brazil. Rev. Bras. Epidemiol. Braz. J. Epidemiol. 2019, 22, e190038. [Google Scholar] [CrossRef]
- Wendt, A.; Costa, C.S.; Machado, A.K.F.; Costa, F.S.; Neves, R.G.; Flores, T.R.; Santos, I.; Wehrmeister, F.C. Sleep Disturbances and Daytime Fatigue: Data from the Brazilian National Health Survey, 2013. Cad. Saude Publica 2019, 35, 00086918. [Google Scholar] [CrossRef]
- Wendt, A.; da Silva, I.C.M.; Gonçalves, H.; Assunção, M.C.F.; Menezes, A.M.B.; Wehrmeister, F.C. Sleep Parameters Measured by Accelerometry: Descriptive Analyses from the 22-Year Follow-up of the Pelotas 1993 Birth Cohort. Sleep Med. 2020, 67, 83–90. [Google Scholar] [CrossRef] [PubMed]
- Holstein, B.E.; Ammitzbøll, J.; Damsgaard, M.T.; Pant, S.W.; Pedersen, T.P.; Skovgaard, A.M. Difficulties Falling Asleep among Adolescents: Social Inequality and Time Trends 1991–2018. J. Sleep Res. 2020, 29, e12941. [Google Scholar] [CrossRef]
- Williamson, A.A.; Mindell, J.A.; Hiscock, H.; Quach, J. Sleep Problem Trajectories and Cumulative Socio-Ecological Risks: Birth to School-Age. J. Pediatr. 2019, 215, 229–237. [Google Scholar] [CrossRef]
- Sarveswaran, G.; Arikrishnan, K.; Krishnamoorthy, Y.; Sakthivel, M.; Majella, M.G.; Lakshminarayanan, S. Prevalence and Determinants of Poor Quality of Sleep among Adolescents in Rural Puducherry, South India. Int. J. Adolesc. Med. Health 2019, 33, 20180101. [Google Scholar] [CrossRef]
- Ren, Y.; Liu, Y.; Meng, T.; Liu, W.; Qiao, Y.; Gu, Y.; Li, Y.; Liu, Y.; Yu, Y.; Cheng, Y. Social-Biological Influences on Sleep Duration among Adult Residents of Northeastern China. Health Qual. Life Outcomes 2019, 17, 47. [Google Scholar] [CrossRef] [PubMed]
- Peltzer, K.; Pengpid, S. Prevalence, Social and Health Correlates of Insomnia among Persons 15 Years and Older in Indonesia. Psychol. Health Med. 2019, 24, 757–768. [Google Scholar] [CrossRef] [PubMed]
- Magee, C.; Gopaldasani, V.; Bakand, S.; Coman, R. The Physical Work Environment and Sleep: A Latent Class Analysis. J. Occup. Environ. Med. 2019, 61, 1011–1018. [Google Scholar] [CrossRef] [PubMed]
- Doane, L.D.; Breitenstein, R.S.; Beekman, C.; Clifford, S.; Smith, T.J.; Lemery-Chalfant, K. Early Life Socioeconomic Disparities in Children’s Sleep: The Mediating Role of the Current Home Environment. J. Youth Adolesc. 2019, 48, 56–70. [Google Scholar] [CrossRef] [PubMed]
- Chen, J.-H. Experience of Poverty and Problem Sleep in Later Life. Res. Aging 2019, 41, 697–722. [Google Scholar] [CrossRef] [PubMed]
- Johnson, D.A.; Billings, M.E.; Hale, L. Environmental Determinants of Insufficient Sleep and Sleep Disorders: Implications for Population Health. Curr. Epidemiol. Rep. 2018, 5, 61–69. [Google Scholar] [CrossRef] [PubMed]
- Maeda, M.; Filomeno, R.; Kawata, Y.; Sato, T.; Maruyama, K.; Wada, H.; Ikeda, A.; Iso, H.; Tanigawa, T. Association between Unemployment and Insomnia-Related Symptoms Based on the Comprehensive Survey of Living Conditions: A Large Cross-Sectional Japanese Population Survey. Ind. Health 2019, 57, 701–710. [Google Scholar] [CrossRef]
- Lee, E.-S.; Park, S. Patterns of Change in Employment Status and Their Association with Self-Rated Health, Perceived Daily Stress, and Sleep among Young Adults in South Korea. Int. J. Environ. Res. Public Health 2019, 16, 4491. [Google Scholar] [CrossRef]
- Sheehan, C.M.; Frochen, S.E.; Walsemann, K.M.; Ailshire, J.A. Are U.S. Adults Reporting Less Sleep?: Findings from Sleep Duration Trends in the National Health Interview Survey, 2004–2017. Sleep 2019, 42, zsy221. [Google Scholar] [CrossRef]
- Poulain, T.; Vogel, M.; Sobek, C.; Hilbert, A.; Körner, A.; Kiess, W. Associations Between Socio-Economic Status and Child Health: Findings of a Large German Cohort Study. Int. J. Environ. Res. Public Health 2019, 16, 677. [Google Scholar] [CrossRef]
- Chami, H.A.; Bechnak, A.; Isma’eel, H.; Talih, F.; Nasreddine, L.; Nasrallah, M.; Tamim, H. Sleepless in Beirut: Sleep Difficulties in an Urban Environment With Chronic Psychosocial Stress. J. Clin. Sleep Med. JCSM Off. Publ. Am. Acad. Sleep Med. 2019, 15, 603–614. [Google Scholar] [CrossRef]
- Sadeghniiat-Haghighi, K.; Najafi, A.; Eftekhari, S.; Tarkhan, S. Insomnia and Its Association with Absenteeism: A Cross-Sectional Study among Iranian Nursing Team. Sleep Sci. 2021, 14, 305–310. [Google Scholar] [CrossRef]
- Hwang, J.; Cho, S.-S.; Kim, J.I. Association between Insomnia and Absenteeism or Presenteeism among Korean Employees. Ann. Occup. Environ. Med. 2022, 34, e41. [Google Scholar] [CrossRef] [PubMed]
- Huyett, P.; Bhattacharyya, N. Incremental Health Care Utilization and Expenditures for Sleep Disorders in the United States. J. Clin. Sleep Med. JCSM Off. Publ. Am. Acad. Sleep Med. 2021, 17, 1981–1986. [Google Scholar] [CrossRef] [PubMed]
- Wickwire, E.M. Value-Based Sleep and Breathing: Health Economic Aspects of Obstructive Sleep Apnea. Fac. Rev. 2021, 10, 40. [Google Scholar] [CrossRef] [PubMed]
- Wang, X.; Cheng, Z. Cross-Sectional Studies: Strengths, Weaknesses, and Recommendations. Chest 2020, 158, S65–S71. [Google Scholar] [CrossRef]
- Sosso, F.A.E.; Matos, E.; Papadopoulos, D. Social Disparities in Sleep Health of African Populations: A Systematic Review and Meta-Analysis of Observational Studies. Sleep Health 2023, S2352-7218(23)00198-5. [Google Scholar] [CrossRef]


| Study | Study Design | Population | % Women | Age (Years) | Sample Size | SES Measures | Sleep Measures | Statistically Significant Findings | Main Effects | Interactions/Mediations |
|---|---|---|---|---|---|---|---|---|---|---|
| Rocha 2002 [30] | Cross-sectional | Adults from Bambui, Brazil | 55.5 | 39 (N/R) | 1066 | Years of education (0, 1–3, 4–7, 8+) Current employment situation (working, not working, retired) Monthly family income (<2.0, 2.0–3.9, ≥4 Brazilian minimum wage) | Insomnia symptoms (difficulty initiating sleep, frequency of disrupted sleep, and frequency of early morning awakening) during the last 30 days, at least three times a week or more, with any level of distress | Insomnia was higher in females with age 60+ (OR, 1.8; CI, 1.1–1.3) and with 1–3 or no years of schooling (OR = 1.8, CI = 1.1–3.0; OR = 2.6, CI = 1.3–5.1) and males with 1–3 years of schooling (OR, 2.2; CI, 1.1–4.1) | Insomnia was independently associated with less education | |
| Hara 2004 [31] | Cross-sectional | Adults from Bambui, Brazil | 55.5 | 39 (N/R) | 1066 | Years of education (0, 1–3, 4–7, 8+) Monthly personal income (none, <1, 1.0–1.9, ≥2.0 Brazilian minimum wages) Monthly family income (<2.0, ≥2.0 Brazilian minimum wages) Current employment situation (student, working, unemployed, retired) | Excessive daytime sleepiness three or more times per week with consequent impairment of daily activities | EDS was associated with insomnia (OR, 2.24; CI, 1.6–3.15) and lower family income (OR, 1.47; CI, 1.02–2.12) | Lower family income was associated with EDS | |
| Blay 2008 [32] | Cross-sectional | Adults ≥ 60 y from Rio Grande do Sul, Brazil | 66.0 | N/R | 6961 | Income (< vs. ≥USD 200/month) Years of education (0–3 vs. ≥4) | Sleep disturbance (single question, yes vs. no) in the last 30 days | Lower income (OR, 1.26; CI, 1.11–1.43) and lower education (OR, 1.8; CI, 1.24–1.76) were related to disturbed sleep | Low income and low education were independent risk factors for self-reported sleep disturbance. | |
| Fritsch Montero 2010 [33] | Cross-sectional | Adults 18–64 y from Gran Santiago, Chile | 52.3 | N/R | 3867 | Schooling (upper, middle, basic, none) Employment status (10 levels) Per capita income quartiles (high, middle high, middle low, low), decrease of income. | Revised Clinical Interview Schedule sleep score > 1 | Being an occasional worker (OR, 1.75; CI, 1.11–2.77), unemployed and looking (OR, 2.8; CI, 1.32–5.93) and not looking (OR, 4.63; CI, 1.7–12.51) for a job, having adequate (OR, 2.05; CI, 1.21–3.47) and poor living conditions (OR, 2.04; CI, 1.24–3.47), being a housewife (OR, 1.46; CI, 1.09–1.95) or female (OR, 1.43; CI, 1.14–1.80) were considered to be risk factors for sleep disturbance | Unemployed and occasional workers patients, housewives, patients with common mental disorders had higher odds of having sleep disorders | |
| Tufik 2010 [34] | Cross-sectional | Adults 20–80 y from the general population in Sao Paulo, Brazil | 55 | N/R | 1042 | Annual household income (high, mid, low according to the Brazilian Economic Classification Criteria), Employment status (working vs. not working) | OSA ICSD-2 criteria (AHI from PSG, items 2 and 5 from Berlin Questionnaire, ESS > 10 and/or item 8 from PSQI, Chalder Fatigue Scale > 4) | Increasing age (OR, 3.9; 6.6; 10.8; 34.5) and gender (OR, 4.1; CI, 2.9–5.8) were independent and strong associated factors for the presence of OSA. | SES was not associated with OSA | Low income was a protective factor for males (OR, 0.4; CI, 0.1–0.9), but not significant in females (p = 0.057) |
| Blümel 2012 [35] | Cross-sectional | 40–59 y women recruited from 20 healthcare centers in 11 Latin American countries | 100 | 49.8 (5.4) | 6079 | Education (≤ vs. >12 years), | Insomnia (AIS score > 5). Sleep quality (PSQI global score > 5). | Education > 12 years was associated with less insomnia (OR, 0.84; CI, 0.74–0.9) and less poor sleep quality (OR, 0.83; CI, 0.73–0.94). | Higher educational level was an independent risk factor related to less insomnia and better sleep quality | |
| Lima 2012 [36] | Cross-sectional | Adults from general population in Campinas, Brazil | 52.3 | 41.8 (95% CI: 40.7–42.9) | 2637 | Education (0–3, 4–7, 8–11, ≥12 y), per capita monthly household income (1 minimum salary or less, 1–3 times the minimal salary, 3 or more times the minimum salary), work status (working, not working, housewife), number of household appliances (≤10, >10). | Sleep duration (≤6, 7–8, ≥9 h) | Long sleep (≥9 h) was less prevalent among those with 4–11 or ≥12 years of schooling (OR = 0.38, CI = 0.25–0.60; OR = 0.26, CI = 0.13–0.50) and more prevalent among those not working or housewives (OR = 2.70, CI = 1.96–3.73; OR = 2.13, CI = 1.43–3.18) | Long sleep was more prevalent among those with a lower level of education, those who did not work and housewives. | |
| Hoefelmann 2013 [37] | Cross-sectional | Adolescents 15–19 years from high-schools in Santa Catarina, Brazil | 57.2 | 15–19 years | 5932 (2001) and 5932 (2011) | Work status (yes vs. no), monthly family income (in terciles), school grading and school shift | Insufficient sleep duration (<8 h), poor sleep quality (sometimes/hardly ever/never vs. always/nearly always) | Working (OR = 1.66, CI = 1.41–1.96; OR = 1.38, CI = 1.21–1.57 in 2001 and 2011, respectively), school grade (OR third year in 2001 = 1.42; CI, 1.02–1.99), income (OR second tercile in 2011 = 1.19; CI, 1.03–1.38), and school shift (OR night in 2011 = 1.26; CI, 1.07–1.49) were related to poor sleep quality. Working (OR = 2.41, CI = 1.94–2.99; and OR = 1.64, CI = 1.42–1.89 in 2001 and 2011, respectively), monthly family income (OR third tercile in 2011 = 1.68; CI, 1.24–2.28) and higher school grading (OR third year in 2011 = 1.48; CI, 1.15–1.91) were associated with insufficient sleep duration. | Working and higher family income was associated with both short sleep and poor sleep quality. Higher school grading was associated with both short sleep and poor sleep quality. Night school shift was associated with poor sleep quality. | |
| Carrillo- Larco 2014 [38] | Cross-sectional | Adolescents and adults ≥ 12 y from the general population of Peru | 49.4 | 35.8 ± 17.7 | 12,424 | Education (none/primary school, high school, higher), asset index (in tertiles), job status (yes vs. no) | Self-reported sleep duration (short-sleep < 6, regular-sleep 6–8, long-sleep > 8 h) | Higher probability of being a short-sleeper was found in those currently employed (OR, 1.5; CI, 1.09–2.06) and lower probability in those with high school (OR, 0.53; CI, 0.32–0.86) or none/primary education (OR, 0,63; CI, 0.57–0.7). Higher probability of being a long-sleeper was found in those with high school (OR, 1.42; CI, 1.34–1.51) or none/primary education (OR, 2.17; CI, 1.72–2.73) and lesser probability in those with middle (OR, 0.77; CI, 0.63–0.94) or highest (OR, 0.54; CI, 0.48–0.60) assets index and currently working (OR, 0.59; CI, 0.46–0.75). | Participants with lower education were more likely to have long sleep duration and less likely to have short sleep duration. Those with higher asset index were less likely to report long sleep. Employed individuals had a higher probability of being short sleepers and lower probability of being long sleepers than unemployed. | |
| Schwartz 2015 [39] | Cross-sectional | Adults > 35 y from the general population of 4 Peruvian settings | 49.5 | 54.1 (18.8) | 2682 | Wealth index—based on current occupation, household income, assets, and household facilities (in tertiles) | SDB symptoms: habitual snoring (self-reported snoring at least 3 nights per week); observed apnea (pauses in breathing or choking during sleep reported by a spouse or bed partner); excessive daytime sleepiness (modified ESS score > 6) | More excessive daytime sleepiness was associated with medium SES (OR, 1.41; CI, 1.10–1.80; p = 0.006). Less habitual snoring was associated with medium (OR, 0.79; CI, 0.64–0.97; p = 0.027) and low (OR, 0.7; CI, 0.55–0.90; p = 0.005) SES. | Lower SES was associated with less habitual snoring but more excessive daytime sleepiness. No significant association was found between SES and observed apnea. | |
| Schäfer 2016 [40] | Cross-sectional | Adolescents 18 y members of a population-based birth cohort in Pelotas, Brazil | 50.9 | 18 (N/R) | 4016 | Family income at birth and at 18 y (in quintiles) Maternal schooling in completed years at birth (0, 1–4, 5–8, 9–11, ≥12 y) Maternal skin color (white, black, other) Currently enrolled in school (yes, no) Adolescent schooling in completed years (≤4, 5–8, ≥9 y) | Self-reported sleep duration (h/day) | Maternal schooling was associated with sleep duration in both genders, with an inverse linear trend in girls (p < 0.001). Girls whose mothers had no schooling showed an increase of 1.40 (ß) hours per day (95%CI, 0.77–2.04) compared to those whose mothers had ≥12 y of schooling. Girls whose mothers were black had 0.37 h more sleep per day (95%CI, 0.17–0.58) than those whose mothers were white. Girls in the lowest fifth of family income at birth had a higher sleep duration (ß = 0.58; 95%CI, 0.30–0.87) compared to girls in the highest fifth. Adolescents who were currently studying showed lower sleep duration (ß = −0.34; 95%CI, −0.51 to −10.17 for males; ß = −0.75, 95%CI, −0.92 to −0.59 for females). Boys with lower schooling showed higher sleep duration (ß = 0.45; 95%CI, 0.09–0.81 for males). Girls with intermediate schooling (5–8 years) showed higher sleep duration (ß = 0.46; 95%CI, 0.27–0.65). Boys and girls in the lowest fifth family income at 18 years had higher sleep duration (ß = 0.58; 95%CI, 0.33–0.84) and (ß = 0.69; 95%CI, 0.41–0.96), respectively | Lower maternal and adolescent schooling and lower family income was associated with higher sleep duration. Black maternal skin color was associated with higher sleep duration in girls. | |
| Fulgencio 2017 [41] | Cross-sectional | Adolescents 13–15 y from 14 public and private schools in Itabira, Brazil | 56.1 | 13–15 years | 1344 | SES—composite variable (goods owned by the family and educational level of its head), categorized as higher vs. lower | Parent-reported possible sleep bruxism (single question, yes vs. no) | Higher SES was associated with higher prevalence of possible sleep bruxism (PR, 1.51; 95%CI, 1.23–1.86) | Greater prevalence of possible sleep bruxism was observed among adolescents with a higher SES | |
| Mota-Veloso 2017 [42] | Cross-sectional | Children 6–12 y from seven public and two private schools in Diamantina, Brazil | 54.8 | 6–12 years | 851 | SES—composite variable of 3 indicators: equivalized household income (10 levels), mother’s and father’s schooling (9 levels) | Sleep bruxism (reports of parents/caregivers and oral clinical evaluation) | SES had a significant indirect effect on bruxism via sucking habits (SC = −0.08; p = 0.01). SES had a significant direct effect (SC = −0.16; p = 0.01) and the total effect on tooth wear was also significant (SC = −0.17; p = 0.00). | Lower SES was associated with more sleep bruxism | The effect was mediated by sucking behavior (finger sucking, biting nails or other objects) |
| Netsi 2017 [43] | Cross-sectional | Infants from Pelotas, Brazil | N/R | N/R | 3842 | Maternal education (0–4 years, 5–8 years, ≥9 years) Family income (in quintiles) | Parent-reported sleep duration, awakenings, and sleep disturbances (nightmares/night terrors, restless sleep, difficulty going to sleep, wakes up at night, and wakes up early) | There were no consistent associations between sleep duration or sleep disturbances and sociodemographic characteristics | Maternal education and family income were not associated with infant sleep duration or disturbances | |
| De Lima 2018 [44] | Cross-sectional | Students with 14–19 y, from high schools in São José, Brazil | 54.2 | 16.1 ± 1.1 | 1110 | Maternal education (<8 vs. ≥8 years) Family income (up to two minimum wages; two to ten times the minimum wage; more than ten times the minimum wage) | Sleep quality (perception of sleep quality, single question, categorized in almost never/seldom/sometimes vs. with relative frequency/almost always) | The prevalence of low quality of sleep was higher in adolescents whose mothers had up to 8 years of study (OR, 1.44; CI, 1.13–1.84). Those who had sedentary behavior of risk based on screen time (OR, 0.54; CI, 0.42–0.70). | Students whose mothers had a high level of education were more likely to have a low quality of sleep. Students with sedentary risk behavior were less likely to report poor sleep quality. | |
| Lima 2018 [45] | Cross-sectional | Adults ≥ 20 y from the general population of Campinas, Brazil | 52.7 | 43.7 (CI 42.3–45.2) | 1969 | Work status (yes vs. no) Per capita family income (<1; 1–2; 3 or more minimum wages) Schooling (0–4; 5–8; 9–11; 12 or more years of schooling) Number of residents in the household (1;2;3 or more) | Sleep duration (6 h or less; 7–8 h; 9 h or more) | Associated with short sleep: highest level of schooling (OR, 1.73; CI, 1.08–2.75). The probability of long sleep was lower in individuals who work (OR, 0.39; CI, 0.28–0.55), with higher income (OR, 0.49; CI, 0.29–0.85) | Those with higher schooling were more likely to have short sleep. The chance of long sleep was lower in those who have more years of schooling, have higher income, and worked. | Adjusting for chronic diseases and health disturbances attenuated the effects of education on short sleep |
| Barros 2019 [46] | Cross-sectional | Adults ≥ 20 y from the general population in Campinas, Brazil | 52.7 | 43.7 (CI 42.3–45.3) | 1998 | Education (0–3 y, 4–8 y, 9–11 y, ≥12 y) Per capita family income (<1 minimum wage, 1–3, >3) Employment (working vs. not working) | Sleep quality (single question; excellent/ very good/good vs. regular/poor/very poor) | Poor sleep quality was more frequent in women (OR, 1.36; CI, 1.14–1.63), older individuals (OR, 1.5; CI, 1.20–1.87), unemployed (OR, 1.26; CI, 1.03–1.54), and in those with the highest number of children (OR, 1.33; CI, 1.02–1.74). | Adjusting for amount of health disturbances, self-rated health, common mental disorders, and life satisfaction attenuated the effect | |
| Pontes 2019 [47] | Cross-sectional | Adults ≥ 18 y from the general population in Rio Grande, Brazil | 56.6 | 45.9 ± 17.2 | 1280 | Education (0 to 11 years vs. 12 years or more) | Sleep bruxism (ICSD criteria) | In the bivariate analysis, the schooling (OR, 1.66; CI, 1.14–2.42) and stress (OR, 1.66; CI, 1.14–2.42) variables were associated with sleep bruxism. In the adjusted analysis, age (OR, 1.63; CI, 1.07–2.46), schooling (OR, 1.92; CI, 1.35–2.72), and stress (OR, 1.76; CI, 1.11–2.81) were associated with sleep bruxism. | Higher education and psychological stress were associated with higher prevalence of sleep bruxism | |
| Wendt 2019 [48] | Cross-sectional | Adults from the general population in Brazil | 52.9 | N/R | 60,202 | Education (none, incomplete primary level, complete primary level, secondary level, higher education) Wealth index (assets index score, in quintiles) | Sleep disturbance frequency and daytime fatigue in last two weeks (none; up to seven days; more than seven days; almost every day) | Sleep disturbances and daytime fatigue had lower prevalence in highly educated individuals with, respectively, (OR, 0.73; CI, 0.64–0.83) and (OR, 0.79; CI, 0.69–0.92) | Highly educated individuals had lower prevalence of sleep disturbance than those with no formal education | |
| Wendt 2020 [49] | Cross-sectional | 22-year-old adults from a population-based birth cohort in Pelotas, Brazil | 53.2 | 22 (N/R) | 2462 | Wealth index (asset index, in quintiles), occupation (none, only study, only work, both) | Sleep duration and efficiency (7-day accelerometry) | Women not working or studying presented higher Sleep Time Window (OR, 7.5; CI, 7.3–7.6) and lower Sleep Percent (OR, 82; CI, 81.1–83.7). Those in the poorest quintile of wealth index presented lower SP (OR, 82.4; CI, 81.9–83.7) | Women in the poorest quintile of wealth index presented with lower sleep efficiency |
| Study | Q1 | Q2 | Q3 | Q4 | Q5 | Q6 | Q7 | Q8 | Q9 | Q10 | Q11 | Q12 | Q13 | Q14 | Quality Rating |
|---|---|---|---|---|---|---|---|---|---|---|---|---|---|---|---|
| Rocha 2002 [30] | Y | Y | Y | Y | Y | N | N | Y | N | N | Y | NA | NA | Y | Fair |
| Hara 2004 [31] | Y | Y | Y | Y | Y | N | N | Y | N | N | Y | NA | NA | Y | Fair |
| Blay 2008 [32] | Y | Y | Y | Y | Y | N | N | Y | Y | N | N | NA | NA | Y | Fair |
| Fritsch Montero 2010 [33] | Y | Y | N | Y | N | N | N | Y | Y | N | Y | NA | NA | Y | Fair |
| Tufik 2010 [34] | Y | Y | Y | Y | Y | N | N | Y | Y | N | Y | NA | NA | Y | Good |
| Blümel 2012 [35] | Y | Y | Y | Y | Y | N | N | Y | Y | N | Y | NA | NA | Y | Good |
| Lima 2012 [36] | Y | Y | Y | Y | Y | N | N | Y | N | N | N | NA | NA | Y | Fair |
| Hoefelmann 2013 [37] | Y | Y | Y | Y | Y | N | N | Y | N | Y | Y | NA | NR | Y | Good |
| Carrillo-Larco 2014 [38] | Y | Y | Y | Y | N | N | N | Y | Y | N | Y | NA | NA | Y | Fair |
| Schwartz 2015 [39] | Y | Y | Y | Y | N | N | N | Y | Y | N | Y | NA | NA | Y | Fair |
| Schäfer 2016 [40] | Y | Y | Y | Y | N | N | N | Y | Y | Y | N | N | Y | Y | Good |
| Fulgencio 2017 [41] | Y | Y | Y | Y | Y | N | N | Y | Y | N | Y | NA | NA | Y | Good |
| Mota-Veloso 2017 [42] | Y | Y | Y | Y | Y | N | N | Y | Y | N | Y | NA | NA | Y | Good |
| Netsi 2017 [43] | Y | Y | Y | Y | N | N | N | Y | N | Y | N | N | Y | Y | Fair |
| De Lima 2018 [44] | Y | Y | Y | Y | Y | N | N | Y | Y | N | Y | NA | NA | Y | Good |
| Lima 2018 [45] | Y | Y | Y | Y | Y | N | N | Y | Y | N | N | NA | NA | Y | Fair |
| Barros 2019 [46] | Y | Y | Y | Y | Y | N | N | Y | Y | N | N | NA | NA | Y | Fair |
| Pontes 2019 [47] | Y | Y | Y | Y | Y | N | N | N | Y | N | Y | NA | NA | Y | Fair |
| Wendt 2019 [48] | Y | Y | Y | Y | Y | N | N | N | N | N | N | NA | NA | Y | Poor |
| Wendt 2020 [49] | Y | Y | Y | Y | Y | N | N | Y | Y | N | Y | NA | N | Y | Good |
| Subgroup | Number of Studies | Pooled Prevalence (95 CI%) | I2 (%) |
|---|---|---|---|
| Total | 28 | 24.73 [19.62–30.66] | 100 |
| Cities | |||
| Brazil | 21 | 25.00 [19.54–31.40] | 100 |
| Chile | 1 | - | - |
| Peru | 4 | 15.91 [6.17–35.27] | 100 |
| Multicentric | 2 | 44.89 [42.36–47.45] | 88 |
| Age group | |||
| Adult | 15 | 24.24 [18.93–30.48] | 100 |
| Adolescents | 10 | 20.33 [12.68–30.95] | 100 |
| Children | 1 | - | - |
| Infant | 2 | 56.52 [54.11–58.89] | 78 |
| Study’s quality | |||
| Good | 12 | 27.97 [20.59–36.76] | 100 |
| Fair | 14 | 24.08 [16.61–33.55] | 100 |
| Poor | 2 | 13.38 [10.79–16.49] | 100 |
Disclaimer/Publisher’s Note: The statements, opinions and data contained in all publications are solely those of the individual author(s) and contributor(s) and not of MDPI and/or the editor(s). MDPI and/or the editor(s) disclaim responsibility for any injury to people or property resulting from any ideas, methods, instructions or products referred to in the content. |
© 2023 by the authors. Licensee MDPI, Basel, Switzerland. This article is an open access article distributed under the terms and conditions of the Creative Commons Attribution (CC BY) license (https://creativecommons.org/licenses/by/4.0/).
Share and Cite
Etindele Sosso, F.A.; Torres Silva, F.; Queiroz Rodrigues, R.; Carvalho, M.M.; Zoukal, S.; Zarate, G.C. Prevalence of Sleep Disturbances in Latin American Populations and Its Association with Their Socioeconomic Status—A Systematic Review and a Meta-Analysis. J. Clin. Med. 2023, 12, 7508. https://doi.org/10.3390/jcm12247508
Etindele Sosso FA, Torres Silva F, Queiroz Rodrigues R, Carvalho MM, Zoukal S, Zarate GC. Prevalence of Sleep Disturbances in Latin American Populations and Its Association with Their Socioeconomic Status—A Systematic Review and a Meta-Analysis. Journal of Clinical Medicine. 2023; 12(24):7508. https://doi.org/10.3390/jcm12247508
Chicago/Turabian StyleEtindele Sosso, F. A., Filipa Torres Silva, Rita Queiroz Rodrigues, Margarida M. Carvalho, Sofia Zoukal, and Gabriel Cordova Zarate. 2023. "Prevalence of Sleep Disturbances in Latin American Populations and Its Association with Their Socioeconomic Status—A Systematic Review and a Meta-Analysis" Journal of Clinical Medicine 12, no. 24: 7508. https://doi.org/10.3390/jcm12247508
APA StyleEtindele Sosso, F. A., Torres Silva, F., Queiroz Rodrigues, R., Carvalho, M. M., Zoukal, S., & Zarate, G. C. (2023). Prevalence of Sleep Disturbances in Latin American Populations and Its Association with Their Socioeconomic Status—A Systematic Review and a Meta-Analysis. Journal of Clinical Medicine, 12(24), 7508. https://doi.org/10.3390/jcm12247508