
The Impact of Alcohol Consumption Pattern on Liver Fibrosis in Asymptomatic Patients


 , ,
, ,  , ,
, ,  , , , , , , , , ,
Abstract
:1. Introduction
2. Materials and Methods
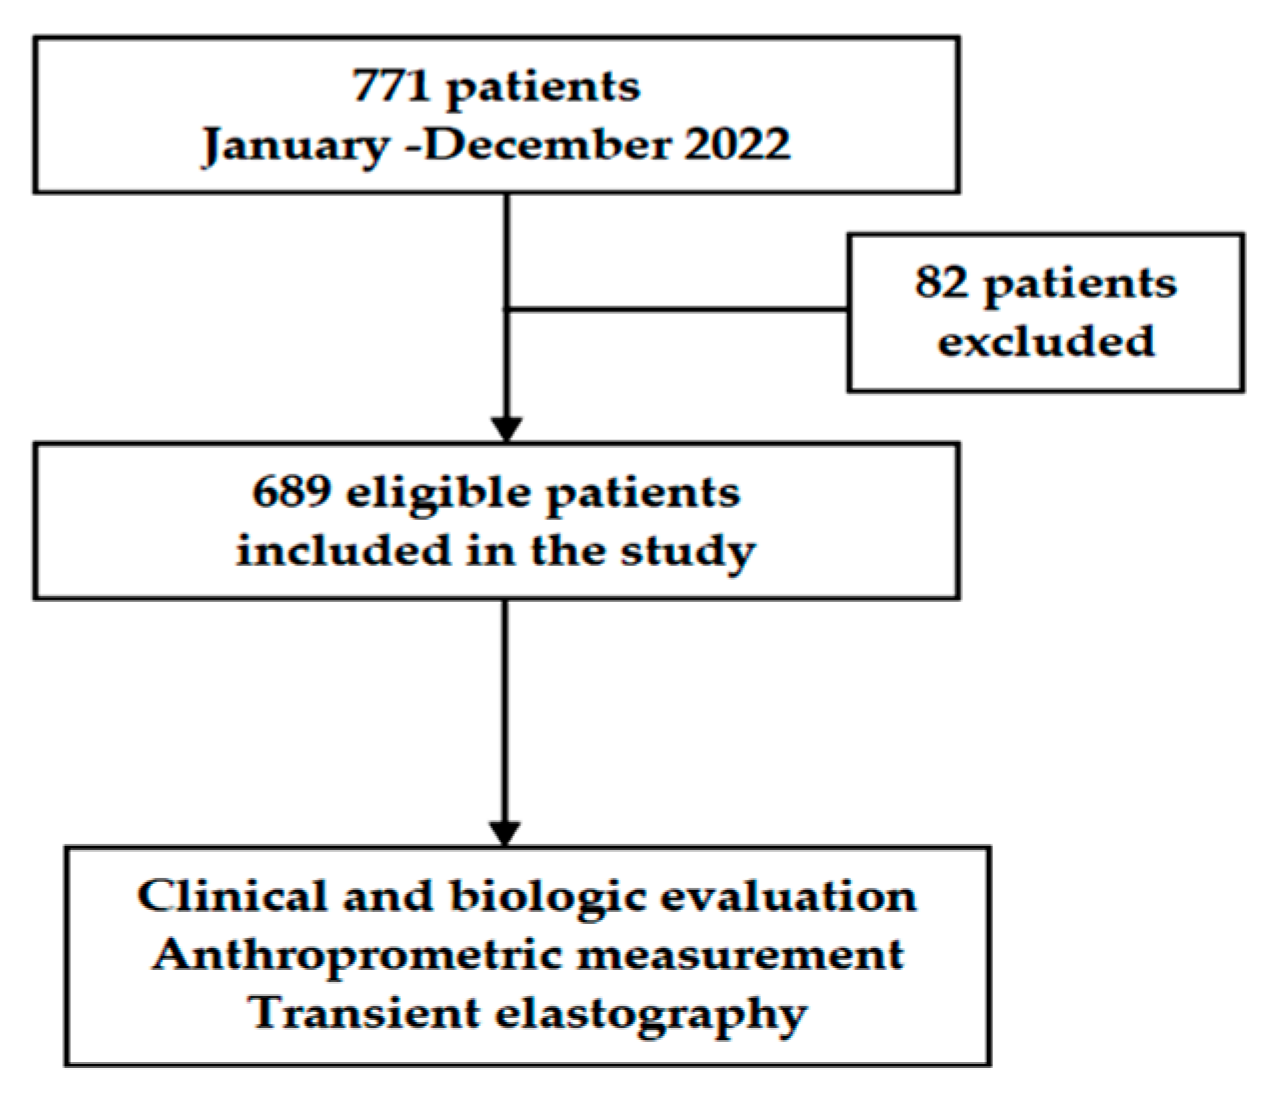
2.1. Patients
2.2. Vibration Controlled Transient Elastography
2.3. Statistical Analysis
3. Results
4. Discussion
5. Conclusions
Author Contributions
Funding
Institutional Review Board Statement
Informed Consent Statement
Data Availability Statement
Conflicts of Interest
References
- Asphaug, L.; Thiele, M.; Krag, A.; Melberg, H.O. Cost-Effectiveness of Noninvasive Screening for Alcohol-Related Liver Fibrosis. Hepatology 2022, 71, 2093–2104. [Google Scholar] [CrossRef]
- Listabarth, S.; König, D.; Berlakovich, G.; Munda, P.; Ferenci, P.; Kollmann, D.; Gyöeri, G.; Waldhoer, T.; Groemer, M.; van Enckevort, A.; et al. Sex Disparities in Outcome of Patients with Alcohol-Related Liver Cirrhosis within the Eurotransplant Network—A Competing Risk Analysis. J. Clin. Med. 2022, 11, 3646. [Google Scholar] [CrossRef] [PubMed]
- WHO—Alcohol Fact Sheets 2022. Available online: https://www.who.int/news-room/fact-sheets/detail/alcohol (accessed on 9 May 2022).
- Seitz, H.K.; Neuman, M.G. The History of Alcoholic Liver Disease: From an Unrecognized Disease to One of the Most Frequent Diseases in Hepatology. J. Clin. Med. 2021, 10, 858. [Google Scholar] [CrossRef] [PubMed]
- GBD 2019 Risk Factors Collaborators. Global burden of 87 risk factors in 204 countries and territories, 1990–2019: A systematic analysis for the Global Burden of Disease Study 2019. Lancet 2020, 396, 1223–1249. [Google Scholar] [CrossRef] [PubMed]
- Williams, R.; Alexander, G.; Armstrong, I.; Baker, A.; Bhala, N.; Camps-Walsh, G.; Cramp, M.E.; de Lusignan, S.; Day, N.; Dhawan, A.; et al. Disease burden and costs from excess alcohol consumption, obesity, and viral hepatitis: Fourth report of the lancet standing commission on liver disease in the UK. Lancet 2018, 391, 1097–1107. [Google Scholar] [CrossRef] [PubMed]
- Braker, A.B.; Soellner, R. Alcohol drinking cultures of European adolescents. Eur. J. Public Health 2016, 26, 581–586. [Google Scholar] [CrossRef] [PubMed]
- European Commission. State of Health in the EU, Romania, Country Health Profile. 2021. Available online: https://www.oecd-ilibrary.org/social-issues-migration-health/romania-country-health-profile-2021_74ad9999-en (accessed on 13 December 2021).
- Souveek, M.; Arka, D.; Abhijit, C. Epidemiology of non-alcoholic and alcoholic fatty liver diseases. Transl. Gastroenterol. Hepatol. 2020, 5, 16. [Google Scholar] [CrossRef]
- Manthey, J.; Shield, K.D.; Rylett, M.; Hasan, O.S.M.; Probst, C.; Rehm, J. Global alcohol exposure between 1990 and 2017 and forecasts until 2030: A modelling study. Lancet 2019, 393, 2493–2502. [Google Scholar] [CrossRef]
- WHO Regional Office for Europe. Status Report on Alcohol Consumption, Harm and Policy Responses in 30 European Countries 2019. Available online: https://www.who.int/europe/publications/i/item/WHO-EURO-2019-3544-43303-60695 (accessed on 7 October 2021).
- GBD 2017 Cirrhosis Collaborators. The global, regional, and national burden of cirrhosis by cause in 195 countries and territories, 1990-2017: A systematic analysis for the Global Burden of Disease Study 2017. Lancet Gastroenterol. Hepatol. 2020, 5, 245–266. [Google Scholar] [CrossRef]
- Rumgay HShield, K.; Charvat, H.; Ferrari, P.; Sornpaisarn, B.; Obot, I.; Islami, F.; Lemmens, V.E.P.P.; Rehm, J.; Soerjomataram, I. Global burden of cancer in 2020 attributable to alcohol consumption: A population-based study. Lancet Oncol. 2021, 22, 1071–1080. [Google Scholar] [CrossRef]
- Niemelä, O.; Aalto, M.; Bloigu, A.; Bloigu, R.; Halkola, A.S.; Laatikainen, T. Alcohol Drinking Patterns and Laboratory Indices of Health: Does Type of Alcohol Preferred Make a Difference? Nutrients 2022, 14, 4529. [Google Scholar] [CrossRef] [PubMed]
- Niemelä, O.; Niemelä, M.; Bloigu, R.; Aalto, M.; Laatikainen, T. Where should the safe limits of alcohol consumption stand in light of liver enzyme abnormalities in alcohol consumers? PLoS ONE 2017, 12, e0188574. [Google Scholar] [CrossRef] [PubMed]
- Dugum, M.; McCullough, A. Diagnosis and management of alcoholic liver disease. J. Clin. Transl. Hepatol. 2015, 3, 109–116. [Google Scholar] [CrossRef] [PubMed]
- Kobyliak, N.; Dynnyk, O.; Abenavoli, L. The Role of Liver Biopsy to Assess Alcoholic Liver Disease. Rev. Recent Clin. Trials 2016, 11, 175–179. [Google Scholar] [CrossRef]
- Dietary Guidelines for Americans 2015–2020. Available online: http://health.gov/dietaryguidelines/2015/guidelines (accessed on 10 September 2023).
- Alcohol Research: Current Reviews Editorial Staff. Drinking patterns and their definitions. Alcohol. Res. 2018, 39, 17–18. [Google Scholar]
- European Association for the Study of the Liver. EASL Clinical Practice Guidelines on non-invasive tests for evaluation of liver disease severity and prognosis—2021 update. J. Hepatol. 2021, 75, 659–689. [Google Scholar] [CrossRef] [PubMed]
- Mueller, S.; Englert, S.; Seitz, H.K.; Badea, R.I.; Erhardt, A.; Bozaari, B.; Beaugrand, M.; Lupșor-Platon, M. Inflammation-adapted liver stiffness values for improved fibrosis staging in patients with hepatitis C virus and alcoholic liver disease. Liver Int. 2015, 35, 2514–2521. [Google Scholar] [CrossRef]
- Husain, A.; Chiwhane, A.; Kirnake, V. Non-invasive assessment of liver fibrosis in alcoholic liver disease. Clin. Exp. Hepatol. 2020, 2, 125–130. [Google Scholar] [CrossRef]
- Buchanan, R.; Sinclair, J.M.A. Alcohol Use Disorder and the Liver. Addiction 2020, 116, 1270–1278. [Google Scholar] [CrossRef]
- Chen, L.; Zhu, Y.; Hou, X.; Yang, L.; Chu, H. The Role of Gut Bacteria and Fungi in Alcohol-Associated Liver Disease. Front. Med. 2022, 9, 840752. [Google Scholar] [CrossRef]
- Bajaj, J.S. Alcohol, liver disease and the gut microbiota. Nat. Rev. Gastroenterol. Hepatol. 2019, 16, 235–246. [Google Scholar] [CrossRef] [PubMed]
- Pan, C.; Liu, C.; Jia, W.; Zhao, D.; Chen, X.; Zhu, X.; Yang, M.; Wang, L. Alcohol drinking alters oral microbiota to modulate the progression of alcohol-related liver disease. iScience 2023, 26, 107977. [Google Scholar] [CrossRef] [PubMed]
- Becker, U. Lower risk for alcohol-induced cirrhosis in wine drinkers. Hepatology 2002, 35, 868–875. [Google Scholar] [CrossRef] [PubMed]
- Barbería-Latasa, M.; Gea, A.; Martínez-González, M.A. Alcohol, drinking pattern, and chronic disease. Nutrients 2022, 14, 1954. [Google Scholar] [CrossRef] [PubMed]
- Dai, X.J.; Tan, L.; Ren, L.; Shao, Y.; Tao, W.; Wang, Y. COVID-19 Risk Appears to Vary Across Different Alcoholic Beverages. Front. Nutr. 2022, 8, 772700. [Google Scholar] [CrossRef] [PubMed]
- Schutte, R.; Papageorgiou, M.; Najlah, M.; Huisman, H.W.; Ricci, C.; Zhang, J.; Milner, N.; Schutte, A.E. Drink types unmask the health risks associated with alcohol intake—Prospective evidence from the general population. Clin. Nutr. 2020, 39, 3168–3174. [Google Scholar] [CrossRef]
- GBD 2016 Alcohol Collaborators. Alcohol use and burden for 195 countries and territories, 1990–2016: A systematic analysis for the Global Burden of Disease Study 2016. Lancet 2018, 392, 1015–1035. [Google Scholar] [CrossRef]
- WHO Global Status Report on Alcohol and Health. 2018. Available online: https://www.who.int/publications/i/item/9789241565639 (accessed on 27 September 2018).
- European Association for the Study of the Liver. EASL—Clinical Practice Guidelines: Management of alcohol-related liver disease. J. Hepatol. 2018, 69, 154–181. [Google Scholar] [CrossRef]
- Axley, P.D.; Richardson, C.T.; Singal, A.K. Epidemiology of Alcohol Consumption and Societal Burden of Alcoholism and Alcoholic Liver Disease. Clin. Liver Dis. 2019, 23, 39–50. [Google Scholar] [CrossRef]
- Wood, A.M.; Kaptoge, S.; Butterworth, A.S.; Willeit, P.; Warnakula, S.; Bolton, T.; Paige, E.; Paul, D.S.; Sweeting, M.; Burgess, S.; et al. Risk thresholds for alcohol consumption: Combined analysis of individual-participant data for 599 912 current drinkers in 83 prospective studies. Lancet 2018, 391, 1513–1523. [Google Scholar] [CrossRef]
- Simpson, R.F.; Hermon, C.; Liu, B.; Green, J.; Reeves, G.K.; Beral, V.; Floud, S. Alcohol drinking patterns and liver cirrhosis risk: Analysis of the prospective UK Million Women Study. Lancet Public Health 2019, 4, 41–48. [Google Scholar] [CrossRef] [PubMed]
- Schwarzinger, M.; Pollock, B.G.; Hasan, O.S.; Dufouil, C.; Rehm, J. Contribution of alcohol use disorders to the burden of dementia in France 2008-13: A nationwide retrospective cohort study. Lancet Public Health 2018, 3, 124–132. [Google Scholar] [CrossRef] [PubMed]
- Nivukoski, U.; Bloigu, A.; Bloigu, R.; Aalto, M.; Laatikainen, T.; Niemelä, O. Liver enzymes in alcohol consumers with or without binge drinking. Alcohol 2019, 78, 13–19. [Google Scholar] [CrossRef] [PubMed]
- Lackner, C.; Spindelboeck, W.; Haybaeck, J.; Douschan, P.; Rainer, F.; Terracciano, L.; Haas, J.; Berghold, A.; Bataller, R.; Stauber, R.E. Histological parameters and alcohol abstinence determine long-term prognosis in patients with alcoholic liver disease. J. Hepatol. 2017, 66, 610–618. [Google Scholar] [CrossRef]
- Lackner, C.; Spindelboeck, W.; Haybaeck, J.; Douschan, P.; Rainer, F.; Terracciano, L.; Haas, J.; Berghold, A.; Bataller, R.; Stauber, R.E. Non-invasive diagnosis and biomarkers in alcohol-related liver disease. J. Hepatol. 2019, 70, 273–283. [Google Scholar] [CrossRef] [PubMed]
- Thomaides-Brears, H.B.; Alkhouri, N.; Allende, D.; Harisinghani, M.; Noureddin, M.; Reau, N.S.; French, M.; Pantoja, C.; Mouchti, S.; Cryer, D.R.H. Incidence of Complications from Percutaneous Biopsy in Chronic Liver Disease: A Systematic Review and Meta-Analysis. Dig. Dis. Sci. 2022, 67, 3366–3394. [Google Scholar] [CrossRef]
- Rinaldi, L.; Giorgione, C.; Mormone, A.; Esposito, F.; Rinaldi, M.; Berretta, M.; Marfella, R.; Romano, C. Non-Invasive Measurement of Hepatic Fibrosis by Transient Elastography: A Narrative Review. Viruses 2023, 15, 1730. [Google Scholar] [CrossRef]
- Pavlov, C.S.; Casazza, G.; Nikolova, D.; Tsochatzis, E.; Burroughs, A.K.; Ivashkin, V.T.; Gluud, C. Transient elastography for diagnosis of stages of hepatic fibrosis and cirrhosis in people with alcoholic liver disease. Cochrane Database Syst. Rev. 2015, 1, CD010542. [Google Scholar] [CrossRef]
- Papatheodoridi, M.; Hiriart, J.B.; Lupsor-Platon, M.; Bronte, F.; Boursier, J.; Elshaarawy, O.; Marra, F.; Thiele, M.; Markakis, G.; Payance, A.; et al. Refining the Baveno VI elastography criteria for the definition of compensated advanced chronic liver disease. J. Hepatol. 2021, 74, 1109–1116. [Google Scholar] [CrossRef]
- Trifan, A.; Minea, H.; Rotaru, A.; Stanciu, C.; Stafie, R.; Stratina, E.; Zenovia, S.; Nastasa, R.; Singeap, A.M.; Girleanu, I.; et al. Predictive Factors for the Prognosis of Alcoholic Liver Cirrhosis. Medicina 2022, 58, 1859. [Google Scholar] [CrossRef]


| Variables | Overall Cohort | Participants with Fibrosis ≤F2 | Participants with Fibrosis ≥F3 | |
|---|---|---|---|---|
| Patients a | 689 | 556 (80.7) | 133 (19.3) | |
| Age (years) b | 48 (40 to 61) | 46 (38 to 56) | 60 (48.5 to 65) | |
| Gender a | male | 405 (58.8) | 308 (55.4) | 97 (72.9) |
| female | 284 (41.2) | 248 (44.6) | 36 (27.1) | |
| Age groups a | ≤40 years | 174 (25.3) | 161 (29.0) | 13 (9.8) |
| >40 and ≤55 years | 282 (40.9) | 245 (44.1) | 37 (27.8) | |
| ≥55 years | 233 (33.8) | 150 (26.9) | 83 (62.4) | |
| Hypertension a | 258 (37.4) | 213 (38.3) | 45 (33.8) | |
| T2DM a | 103 (14.9) | 80 (14.4) | 23 (17.3) | |
| BMI (kg/m2) b | 22.7 (20.3 to 25.4) | 22.79 (20.5 to 25.74) | 22.48 (20.23 to 25.03) | |
| Waist circumference (cm2) b | 86 (64 to 97) | 88 (67 to 103) | 83 (59 to 87) | |
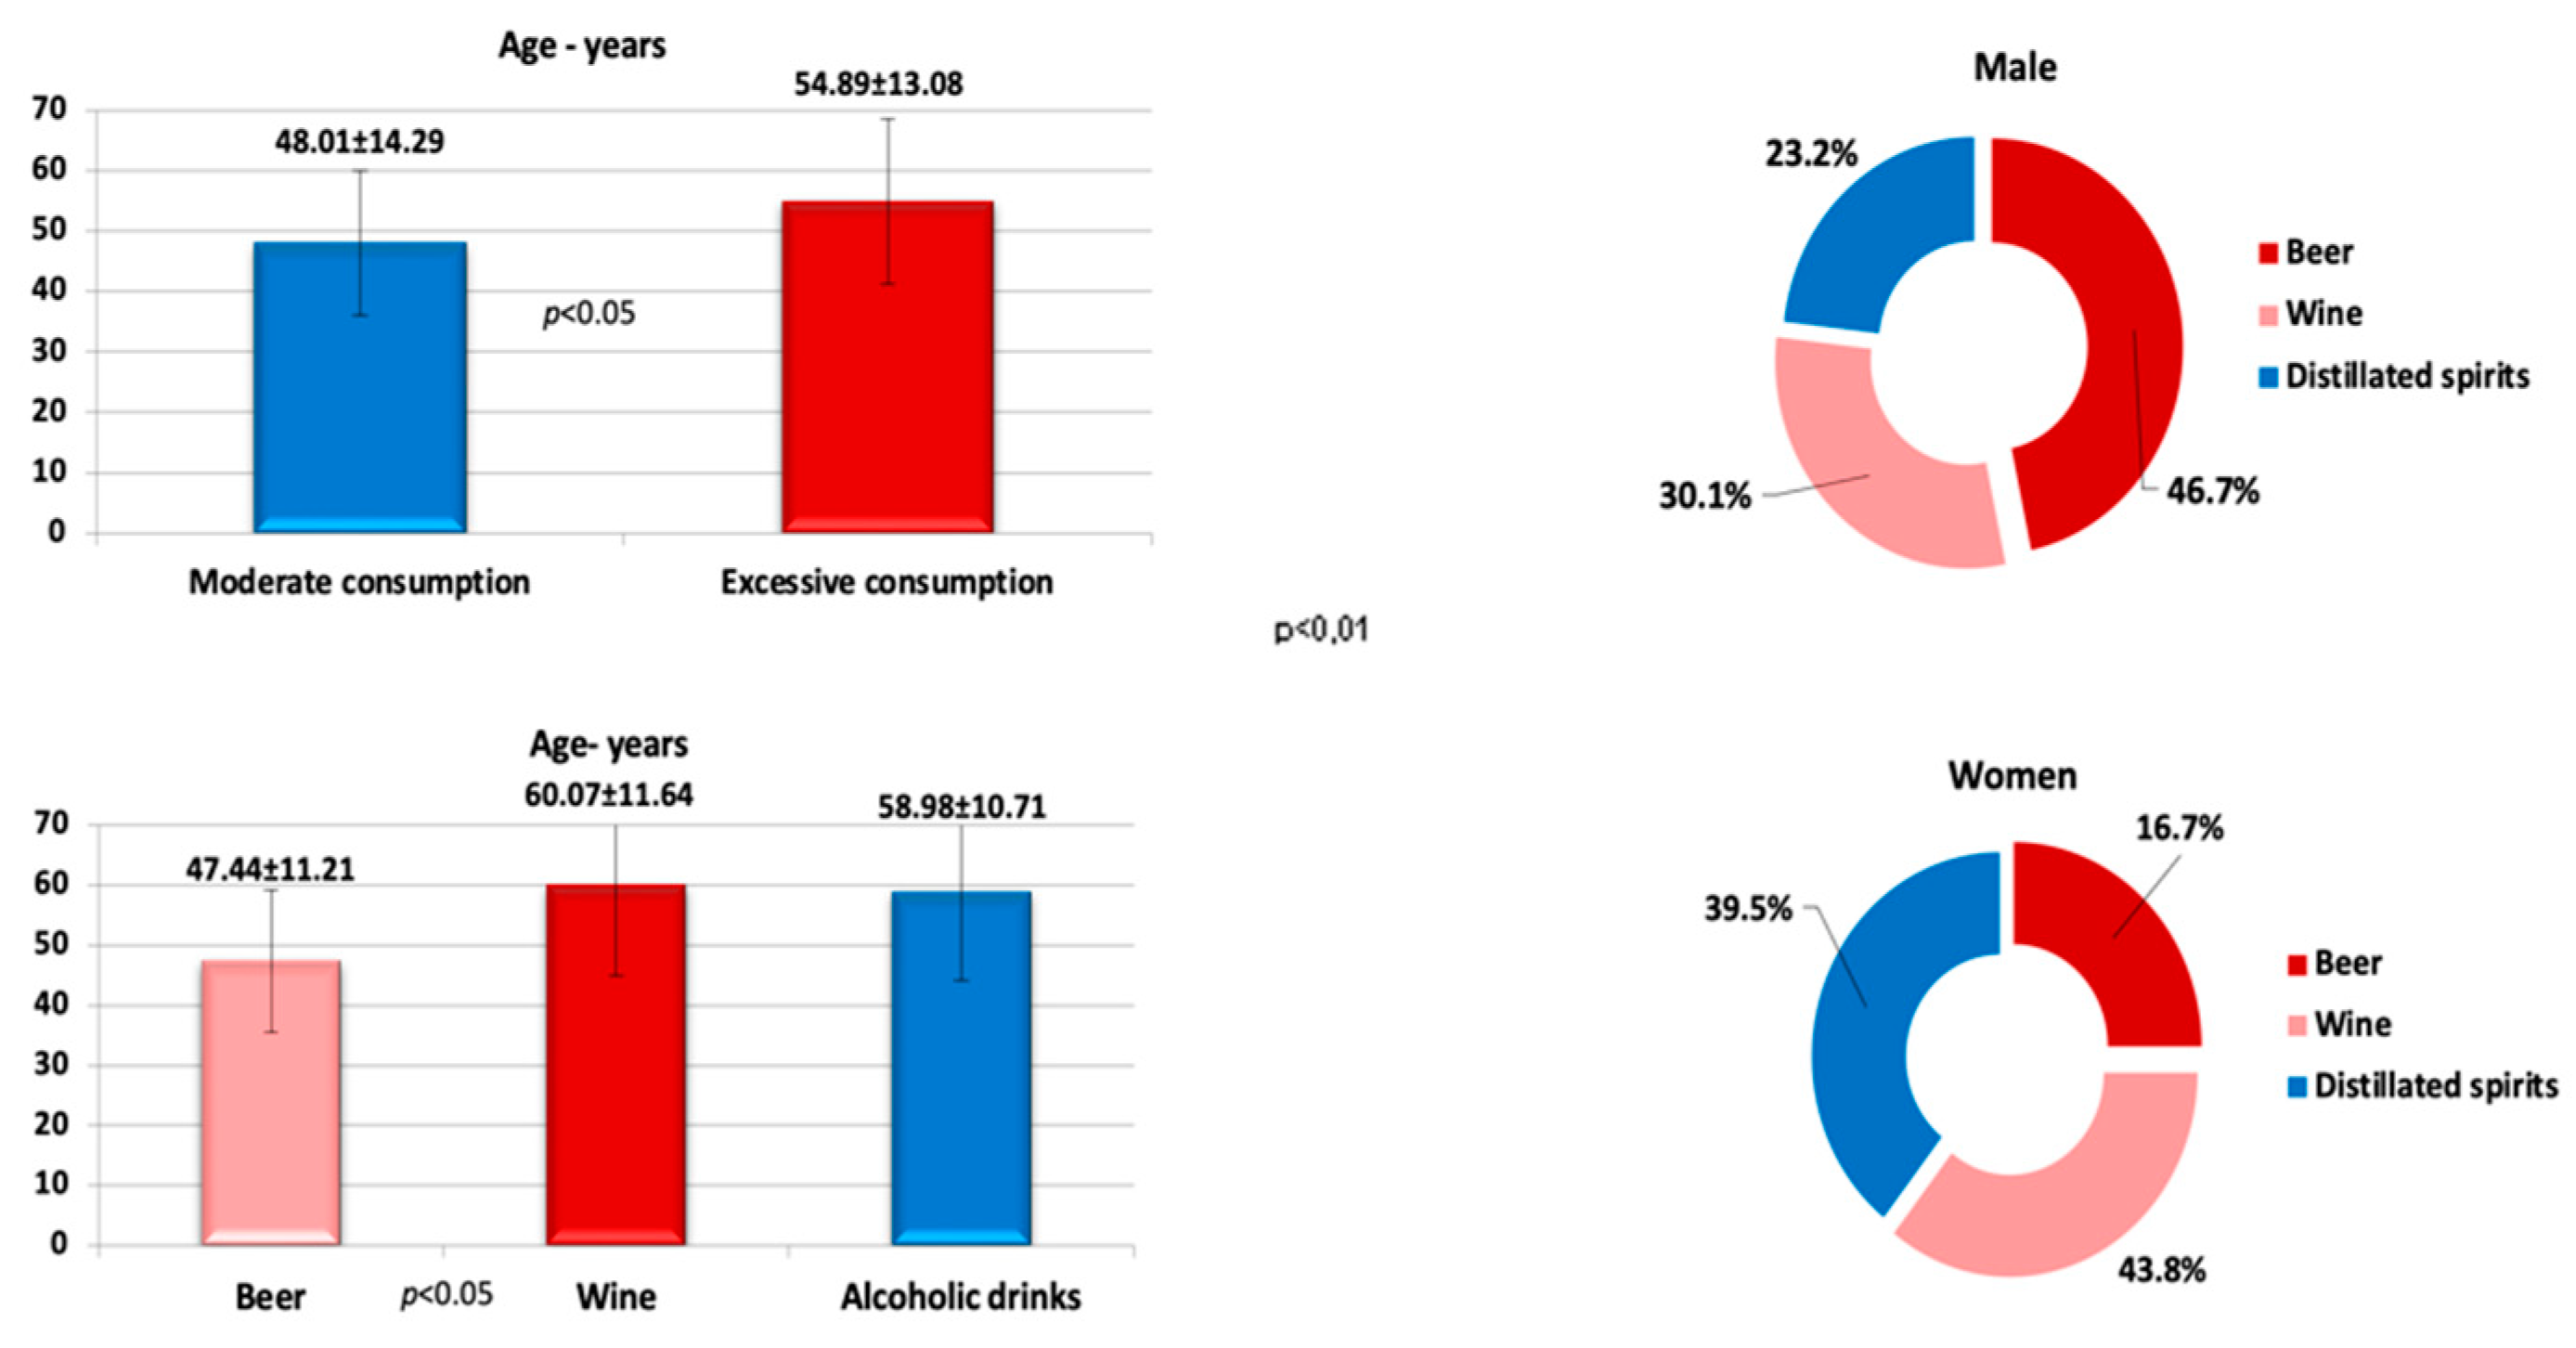
| Pattern of alcohol consumption a | moderate | 557 (80.4) | 528 (94.7) | 29 (21.8) |
| excessive | 132 (19.6) | 28 (5.3) | 104 (78.2) | |
| Variables a | Alcohol Consumption | |||
|---|---|---|---|---|
| Moderate n = 557 Patients | Excessive n = 132 Patients | |||
| Median | IQR | Median | IQR | |
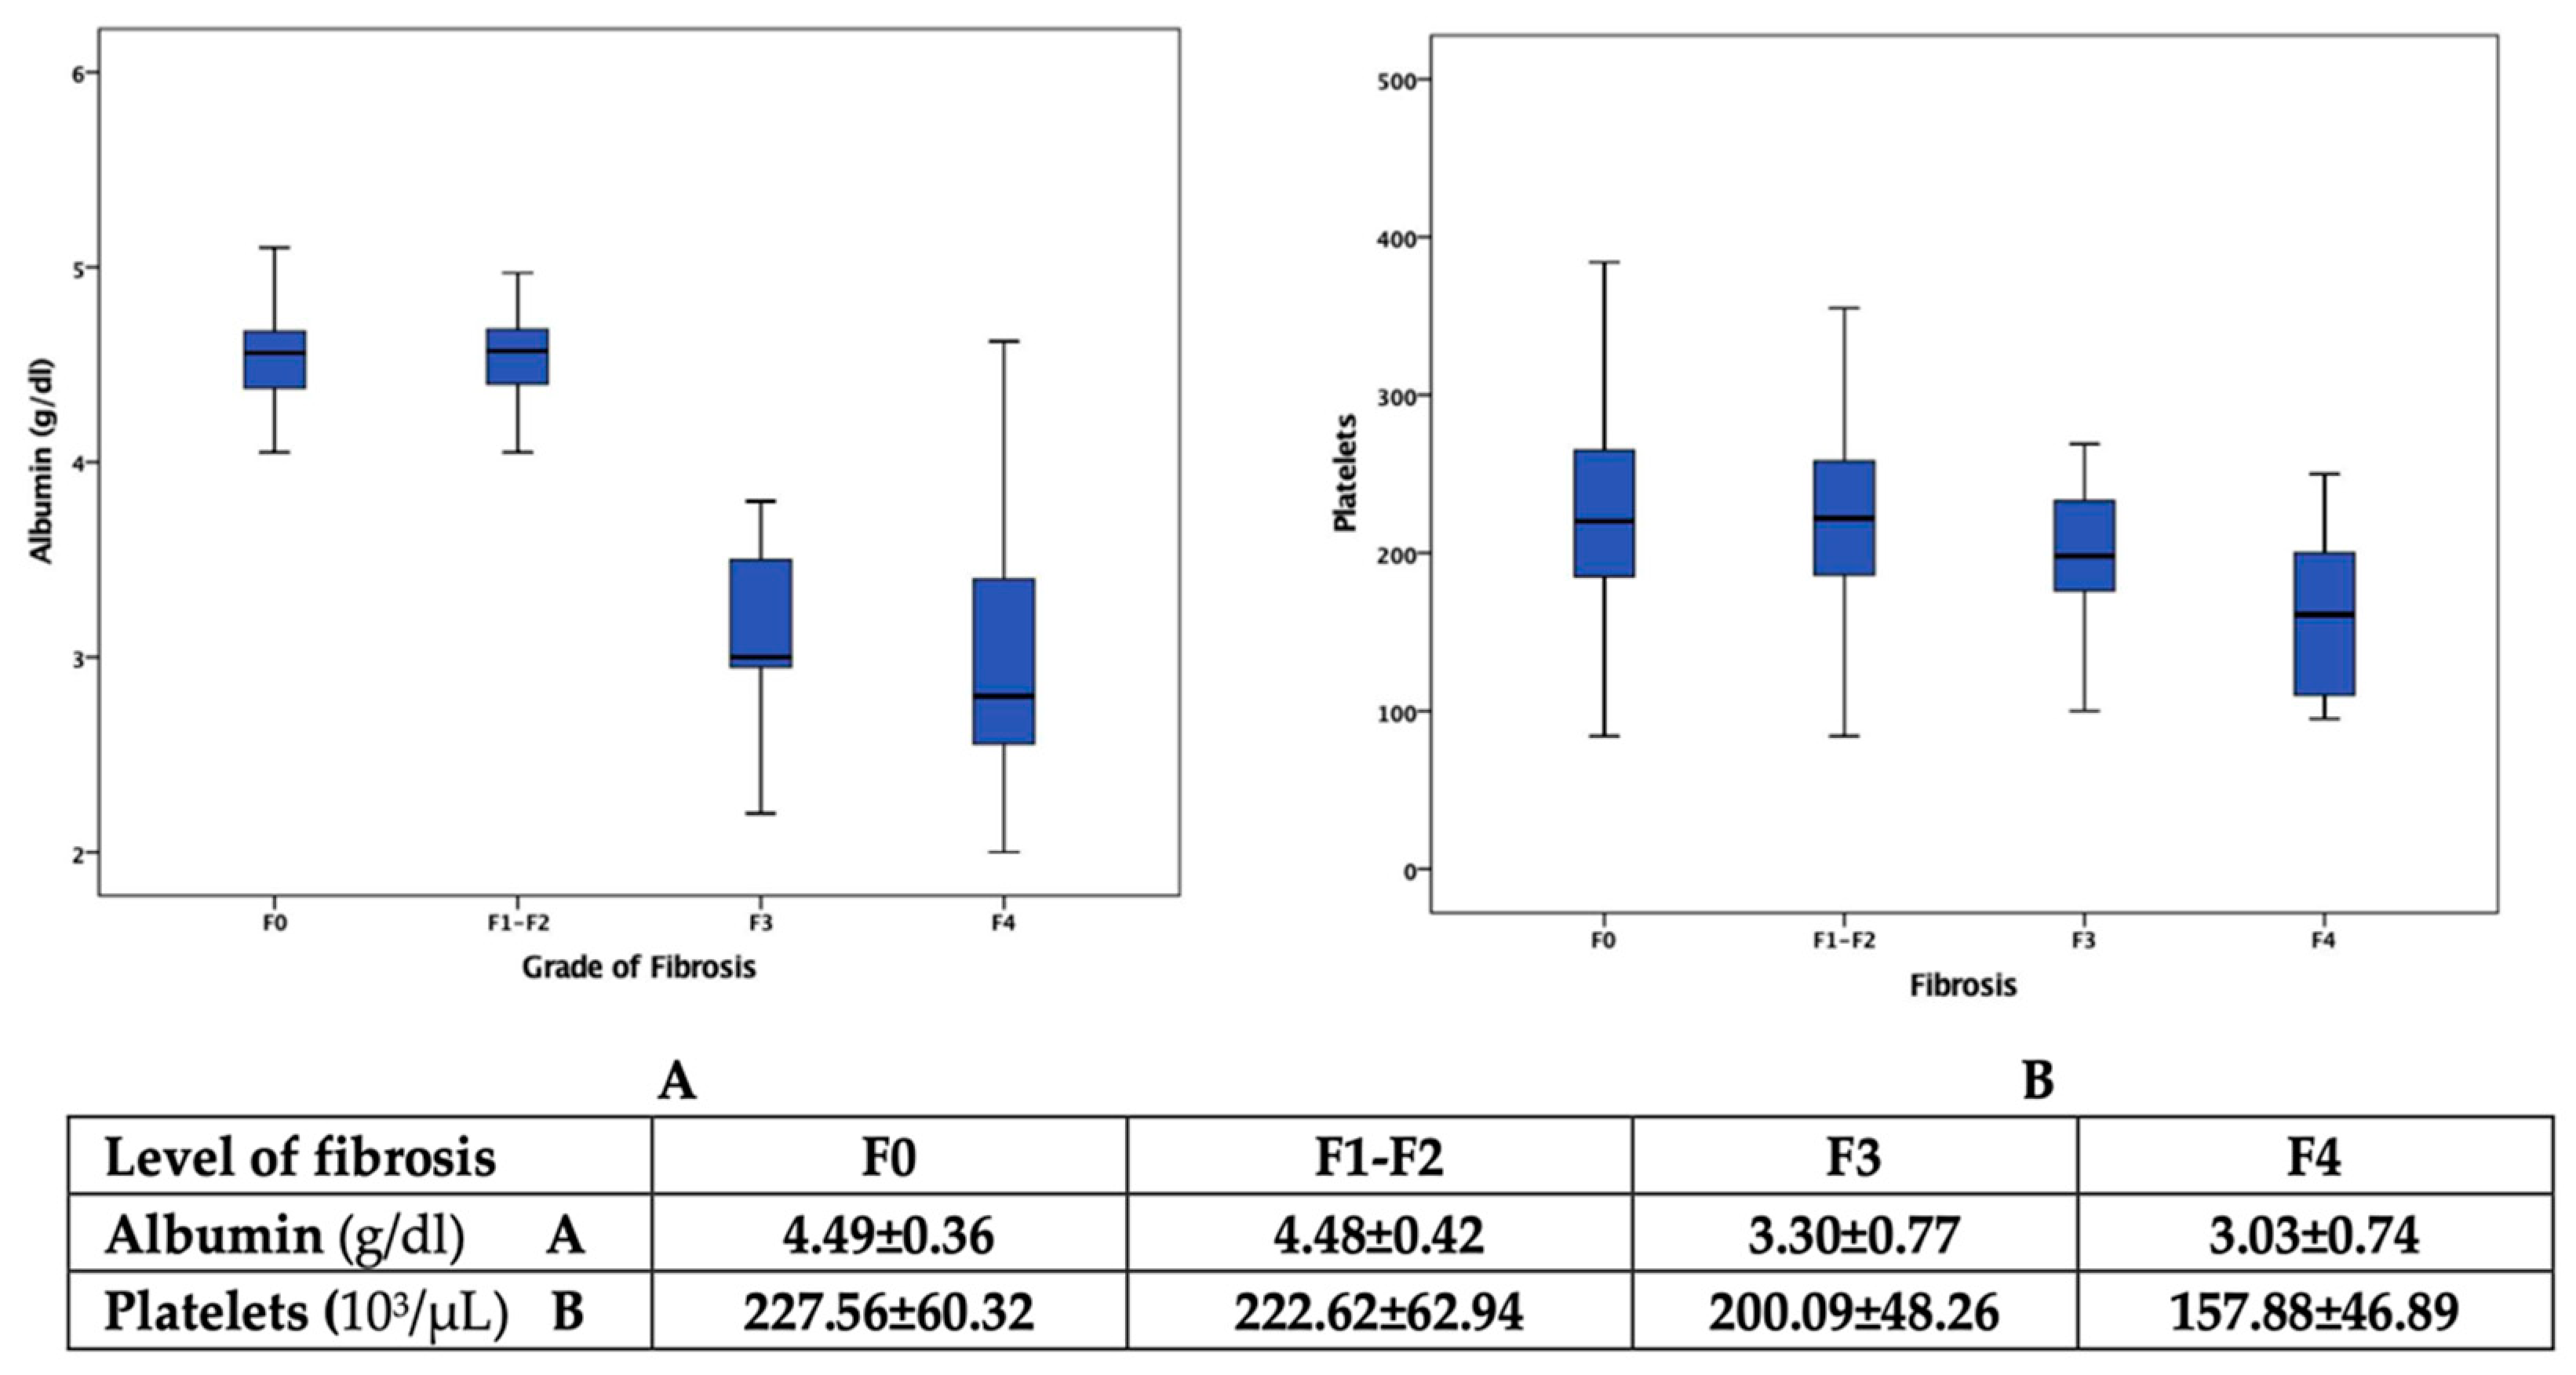
| Platelet count, 103/µL | 220 | 185 to 259 | 192 | 144 to 220 |
| Fibrinogen, mg/dL | 322 | 284 to 370 | 329 | 291 to 327 |
| INR | 1.08 | 1.01 to 1.15 | 1.11 | 1.02 to 1.20 |
| CRP, mg/dL | 0.38 | 0.3 to 0.42 | 0.45 | 0.36 to 0.54 |
| Ferritin level, ng/L | 129 | 94 to 189 | 131 | 101 to 184 |
| Fasting plasma glucose, mg/dL | 82 | 74 to 93 | 87.12 | 77 to 98.1 |
| Urea, mg/dL | 41 | 32 to 47 | 40 | 30 to 47 |
| Creatinine, mg/dL | 0.84 | 0.76 to 0.94 | 0.86 | 0.79 to 0.97 |
| ALT, IU/L | 42.56 | 31.3 to 54.2 | 58.25 | 33 to 72 |
| AST, IU/L | 37.10 | 27 to 52 | 51.27 | 37.25 to 61 |
| GGT, IU/L | 61 | 42 to 83 | 82.3 | 61.25 to 106.25 |
| ALP, IU/L | 87 | 71 to 112 | 97.5 | 72 to 133.5 |
| Total bilirubin, mg/dL | 0.73 | 0.57 to 0.97 | 0.91 | 0.67 to 1.20 |
| Total cholesterol, mg/dL | 210 | 190 to 237 | 214 | 174 to 245 |
| Triglycerides, mg/dL | 150.34 | 120 to 186 | 162 | 129 to 189 |
| Albumin, g/dL | 4.56 | 4.34 to 4.67 | 3 | 2.80 to 4.49 |
| LDL-c, mg/dL | 129 | 102 to 160 | 132 | 88 to 157 |
| HDL-c, mg/dL | 43 | 35.5 to 51 | 42 | 35 to 53 |
| Uric acid, mg/dL | 5.2 | 4.2 to 6.8 | 5.6 | 4.2 to 6.8 |
| Alpha-fetoprotein, ng/mL | 3.9 | 2.85 to 5.17 | 4.16 | 3.10 to 6.11 |
| Advanced Fibrosis ≥F3 | Male, n = 97 Patients | Female, n = 34 Patients | |||||
|---|---|---|---|---|---|---|---|
| Wine n = 27 Patients | Beer n = 23 Patients | Distilled Spirits n = 47 Patients | p | Wine n = 17 Patients | Distilled Spirits n = 17 Patients | p | |
| Mean ± SD | Mean ± SD | Mean ± SD | Mean ± SD | Mean ± SD | |||
| Platelet count, 103/µL | 187.15 ± 41.44 | 193.22 ± 33.98 | 177.63 ± 58.11 | 0.128 | 190.88 ± 49.79 | 174.29 ± 56.75 | 0.174 |
| Fibrinogen, mg/dL | 339.04 ± 47.94 | 325.78 ± 59.97 | 312.55 ± 60.93 | 0.165 | 311.29 ± 55.84 | 347.10 ± 64.02 | 0.076 |
| INR | 1.11 ± 0.24 | 1.12 ± 0.16 | 1.11 ± 0.17 | 0.788 | 1.14 ± 0.23 | 1.04 ± 0.29 | 0.468 |
| CRP, mg/dL | 0.30 ± 0.0 9 | 0.33 ± 0.11 | 0.59 ± 0.31 | 0.038 | 0.28 ± 0.10 | 0.68 ± 0.42 | 0.031 |
| Ferritin level, ng/L | 158.37 ± 98.60 | 155.53 ± 58.05 | 167.72 ± 69.64 | 0.534 | 109.76 ± 21.54 | 112.54 ± 38.84 | 0.917 |
| Fasting plasma glucose, mg/dL | 85.23 ± 24.45 | 88.22 ± 22.89 | 91.38 ± 28.98 | 0.709 | 86.17 ± 26.33 | 89.29 ± 27.17 | 0.798 |
| Urea, mg/dL | 35.44 ± 9.42 | 40.35 ± 10.48 | 41.15 ± 12.66 | 0.370 | 38.04 ± 11.58 | 40.06 ± 10.98 | 0.959 |
| Creatinine, mg/dL | 0.86 ± 0.15 | 0.94 ± 0.16 | 0.89 ± 0.19 | 0.320 | 0.91 ± 0.13 | 0.85 ± 0.10 | 0.214 |
| AST, IU/L | 36.88 ± 14.48 | 42.08 ± 13.60 | 62.13 ± 20.78 | 0.016 | 50.88 ± 21.59 | 54.94 ± 24.59 | 0.417 |
| ALT, IU/L | 40.40 ± 10.46 | 45.22 ± 14.24 | 71.32 ± 26.72 | 0.035 | 59.12 ± 17.71 | 60.47 ± 27.17 | 0.678 |
| GGT, IU/L | 57.85 ± 30.06 | 67.69 ± 32.90 | 86.29 ± 39.91 | 0.114 | 68.24 ± 27.94 | 82.12 ± 38.22 | 0.094 |
| ALP, IU/L | 90.22 ± 43.66 | 101.30 ± 34.35 | 105.55 ± 38.98 | 0.219 | 93.94 ± 42.67 | 102.06 ± 37.72 | 0.324 |
| Total bilirubin, mg/dL | 0.86 ± 0.44 | 0.88 ± 0.51 | 0.92 ± 0.55 | 0.604 | 0.91 ± 0.56 | 1.05 ± 0.58 | 0.241 |
| Total cholesterol, mg/dL | 164.15 ± 40.88 | 194.22 ± 45.61 | 215.42 ± 48.15 | 0.037 | 188.82 ± 41.13 | 264.59 ± 57.85 | 0.028 |
| Triglycerides, mg/dL | 171.70 ± 56.33 | 165.91 ± 41.82 | 207.13 ± 60.17 | 0.023 | 182.47 ± 54.71 | 191.24 ± 56.54 | 0.214 |
| Albumin, g/dL | 2.92 ± 0.48 | 3.15 ± 0.65 | 2.97 ± 0.57 | 0.441 | 3.67 ± 0.61 | 3.25 ± 0.58 | 0.543 |
| LDL-c, mg/dL | 87.37 ± 23.37 | 107.65 ± 28.64 | 135.47 ± 34.32 | 0.013 | 96.47 ± 27.49 | 143.53 ± 29.47 | 0.037 |
| HDL-c, mg/dL | 38.59 ± 10.69 | 41.04 ± 10.99 | 37.62 ± 10.51 | 0.352 | 42.47 ± 11.69 | 38.88 ± 10.31 | 0.429 |
| Uric acid, mg/dL | 5.32 ± 1.33 | 5.58 ± 1.43 | 5.48 ± 1.30 | 0.685 | 4.87 ± 1.15 | 4.83 ± 1.08 | 0.457 |
| Alpha-fetoprotein, ng/mL | 4.75 ± 1.42 | 4.98 ± 1.62 | 4.86 ± 1.57 | 0.491 | 4.81 ± 1.43 | 4.72 ± 1.28 | 0.577 |
| Age | Beverage | Moderate Alcohol Consumption | Excessive Alcohol Consumption |
|---|---|---|---|
| OR (95% CI) | OR (95% CI) | ||
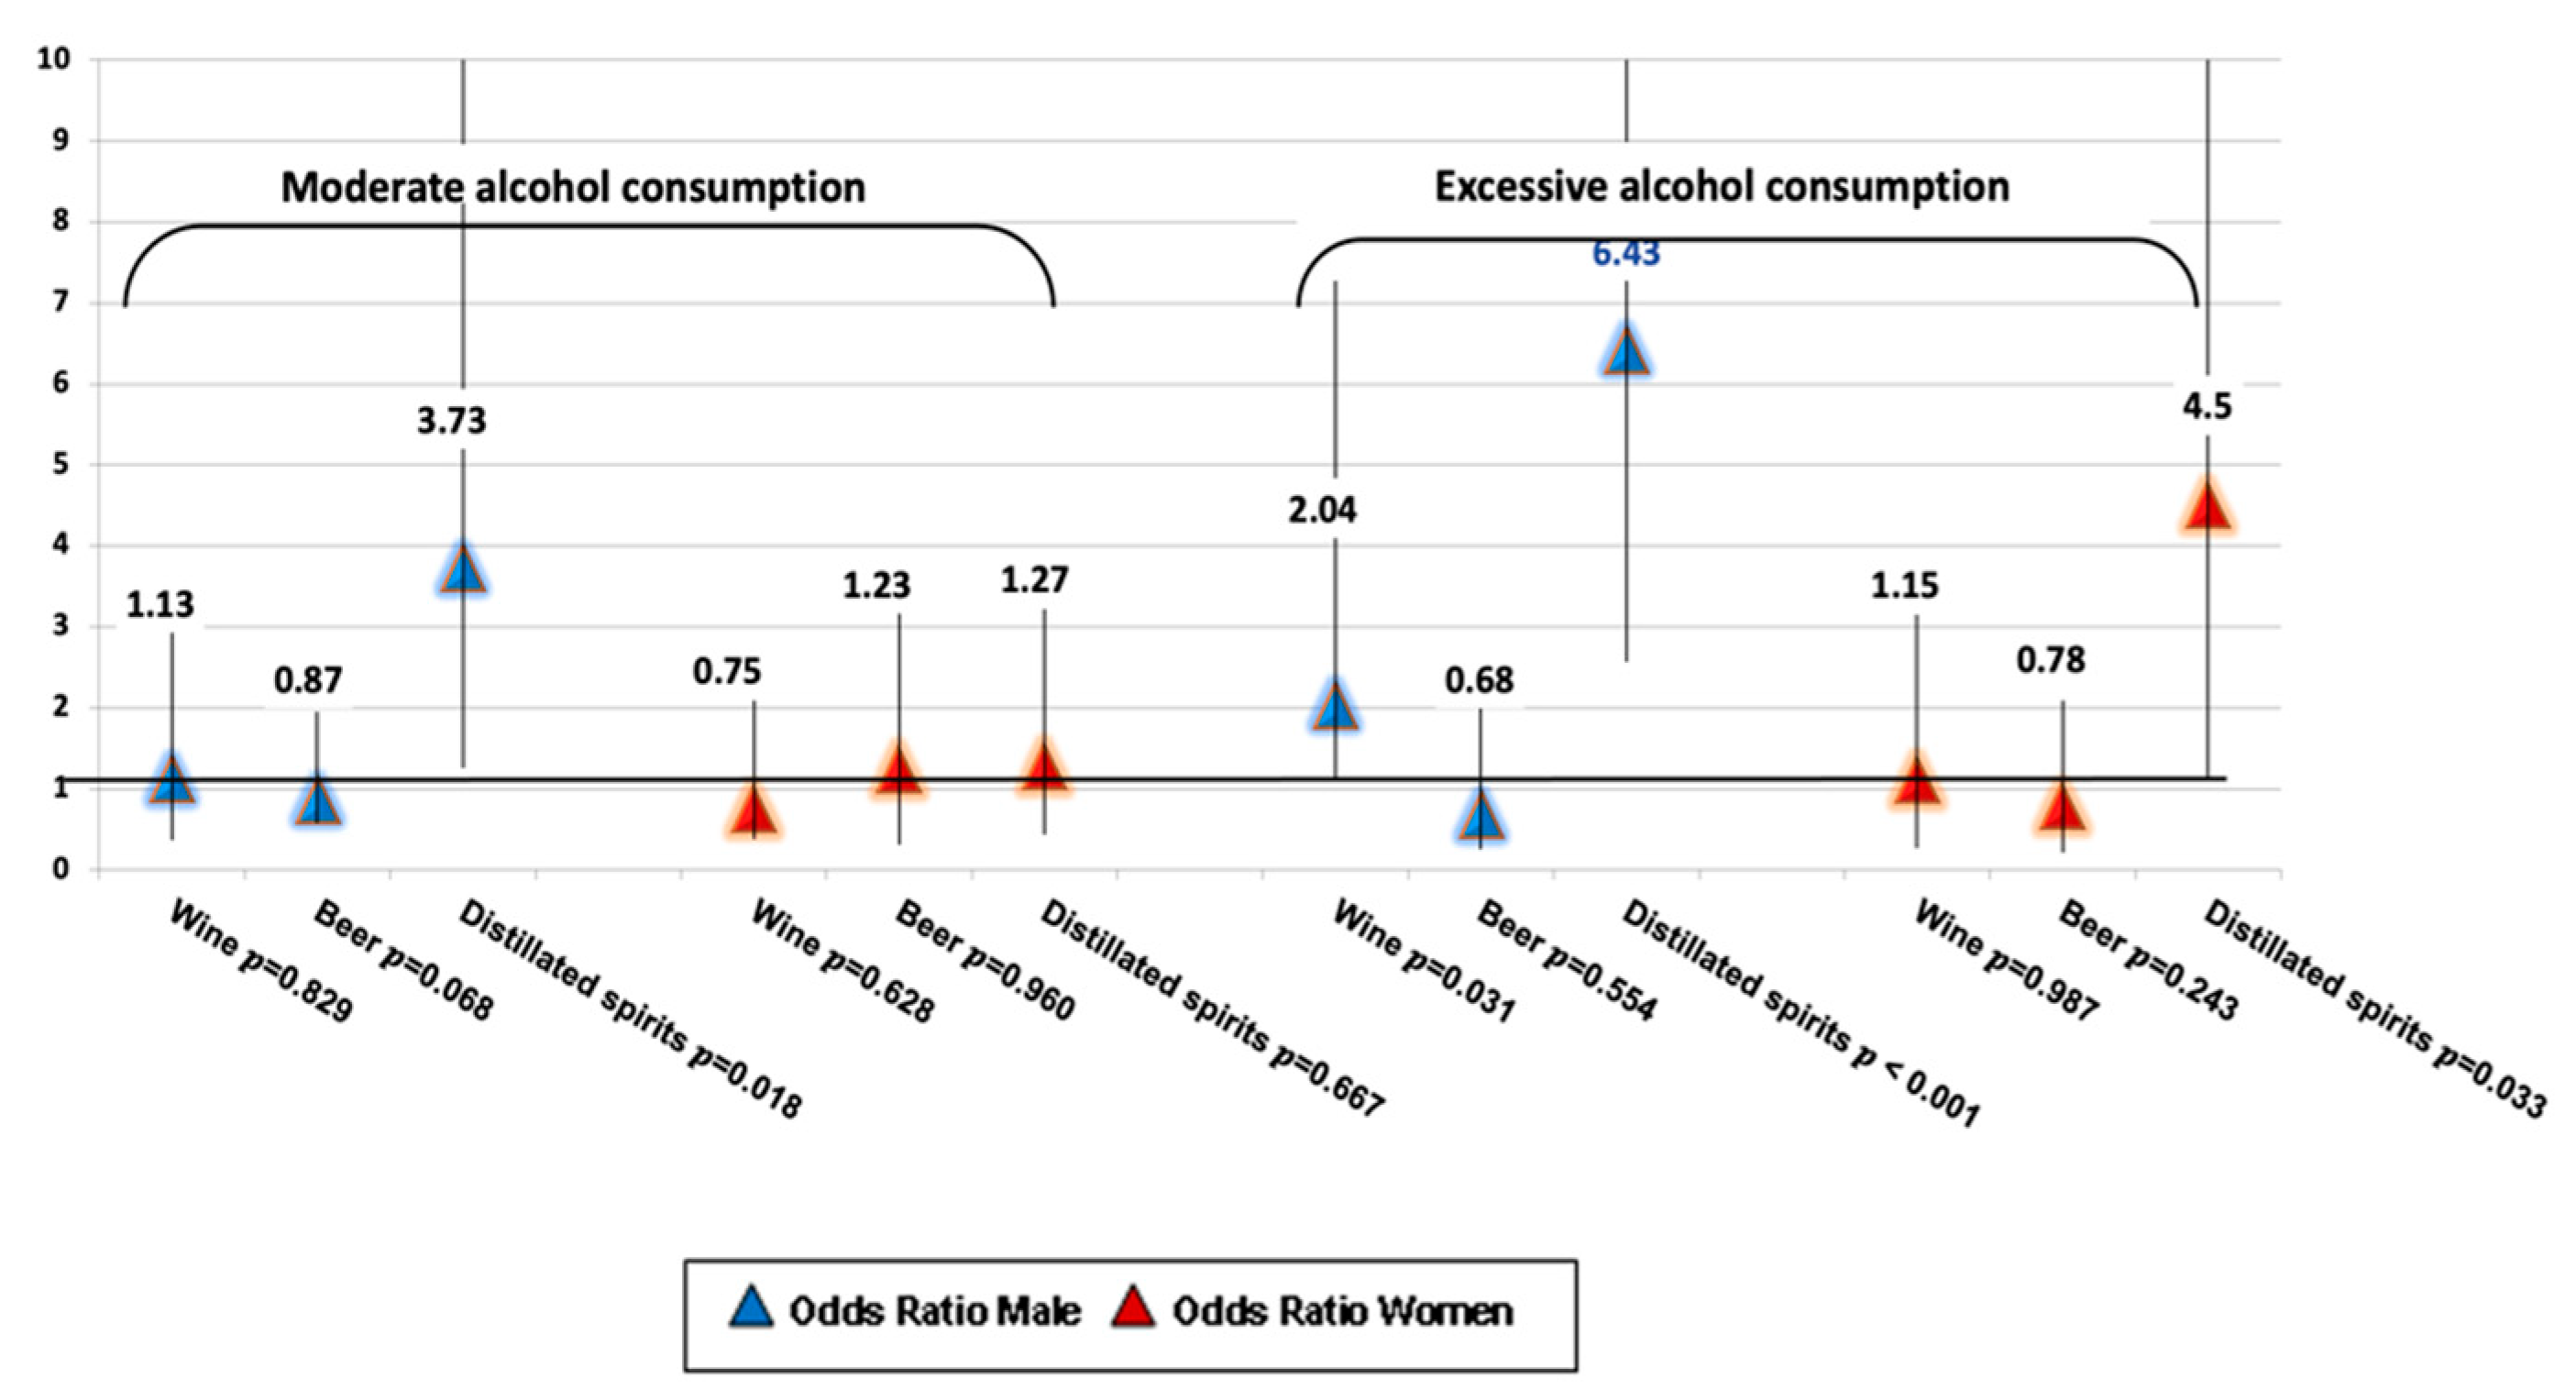
| ≤40 years | Wine | 1.2 (0.28–5.22) | 0.67 (0.10–4.35) |
| Beer | 0.38 (0.07–1.95) | 0.42 (0.07–2.65) | |
| Distilled spirits | 2.40 (0.54–10.61) | 3.50 (0.59–20.69) | |
| >40 and ≤55 years | Wine | 1.04 (0.26–4.13) | 0.40 (0.12–1.34) |
| Beer | 1.18 (0.40–3.48) | 1.19 (0.36–3.99) | |
| Distilled spirits | 1.24 (0.38–4.14) | 1.56 (0.53–4.63) | |
| >55 years | Wine | 0.71 (0.18–2.80) | 1.63 (0.48–5.54) |
| Beer | 0.57 (0.14–2.26) | 0.82 (0.021–1.23) | |
| Distilled spirits | 3.62 (1.13–11.64) | 3.73 (1.51–14.63) |
| Biologic Parameters | Male | Female | ≤40 Years | >40 Years and ≤55 Years | >55 Years | |||||
|---|---|---|---|---|---|---|---|---|---|---|
| β | p | β | p | β | p | β | p | β | p | |
| Platelet count, 103/µL | −0.304 | 0.001 | −0.387 | 0.001 | −0.235 | 0.001 | −0.237 | 0.001 | −0.469 | 0.001 |
| ALT, IU/L | 0.167 | 0.001 | 0.240 | 0.001 | - | - | 0.124 | 0.037 | 0.278 | 0.001 |
| AST, IU/L | 0.145 | 0.003 | 0.212 | 0.001 | - | - | 0.136 | 0.022 | 0.290 | 0.001 |
| GGT, IU/L | - | - | 0.458 | 0.001 | - | - | - | - | - | - |
| Ferritin level, ng/L | - | - | −0.134 | 0.024 | - | - | - | - | 0.159 | 0.015 |
| CRP, mg/dL | - | - | −0.217 | 0.001 | - | - | - | - | - | - |
| Total bilirubin, mg/dL | 0.257 | 0.001 | 0.232 | 0.001 | 0.233 | 0.020 | 0.257 | 0.001 | 0.314 | 0.001 |
| Total cholesterol, mg/dL | - | - | −0.559 | 0.001 | - | - | −0.383 | 0.021 | −0.456 | 0.001 |
| Triglycerides, mg/dL | 0.343 | 0.036 | 0.119 | 0.045 | - | - | - | - | - | - |
| Albumin, g/dL | −0.752 | 0.001 | −0.450 | 0.001 | −0.730 | 0.001 | −0.640 | 0.001 | −0.570 | 0.001 |
| LDL-c, mg/dL | - | - | −0.380 | 0.001 | - | - | - | - | 0.384 | 0.001 |
Disclaimer/Publisher’s Note: The statements, opinions and data contained in all publications are solely those of the individual author(s) and contributor(s) and not of MDPI and/or the editor(s). MDPI and/or the editor(s) disclaim responsibility for any injury to people or property resulting from any ideas, methods, instructions or products referred to in the content. |
© 2023 by the authors. Licensee MDPI, Basel, Switzerland. This article is an open access article distributed under the terms and conditions of the Creative Commons Attribution (CC BY) license (https://creativecommons.org/licenses/by/4.0/).
Share and Cite
Minea, H.; Singeap, A.-M.; Sfarti, C.V.; Girleanu, I.; Chiriac, S.; Muzica, C.; Cuciureanu, T.; Petrea, O.C.; Huiban, L.; Zenovia, S.; et al. The Impact of Alcohol Consumption Pattern on Liver Fibrosis in Asymptomatic Patients. J. Clin. Med. 2023, 12, 7405. https://doi.org/10.3390/jcm12237405
Minea H, Singeap A-M, Sfarti CV, Girleanu I, Chiriac S, Muzica C, Cuciureanu T, Petrea OC, Huiban L, Zenovia S, et al. The Impact of Alcohol Consumption Pattern on Liver Fibrosis in Asymptomatic Patients. Journal of Clinical Medicine. 2023; 12(23):7405. https://doi.org/10.3390/jcm12237405
Chicago/Turabian StyleMinea, Horia, Ana-Maria Singeap, Catalin Victor Sfarti, Irina Girleanu, Stefan Chiriac, Cristina Muzica, Tudor Cuciureanu, Oana Cristina Petrea, Laura Huiban, Sebastian Zenovia, and et al. 2023. "The Impact of Alcohol Consumption Pattern on Liver Fibrosis in Asymptomatic Patients" Journal of Clinical Medicine 12, no. 23: 7405. https://doi.org/10.3390/jcm12237405
APA StyleMinea, H., Singeap, A.-M., Sfarti, C. V., Girleanu, I., Chiriac, S., Muzica, C., Cuciureanu, T., Petrea, O. C., Huiban, L., Zenovia, S., Nastasa, R., Rotaru, A., Stafie, R., Stratina, E., Cojocariu, C., Stanciu, C., & Trifan, A. (2023). The Impact of Alcohol Consumption Pattern on Liver Fibrosis in Asymptomatic Patients. Journal of Clinical Medicine, 12(23), 7405. https://doi.org/10.3390/jcm12237405