
The Impact of Machine Learning and Robot-Assisted Gait Training on Spinal Cord Injury: A Systematic Review and Meta-Analysis

 ,
,
Abstract

1. Introduction
2. Material and Methods
2.1. Search Strategy
2.2. Data Selection
2.3. Data Extraction
2.4. Risk of Bias
2.5. Statistical Analysis
3. Results
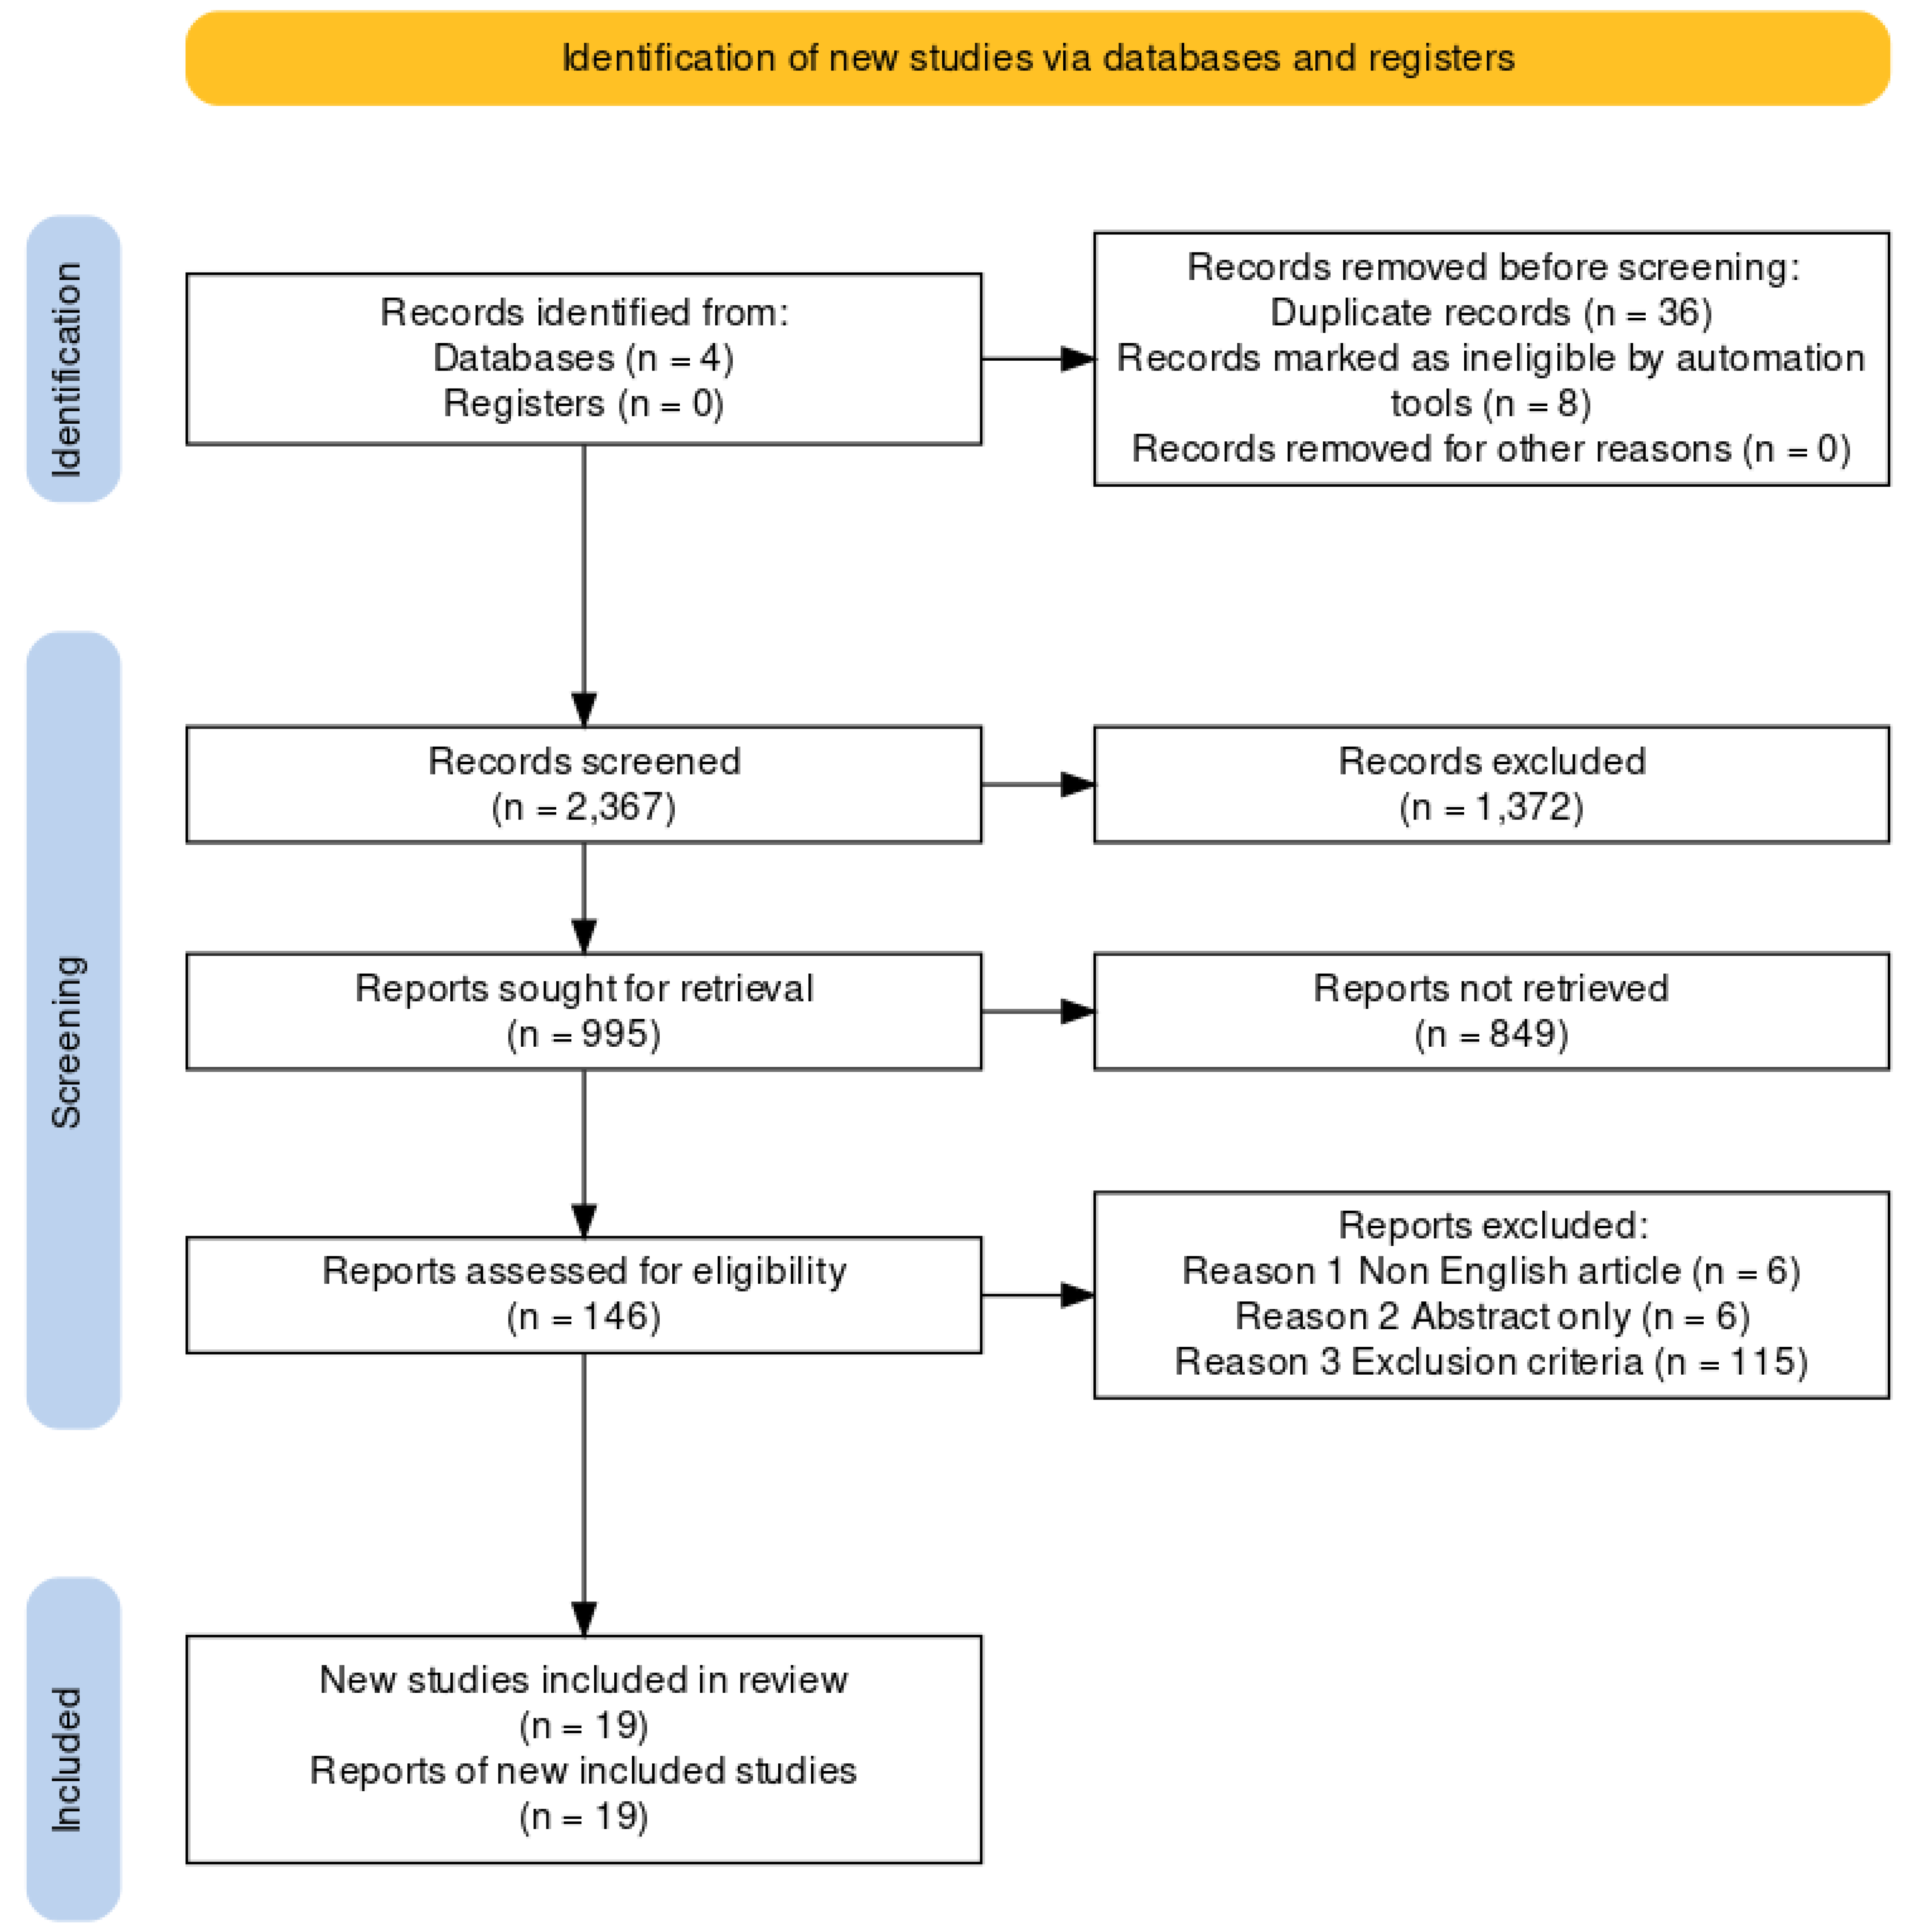
3.1. Search Results and Study Characteristics
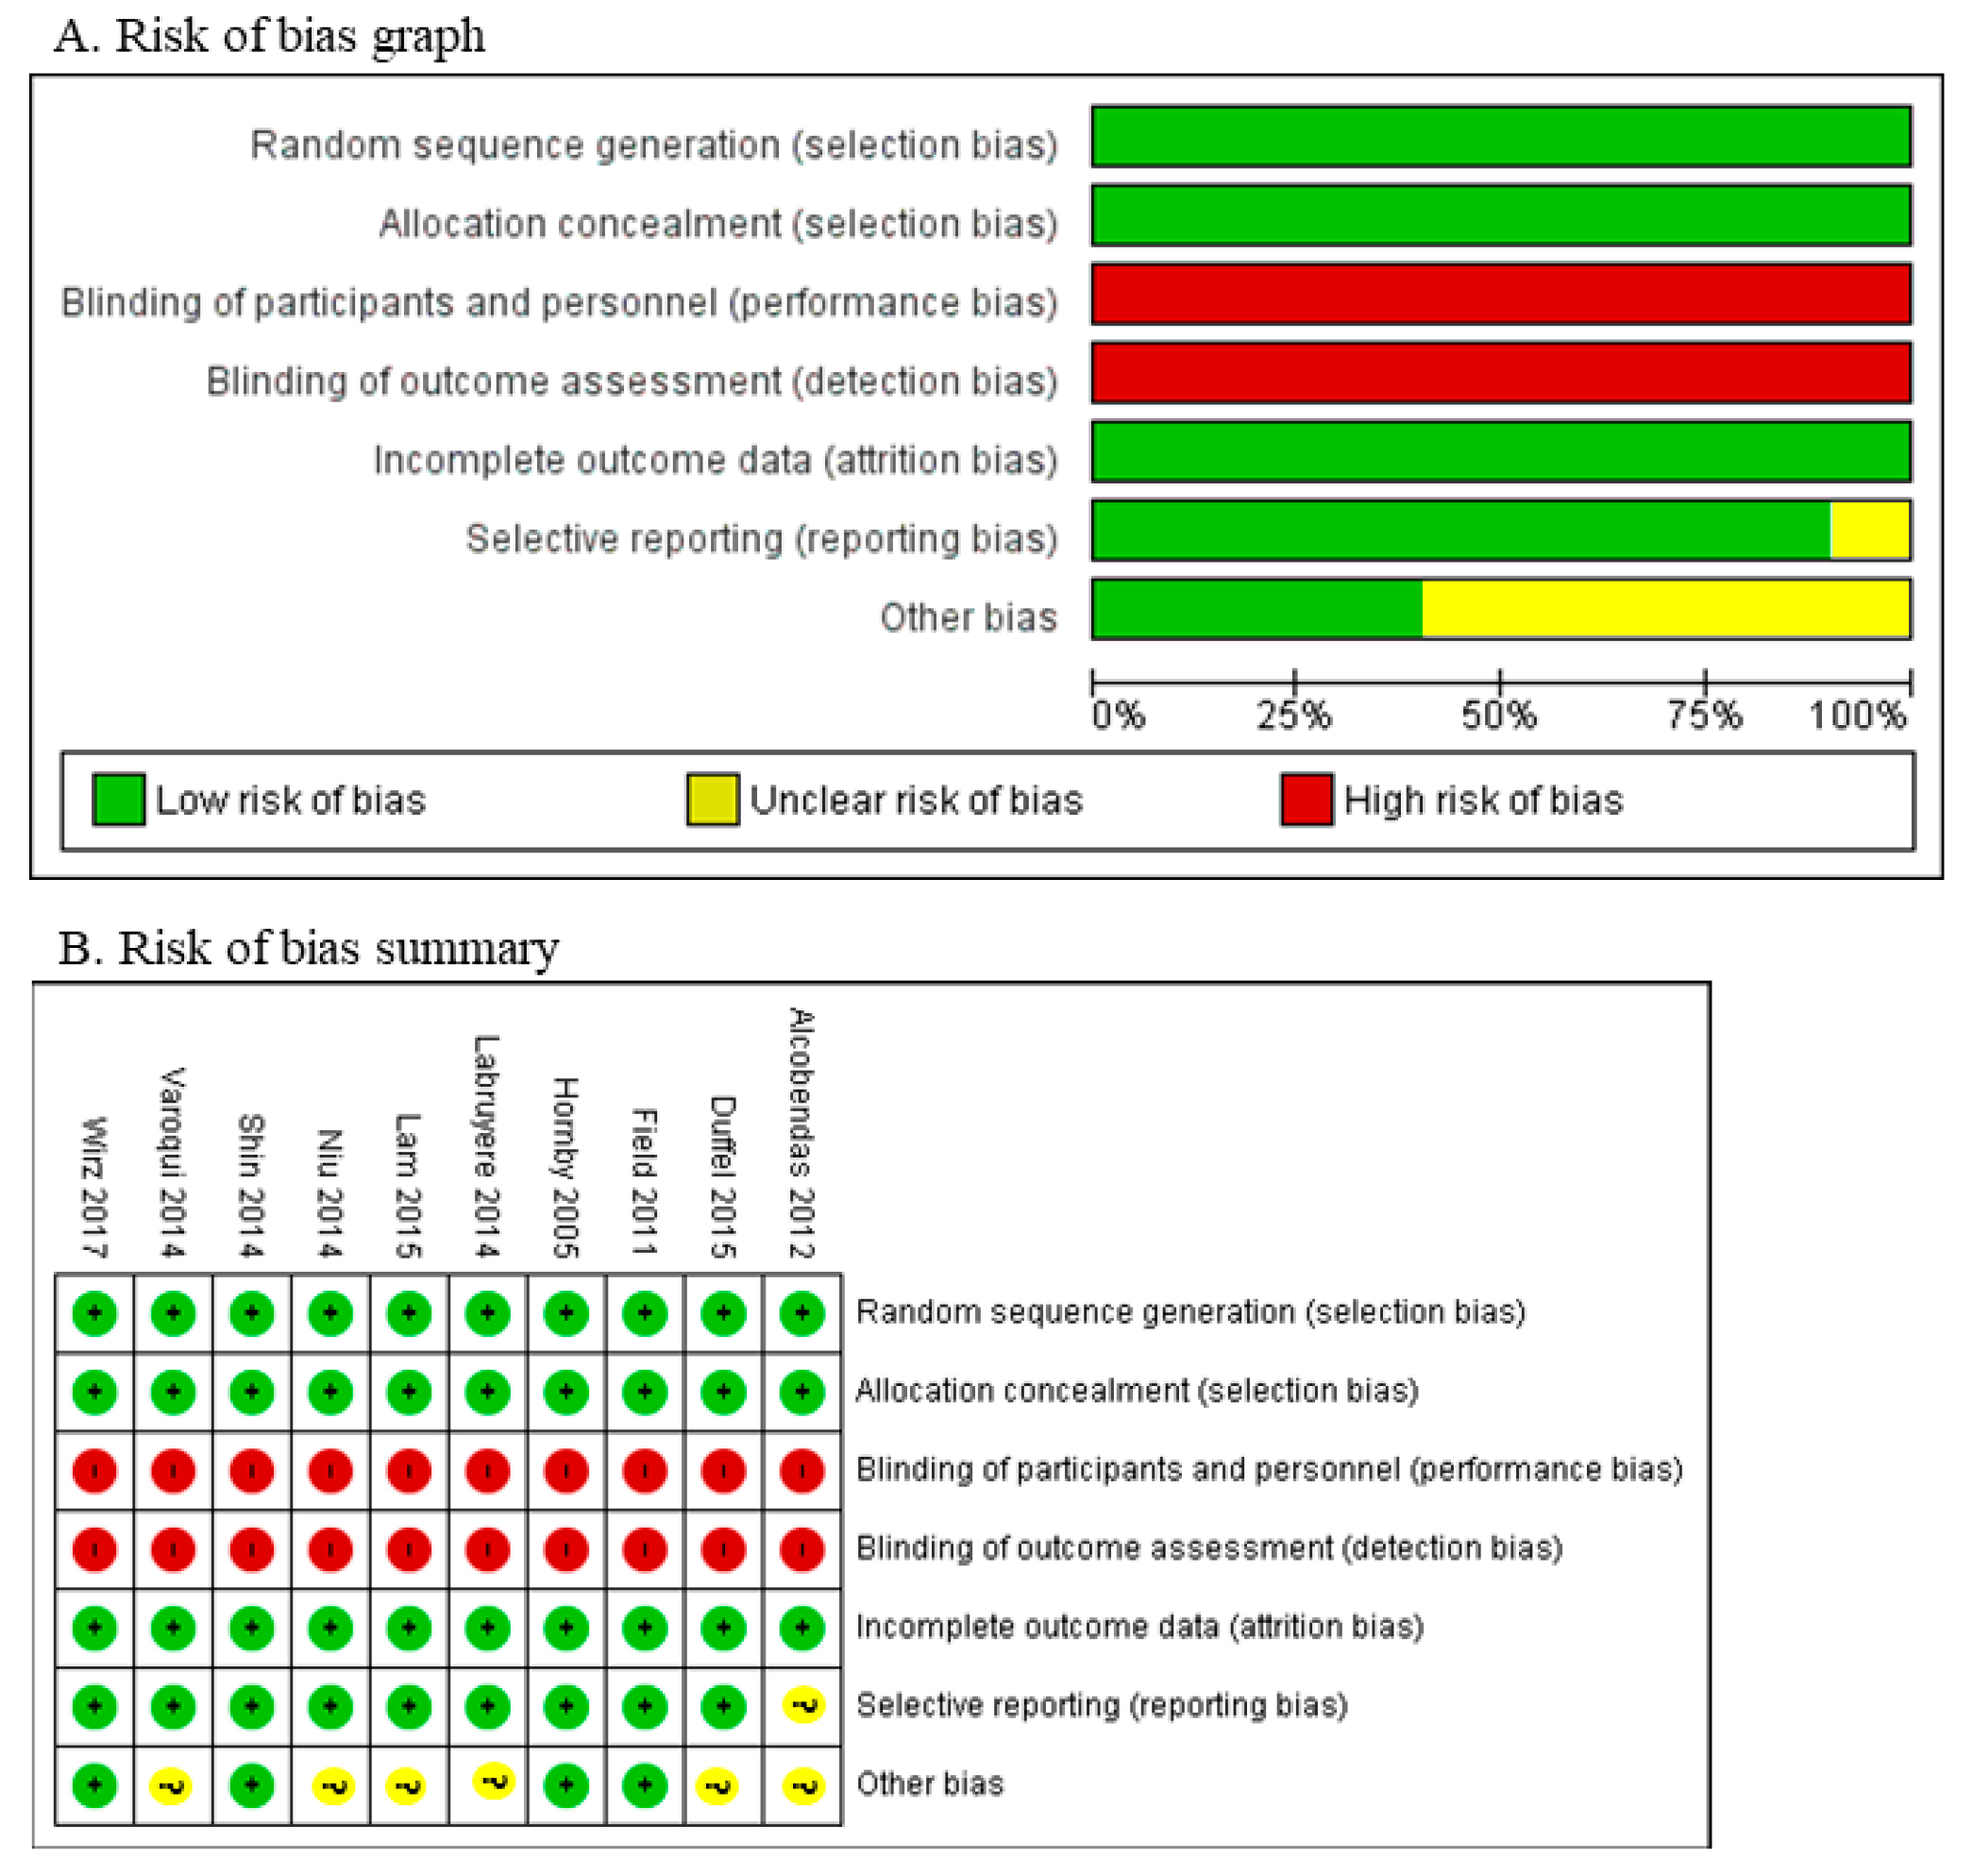
3.2. Bias Assessment
3.3. Analysis of the ML Group
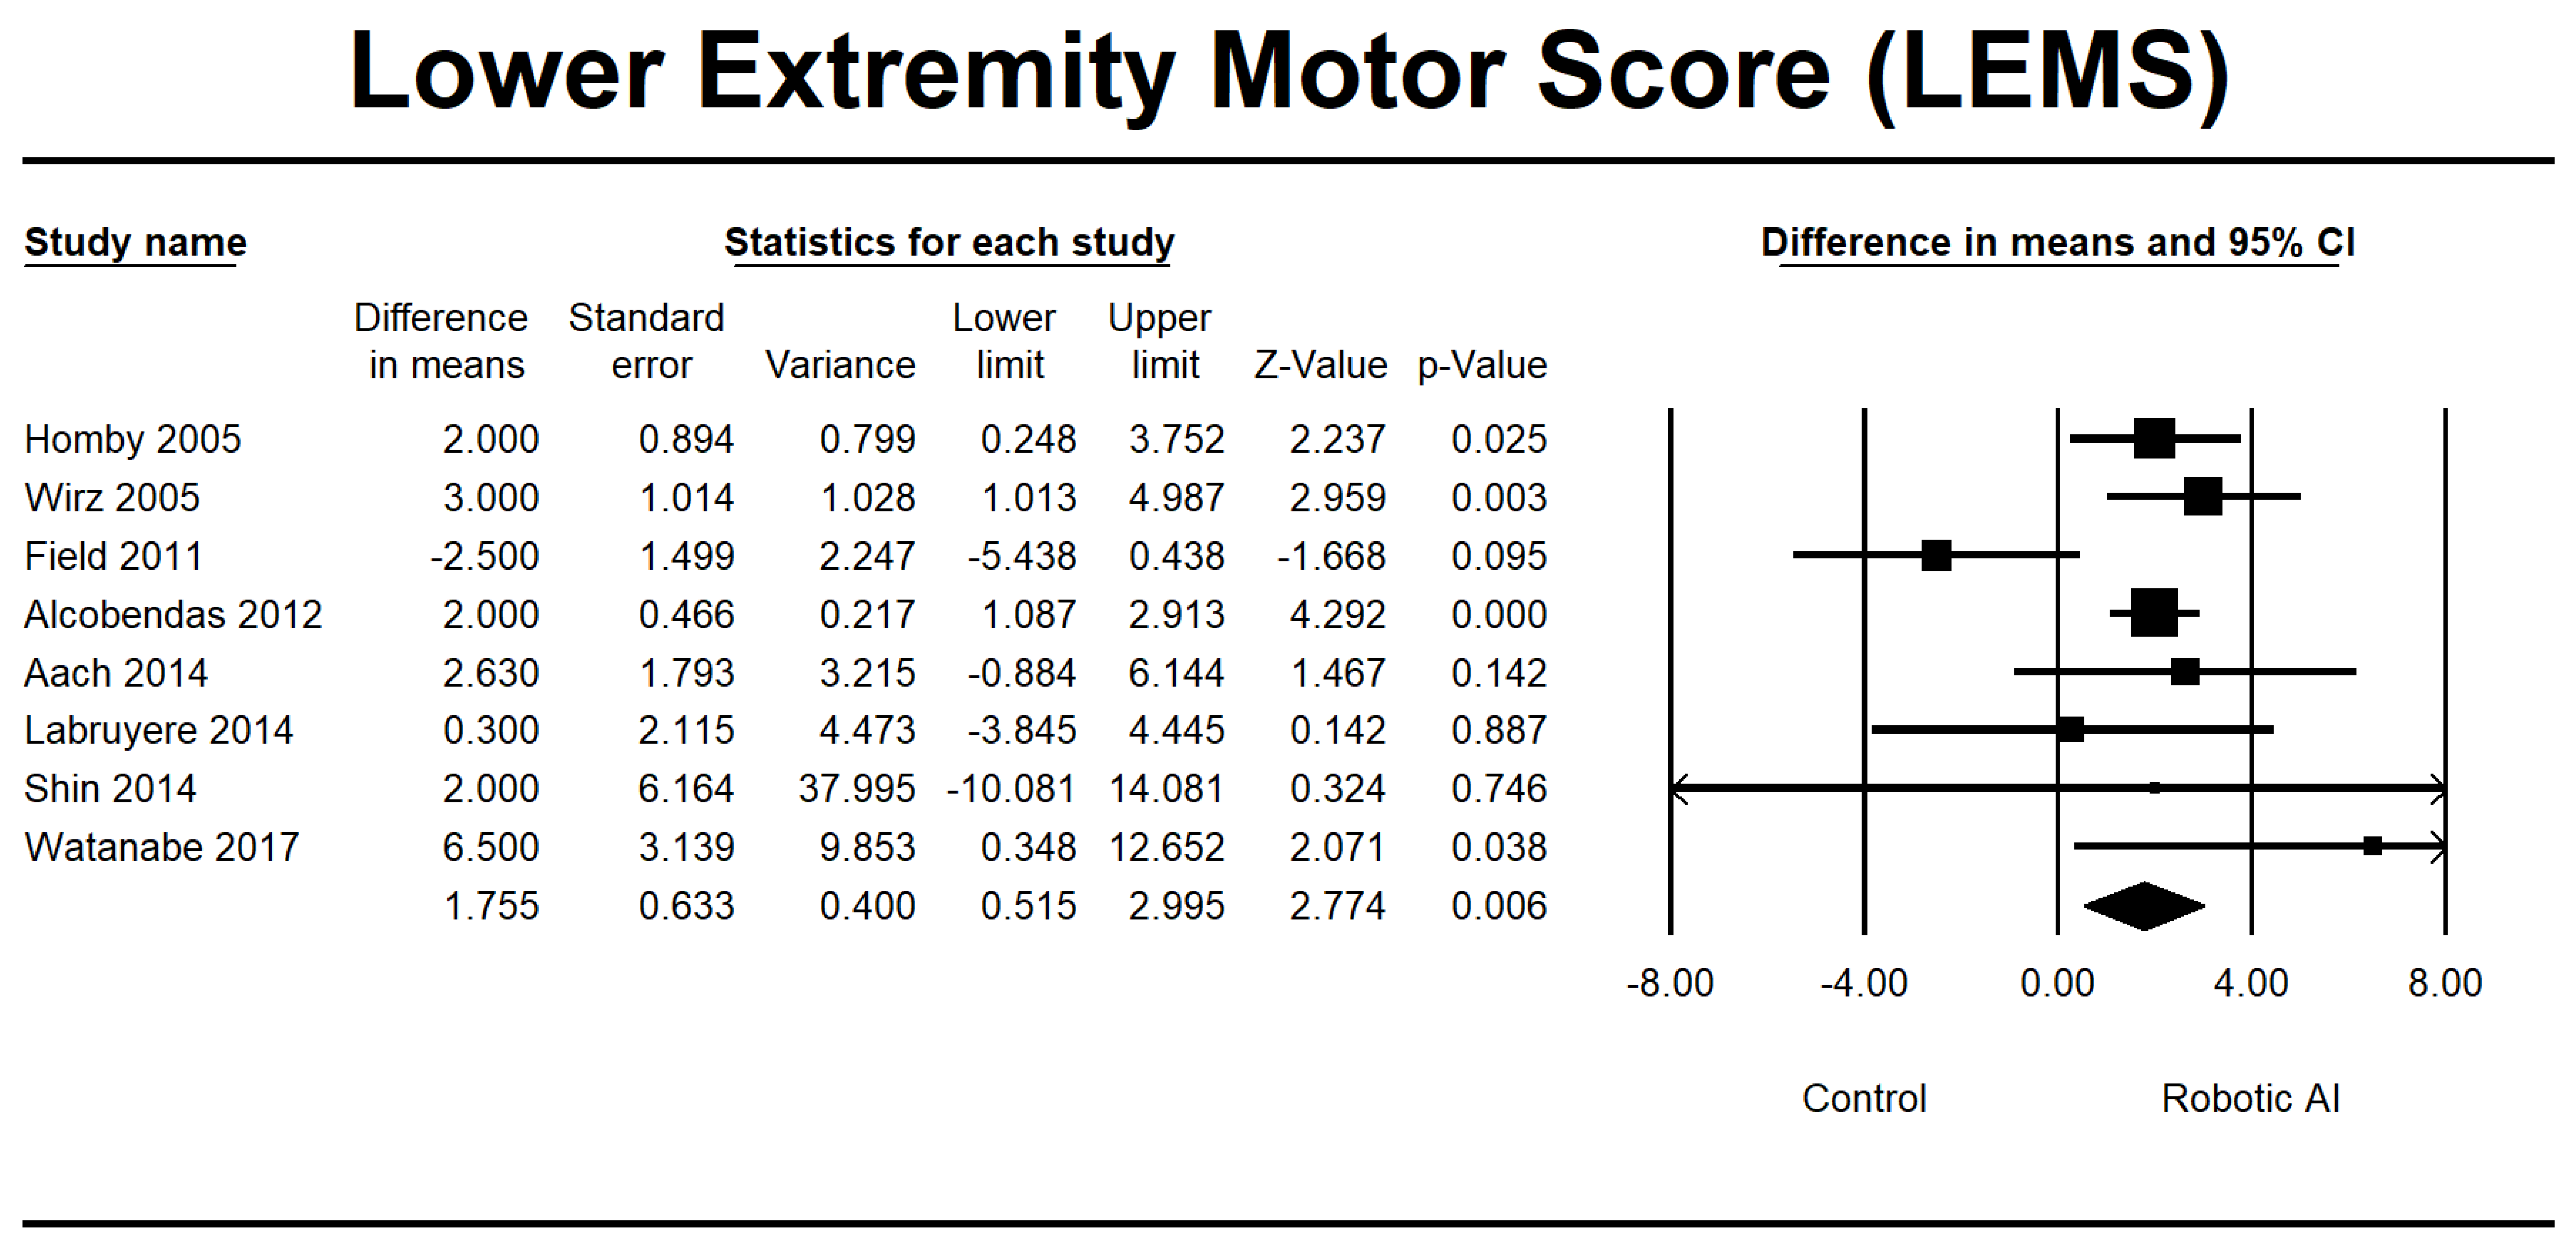
3.4. Analysis of the RAGT Group
4. Discussion
5. Limitations
6. Conclusions
Author Contributions
Funding
Institutional Review Board Statement
Informed Consent Statement
Data Availability Statement
Conflicts of Interest
Correction Statement
References
- Lee, B.B.; Cripps, R.A.; Fitzharris, M.; Wing, P.C. The Global Map for Traumatic Spinal Cord Injury Epidemiology: Update 2011, Global Incidence Rate. Spinal Cord 2014, 52, 110–116. [Google Scholar] [CrossRef] [PubMed]
- Fallah, N.; Noonan, V.K.; Waheed, Z.; Rivers, C.S.; Plashkes, T.; Bedi, M.; Etminan, M.; Thorogood, N.P.; Ailon, T.; Chan, E.; et al. Development of a Machine Learning Algorithm for Predicting In-Hospital and 1-Year Mortality after Traumatic Spinal Cord Injury. Spine J. 2022, 22, 329–336. [Google Scholar] [CrossRef]
- Varma, A.; Hill, E.G.; Nicholas, J.; Selassie, A. Predictors of Early Mortality after Traumatic Spinal Cord Injury: A Population-Based Study. Spine 2010, 35, 778–783. [Google Scholar] [CrossRef] [PubMed]
- Chamberlain, J.D.; Meier, S.; Mader, L.; von Groote, P.M.; Brinkhof, M.W.G. Mortality and Longevity after a Spinal Cord Injury: Systematic Review and Meta-Analysis. Neuroepidemiology 2015, 44, 182–198. [Google Scholar] [CrossRef]
- Cao, Y.; Krause, J.S.; DiPiro, N. Risk Factors for Mortality after Spinal Cord Injury in the USA. Spinal Cord 2013, 51, 413–418. [Google Scholar] [CrossRef]
- Shibahashi, K.; Nishida, M.; Okura, Y.; Hamabe, Y. Epidemiological State, Predictors of Early Mortality, and Predictive Models for Traumatic Spinal Cord Injury: A Multicenter Nationwide Cohort Study. Spine 2019, 44, 479–487. [Google Scholar] [CrossRef]
- Azarhomayoun, A.; Aghasi, M.; Mousavi, N.; Shokraneh, F.; Vaccaro, A.R.; Haj Mirzaian, A.; Derakhshan, P.; Rahimi-Movaghar, V. Mortality Rate and Predicting Factors of Traumatic Thoracolumbar Spinal Cord Injury; A Systematic Review and Meta-Analysis. Bull. Emerg. Trauma 2018, 6, 181–194. [Google Scholar] [CrossRef] [PubMed]
- Bank, M.; Gibbs, K.; Sison, C.; Kutub, N.; Papatheodorou, A.; Lee, S.; Stein, A.; Bloom, O. Age and Other Risk Factors Influencing Long-Term Mortality in Patients With Traumatic Cervical Spine Fracture. Geriatr. Orthop. Surg. Rehabil. 2018, 9, 2151459318770882. [Google Scholar] [CrossRef]
- Raju, B.; Jumah, F.; Ashraf, O.; Narayan, V.; Gupta, G.; Sun, H.; Hilden, P.; Nanda, A. Big Data, Machine Learning, and Artificial Intelligence: A Field Guide for Neurosurgeons. J. Neurosurg. 2020, 135, 373–383. [Google Scholar] [CrossRef] [PubMed]
- Mesbah, S.; Ball, T.; Angeli, C.; Rejc, E.; Dietz, N.; Ugiliweneza, B.; Harkema, S.; Boakye, M. Predictors of Volitional Motor Recovery with Epidural Stimulation in Individuals with Chronic Spinal Cord Injury. Brain A J. Neurol. 2021, 144, 420–433. [Google Scholar] [CrossRef]
- Jordan, M.I.; Mitchell, T.M. Machine Learning: Trends, Perspectives, and Prospects. Science 2015, 349, 255–260. [Google Scholar] [CrossRef]
- Chang, M.; Canseco, J.A.; Nicholson, K.J.; Patel, N.; Vaccaro, A.R. The Role of Machine Learning in Spine Surgery: The Future Is Now. Front. Surg. 2020, 7, 54. [Google Scholar] [CrossRef]
- Galbusera, F.; Casaroli, G.; Bassani, T. Artificial Intelligence and Machine Learning in Spine Research. JOR Spine 2019, 2, e1044. [Google Scholar] [CrossRef]
- Sliwinski, C.; Nees, T.A.; Puttagunta, R.; Weidner, N.; Blesch, A. Sensorimotor Activity Partially Ameliorates Pain and Reduces Nociceptive Fiber Density in the Chronically Injured Spinal Cord. J. Neurotrauma 2018, 35, 2222–2238. [Google Scholar] [CrossRef]
- Winchester, P.; McColl, R.; Querry, R.; Foreman, N.; Mosby, J.; Tansey, K.; Williamson, J. Changes in Supraspinal Activation Patterns Following Robotic Locomotor Therapy in Motor-Incomplete Spinal Cord Injury. Neurorehabilit. Neural Repair 2005, 19, 313–324. [Google Scholar] [CrossRef]
- Obermeyer, Z.; Emanuel, E.J. Predicting the Future—Big Data, Machine Learning, and Clinical Medicine. N. Engl. J. Med. 2016, 375, 1216–1219. [Google Scholar] [CrossRef] [PubMed]
- Khan, O.; Badhiwala, J.H.; Grasso, G.; Fehlings, M.G. Use of Machine Learning and Artificial Intelligence to Drive Personalized Medicine Approaches for Spine Care. World Neurosurg. 2020, 140, 512–518. [Google Scholar] [CrossRef] [PubMed]
- Dietz, N.; Wagers, S.; Harkema, S.J.; D’Amico, J.M. Intrathecal and Oral Baclofen Use in Adults With Spinal Cord Injury: A Systematic Review of Efficacy in Spasticity Reduction, Functional Changes, Dosing, and Adverse Events. Arch. Phys. Med. Rehabil. 2023, 104, 119–131. [Google Scholar] [CrossRef]
- Ter Wengel, P.V.; Post, M.W.M.; Martin, E.; Stolwijk-Swuste, J.; Hosman, A.J.F.; Sadiqi, S.; Vandertop, W.P.; Öner, F.C. Neurological Recovery after Traumatic Spinal Cord Injury: What Is Meaningful? A Patients’ and Physicians’ Perspective. Spinal Cord 2020, 58, 865–872. [Google Scholar] [CrossRef] [PubMed]
- Higgins, J.P.T.; Altman, D.G. Assessing Risk of Bias in Included Studies. In Cochrane Handbook for Systematic Reviews of Interventions; Wiley: Hoboken, NJ, USA, 2008; pp. 187–241. ISBN 9780470712184. [Google Scholar]
- Stang, A. Critical Evaluation of the Newcastle-Ottawa Scale for the Assessment of the Quality of Nonrandomized Studies in Meta-Analyses. Eur. J. Epidemiol. 2010, 25, 603–605. [Google Scholar] [CrossRef] [PubMed]
- Hornby, T.G.; Campbell, D.D.; Zemon, D.H.; Kahn, J.H. Clinical and Quantitative Evaluation of Robotic-Assisted Treadmill Walking to Retrain Ambulation after Spinal Cord Injury. Top. Spinal Cord Inj. Rehabil. 2005, 11, 1–17. [Google Scholar] [CrossRef]
- Wirz, M.; Zemon, D.H.; Rupp, R.; Scheel, A.; Colombo, G.; Dietz, V.; Hornby, T.G. Effectiveness of Automated Locomotor Training in Patients with Chronic Incomplete Spinal Cord Injury: A Multicenter Trial. Arch. Phys. Med. Rehabil. 2005, 86, 672–680. [Google Scholar] [CrossRef] [PubMed]
- Field-Fote, E.C.; Roach, K.E. Influence of a Locomotor Training Approach on Walking Speed and Distance in People with Chronic Spinal Cord Injury: A Randomized Clinical Trial. Phys. Ther. 2011, 91, 48–60. [Google Scholar] [CrossRef] [PubMed]
- Alcobendas-Maestro, M.; Esclarín-Ruz, A.; Casado-López, R.M.; Muñoz-González, A.; Pérez-Mateos, G.; González-Valdizán, E.; Martín, J.L.R. Lokomat Robotic-Assisted Versus Overground Training Within 3 to 6 Months of Incomplete Spinal Cord Lesion: Randomized Controlled Trial. Neurorehabilit. Neural Repair 2012, 26, 1058–1063. [Google Scholar] [CrossRef]
- Aach, M.; Cruciger, O.; Sczesny-Kaiser, M.; Höffken, O.; Meindl, R.C.; Tegenthoff, M.; Schwenkreis, P.; Sankai, Y.; Schildhauer, T.A. Voluntary Driven Exoskeleton as a New Tool for Rehabilitation in Chronic Spinal Cord Injury: A Pilot Study. Spine J. Off. J. North Am. Spine Soc. 2014, 14, 2847–2853. [Google Scholar] [CrossRef]
- Del-Ama, A.J.; Gil-Agudo, Á.; Pons, J.L.; Moreno, J.C. Hybrid Gait Training with an Overground Robot for People with Incomplete Spinal Cord Injury: A Pilot Study. Front. Hum. Neurosci. 2014, 8, 298. [Google Scholar] [CrossRef] [PubMed]
- Labruyère, R.; Van Hedel, H.J.A. Strength Training versus Robot-Assisted Gait Training after Incomplete Spinal Cord Injury: A Randomized Pilot Study in Patients Depending on Walking Assistance. J. NeuroEngineering Rehabil. 2014, 11, 4. [Google Scholar] [CrossRef]
- Niu, X.; Varoqui, D.; Kindig, M.; Mirbagheri, M.M. Prediction of Gait Recovery in Spinal Cord Injured Individuals Trained with Robotic Gait Orthosis. J. Neuroeng. Rehabil. 2014, 11, 42. [Google Scholar] [CrossRef]
- Shin, J.C.; Kim, J.Y.; Park, H.K.; Kim, N.Y. Effect of Robotic-Assisted Gait Training in Patients with Incomplete Spinal Cord Injury. Ann. Rehabil. Med. 2014, 38, 719–725. [Google Scholar] [CrossRef]
- Varoqui, D.; Niu, X.; Mirbagheri, M.M. Ankle Voluntary Movement Enhancement Following Robotic-Assisted Locomotor Training in Spinal Cord Injury. J. Neuroeng. Rehabil. 2014, 11, 46. [Google Scholar] [CrossRef]
- Duffell, L.D.; Brown, G.L.; Mirbagheri, M.M. Interventions to Reduce Spasticity and Improve Function in People With Chronic Incomplete Spinal Cord Injury: Distinctions Revealed by Different Analytical Methods. Neurorehabilit. Neural Repair 2015, 29, 566–576. [Google Scholar] [CrossRef]
- Lam, T.; Pauhl, K.; Ferguson, A.; Malik, R.N.; Krassioukov, A.; Eng, J.J. Training with Robot-Applied Resistance in People with Motor-Incomplete Spinal Cord Injury: Pilot Study. J. Rehabil. Res. Dev. 2015, 52, 113–129. [Google Scholar] [CrossRef]
- Stampacchia, G.; Rustici, A.; Bigazzi, S.; Gerini, A.; Tombini, T.; Mazzoleni, S. Walking with a Powered Robotic Exoskeleton: Subjective Experience, Spasticity and Pain in Spinal Cord Injured Persons. NeuroRehabilitation 2016, 39, 277–283. [Google Scholar] [CrossRef] [PubMed]
- Mazzoleni, S.; Battini, E.; Rustici, A.; Stampacchia, G. An Integrated Gait Rehabilitation Training Based on Functional Electrical Stimulation Cycling and Overground Robotic Exoskeleton in Complete Spinal Cord Injury Patients: Preliminary Results. In Proceedings of the 2017 International Conference on Rehabilitation Robotics (ICORR), London, UK, 17–20 July 2017; IEEE: Piscataway, NJ, USA; pp. 289–293. [Google Scholar] [CrossRef]
- Watanabe, H.; Marushima, A.; Kawamoto, H.; Kadone, H.; Ueno, T.; Shimizu, Y.; Endo, A.; Hada, Y.; Saotome, K.; Abe, T.; et al. Intensive Gait Treatment Using a Robot Suit Hybrid Assistive Limb in Acute Spinal Cord Infarction: Report of Two Cases. J. Spinal Cord Med. 2019, 42, 395–401. [Google Scholar] [CrossRef]
- Wirz, M.; MacH, O.; Maier, D.; Benito-Penalva, J.; Taylor, J.; Esclarin, A.; DIetz, V. Effectiveness of Automated Locomotor Training in Patients with Acute Incomplete Spinal Cord Injury: A Randomized, Controlled, Multicenter Trial. J. Neurotrauma 2017, 34, 1891–1896. [Google Scholar] [CrossRef] [PubMed]
- DeVries, Z.; Hoda, M.; Rivers, C.S.; Maher, A.; Wai, E.; Moravek, D.; Stratton, A.; Kingwell, S.; Fallah, N.; Paquet, J.; et al. Development of an Unsupervised Machine Learning Algorithm for the Prognostication of Walking Ability in Spinal Cord Injury Patients. Spine J. 2020, 20, 213–224. [Google Scholar] [CrossRef] [PubMed]
- Torres-Espín, A.; Haefeli, J.; Ehsanian, R.; Torres, D.; Almeida, C.A.; Huie, J.R.; Chou, A.; Morozov, D.; Sanderson, N.; Dirlikov, B.; et al. Topological Network Analysis of Patient Similarity for Precision Management of Acute Blood Pressure in Spinal Cord Injury. eLife 2021, 10, e68015. [Google Scholar] [CrossRef]
- Agarwal, N.; Aabedi, A.A.; Torres-Espin, A.; Chou, A.; Wozny, T.A.; Mummaneni, P.V.; Burke, J.F.; Ferguson, A.R.; Kyritsis, N.; Dhall, S.S.; et al. Decision Tree–Based Machine Learning Analysis of Intraoperative Vasopressor Use to Optimize Neurological Improvement in Acute Spinal Cord Injury. Neurosurg. Focus 2022, 52, E9. [Google Scholar] [CrossRef]
- Chay, W.; Kirshblum, S. Predicting Outcomes After Spinal Cord Injury. Phys. Med. Rehabil. Clin. 2020, 31, 331–343. [Google Scholar] [CrossRef]
- Burns, A.S.; Marino, R.J.; Flanders, A.E.; Flett, H. Clinical Diagnosis and Prognosis Following Spinal Cord Injury. In Handbook of Clinical Neurology; Elsevier: Amsterdam, The Netherlands, 2012; Volume 109, pp. 47–62. [Google Scholar] [CrossRef]
- Okimatsu, S.; Maki, S.; Furuya, T.; Fujiyoshi, T.; Kitamura, M.; Inada, T.; Aramomi, M.; Yamauchi, T.; Miyamoto, T.; Inoue, T.; et al. Determining the Short-Term Neurological Prognosis for Acute Cervical Spinal Cord Injury Using Machine Learning. J. Clin. Neurosci. 2022, 96, 74–79. [Google Scholar] [CrossRef] [PubMed]
- Inoue, T.; Ichikawa, D.; Ueno, T.; Cheong, M.; Inoue, T.; Whetstone, W.D.; Endo, T.; Nizuma, K.; Tominaga, T. XGBoost, a Machine Learning Method, Predicts Neurological Recovery in Patients with Cervical Spinal Cord Injury. Neurotrauma Rep. 2020, 1, 8–16. [Google Scholar] [CrossRef] [PubMed]
- Chou, A.; Torres-Espin, A.; Kyritsis, N.; Huie, J.R.; Khatry, S.; Funk, J.; Hay, J.; Lofgreen, A.; Shah, R.; McCann, C.; et al. Expert-Augmented Automated Machine Learning Optimizes Hemodynamic Predictors of Spinal Cord Injury Outcome. PLoS ONE 2022, 17, e0265254. [Google Scholar] [CrossRef] [PubMed]
- Fan, G.; Liu, H.; Yang, S.; Luo, L.; Wang, L.; Pang, M.; Liu, B.; Zhang, L.; Han, L.; Rong, L. Discharge Prediction of Critical Patients with Spinal Cord Injury: A Machine Learning Study with 1485 Cases 2021. medRxiv 2021. [CrossRef]
- Buri, M.; Tanadini, L.G.; Hothorn, T.; Curt, A. Unbiased Recursive Partitioning Enables Robust and Reliable Outcome Prediction in Acute Spinal Cord Injury. J. Neurotrauma 2022, 39, 266–276. [Google Scholar] [CrossRef] [PubMed]
- Dietz, V.; Sinkjaer, T. Spasticity. In Handbook of Clinical Neurology; Elsevier: Amsterdam, The Netherlands, 2012; Volume 109, pp. 197–211. [Google Scholar] [CrossRef]
- Barbeau, H.; Danakas, M.; Arsenault, B. The Effects of Locomotor Training in Spinal Cord Injured Subjects: A Preliminary Study. Restor. Neurol. Neurosci. 1993, 5, 81–84. [Google Scholar] [CrossRef] [PubMed]


| Author, Year | Country | Total Sample (TS) | Study Design | Intervention | Outcome | Level of Injury | NOS |
|---|---|---|---|---|---|---|---|
| Hornby 2005 [22] | USA | 30 | RCT | The utilization of robotic assistance in BWSTT and therapist-assisted BWSTT. The intervention involved engaging in overground ambulation via a mobile suspension device for three 30 min weekly sessions over 8 weeks. | LEMS, 6MWT | AIS B, C, and D. The level of damage is located above the tenth thoracic vertebra (T10). | - |
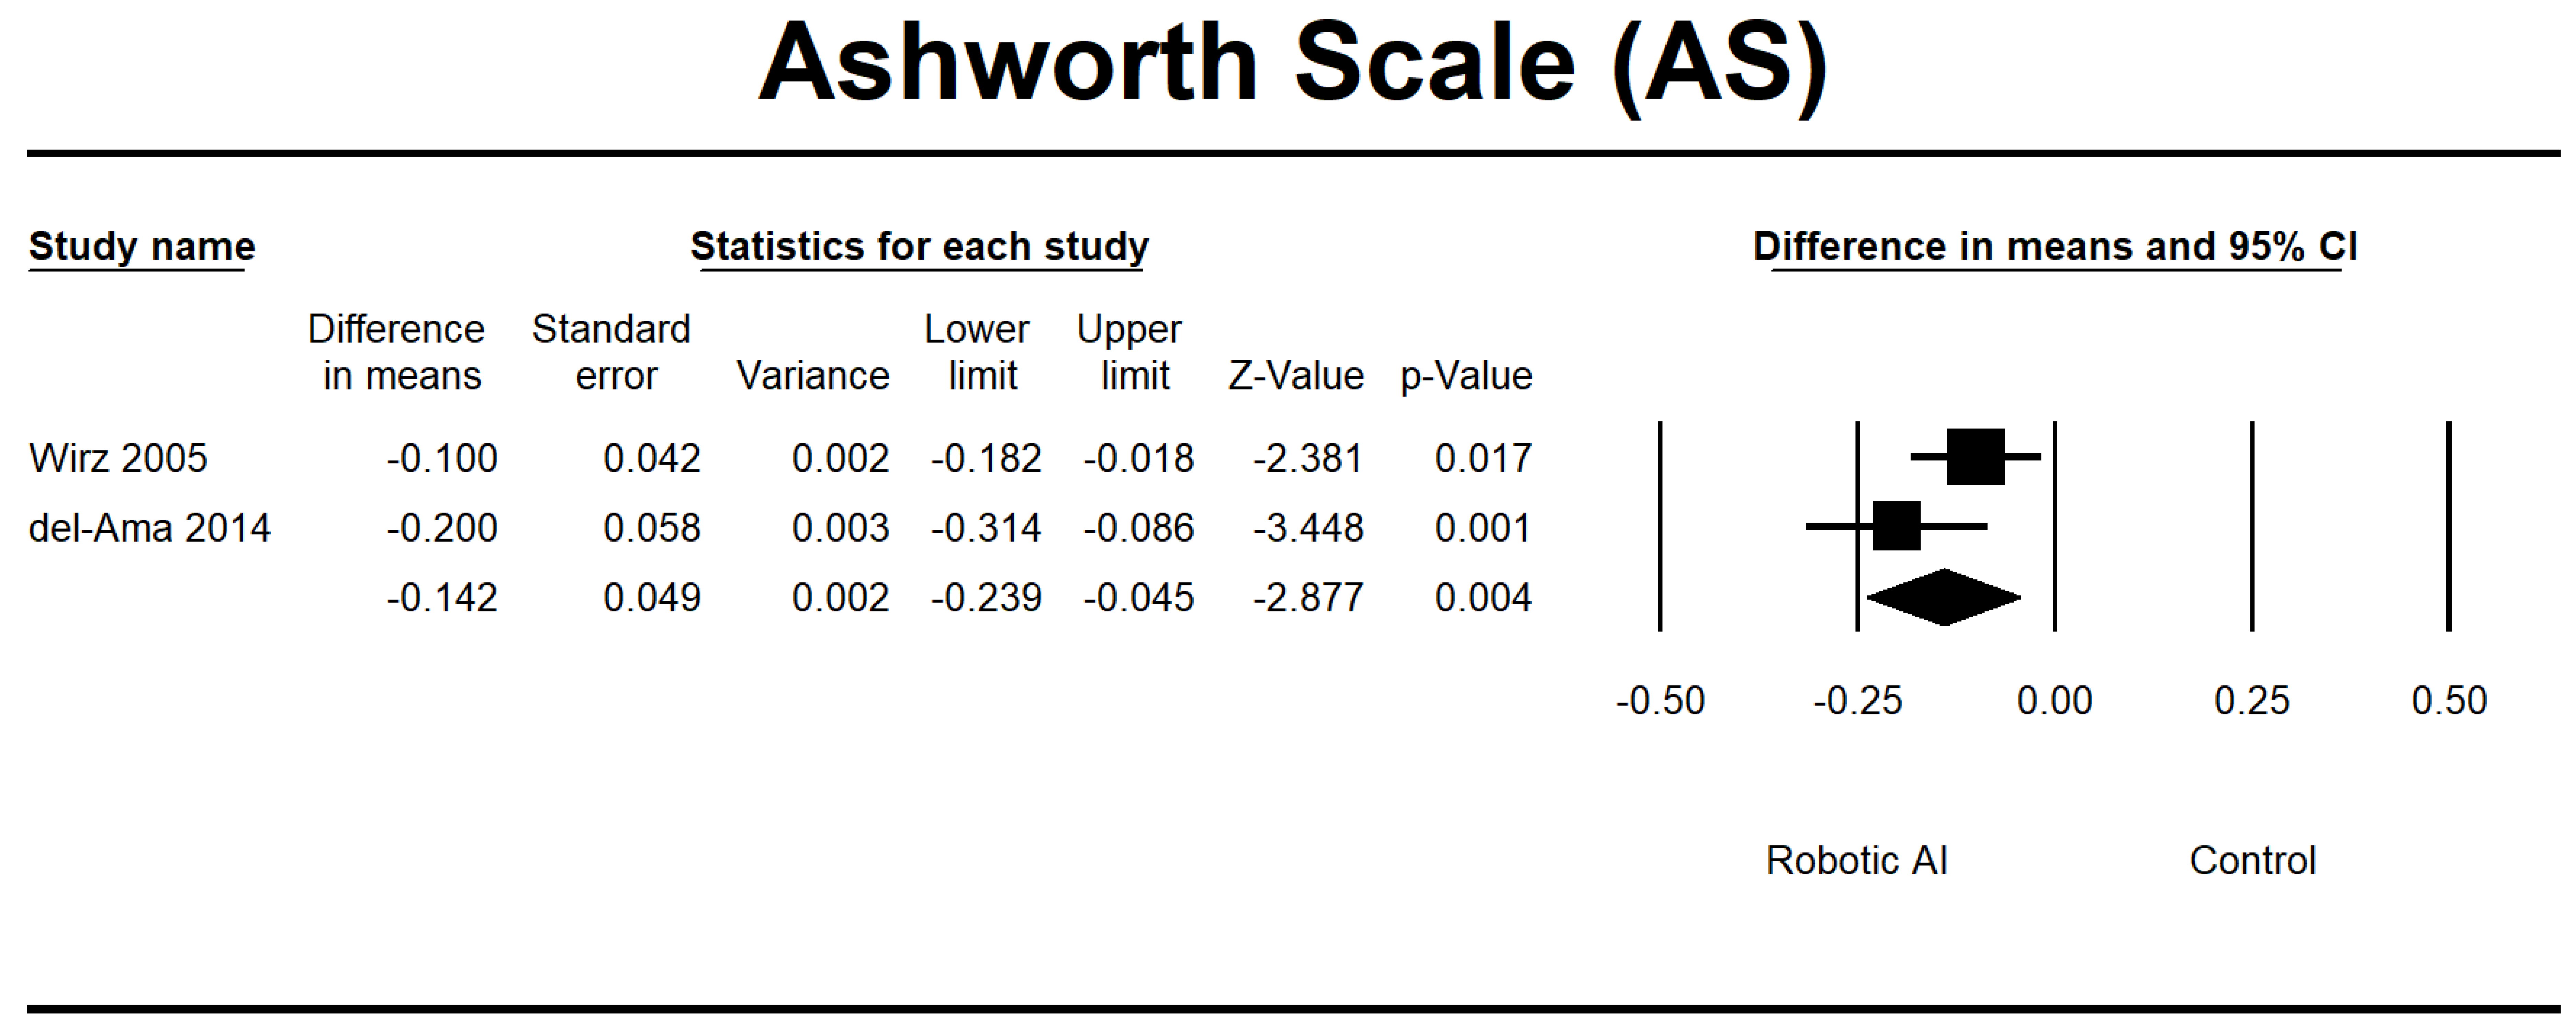
| Wirz 2005 [23] | USA | 20 | Single group | The Lokomat (DGO) intervention consisted of an 8 week duration, with participants attending three to five sessions per week, each lasting 45 min. | AS, LEMS, 6MWT, 10MWT, and TUG | AIS C and D. The level of injury is at L1 or above. | 7 |
| Field 2011 [24] | USA | 64 | RCT | The participants engaged in a training regimen for 12 weeks, with a frequency of 5 days per week. The training program encompassed four distinct modalities, namely treadmill-based training with manual help (TM), treadmill-based training with stimulation (TS), overground training with motivation (OG), and treadmill-based training with robotic assistance (LR). | LEMS | AIS C and D. The level of damage is located at or above the tenth thoracic vertebra (T10). | - |
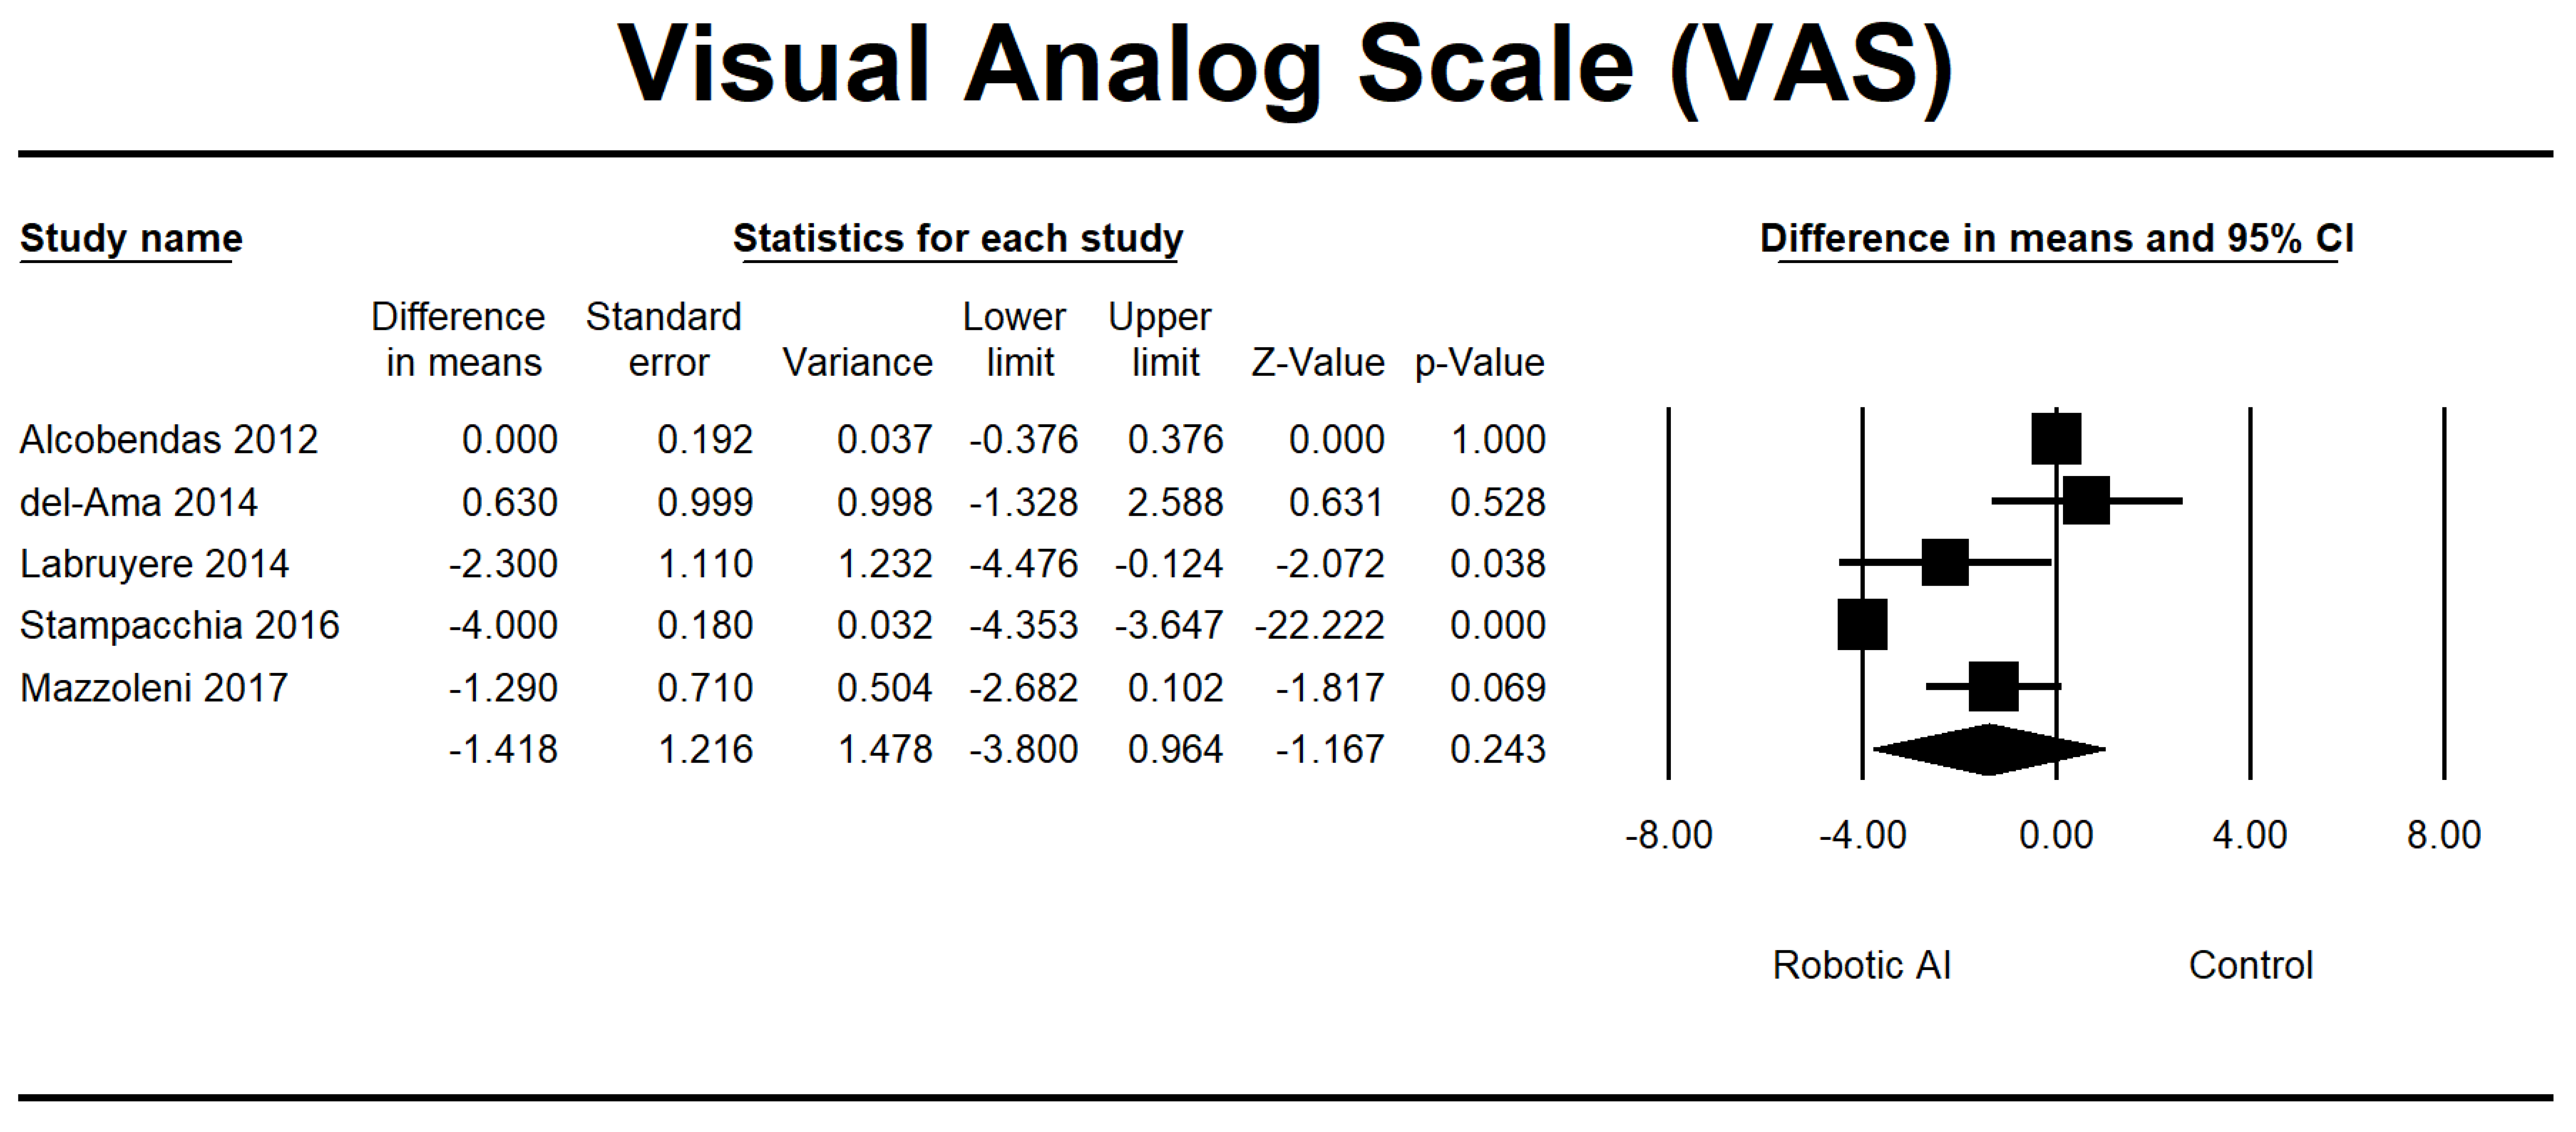
| Alcobendas 2012 [25] | Spain | 75 | RCT | The study consisted of a total of 40 sessions conducted over 8 weeks. Each session lasted for approximately 1 h and involved a Lokomat group intervention. Specifically, participants spent 30 min utilizing the Lokomat device within each session, followed by an additional 30 min of normal physical treatment. The overground group implemented a standardized biological treatment protocol for one hour. | VAS, LEMS, 6MWT, and 10MWT | AIS C and D. The range of injuries observed in the individual spans from the second cervical vertebra (C2) to the twelfth thoracic vertebra (T12). | - |
| Aach 2014 [26] | Germany | 8 | Pre-post experimental design | HAL had been used for 90 days, with a frequency of five weekly sessions. | LEMS, 6MWT, 10MWT, and TUG | ASIA A. Degree of damage: T8 to L2 | 7 |
| del-Ama 2014 [27] | Switzerland | 3 | Pilot study | The Kinesis system was implemented during the first week, whereas no intervention was delivered the following week. | AS, VAS, 6MWT, and 10MWT | AIS A and D. Injuries impact the spinal levels encompassing L1 and L2. | 8 |
| Labruyère 2014 [28] | Switzerland | 9 | RCT | The first group underwent 16 sessions of RAGT using the Lokomat device, followed by an additional 16 strength training sessions. Group 2 received the intervention in reverse order. | VAS, LEMS, and 10MWT | AIS C and D. The extent of the injury ranges from the fourth cervical vertebra (C4) to the eleventh thoracic vertebra (T11). | - |
| Niu 2014 [29] | USA | 40 | RCT | The experimental group underwent twelve 1 h Lokomat training sessions over one month, whereas the control group did not receive any interventions. | TUG | AIS B, C, and D. The level of damage is located above the tenth thoracic vertebra (T10). | - |
| Shin 2014 [30] | South Korea | 53 | RCT | In four weeks, the RAGT group received three 40 min sessions per week of RAGT in addition to regular physiotherapy. The conventional group received physiotherapy twice daily, five days per week. | LEMS | AIS D. The level of injury is classified as upper motor neuron (UMN) involvement. | - |
| Varoqui 2014 [31] | USA | 30 | RCT | The Lokomat group participated in three weekly sessions for four weeks, each lasting one hour. The control group, on the other hand, did not receive any intervention. | 6MWT, 10MWT, TUG | AIS C and D. The level of damage is located above the tenth thoracic vertebra (T10). | - |
| Duffell 2015 [32] | USA | 56 | RCT | The study involved allocating participants with an incomplete SCI into three groups: a control group receiving no intervention, a group receiving Lokomat intervention, and a group receiving tizanidine intervention. | TUG | AIS C and D The level of damage is located above the tenth thoracic vertebra (T10). | - |
| Lam 2015 [33] | Canada | 15 | RCT | The Lokomat-assisted BWSTT intervention was conducted for 45 min, three times a week, for three months. | 6MWT, 10MWT | AIS C and D. Exclusion criteria encompassed individuals with lower motoneuron damage or lesion levels than T11. | - |
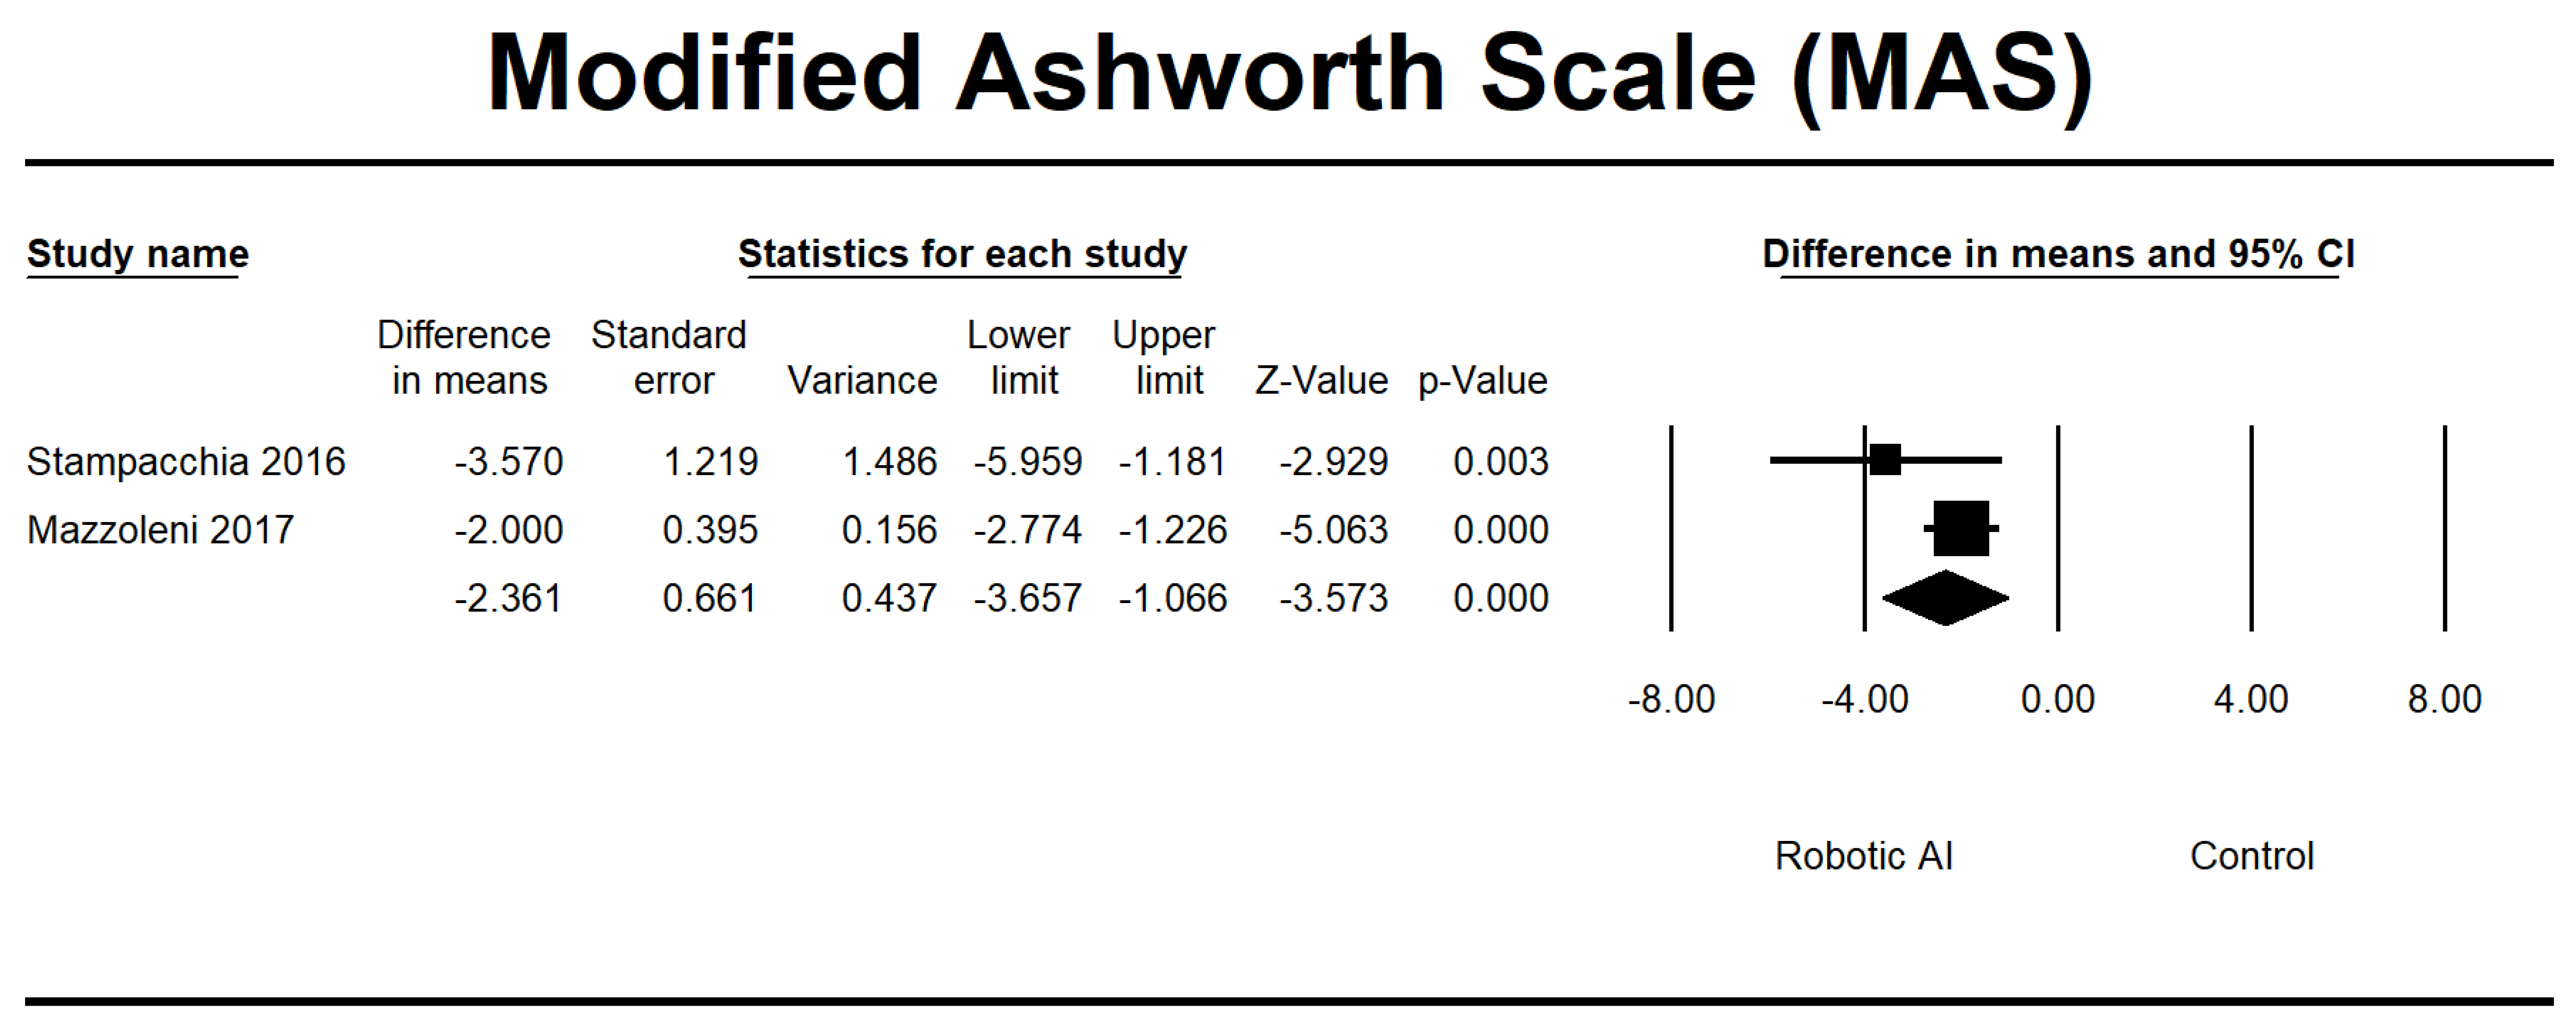
| Stampacchia 2016 [34] | Italy | 21 | Single group | The robotic exoskeleton (Ekso GT) exercise lasted approximately 40 min. | MAS, VAS | AIS A, B, and D. The observed lesions were located at the low cervical level (C7), dorsal level, and high lumbar level (L1–L2). | 7 |
| Mazzoleni 2017 [35] | Italy | 7 | Single group | The study consisted of 20 sessions, with a frequency of three sessions per week. The first set of sessions utilized a FES cycling system called Pegaso. It was followed by another group of 20 sessions, again with a frequency of three sessions per week, where participants used an overground robotic exoskeleton called the Ekso GT. | MAS, VAS, 6MWT, 10MWT, and TUG | AIS A. Injury severity: T4–T12 | 7 |
| Watanabe 2019 [36] | Japan | 2 | Case report | HAL has been used 3–4 times weekly for eight sessions. It is performed with regular physical therapy, each lasting approximately 20–30 min. | MAS, LEMS | AIS C and D Injury severity: T8–T10, L1 | 7 |
| Wirz 2017 [37] | USA | 21 | RCT | The intervention group received a training duration of 50 min per session, while the control group had a training duration of 25 min per session using the Lokomat device. Both groups underwent training sessions 3–5 days per week for a total period of 8 weeks. | 10MWT | AIS B and C. C4 to T12 are affected. | - |
| Author, Year | Country | Total Sample (TS) | Study Design | Intervention | Outcome | AIS Grade | NOS |
|---|---|---|---|---|---|---|---|
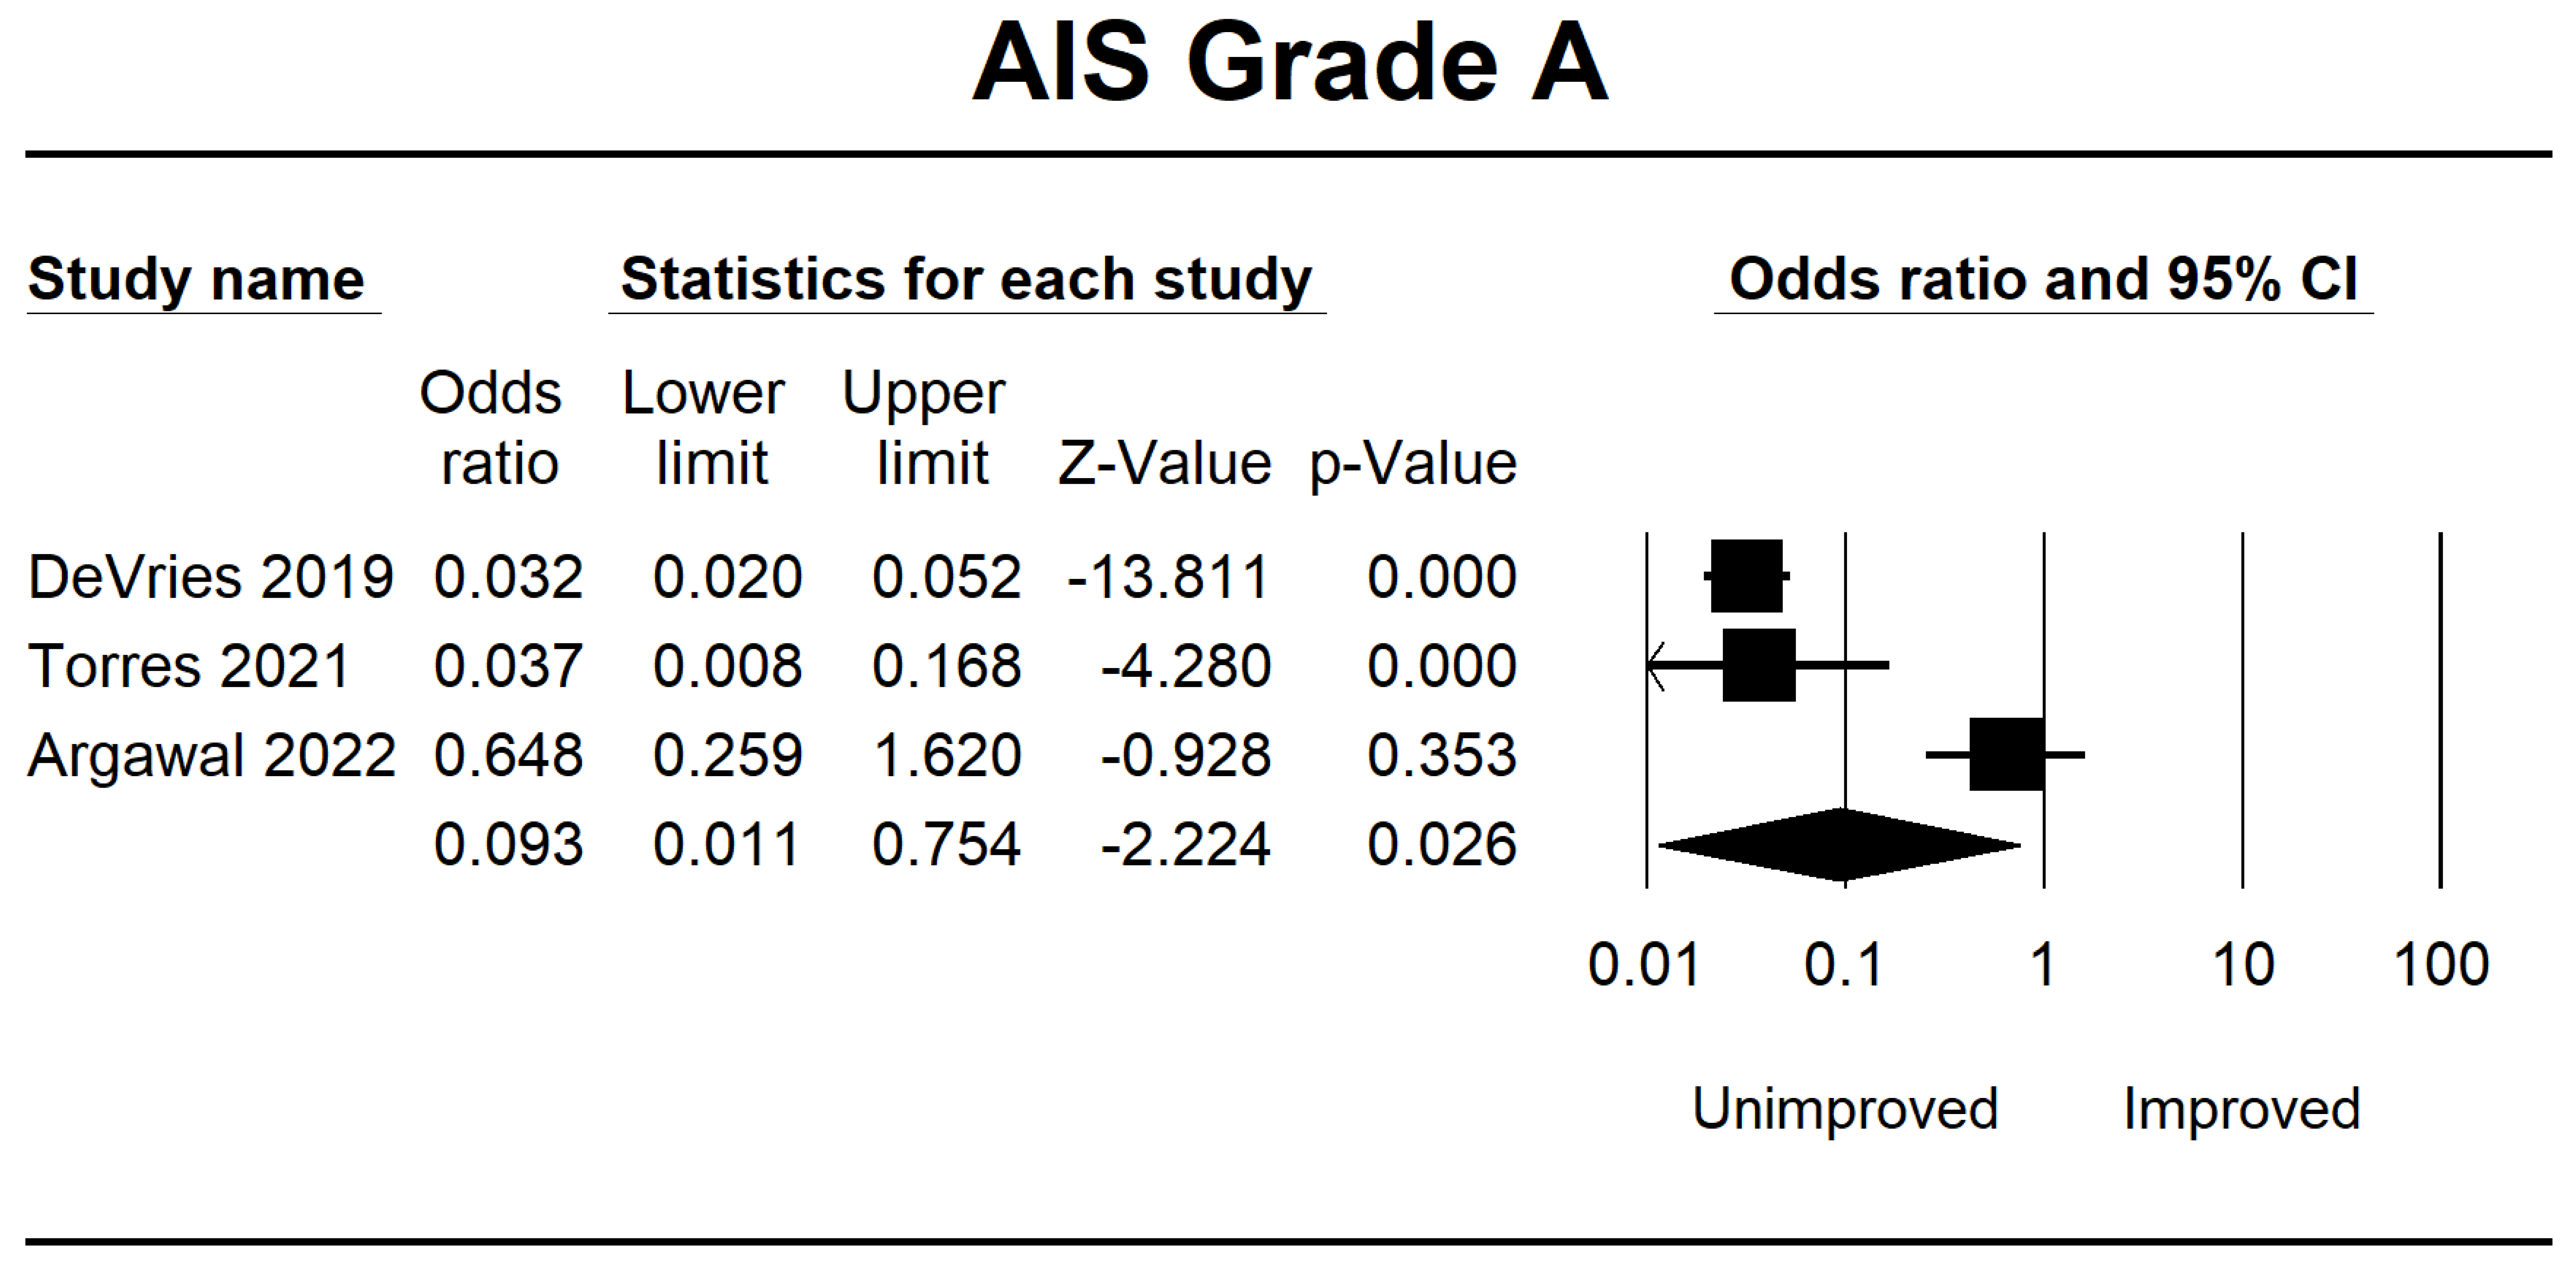
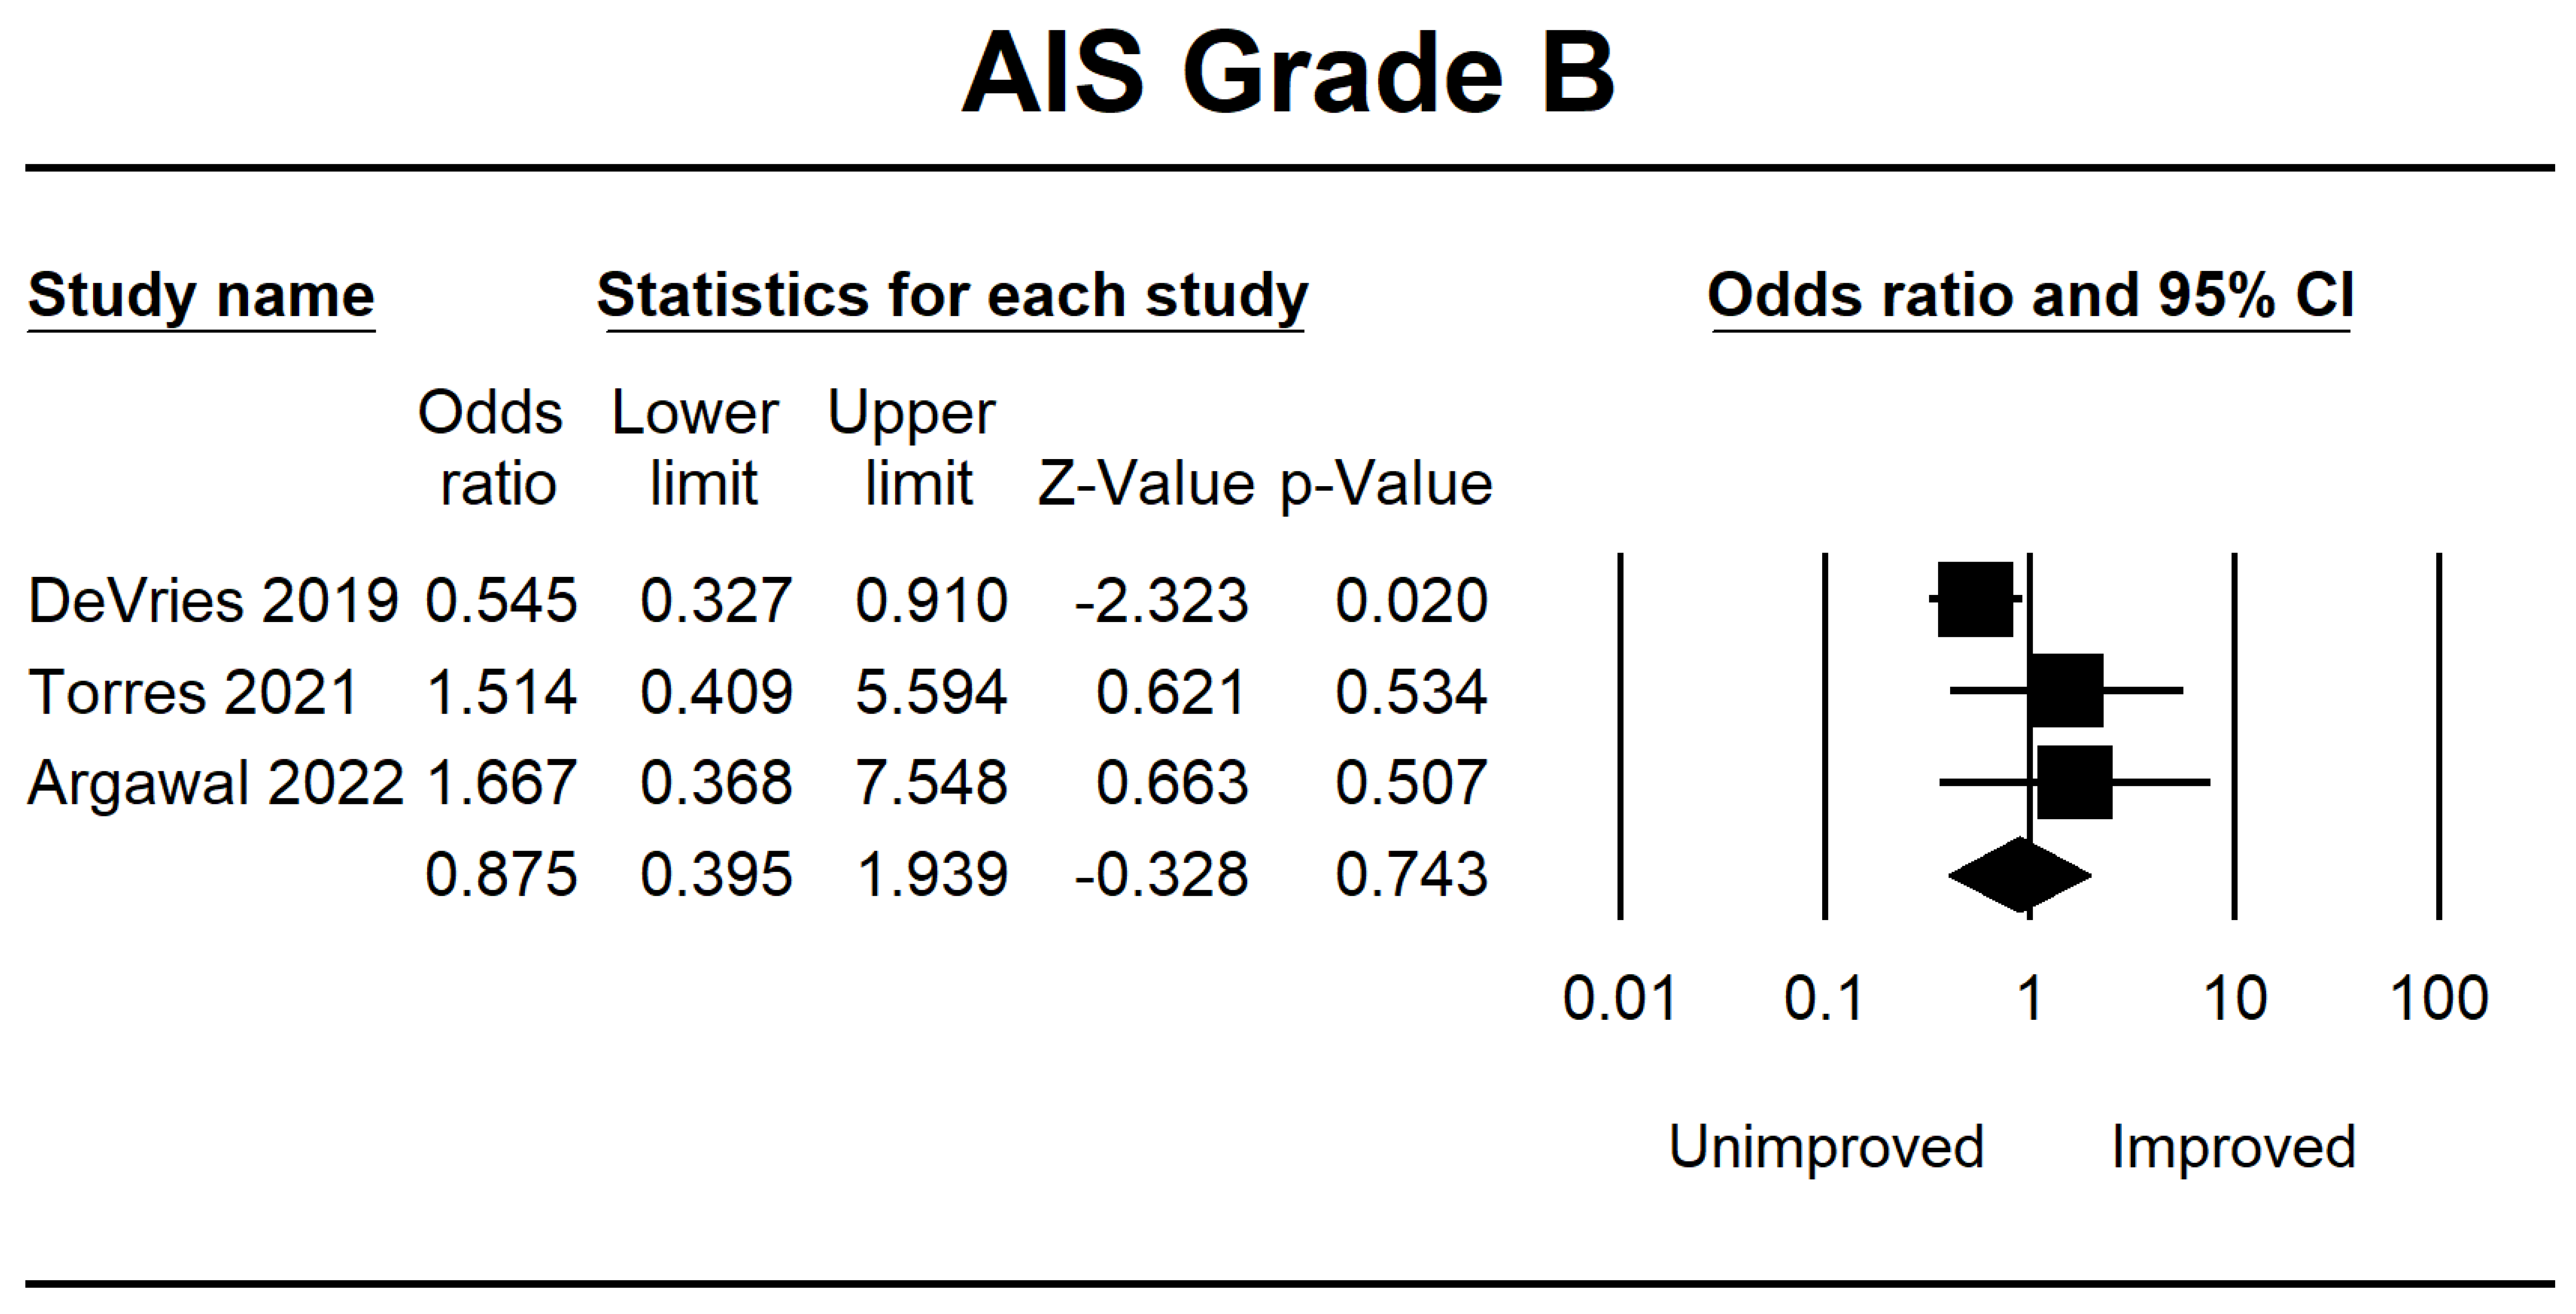
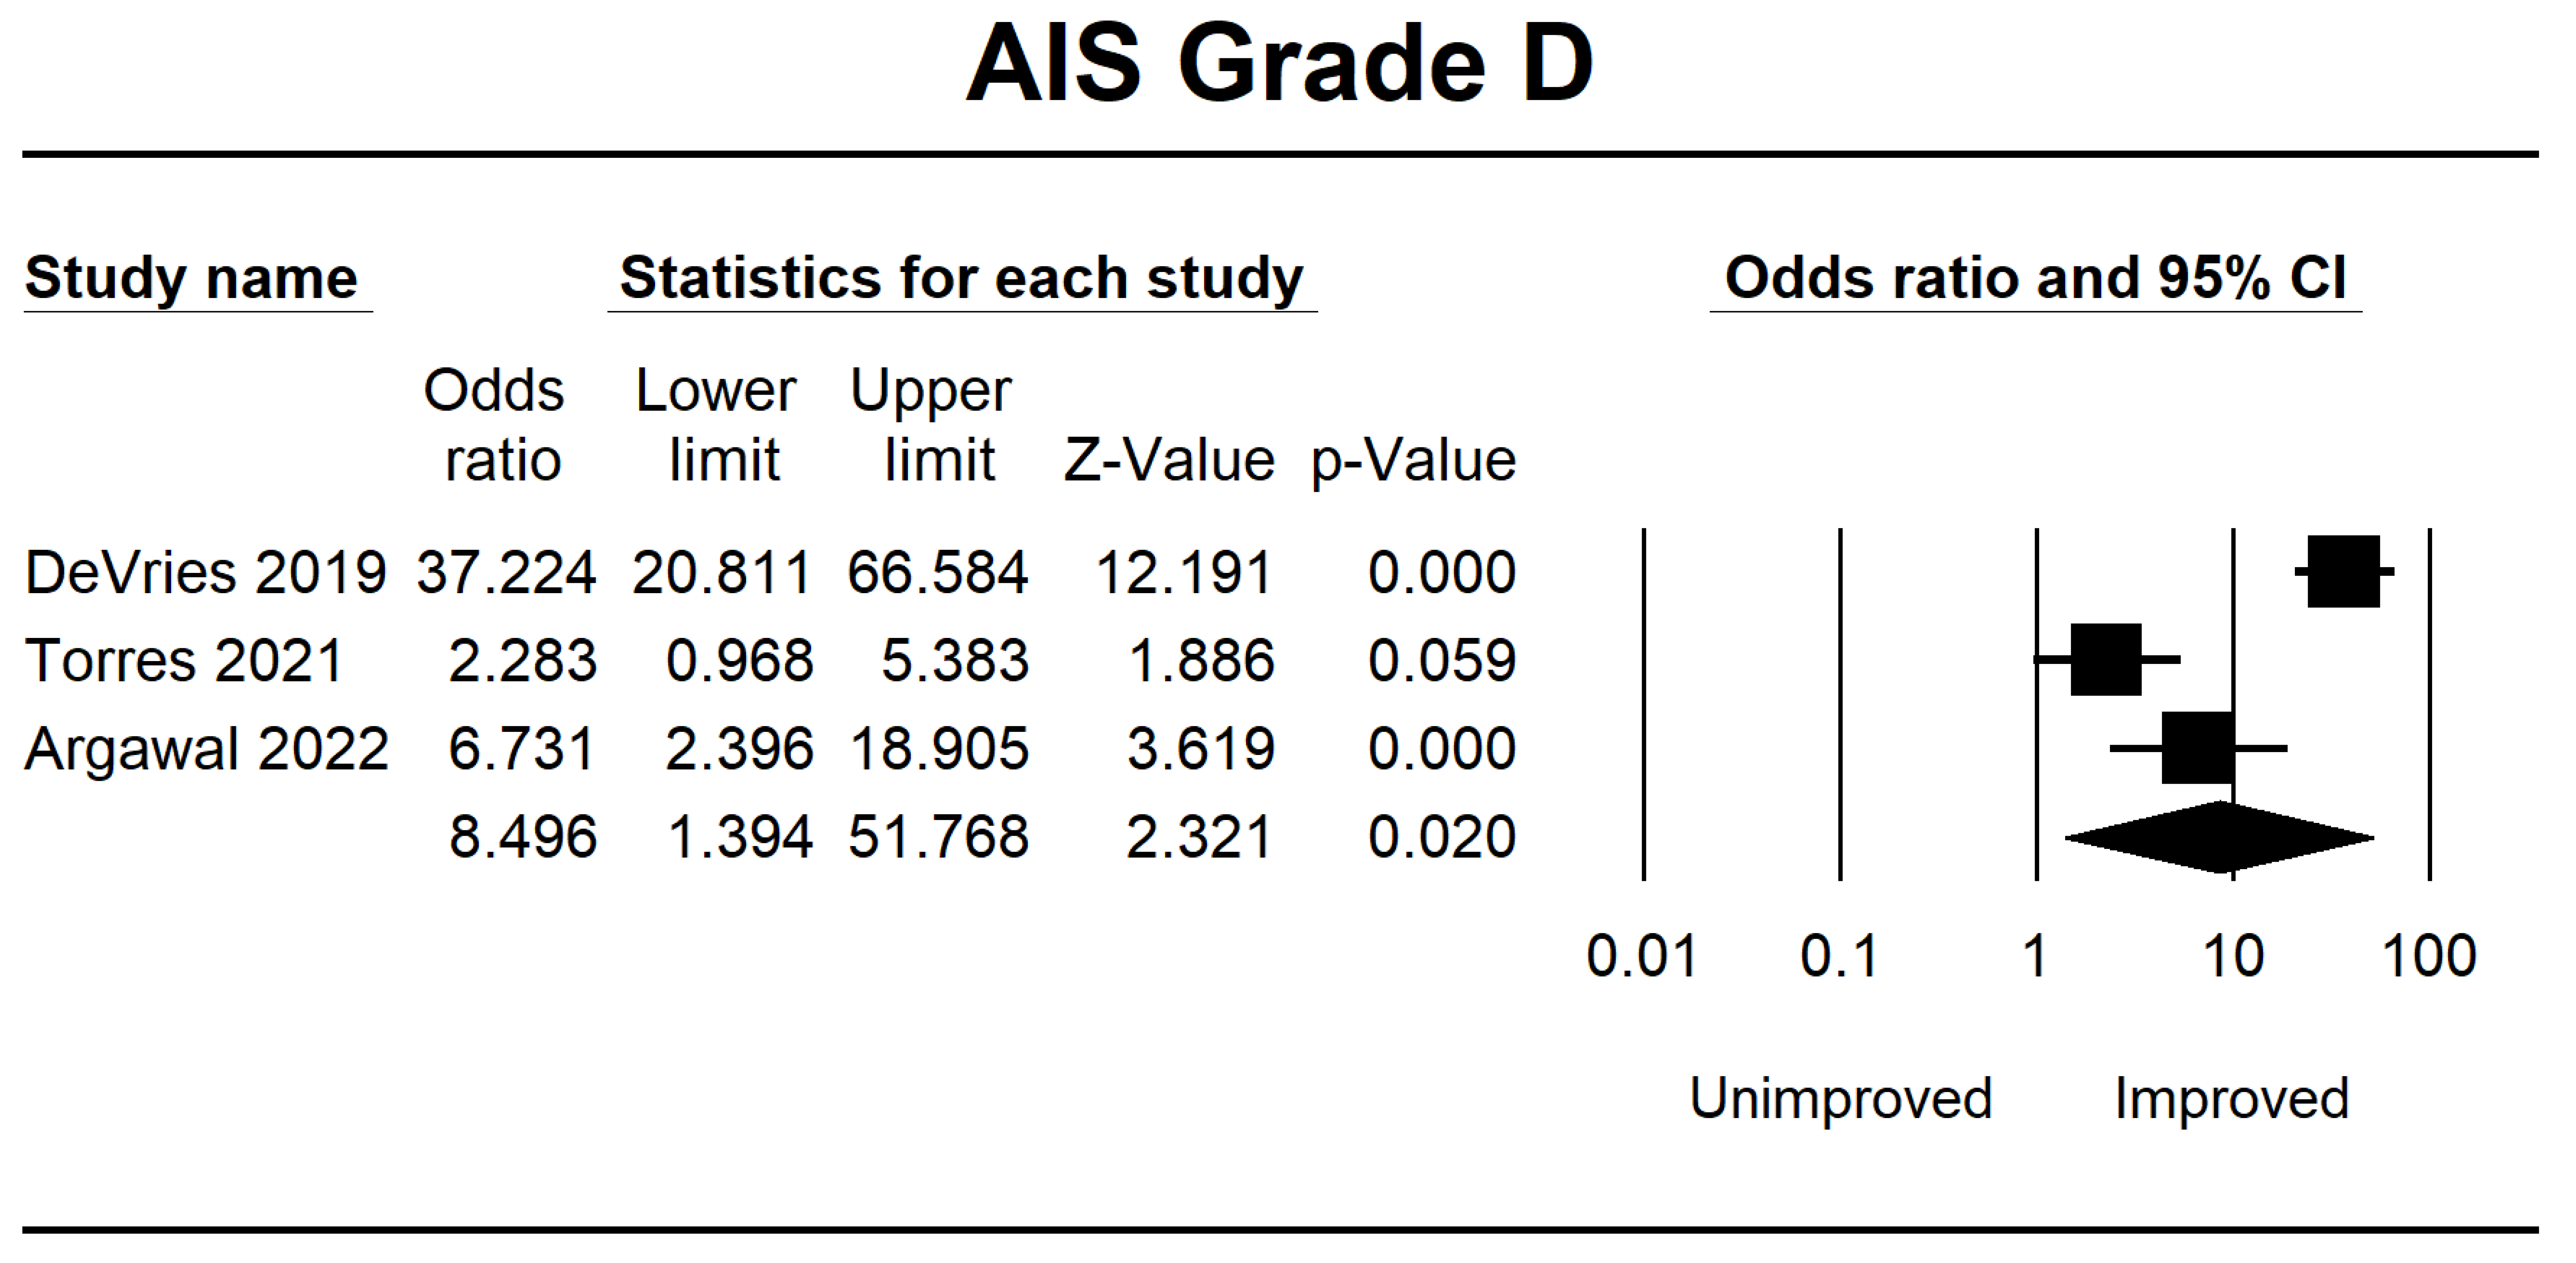
| DeVries 2019 [38] | Canada | 862 | Retrospective | The comparison of unsupervised MLA and LR, utilizing comprehensive neurological data for total admission, did not reveal any clinically significant disparities in functional prediction compared to previous models. | The F1-score has been demonstrated to possess greater reliability in evaluating algorithms than the area under the operating curve. | AIS A, B, C, and D | 8 |
| Torres 2021 [39] | USA | 118 | Retrospective | A similar network has been developed among patients to predict neurological recovery following spinal cord damage, focusing on MAP recorded before surgery. | The findings from the network analysis indicate that deviations from the optimal MAP range, either in the form of hypotension or hypertension, during surgical procedures are correlated with a reduced probability of achieving neurological recovery. | AIS A, B, C, D, and E | 8 |
| Agarwal 2022 [40] | USA | 74 | Retrospective | This study uses a deep-tree-based machine learning approach to evaluate the impact of intraoperative MAP and vasopressor administration on enhancing neurological outcomes in individuals with acute spinal cord injury. | An association between a MAP ranging from 80 to 96 mmHg and enhanced neurological function has been observed. Conversely, 93 min or more spent outside the MAP range of 76 to 104 mmHg had been associated with a worse outcome. | AIS A, B, C, D, and E | 7 |
Disclaimer/Publisher’s Note: The statements, opinions and data contained in all publications are solely those of the individual author(s) and contributor(s) and not of MDPI and/or the editor(s). MDPI and/or the editor(s) disclaim responsibility for any injury to people or property resulting from any ideas, methods, instructions or products referred to in the content. |
© 2023 by the authors. Licensee MDPI, Basel, Switzerland. This article is an open access article distributed under the terms and conditions of the Creative Commons Attribution (CC BY) license (https://creativecommons.org/licenses/by/4.0/).
Share and Cite
Wardhana, D.P.W.; Maliawan, S.; Mahadewa, T.G.B.; Rosyidi, R.M.; Wiranata, S. The Impact of Machine Learning and Robot-Assisted Gait Training on Spinal Cord Injury: A Systematic Review and Meta-Analysis. J. Clin. Med. 2023, 12, 7230. https://doi.org/10.3390/jcm12237230
Wardhana DPW, Maliawan S, Mahadewa TGB, Rosyidi RM, Wiranata S. The Impact of Machine Learning and Robot-Assisted Gait Training on Spinal Cord Injury: A Systematic Review and Meta-Analysis. Journal of Clinical Medicine. 2023; 12(23):7230. https://doi.org/10.3390/jcm12237230
Chicago/Turabian StyleWardhana, Dewa Putu Wisnu, Sri Maliawan, Tjokorda Gde Bagus Mahadewa, Rohadi Muhammad Rosyidi, and Sinta Wiranata. 2023. "The Impact of Machine Learning and Robot-Assisted Gait Training on Spinal Cord Injury: A Systematic Review and Meta-Analysis" Journal of Clinical Medicine 12, no. 23: 7230. https://doi.org/10.3390/jcm12237230
APA StyleWardhana, D. P. W., Maliawan, S., Mahadewa, T. G. B., Rosyidi, R. M., & Wiranata, S. (2023). The Impact of Machine Learning and Robot-Assisted Gait Training on Spinal Cord Injury: A Systematic Review and Meta-Analysis. Journal of Clinical Medicine, 12(23), 7230. https://doi.org/10.3390/jcm12237230