

Cognitive Profile Discrepancies among Typical University Students and Those with Dyslexia and Mixed-Type Learning Disorder

 , , , ,
Abstract
:1. Introduction
2. Materials and Methods
2.1. Participants
2.2. Procedure and Measure
2.3. Statistical Analysis
3. Results
4. Discussion
5. Conclusions
Author Contributions
Funding
Institutional Review Board Statement
Informed Consent Statement
Data Availability Statement
Acknowledgments
Conflicts of Interest
References
- American Psychiatric Association. DSM-5. Diagnostic and Statistical Manual of Mental Disorders, 5th ed.; American Psychiatric Association: Washington, DC, USA, 2013. [Google Scholar]
- World Health Organization. International Statistical Classification of Diseases and Related Health Problems (ICD), 10th Revision; World Health Organization: Geneva, Switzerland, 2015. [Google Scholar]
- Ben-Naim, S.; Laslo-Roth, R.; Einav, M.; Biran, H.; Margalit, M. Academic self-efficacy, sense of coherence, hope and tiredness among college students with learnin disabilities. Eur. J. Spec. Needs Educ. 2019, 32, 18–34. [Google Scholar] [CrossRef]
- Matteucci, M.C.; Soncini, A. Self-efficacy and psychological well-being in a sample of Italian university students with and without Specific Learning Disorder. Res. Dev. Disabil. 2021, 110, 103858. [Google Scholar] [CrossRef]
- Stagg, S.D.; Eaton, E.; Sjoblom, A.M. Self-efficacy in undergraduate students with dyslexia: A mixed methods investigation. Br. J. Spec. Educ. 2018, 45, 26–42. [Google Scholar] [CrossRef]
- McGrath, L.M.; Pennington, B.F.; Shanahan, M.A.; Santerre-Lemmon, L.E.; Barnard, H.D.; Willcutt, E.G.; DeFries, J.C.; Olson, R.K. A multiple deficit model of reading disability and attention-deficit/hyperactivity disorder: Searching for shared cognitive deficits. J. Child. Psychol. Psychiatry 2011, 52, 547–557. [Google Scholar] [CrossRef]
- Moll, K.; Göbel, S.M.; Gooch, D.; Landerl, K.; Snowling, M.J. Cognitive risk factors for specific learning disorder: Processing speed, temporal processing, and working memory. J. Learn. Disabil. 2016, 49, 272–281. [Google Scholar] [CrossRef]
- Nergård-Nilssen, T.; Hulme, C. Developmental dyslexia in adults: Behavioural manifestations and cognitive correlates. Dyslexia 2014, 20, 191–207. [Google Scholar] [CrossRef]
- Swanson, H.L.; Siegel, L. Learning disabilities as a working memory deficit. Exp. Psychol. 2011, 49, 5–28. [Google Scholar]
- Willcutt, E.G.; Petrill, S.A.; Wu, S.; Boada, R.; DeFries, J.C.; Olson, R.K.; Pennington, B.F. Comorbidity between reading disability and math disability: Concurrent psychopathology, functional impairment, and neuropsychological functioning. J. Learn. Disabil. 2013, 46, 500–516. [Google Scholar] [CrossRef]
- Benassi, E.; Bello, A.; Camia, M.; Scorza, M. Quality of life and its relationship to maternal experience and resilience during COVID-19 lockdown in children with specific learning disabilities. Eur. J. Spec. Needs Educ. 2022, 37, 632–647. [Google Scholar] [CrossRef]
- Camia, M.; Benassi, E.; Giovagnoli, S.; Scorza, M. Specific learning disorders in young adults: Investigating pragmatic abilities and their relationship with theory of mind, executive functions and quality of life. Res. Dev. Disabil. 2022, 126, 104253. [Google Scholar] [CrossRef]
- Giovagnoli, S.; Mandolesi, L.; Magri, S.; Gualtieri, L.; Fabbri, D.; Tossani, E.; Benassi, M. Internalizing symptoms in developmental dyslexia: A comparison between primary and secondary school. Front. Psychol. 2020, 11, 461. [Google Scholar] [CrossRef] [PubMed]
- Sharfi, K.; Rosenblum, S. Executive functions, time organization and quality of life among adults with learning disabilities. PLoS ONE 2016, 11, e0166939. [Google Scholar] [CrossRef]
- Benassi, E.; Camia, M.; Giovagnoli, S.; Scorza, M. Impaired school well-being in children with specific learning disorder and its relationship to psychopathological symptoms. Eur. J. Spec. Needs Educ. 2022, 37, 74–88. [Google Scholar] [CrossRef]
- Gennaro, A.; Scorza, M.; Benassi, E.; Zonno, M.; Stella, G.; Salvatore, S. The role of perceived learning environment in scholars: A comparison between university students with dyslexia and normal readers. Int. J. Disabil. Hum. Dev. 2019, 18, 107–115. [Google Scholar]
- Ghisi, M.; Bottesi, G.; Re, A.M.; Cerea, S.; Mammarella, I.C. Socioemotional features and resilience in Italian university students with and without dyslexia. Front. Psychol. 2016, 7, 478. [Google Scholar] [CrossRef]
- Livingston, E.M.; Siegel, L.S.; Ribary, U. Developmental dyslexia: Emotional impact and consequences. Aust. J. Learn. Diffic. 2018, 23, 107–135. [Google Scholar] [CrossRef]
- Scorza, M.; Zonno, M.; Benassi, E. Dyslexia and psychopathological symptoms in Italian university students: A higher risk for anxiety disorders in male population? J. Psychopathol. 2018, 24, 193–203. [Google Scholar]
- Wechsler, D. WAIS-IV Administration and Scoring Manual; The Psychological Corporation: San Antonio, TX, USA, 2008. [Google Scholar]
- Wechsler, D. WAIS-IV. Technical and Interpretive Manual; The Psychological Corporation: San Antonio, TX, USA, 2008. [Google Scholar]
- Hartman, D.E. Wechsler Adult Intelligence Scale IV (WAIS IV): Return of the gold standard. Appl. Neuropsychol. 2009, 16, 85–87. [Google Scholar] [CrossRef] [PubMed]
- Pezzuti, L. The GAI and CPI in the Italian standardization of the WAIS-IV and their clinical implications. Appl. Psychol. Bull. 2016, 276, 19–38. [Google Scholar]
- Rowe, E.W.; Dandridge, J.; Pawlush, A.; Thompson, D.F.; Ferrier, D.E. Exploratory and confirmatory factor analyses of the WISC-IV with gifted students. Sch. Psychol. Q. 2014, 29, 536. [Google Scholar] [CrossRef]
- Holdnack, J.A.; Drozdick, L.; Weiss, L.G.; Iverson, G.L. (Eds.) WAIS-IV, WMS-IV, and ACS: Advanced Clinical Interpretation; Academic Press: Cambridge, MA, USA, 2013. [Google Scholar]
- Lang, M.; Michelotti, C.; Bardelli, E. WAIS-IV Wechsler Adult Intelligence Scale-IV: Lettura dei Risultati e Interpretazione Clinica; [WAIS-IV Wechsler Adult Intelligence Scale-IV: Results and Clinical Interpretation]; Raffaello Cortina Editore: Milano, Italy, 2015. [Google Scholar]
- Bing-Canar, H.; Phillips, M.S.; Shields, A.N.; Ogram Buckley, C.M.; Chang, F.; Khan, H.; Skymba, H.V.; Ovsiew, G.P.; Resch, Z.J.; Jennette, K.J.; et al. Cross-validation of multiple WAIS-IV digit span embedded performance validity indices among a large sample of adult attention deficit/hyperactivity disorder clinical referrals. J. Psychoeduc. Assess. 2022, 40, 678–688. [Google Scholar] [CrossRef]
- Theiling, J.; Petermann, F. Neuropsychological profiles on the WAIS-IV of adults with ADHD. J. Atten. Disord. 2016, 20, 913–924. [Google Scholar] [CrossRef] [PubMed]
- Bucaille, A.; Grandgeorge, M.; Degrez, C.; Mallégol, C.; Cam, P.; Botbol, M.; Planche, P. Cognitive profile in adults with Asperger syndrome using WAIS-IV: Comparison to typical adults. Res. Autism. Spectr. Disord. 2016, 21, 1–9. [Google Scholar] [CrossRef]
- Davids, R.C.; Groen, Y.; Berg, I.J.; Tucha, O.; van Balkom, I.D. Local-global processing approaches in older autistic adults: A matched control study using RCFT and WAIS-IV. Res. Autism. Spectr. Disord. 2020, 78, 101655. [Google Scholar] [CrossRef]
- Reynolds, M.R.; Ingram, P.B.; Seeley, J.S.; Newby, K.D. Investigating the structure and invariance of the Wechsler Adult Intelligence Scales, in a sample of adults with intellectual disabilities. Res. Dev. Disabil. 2013, 34, 3235–3245. [Google Scholar] [CrossRef] [PubMed]
- Saleem, M.; Beail, N.; Roache, S. Relationship between the Vineland Adaptive Behaviour Scales and the Wechsler Adult Intelligence Scale IV in adults with intellectual disabilities. J. Intellect. Disabil. Res. 2019, 63, 1158–1162. [Google Scholar] [CrossRef] [PubMed]
- Lindau, M.; Lundberg, M.; Najström, M. WAIS-IV short form applied to a mixed neurological Swedish clinical sample. Nord. Psychol. 2022, 74, 114–124. [Google Scholar] [CrossRef]
- Ryan, J.J.; Kreiner, D.S.; Glass Umfleet, L.; Gontkovsky, S.T.; Myers-Fabian, A. WAIS-IV GAI and CPI discrepancies in multiple sclerosis and traumatic brain injury. Appl. Neuropsychol. Adult 2018, 25, 51–56. [Google Scholar] [CrossRef]
- van Ool, J.S.; Hurks, P.P.; Snoeijen-Schouwenaars, F.M.; Tan, I.Y.; Schelhaas, H.J.; Klinkenberg, S.; Aldenkamp, A.P.; Hendriksen, J.G. Accuracy of WISC-III and WAIS-IV short forms in patients with neurological disorders. Dev. Neurorehabil. 2018, 21, 101–107. [Google Scholar] [CrossRef]
- Fuentes-Durá, I.; Ruiz, J.C.; Dasí, C.; Navarro, M.; Blasco, P.; Tomás, P. WAIS-IV performance in patients with schizophrenia. J. Nerv. Ment. Dis. 2019, 207, 467–473. [Google Scholar] [CrossRef]
- Michel, N.M.; Goldberg, J.O.; Heinrichs, R.W.; Miles, A.A.; Ammari, N.; McDermid Vaz, S. WAIS-IV profile of cognition in schizophrenia. Assessment 2013, 20, 462–473. [Google Scholar] [CrossRef]
- Cornoldi, C.; Giofre, D.; Orsini, A.; Pezzuti, L. Differences in the intellectual profile of children with intellectual vs. learning disability. Res. Dev. Disabil. 2014, 35, 2224–2230. [Google Scholar] [CrossRef]
- De Clercq-Quaegebeur, M.; Casalis, S.; Lemaitre, M.P.; Bourgois, B.; Getto, M.; Vallée, L. Neuropsychological profile on the WISC-IV of French children with dyslexia. J. Learn. Disabil. 2010, 43, 563–574. [Google Scholar] [CrossRef]
- Giofrè, D.; Cornoldi, C. The structure of intelligence in children with specific learning disabilities is different as compared to typically development children. Intelligence 2015, 52, 36–43. [Google Scholar] [CrossRef]
- Giofrè, D.; Toffalini, E.; Altoè, G.; Cornoldi, C. Intelligence measures as diagnostic tools for children with specific learning disabilities. Intelligence 2017, 61, 140–145. [Google Scholar] [CrossRef]
- Poletti, M. WISC-IV intellectual profiles in Italian children with specific learning disorder and related impairments in reading, written expression, and mathematics. J. Learn. Disabil. 2016, 49, 320–335. [Google Scholar] [CrossRef]
- Raiford, S.E.; Weiss, P.D.L.G.; Rolfhus, P.D.E.; Coalson, P.D.D. General ability index. In WISC-IV Technical Report No, 4; Pearson Education, Inc.: Upper Saddle River, NJ, USA, 2005. [Google Scholar]
- Toffalini, E.; Giofrè, D.; Cornoldi, C. Strengths and weaknesses in the intellectual profile of different subtypes of specific learning disorder: A study on 1049 diagnosed children. Clin. Psychol. Sci. 2017, 5, 402–409. [Google Scholar] [CrossRef]
- Saklofske, D.H.; Prifitera, A.; Weiss, L.G.; Rolfhus, E.; Zhu, J. Clinical interpretation of the WISC-IV FSIQ and GAI. In WISC-IV Clinical Use and Interpretation; Academic Press: Cambridge, MA, USA, 2005; pp. 22–69. [Google Scholar] [CrossRef]
- Toffalini, E.; Pezzuti, L.; Cornoldi, C. Einstein and dyslexia: Is giftedness more frequent in children with a specific learning disorder than in typically developing children? Intelligence 2017, 62, 175–179. [Google Scholar] [CrossRef]
- Bremner, D.; McTaggart, B.; Saklofske, D.H.; Janzen, T. WISC-IV GAI and CPI in psychoeducational assessment. Can. J. Sch. Psychol. 2011, 26, 209–219. [Google Scholar] [CrossRef]
- Calhoun, S.L.; Mayes, S.D. Processing speed in children with clinical disorders. Psychol. Sch. 2005, 42, 333–343. [Google Scholar] [CrossRef]
- Harrison, A.G.; DeLisle, M.M.; Parker, K.C. An investigation of the General Abilities Index in a group of diagnostically mixed patients. J. Psychoeduc. Assess. 2008, 26, 247–259. [Google Scholar] [CrossRef]
- Weiss, L.G.; Gabel, A.D. Using the cognitive proficiency index in psychoeducational assessment. In WISC-IV Technical Report No, 6; Pearson Education, Inc.: Upper Saddle River, NJ, USA, 2008. [Google Scholar]
- Wechsler, D. Wechsler Intelligence Scale for Children—Fourth Edition (WISC-IV); The Psychological Corporation: San Antonio, TX, USA, 2003. [Google Scholar]
- Gontkovsky, S.T.; Golden, C.J. A pilot investigation of Wechsler Adult Intelligence Scale-Fourth Edition (WAIS-IV) subtest profiles in adults with specific learning disorders. N. Am. J. Psychol. 2022, 24, 257–268. [Google Scholar]
- Franzen, L.; Stark, Z.; Johnson, A.P. Individuals with dyslexia use a different visual sampling strategy to read text. Sci. Rep. 2021, 11, 6449. [Google Scholar] [CrossRef]
- D’Elia, D.; Carpinelli, L.; Savarese, G. Exploratory and Descriptive Comparison Using the WAIS-IV and LSC-SUA of the Cognitive Profile of Italian University Students with Reading Comprehension Disorder (RCD) vs. Decoding Difficulties—Dyslexia. Youth 2023, 3, 351–361. [Google Scholar] [CrossRef]
- Alm, J.; Kaufman, A.S. The Swedish WAIS-R factor structure and cognitive profiles for adults with dyslexia. J. Learn. Disabil. 2002, 35, 321–333. [Google Scholar] [CrossRef]
- Laasonen, M.; Leppämäki, S.; Tani, P.; Hokkanen, L. Adult dyslexia and attention deficit disorder in Finland—Project DyAdd: WAIS-III cognitive profiles. J. Learn. Disabil. 2009, 42, 511–527. [Google Scholar] [CrossRef]
- Godoy de Oliveira, D.; Mecca, T.P.; Morão, C.A.; Botelho da Silva, P.; Coutinho de Macedo, E. Cognitive profiles on the WAIS-III intelligence test in Brazilian adults with dyslexia. Psychol. Neurosci. 2014, 7, 551. [Google Scholar] [CrossRef]
- Italian National Institute of Health-Report 2022: Linee Guida Sulla Gestione dei Disturbi Specifici dell’Apprendimento. Aggiornamento ed Integrazioni. Available online: https://www.iss.it/-/snlg-disturbi-specifici-apprendimento (accessed on 6 March 2023).
- Wechsler, D. WAIS-IV. In Manuale di Somministrazione e Scoring, (Italian version by Arturo Orsini A. and Pezzuti L.); Giunti Psychometrics: Florence, Italy, 2013. [Google Scholar]
- Ryan, J.J.; Gontkovsky, S.T. Wechsler Adult Intelligence Scale (WAIS-IV) and Wechsler Memory Scale (WMS-IV): A critique. In The SAGE Handbook of Clinical Neuropsychology: Clinical Neuropsychological Assessment And Diagnosis; Boyle, G.J., Stern, Y., Stein, D.J., Sahakian, B.J., Golden, C.J., Lee, T.M.C., Chen, S.H.A., Eds.; Sage: Los Angeles, CA, USA, 2023; pp. 267–283. [Google Scholar]
- Moura, O.; Simoes, M.R.; Pereira, M. WISC-III cognitive profiles in children with developmental dyslexia: Specific cognitive disability and diagnostic utility. Dyslexia 2014, 20, 19–37. [Google Scholar] [CrossRef]
- Shanahan, M.A.; Pennington, B.F.; Yerys, B.E.; Scott, A.; Boada, R.; Willcutt, E.G.; Olson, R.K.; DeFries, J.C. Processing speed deficits in attention deficit/hyperactivity disorder and reading disability. J. Abnorm. Child. Psychol. 2006, 34, 584–601. [Google Scholar] [CrossRef]
- Pennington, B.F. From single to multiple deficit models of developmental disorders. Cognition 2016, 101, 385–413. [Google Scholar] [CrossRef]
- Callens, M.; Tops, W.; Brysbaert, M. Cognitive profile of students who enter higher education with an indication of dyslexia. PLoS ONE 2012, 7, e38081. [Google Scholar] [CrossRef]
- Cristofani, P.; Di Lieto, M.C.; Casalini, C.; Pecini, C.; Baroncini, M.; Pessina, O.; Gasperini, F.; Dasso Lang, M.B.; Bartoli, M.; Chilosi, A.M.; et al. Specific Learning Disabilities and Emotional-Behavioral Difficulties: Phenotypes and Role of the Cognitive Profile. J. Clin. Med. 2023, 12, 1882. [Google Scholar] [CrossRef]


| Students with DD (1) (n = 16) | Students with Mixed-SLD (2) (n = 38) | TD Students (3) (n = 38) | MANOVA | ||||||
|---|---|---|---|---|---|---|---|---|---|
| WAIS-IV Indexes | Mean (SD) | Range | Mean (SD) | Range | Mean (SD) | Range | p (1–2 *) | p (1–3 *) | p (2–3 *) |
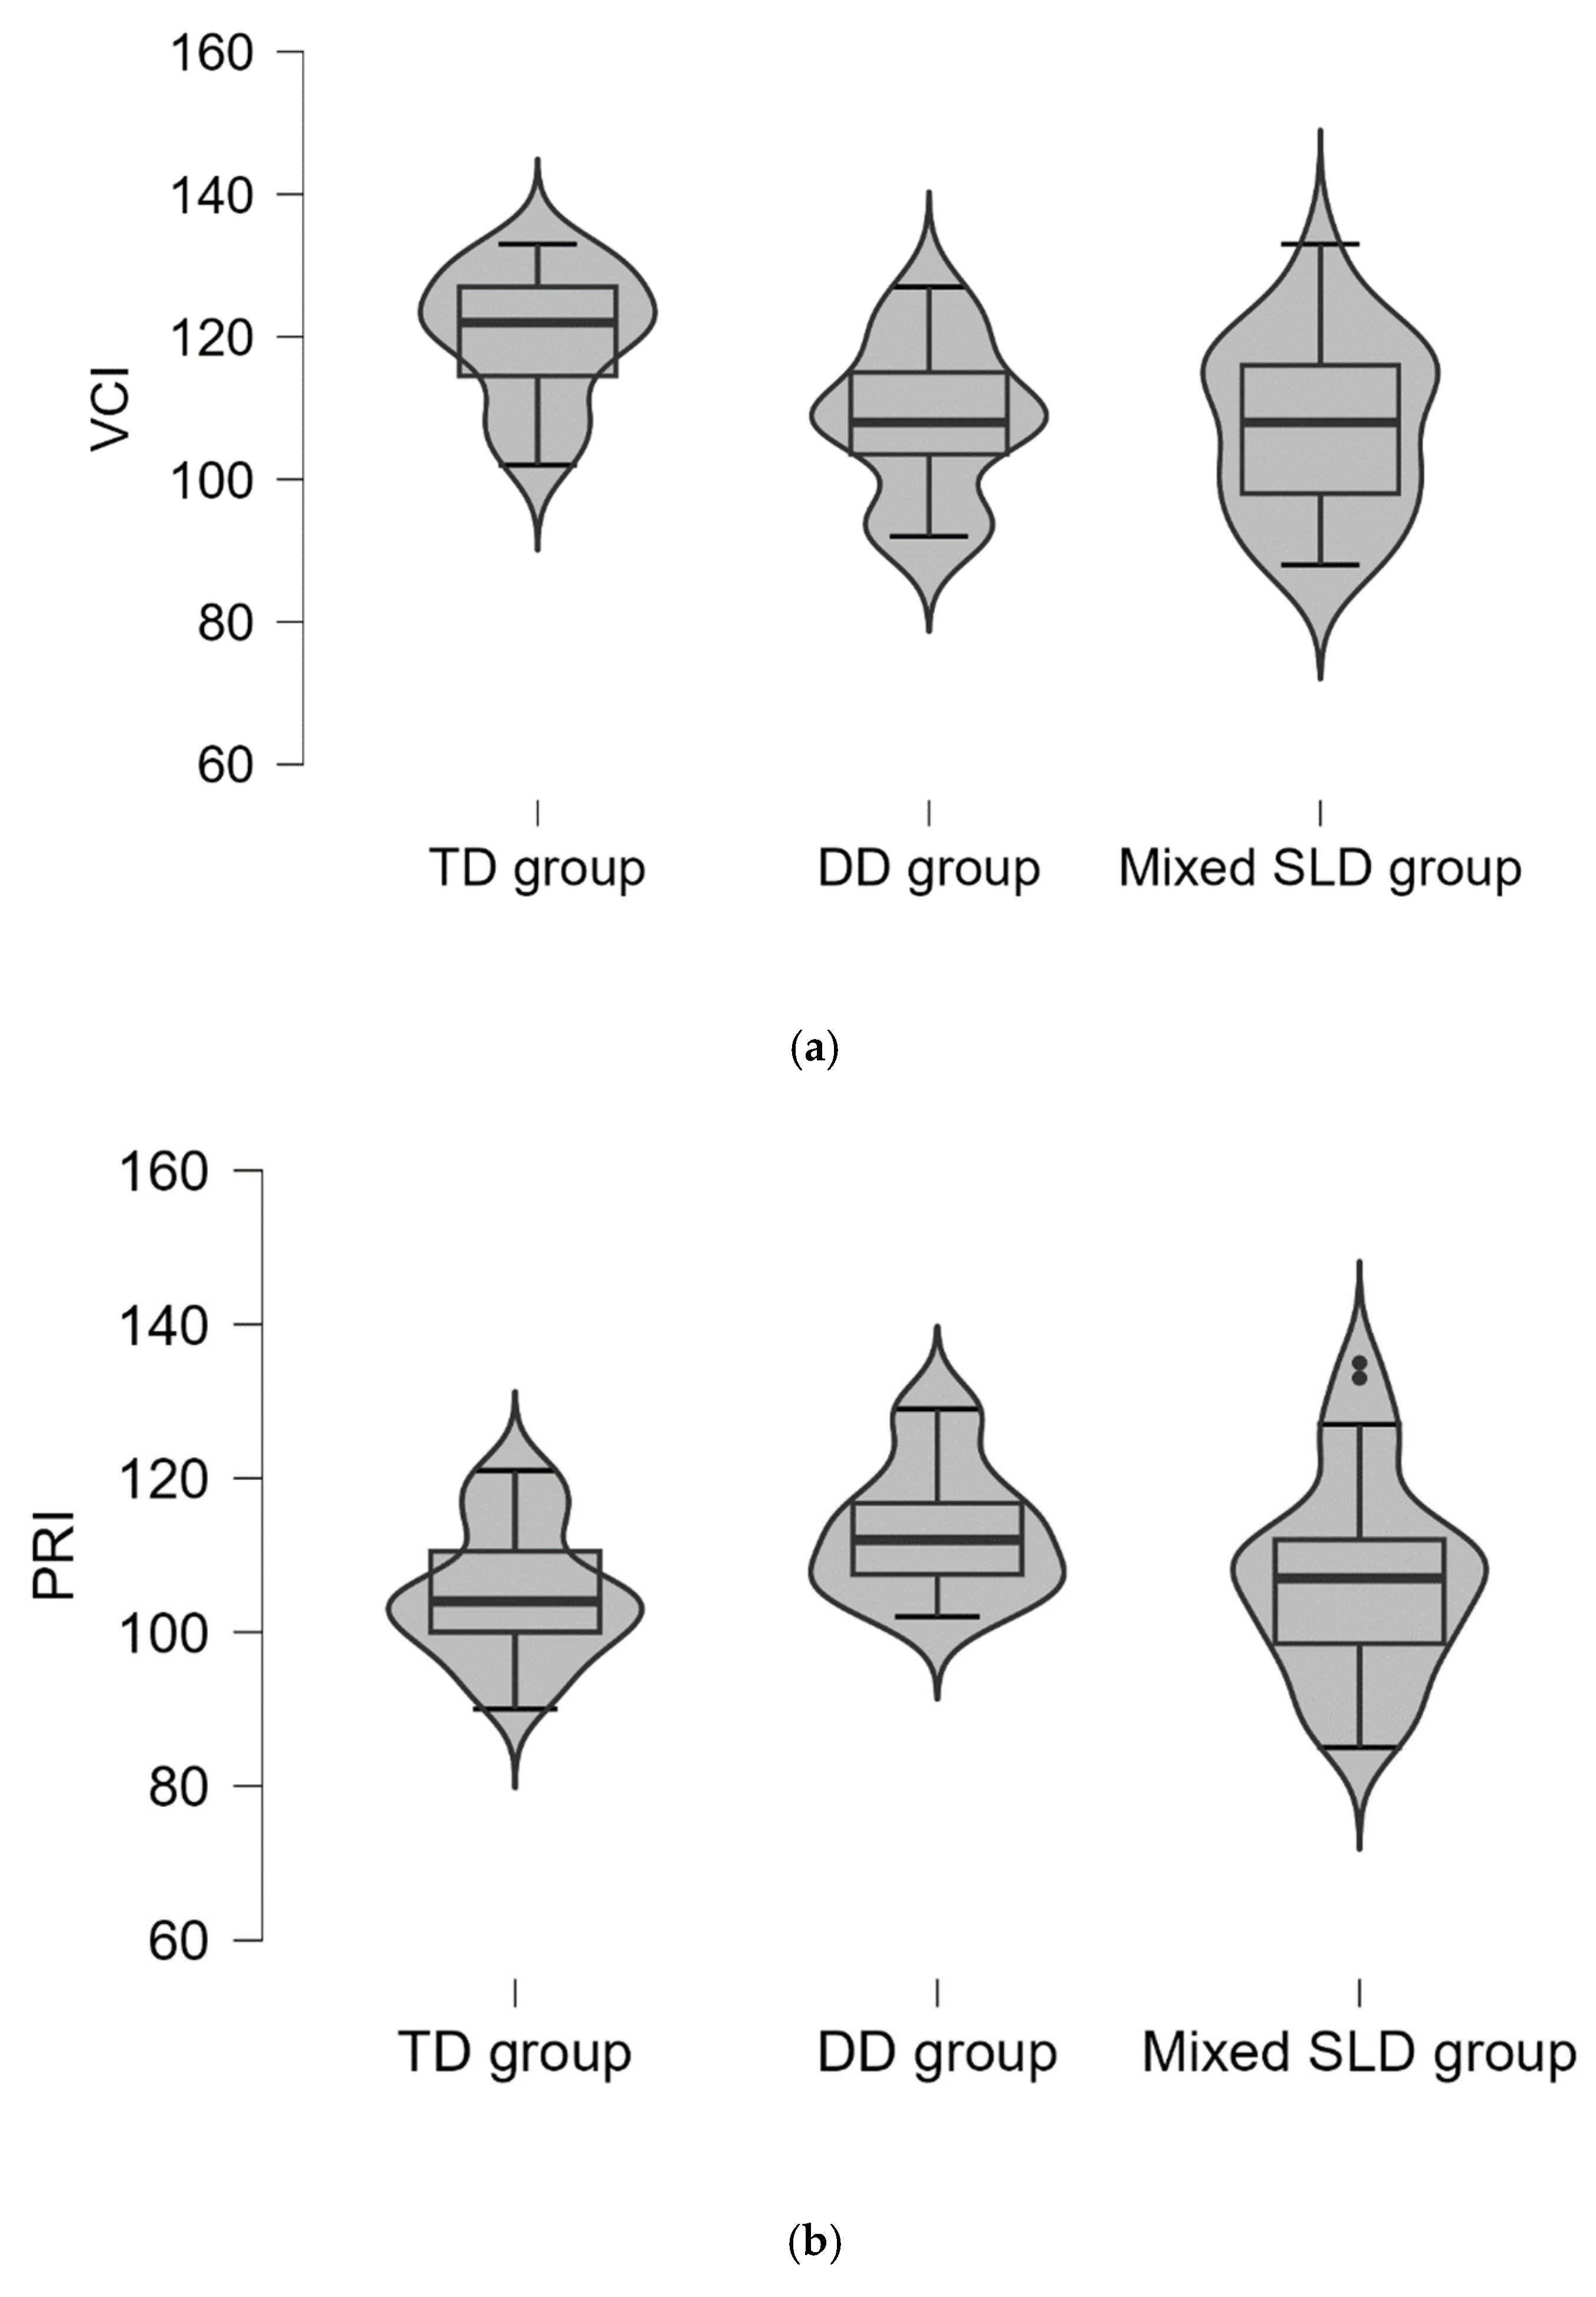
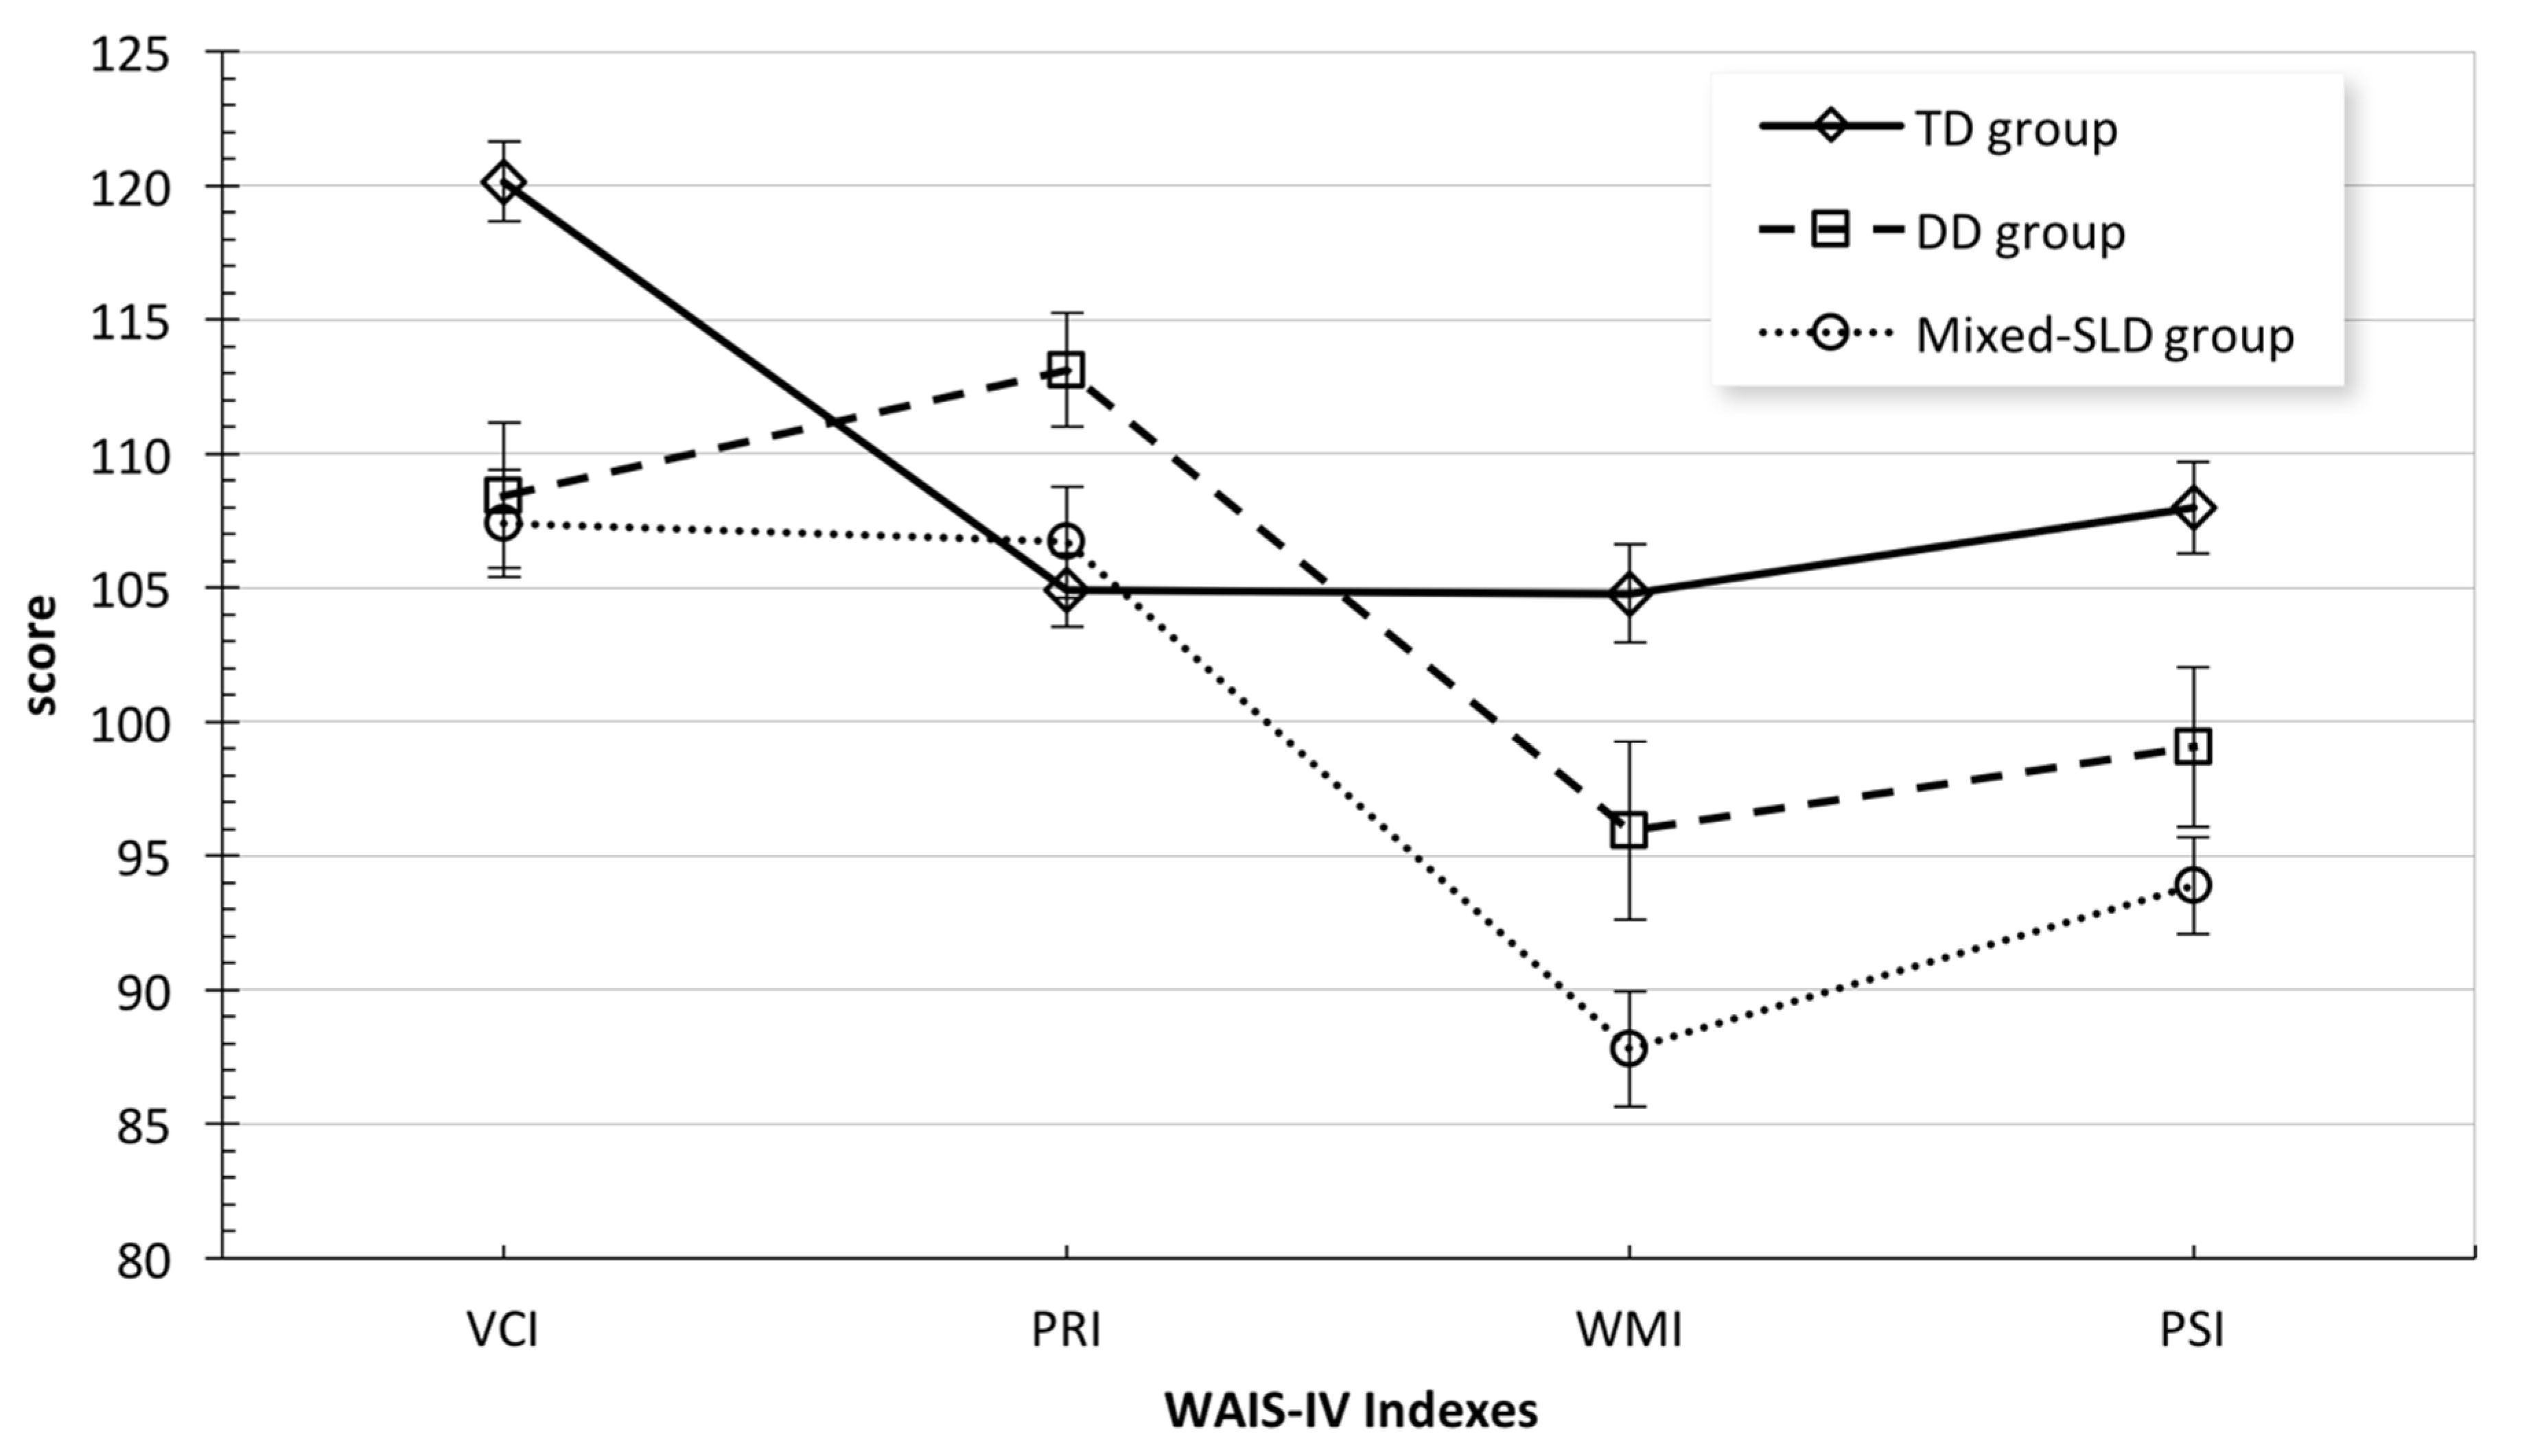
| Verbal Comprehension Index (VCI) | 108.44 (10.86) | 92–127 | 107.42 (12.25) | 88–133 | 120.16 (9.14) | 102–133 | 1.00 | 0.005 | 0.002 |
| Perceptual Reasoning Index (PRI) | 113.13 (8.47) | 102–129 | 106.71 (12.71) | 85–135 | 104.92 (8.53) | 90–121 | 0.195 | 0.031 | 1.00 |
| Working Memory Index (WMI) | 95.94 (13.19) | 72–117 | 87.79 (13.29) | 60–117 | 104.79 (11.26) | 89–129 | 0.239 | 0.153 | <0.001 |
| Processing Speed Index (PSI) | 90.06 (11.94) | 81–125 | 93.89 (11.15) | 64–114 | 108.00 (10.57) | 95–133 | 0.552 | 0.049 | <0.001 |
| Students with DD (1) (n = 16) | Students with Mixed-SLD (2) (n = 38) | TD Students (3) (n = 38) | MANOVA | ||||||
|---|---|---|---|---|---|---|---|---|---|
| WAIS-IV Additional Indexes | Mean (SD) | Range | Mean (SD) | Range | Mean (SD) | Range | p (1–2 *) | p (1–3 *) | p (2–3 *) |
| General Ability Index (GAI) | 111.31 (9.49) | 93–128 | 107.92 (10.14) | 90–133 | 114.50 (8.06) | 98–130 | 1.00 | 1.00 | 0.188 |
| Cognitive Proficiency Index (CPI) | 96.94 (11.76) | 78–118 | 89.00 (10.14) | 70–112 | 107.39 (9.40) | 92–128 | 0.097 | 0.010 | <0.001 |
| Students with DD (1) (n = 16) | Students with Mixed-SLD (2) (n = 38) | TD Students (3) (n = 38) | Mann–Whitney Test | ||||||
|---|---|---|---|---|---|---|---|---|---|
| WAIS-IV Subtests | Mean (SD) | Range | Mean (SD) | Range | Mean (SD) | Range | U/p (1–2*) | U/p (1–3 *) | U/p (2–3 *) |
| Verbal Comprehension Index (VCI) | |||||||||
| Vocabulary (VC) | 11.31 (2.68) | 7–17 | 11.42 (2.31) | 7–17 | 13.61 (2.21) | 10–19 | 91/0.804 | 155/0.004 | 362/<0.001 |
| Information (IN) | 10.19 (2.83) | 6–15 | 10.24 (2.53) | 5–15 | 11.89 (2.54) | 6–17 | 302.5/0.977 | 208/0.067 | 489/0.015 |
| Similarities (SI) | 12.63 (1.89) | 11–17 | 12.13 (2.98) | 7–19 | 14.89 (1.97) | 10–19 | 257/0.367 | 120.5/<0.001 | 312.5/<0.001 |
| Perceptual Reasoning Index (PRI) | |||||||||
| Block Design (BD) | 13.00 (2.16) | 9–17 | 10.84 (2.59) | 6–18 | 10.24 (2.62) | 5–15 | 154.5/0.004 | 131/0.001 | 653.5/0.473 |
| Matrix Reasoning (MR) | 12.00 (2.28) | 8–16 | 10.37 (2.27) | 6–15 | 11.50 (1.81) | 8–15 | 175.5/0.014 | 246.5/0.266 | 466.5/0.007 |
| Visual Puzzles (VP) | 11.50 (1.97) | 8–15 | 11.71 (2.91) | 5–17 | 10.66 (1.94) | 7–14 | 278/0.619 | 234.5/0.183 | 529/0.043 |
| Working Memory Index (WMI) | |||||||||
| Digit Span (DS) | 8.44 (3.16) | 3–14 | 7.63 (3.10) | 3–14 | 10.68 (2.18) | 7–15 | 260.5/0.407 | 171.5/0.011 | 328/<0.001 |
| Arithmetic Reasoning (AR) | 10.13 (2.53) | 7–16 | 8.00 (2.57) | 3–13 | 10.95 (2.37) | 7–17 | 168/0.009 | 231/0.154 | 275/<0.001 |
| Processing Speed Index (PSI) | |||||||||
| Coding (CD) | 9.81 (2.07) | 7–14 | 9.08 (2.21) | 4–14 | 11.37 (2.08) | 8–15 | 250/0.302 | 184.5/0.022 | 342/<0.001 |
| Symbol Search (SS) | 9.81 (2.79) | 5–17 | 8.71 (2.29) | 3–13 | 11.47 (2.41) | 8–17 | 240.5/0.224 | 194.5/0.036 | 304/<0.001 |
Disclaimer/Publisher’s Note: The statements, opinions and data contained in all publications are solely those of the individual author(s) and contributor(s) and not of MDPI and/or the editor(s). MDPI and/or the editor(s) disclaim responsibility for any injury to people or property resulting from any ideas, methods, instructions or products referred to in the content. |
© 2023 by the authors. Licensee MDPI, Basel, Switzerland. This article is an open access article distributed under the terms and conditions of the Creative Commons Attribution (CC BY) license (https://creativecommons.org/licenses/by/4.0/).
Share and Cite
Scorza, M.; Gontkovsky, S.T.; Puddu, M.; Ciaramidaro, A.; Termine, C.; Simeoni, L.; Mauro, M.; Benassi, E. Cognitive Profile Discrepancies among Typical University Students and Those with Dyslexia and Mixed-Type Learning Disorder. J. Clin. Med. 2023, 12, 7113. https://doi.org/10.3390/jcm12227113
Scorza M, Gontkovsky ST, Puddu M, Ciaramidaro A, Termine C, Simeoni L, Mauro M, Benassi E. Cognitive Profile Discrepancies among Typical University Students and Those with Dyslexia and Mixed-Type Learning Disorder. Journal of Clinical Medicine. 2023; 12(22):7113. https://doi.org/10.3390/jcm12227113
Chicago/Turabian StyleScorza, Maristella, Samuel T. Gontkovsky, Marta Puddu, Angela Ciaramidaro, Cristiano Termine, Loriana Simeoni, Marcella Mauro, and Erika Benassi. 2023. "Cognitive Profile Discrepancies among Typical University Students and Those with Dyslexia and Mixed-Type Learning Disorder" Journal of Clinical Medicine 12, no. 22: 7113. https://doi.org/10.3390/jcm12227113
APA StyleScorza, M., Gontkovsky, S. T., Puddu, M., Ciaramidaro, A., Termine, C., Simeoni, L., Mauro, M., & Benassi, E. (2023). Cognitive Profile Discrepancies among Typical University Students and Those with Dyslexia and Mixed-Type Learning Disorder. Journal of Clinical Medicine, 12(22), 7113. https://doi.org/10.3390/jcm12227113