
Menopause Predisposes Women to Increased Risk of Cardiovascular Disease

 ,
,  ,
,  , and
, and 
Abstract

1. Introduction
- Age at menopause: Women who last menstruated before the age of 45 have a higher overall risk of and mortality from ischemic heart disease. In addition, women experiencing early menopause (age of 40–45) and women with premature menopause (under 40) are at higher risk of heart disease.
- Type of menopause: The risk of CVD is higher for women whose menopause is the result of bilateral oophorectomy without estrogen therapy (especially women under 40 years of age).
- Stage of menopause: The highest blood pressure, cholesterol, and triglyceride values are recorded during either late perimenopause or early post-menopause.
- Vasomotor symptoms: The presence of vasomotor symptoms and other menopausal symptoms is associated with an increased risk of CVD and stroke.
- Sleep disorders: The combination of hormonal fluctuations, life stressors, and hot flashes contributes to sleep disorders, which in turn are associated with poorer cardiovascular health.
- Changes in estrogen levels have also a significant impact on the occurrence of CVD. This is because estrogens regulate various systemic factors, affecting, for example, serum lipid concentrations, the coagulation and fibrinolysis system, the antioxidant system, and the production of vasoactive molecules—nitric oxide and prostaglandins [11].
- Depression: Studies show that the development of depressive symptoms during the menopausal transition is associated with an increased risk of CVD [12].
- Other health changes associated with menopause: increased lipid levels, MetS, increased carotid atherosclerosis, weight gain, and ectopic fat distribution.
2. Materials and Methods
2.1. Organization and Course of the Study
2.2. Design of the Study
2.2.1. Research Tools
- The BDI-I is a 21-item, multiple-choice self-report questionnaire to assess the severity of depressive symptoms. A four-point Likert scale (0–3) is used to measure each BDI-I item over the past two weeks. The higher the score, the more severe the depressive symptoms. A total score of 0–11 indicates no depressive symptoms, 12–19—mild depression, 20–25—moderate depression, and 26–63—severe depression. Cronbach’s alpha for the BDI-I total score is 0.89 [18].
- The BKMI is a tool to assess the severity of 11 climacteric symptoms: hot flashes, sweating, insomnia, nervousness, melancholy, dizziness, weakness, joint pain, headache, palpitations, and paresthesia. Each of them is scored from 0 to 3, indicating no, mild, moderate, and severe symptoms, respectively. The symptoms are weighted: hot flashes (×4), paresthesia (×2), insomnia (×2), nervousness (×2), and all other symptoms (×1); therefore, the highest potential score is 51. The results are interpreted as follows: 0–16 points—no symptoms, 17–25 points—mild symptoms, 26–30 points—moderate symptoms, above 30 points—severe symptoms of menopause [19].
2.2.2. Anthropometric Measurements
- Waist circumference (WC) was measured to the nearest 0.01 m using a flexible tape measure (SECA 711). Waist circumference was measured as the horizontal distance around the abdomen at the level of the navel. Abdominal obesity was defined as WC ≥ 80 cm (for European women) [20];
- A validated medical scale with an integrated SECA 711 height meter was used to measure body weight and height in accordance with a standardized procedure with an accuracy of 0.1 kg and 0.1 cm, respectively. Participants stood with their backs straight, heels together, barefoot, in light clothing. Based on the results, the body mass index (BMI) was calculated: BMI = weight [kg]/height [m2]. Based on the BMI values (kg/m2), the following categories were established as recommended by the Centers for Disease Control and Prevention (CDC): underweight (BMI < 18.5), normal weight (BMI = 18.5–24.9), overweight (BMI = 25.0–29.9), obesity (BMI ≥ 30) [21].
- Waist-to-height ratio (WHtR) was determined according to the formula: WHtR = waist circumference [cm]/height [cm]) [20].
2.2.3. Blood Pressure Measurements
2.2.4. Laboratory Analysis
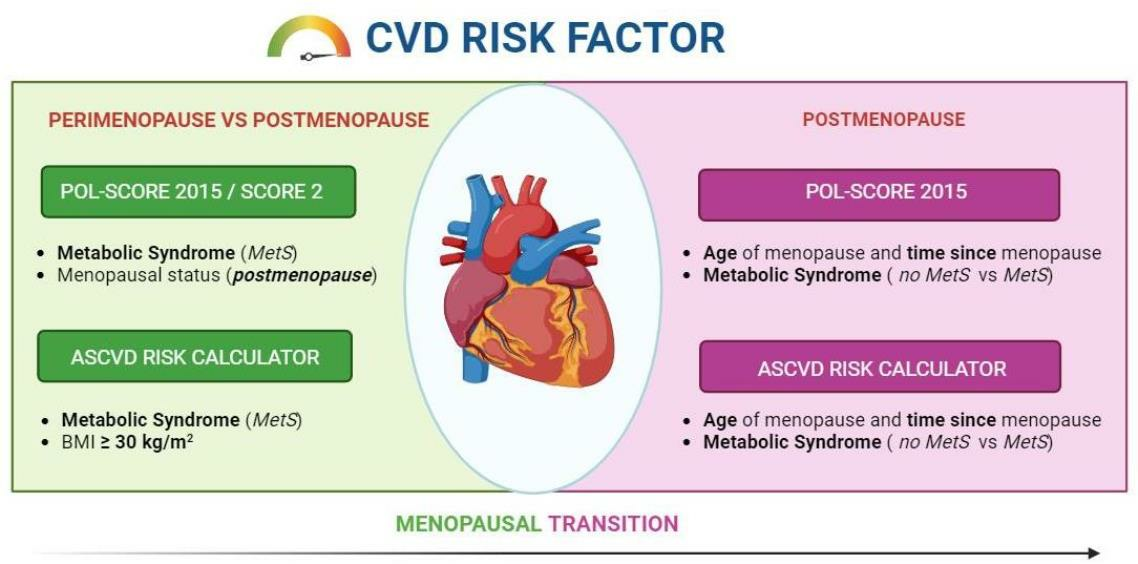
2.3. Cardiovascular Risk Assessment
- POL-Systematic Coronary Risk Evaluation (POL-SCORE) 2015—a tool to assess ten-year risk of a fatal cardiovascular event with regard to sex, age, systolic blood pressure, total cholesterol, and smoking—the version for the Polish population. The risk of cardiovascular death within ten years according to the POL-SCORE was as follows: low < 1%, moderate 1–4%, high 5–9%, and very high ≥ 10% [25];
- SCORE-2—an updated predictive model to estimate the ten-year risk of death from CVD and non-fatal CVD in 40–69-year-old Europeans without prior CVD or diabetes. This version was developed in 2021 for four risk groups: low, moderate, high, and very high. Poland is recognized as one of the countries at high risk of CVD [26,27];
2.4. Classification of Respondents
- (a)
- Menopausal status [31]:
- Perimenopause—the time immediately before menopause, when endocrine, biological, and clinical symptoms of approaching menopause begin;
- Postmenopause—last menstrual period (at least 12 months before the examination);
- (b)
- Hypertension—diagnosis based on the 2020 International Society of Hypertension Global Hypertension Practice guidelines and the 2019 Polish Society of Hypertension guidelines (systolic blood pressure (SBP) ≥ 140 mmHg or diastolic blood pressure (DBP) ≥ 90 mmHg or taking antihypertensive drugs) [22,23];
- (c)
- Obesity—diagnosis based on the CDC recommendations (underweight: BMI < 18.5, normal weight: BMI = 18.5–24.9, overweight: BMI = 25.0–29.9, obesity: BMI ≥ 30, general obesity: ≥30 kg/m2, and abdominal obesity: WC > 80 cm) [20];
- (d)
- MetS—based on the latest criteria proposed by the International Diabetes Federation (IDF) and the modified National Cholesterol Education Program Adult Treatment Panel III [32], a woman is diagnosed with MetS if she has three out of five risk factors, which include:
- WC ≥ 80 cm,
- TG > 150 mg/dL (1.7 mmol/L) or treatment of this lipid abnormality,
- HDL-C < 50 mg/dL (1.3 mmol/L) or treatment of this lipid abnormality,
- Elevated BP: SBP ≥ 130 or DBP ≥ 85 mmHg or treatment of previously diagnosed hypertension,
- Fasting plasma glucose (FPG) ≥ 100 mg/dL (5.6 mmol/L) or previously diagnosed type 2 diabetes. If it is above 5.6 mmol/L or 100 mg/dL, an oral glucose tolerance test (OGTT) is strongly recommended, but this is not necessary to determine the presence of the syndrome;
- (e)
- (f)
- Dyslipidemia—based on the National Cholesterol Education Program (NCEP) guidelines, diagnosed if [35]:
- total cholesterol (TC) ≥ 240 mg/dL;
- low-density lipoprotein cholesterol (LDL-C) ≥ 160 mg/dL;
- triglyceride (TG) level ≥ 88 mg/dL;
- high-density lipoprotein cholesterol (HDL-C) ≤ 40 mg/dL or taking lipid-regulating drugs.
2.5. Statistical Analysis
3. Results
3.1. Menopausal Status and Cardiovascular Risk
3.2. Impact of Menopause on CVD Risk According to POL-SCORE 2015
3.2.1. POL-SCORE 2015
3.2.2. SCORE-2
3.3. Impact of Menopause on CVD Risk According to the ASCVD Risk Calculator Score
3.4. Impact of Menopause-Related Variables on the Occurrence of CVD
3.4.1. POL-SCORE 2015
3.4.2. ASCVD Risk Calculator
4. Discussion
4.1. Effect of Menopause on CVD Risk
4.2. Effect of the Time since Menopause on CVD Risk
5. Conclusions
- Menopause predisposes women to an increased risk of CVD due to visceral obesity, dyslipidemia, impaired glucose homeostasis, and hypertension. Also, women with MetS have a significantly higher risk of CVD.
- Menopause is associated with an increased risk of CVD. Despite many studies, it is difficult to clarify the dilemma regarding the independent and causal role of menopause in the development of CVD, taking into account the interaction of climacteric symptoms with traditional cardiovascular risk factors. It is, therefore, important to conduct research that will explain the complex mechanical pathways that may increase cardiometabolic risk after menopause.
- Further research evaluating the impact of selected variables on the occurrence of cardiovascular risk among peri- and postmenopausal women is recommended.
6. Limitation
- The small size of the study sample—a larger number of participants would strengthen the study;
- The method of recruitment (posters and advertisements), and the fact that recruitment was limited to one voivodeship, which prevented us from reaching a wider group of potential participants;
- Lack of detailed history of unfavorable pregnancy outcomes and their complications, failure to assess family history of CVD, and lack of information about the first menstruation;
- Amenorrhea for at least 12 months was diagnosed on the basis of a gynecological history, but not confirmed by the measurement of FSH levels;
- We only included women who were not taking MHT, so we could not check whether MHT had any protective effect on the cardiovascular system.
Author Contributions
Funding
Institutional Review Board Statement
Informed Consent Statement
Data Availability Statement
Conflicts of Interest
References
- Mounier-Vehier, C. Women’s cardiovascular risk before and after menopause: A red alert for heart attack! Ann. Endocrinol. 2021, 82, 134. [Google Scholar] [CrossRef]
- European Heart Network. European Cardiovascular Disease Statistics, 2018th ed.; European Heart Network: Brussels, Belgium, 2017; Available online: http://www.ehnheart.org/cvd-statistics/cvd-statistics-2017.html (accessed on 7 November 2022).
- Wellons, M.; Ouyang, P.; Schreiner, P.J.; Herrington, D.M.; Vaidya, D. Early menopause predicts future coronary heart disease and stroke: The Multi-Ethnic Study of Atherosclerosis (MESA). Menopause 2012, 19, 1081–1087. [Google Scholar] [CrossRef] [PubMed]
- Kannel, W.B.; Hjortland, M.C.; Mcnamara, P.M.; Gordon, T. Menopause and risk of cardiovascular disease: The Framingham study. Ann. Intern. Med. 1976, 85, 447–452. [Google Scholar] [CrossRef]
- Maas, A.; Appelman, Y. Gender differences in coronary heart disease. Neth. Heart J. 2010, 18, 598–602. [Google Scholar] [CrossRef] [PubMed]
- Stevenson, J.C.; Collins, P.; Hamoda, H.; Lambrinoudaki, I.; Maas, A.H.E.M.; Maclaran, K.; Panay, N. Cardiometabolic health in premature ovarian insufficiency. Climacteric 2021, 24, 474–480. [Google Scholar] [CrossRef]
- Crandall, C.J.; Barrett-Connor, E. Endogenous sex steroid levels and cardiovascular disease in relation to the menopause: A systematic review. Endocrinol. Metab. Clin. N. Am. 2013, 42, 227–253. [Google Scholar] [CrossRef]
- El Khoudary, S.R.; Thurston, R.C. Cardiovascular implications of the menopause transition: Endogenous sex hormones and vasomotor symptoms. Obstet. Gynecol. Clin. N. Am. 2018, 45, 641–661. [Google Scholar] [CrossRef] [PubMed]
- Muka, T.; Oliver-Williams, C.; Kunutsor, S.; Laven, J.; Fauser, B.; Chowdhury, R.; Kavousi, M.; Franco, O. Association of Age at Onset of Menopause and Time Since Onset of Menopause with Cardiovascular Outcomes, Intermediate Vascular Traits, and All-Cause Mortality: A Systematic Review and Meta-analysis. JAMA Cardiol. 2016, 1, 767–776. [Google Scholar] [CrossRef]
- Saeed, A.; Kampangkaew, J.; Nambi, V. Prevention of Cardiovascular Disease in Women. Methodist. Debakey Cardiovasc. J. 2017, 13, 185–192. [Google Scholar] [CrossRef]
- Mendelsohn, M.E.; Karas, R.H. The Protective Effects of Estrogen on the Cardiovascular System. N. Engl. J. Med. 1999, 340, 1801–1811. [Google Scholar] [CrossRef]
- Ferketich, A.K.; Schwartzbaum, J.A.; Frid, D.J.; Moeschberger, M.L. Depression as an Antecedent to Heart Disease Among Women and Men in the NHANES I Study. Natl. Health Nutr. Exam. Surv. Arch. Intern. Med. 2000, 160, 1261–1268. [Google Scholar] [CrossRef]
- Dal Canto, E.; Ceriello, A.; Rydén, L.; Ferrini, M.; Hansen, T.B.; Schnell, O.; Standl, E.; Beulens, J.W. Diabetes as a cardiovascular risk factor: An overview of global trends of macro and micro vascular complications. Eur. J. Prev. Cardiol. 2019, 26, 25–32. [Google Scholar] [CrossRef] [PubMed]
- Wenger, N. Tailoring cardiovascular risk assessment and prevention for women: One size does not fit all. Glob. Cardiol. Sci. Pract. 2017, 2017, e201701. [Google Scholar] [CrossRef] [PubMed][Green Version]
- Garcia, M.; Mulvagh, S.L.; Merz, C.N.; Buring, J.E.; Manson, J.E. Cardiovascular disease in women: Clinical perspectives. Circ. Res. 2016, 118, 1273–1293. [Google Scholar] [CrossRef] [PubMed]
- Von Mering, G.O.; Arant, C.B.; Wessel, T.R.; McGorray, S.P.; Bairey Merz, C.N.; Sharaf, B.L.; Smith, K.M.; Olson, M.B.; Johnson, B.D.; Sopko, G.; et al. Abnormal coronary vasomotion as a prognostic indicator of cardiovascular events in women: Results from the National Heart; Lung; and Blood Institute-Sponsored Women’s Ischemia Syndrome Evaluation (WISE). Circulation 2004, 17, 722–725. [Google Scholar] [CrossRef]
- Prabakaran, S.; Schwartz, A.; Lundberg, G. Cardiovascular risk in menopausal women and our evolving understanding of menopausal hormone therapy: Risks, benefits, and current guidelines for use. Ther. Adv. Endocrinol. Metab. 2021, 12, 20420188211013917. [Google Scholar] [CrossRef]
- Beck, A.T.; Steer, R.A.; Carbin, M.G. Psychometric properties of the Beck Depression Inventory: Twenty-five years of evaluation. Clin. Psychol. Rev. 1988, 8, 77–100. [Google Scholar] [CrossRef]
- Kupperman, H.S.; Blatt, M.H.G.; Wiesbader, F.; Filler, W. Comparative clinical evaluation of estrogenic preparations by the menopausal and amenorrheal indices. J. Clin. Endocrinol. Metab. 1953, 13, 688–703. [Google Scholar] [CrossRef]
- WHO Waist Circumference and Waist-Hip Ratio Report of a WHO Expert Consultation. Available online: https://www.who.int/nutrition/publications/obesity/WHO_report_waistcircumference_and_waisthip_ratio/en/ (accessed on 7 November 2022).
- World Health Organization Body Mass Index. Available online: https://www.euro.who.int/en/health-topics/disease-prevention/nutrition/a-healthy-lifestyle/body-mass-index-bmi (accessed on 1 March 2023).
- TRUE Consortium. Recommended Standards for Assessing Blood Pressure in Human Research Where Blood Pressure or Hypertension Is a Major Focus. Kidney Int. Rep. 2017, 2, 733–738. [Google Scholar] [CrossRef]
- Pickering, T.G.; Hall, J.E.; Appel, L.J.; Falkner, B.E.; Graves, J.; Hill, M.N.; Jones, D.W.; Kurtz, T.; Sheps, S.G.; Roccella, E.J. Recommendations for Blood Pressure Measurement in Humans and Experimental Animals. Circulation 2005, 111, 697–716. [Google Scholar] [CrossRef]
- Unger, T.; Borghi, C.; Charchar, F.; Khan, N.A.; Poulter, N.R.; Prabhakaran, D.; Ramirez, A.; Schlaich, M.; Stergiou, G.S.; Tomaszewski, M.; et al. 2020 International Society of Hypertension Global Hypertension Practice Guidelines. Hypertension 2020, 75, 1334–1357. [Google Scholar] [CrossRef] [PubMed]
- Duttagupta, S.; Thachathodiyl, R.; Rameshan, A.; Venkatachalam, A.; Georgy, S.; Ts, D.; Menon, J. Effectiveness of Framingham and ASCVD Risk Scores in Predicting Coronary Artery Disease—A Comparative Study with Syntax Score. J. Assoc. Physicians India 2022, 69, 11–12. [Google Scholar] [PubMed]
- Zdrojewski, T.; Jankowski, P.; Bandosz, P.; Bartuś, S.; Chwojnicki, K.; Drygas, W.; Gaciong, Z.; Hoffman, P.; Kalarus, Z.; Kaźmierczak, J.; et al. A new version of cardiovascular risk assessment system and risk charts calibrated for Polish population. Kardiol. Polska 2015, 73, 958–961. [Google Scholar] [CrossRef] [PubMed]
- U-Prevent. Available online: https://u-prevent.com/calculators/results/score2 (accessed on 7 November 2022).
- ASCVD Risk Estimator Plus. Available online: https://tools.acc.org/ASCVD-Risk-Estimator-Plus/#!/calculate/estimate/ (accessed on 7 November 2022).
- ESC. Available online: https://www.escardio.org/Education/Practice-Tools/CVD-prevention-toolbox/SCORE-Risk-Charts (accessed on 7 November 2022).
- GUS. Population. Size and Structure and Vital Statistics in Poland by Territorial Division in 2020. As of 31 December. Available online: http://eregion.wzp.pl/sites/default/files/ludnosc._stan_i_struktura_oraz_ruch_naturalny_w_przekroju_terytorialnym_na_31.12.2020_0.pdf (accessed on 7 November 2022).
- McKinlay, S.M.; Brambilla, D.J.; Posner, J.G. The normal menopause transition. Am. J. Hum. Biol. 1992, 4, 37–46. [Google Scholar] [CrossRef] [PubMed]
- Parikh, R.M.; Mohan, V. Changing definitions of metabolic syndrome. Indian J. Endocrinol. Metab. 2012, 16, 7–12. [Google Scholar] [CrossRef]
- Yin, Q.; Chen, X.; Li, L.; Zhou, R.; Huang, J.; Yang, D. Apolipoprotein B/apolipoprotein A1 ratio is a good predictive marker of metabolic syndrome and pre-metabolic syndrome in Chinese adolescent women with polycystic ovary syndrome. J. Obstet. Gynaecol. Res. 2012, 39, 203–209. [Google Scholar] [CrossRef]
- Vidigal, F.d.C.; Ribeiro, A.Q.; Babio, N.; Salas-Salvadó, J.; Bressan, J. Prevalence of metabolic syndrome and pre-metabolic syndrome in health professionals: LATINMETS Brazil study. Diabetol. Metab. Syndr. 2015, 7, 6. [Google Scholar] [CrossRef]
- Lipsy, R.J. The National Cholesterol Education Program Adult Treatment Panel III guidelines. J. Manag. Care Pharm. 2003, 9, 2–5. [Google Scholar]
- Anagnostis, P.; Lambrinoudaki, I.; Stevenson, J.C.; Goulis, D.G. Menopause-associated risk of cardiovascular disease. Endocr. Connect. 2022, 11, e210537. [Google Scholar] [CrossRef]
- Wang, Q.; Ferreira, D.L.S.; Nelson, S.M.; Sattar, N.; Ala-Korpela, M.; Lawlor, D.A. Metabolic characterization of menopause: Cross-sectional and longitudinal evidence. BMC Med. 2018, 16, 17. [Google Scholar] [CrossRef]
- Gurka, M.J.; Vishnu, A.; Santen, R.J.; DeBoer, M.D. Progression of metabolic syndrome severity during the menopausal tran-sition. J. Am. Heart Assoc. 2016, 5, e003609. [Google Scholar] [CrossRef] [PubMed]
- Reed, S.D.; Lampe, J.W.; Qu, C.; Copeland, W.K.; Gundersen, G.; Fuller, S.; Newton, K.M. Premenopausal vasomotor symptoms in an ethnically diverse population. Menopause 2014, 21, 153–158. [Google Scholar] [CrossRef] [PubMed]
- Juppi, H.-K.; Sipilä, S.; Cronin, N.J.; Karvinen, S.; Karppinen, J.E.; Tammelin, T.H.; Aukee, P.; Kovanen, V.; Kujala, U.M.; Laakkonen, E.K. Role of Menopausal Transition and Physical Activity in Loss of Lean and Muscle Mass: A Follow-Up Study in Middle-Aged Finnish Women. J. Clin. Med. 2020, 9, 1588. [Google Scholar] [CrossRef] [PubMed]
- Janssen, I.; Powell, L.H.; Matthews, K.A.; Jasielec, M.S.; Hollenberg, S.M.; Bromberger, J.T.; Sutton-Tyrrell, K.; Everson-Rose, S.A. Relation of Persistent Depressive Symptoms to Coronary Artery Calcification in Women Aged 46 to 59 Years. Am. J. Cardiol. 2016, 117, 1884–1889. [Google Scholar] [CrossRef]
- Lambrinoudaki, I.; Christodoulakos, G.; Rizos, D.; Economou, E.; Argeitis, J.; Vlachou, S.; Creatsa, M.; Kouskouni, E.; Botsis, D. Endogenous sex hormones and risk factors for atherosclerosis in healthy Greek postmenopausal women. Eur. J. Endocrinol. 2006, 154, 907–916. [Google Scholar] [CrossRef]
- Golden, S.H.; Dobs, A.S.; Vaidya, D.; Szklo, M.; Gapstur, S.; Kopp, P.; Liu, K.; Ouyang, P. Endogenous Sex Hormones and Glucose Tolerance Status in Postmenopausal Women. J. Clin. Endocrinol. Metab. 2007, 92, 1289–1295. [Google Scholar] [CrossRef]
- Sutton-Tyrrell, K.; Wildman, R.P.; Matthews, K.; Chae, C.; Lasley, B.L.; Brockwell, S.; Pasternak, R.C.; Lloyd-Jones, D.; Sowers, M.F.; Torréns, J.I.; et al. Sex-hormone-binding globulin and the free androgen index are related to cardio-vascular risk factors in multiethnic premenopausal and perimenopausal women enrolled in the Study of Women Across the Nation (SWAN). Circulation 2005, 111, 1242–1249. [Google Scholar] [CrossRef]
- Colpani, V.; Baena, C.P.; Jaspers, L.; van Dijk, G.M.; Farajzadegan, Z.; Dhana, K.; Tielemans, M.J.; Voortman, T.; Freak-Poli, R.; Veloso, G.G.V.; et al. Lifestyle factors, cardiovascular disease and all-cause mortality in middle-aged and elderly women: A systematic review and meta-analysis. Eur. J. Epidemiol. 2018, 33, 831–845. [Google Scholar] [CrossRef]
- Chen, Y.; Wang, A.M.; Zhang, X.M.; Xia, F.M.; Zhao, X. Effect of age at menopause and menopause itself on high sensitivity C-reactive protein, pulse wave velocity, and carotid intima-media thickness in a Chinese population. Medicine 2023, 102, e35629. [Google Scholar] [CrossRef]
- Choi, H.R.; Chang, Y.; Kim, Y.; Cho, Y.; Kwon, M.-J.; Kang, J.; Kwon, R.; Lim, G.-Y.; Kim, K.-H.; Kim, H.M.; et al. Vasomotor and other menopause symptoms and the prevalence of ideal cardiovascular health metrics among premenopausal stage women. Menopause 2023, 30, 750–757. [Google Scholar] [CrossRef]
- Thurston, R.C. Vasomotor symptoms and cardiovascular health: Findings from the SWAN and the MsHeart/MsBrain studies. Climacteric 2023, 1–6. [Google Scholar] [CrossRef] [PubMed]
- Ama Moor, V.J.; Nansseu, J.R.; Nouaga, M.E.; Noubiap, J.J.; Nguetsa, G.D.; Tchanana, G.; Ketcha, A.; Fokom-Domgue, J. Assessment of the 10-year risk of cardiovascular events among a group of sub-Saharan African post-menopausal women. Cardiol. J. 2016, 23, 123–131. [Google Scholar] [CrossRef] [PubMed]
- Zhou, H.; Zhang, C.; Ni, J.; Han, X. Prevalence of cardiovascular risk factors in non-menopausal and postmenopausal inpatients with type 2 diabetes mellitus in China. BMC Endocr. Disord. 2019, 19, 98. [Google Scholar] [CrossRef] [PubMed]
- Shen, C.; Wen, J.; Pan, X.; Su, J.; Du, W.; Pan, E.; Zhang, Q.; Zhang, N.; Sheng, H.; Liu, C.; et al. Age at menarche and age at natural menopause as predictors of glycemic control in type 2 diabetic patients. J. Diabetes Its Complicat. 2018, 32, 623–629. [Google Scholar] [CrossRef]
- Walton, C.; Godsland, I.F.; Proudler, A.J.; Wynn, V.; Stevenson, J.C. The effects of the menopause on insulin sensitivity, secretion and elimination in non-obese, healthy women. Eur. J. Clin. Investig. 1993, 23, 466–473. [Google Scholar] [CrossRef]
- Huang, C.-H.; Li, C.-L.; Kor, C.-T.; Chang, C.-C. Menopausal symptoms and risk of coronary heart disease in middle-aged women: A nationwide population-based cohort study. PLoS ONE 2018, 13, e0206036. [Google Scholar] [CrossRef]
- Akinkuolie, A.O.; Buring, J.E.; Ridker, P.M.; Mora, S. A Novel Protein Glycan Biomarker and Future Cardiovascular Disease Events. J. Am. Hear. Assoc. 2014, 3, e001221. [Google Scholar] [CrossRef]
- Cho, G.J.; Lee, J.H.; Park, H.T.; Shin, J.H.; Hong, S.C.; Kim, T.; Hur, J.Y.; Lee, K.W.; Park, Y.K.; Kim, S.H. Postmenopausal status according to years since menopause as an independent risk factor for the metabolic syndrome. Menopause 2008, 15, 524–529. [Google Scholar] [CrossRef]
- Anagnostis, P.; Goulis, D.G. Menopause and its Cardiometabolic Consequences: Current Perspectives. Curr. Vasc. Pharmacol. 2019, 17, 543–545. [Google Scholar] [CrossRef]
- Zhu, D.; Chung, H.-F.; Dobson, A.J.; Pandeya, N.; Giles, G.G.; Bruinsma, F.; Brunner, E.J.; Kuh, D.; Hardy, R.E.; Avis, N.; et al. Age at natural menopause and risk of incident cardiovascular disease: A pooled analysis of individual patient data. Lancet Public Health 2019, 4, e553–e564. [Google Scholar] [CrossRef]
- Hu, F.B.; Grodstein, F.; Hennekens, C.H.; Colditz, G.A.; Johnson, M.; Manson, J.E.; Rosner, B.; Stampfer, M.J. Age at Natural Menopause and Risk of Cardiovascular Disease. Arch. Intern. Med. 1999, 159, 1061–1066. [Google Scholar] [CrossRef] [PubMed]
- Kok, H.S.; van Asselt, K.M.; van der Schouw, Y.T.; van der Tweel, I.; Peeters, P.H.; Wilson, P.W.; Pearson, P.L.; Grobbee, D.E. Heart Disease Risk Determines Menopausal Age Rather Than the Reverse. J. Am. Coll. Cardiol. 2006, 47, 1976–1983. [Google Scholar] [CrossRef] [PubMed]
- Zhu, D.; Chung, H.F.; Pandeya, N.; Dobson, A.J.; Hardy, R.; Kuh, D.; Brunner, E.J.; Bruinsma, F.; Giles, G.G.; Demakakos, P.; et al. Premenopausal cardiovascular disease and age at natural menopause: A pooled analysis of over 170,000 women. Eur. J. Epidemiol. 2019, 34, 235–246. [Google Scholar] [CrossRef] [PubMed]
- Roa-Díaz, Z.M.; Raguindin, P.F.; Bano, A.; Laine, J.E.; Muka, T.; Glisic, M. Menopause and cardiometabolic diseases: What we (don’t) know and why it matters. Maturitas 2021, 152, 48–56. [Google Scholar] [CrossRef]
- Tao, X.-Y.; Zuo, A.-Z.; Wang, J.-Q.; Tao, F.-B. Effect of primary ovarian insufficiency and early natural menopause on mortality: A meta-analysis. Climacteric 2016, 19, 27–36. [Google Scholar] [CrossRef]
- Armeni, A.; Anagnostis, P.; Armeni, E.; Mili, N.; Goulis, D.; Lambrinoudaki, I. Vasomotor symptoms and risk of cardiovascular disease in peri- and postmenopausal women: A systematic review and meta-analysis. Maturitas 2023, 171, 13–20. [Google Scholar] [CrossRef]


| Variables | Perimenopausal (n = 62) | Postmenopausal (n = 173) | tdf=233 | p-Value * | ||
|---|---|---|---|---|---|---|
| M | SD | M | SD | |||
| Age (years) | 48.73 | 2.96 | 56.44 | 4.13 | −13.502 | <0.001 |
| Age at menopause (years) | - | - | 48.76 | 4.45 | - | - |
| Time since menopause (years) | - | - | 7.68 | 5.09 | - | - |
| Body mass (kg) | 75.92 | 17.74 | 74.39 | 13.75 | 0.694 | 0.488 |
| BMI (kg/m2) | 28.34 | 5.99 | 28.23 | 5.33 | 0.137 | 0.891 |
| WC (cm) | 88.19 | 13.11 | 89.58 | 12.15 | −0.761 | 0.447 |
| WHtR | 0.54 | 0.08 | 0.55 | 0.08 | −1.029 | 0.305 |
| HbA1c | 5.48 | 1.10 | 5.58 | 0.95 | −0.712 | 0.477 |
| Fasting serum glucose (mg/dL) | 90.93 | 38.16 | 93.27 | 35.85 | −0.433 | 0.665 |
| Insulin (µIU/L) | 9.45 | 6.67 | 10.05 | 6.08 | −0.651 | 0.516 |
| Systolic BP (mmHg) | 117.85 | 17.01 | 123.00 | 19.57 | −1.836 | 0.068 |
| Diastolic BP (mmHg) | 77.37 | 10.02 | 77.97 | 10.45 | −0.392 | 0.695 |
| Total cholesterol (mg/dL) | 214.31 | 30.36 | 210.51 | 37.21 | 0.723 | 0.471 |
| LDL-C (mg/dL) | 123.59 | 32.64 | 123.11 | 32.19 | 0.100 | 0.921 |
| HDL-C (mg/dL) | 70.96 | 17.11 | 66.98 | 18.32 | 1.494 | 0.137 |
| TG (mg/dL) | 90.57 | 37.06 | 102.53 | 46.90 | −1.815 | 0.071 |
| TG/HDL ratio | 1.43 | 0.92 | 1.73 | 1.17 | −1.800 | 0.073 |
| TC/HDL ratio | 3.19 | 0.85 | 3.32 | 0.90 | −1.031 | 0.303 |
| LDL/HDL ratio | 1.88 | 0.74 | 1.98 | 0.75 | −0.918 | 0.359 |
| HOMA-IR | 2.52 | 4.26 | 2.47 | 2.26 | 0.110 | 0.913 |
| POL-SCORE 2015 (score) | 0.29 | 0.49 | 1.06 | 1.42 | −4.172 | <0.001 |
| BDI (score) | 7.84 | 5.72 | 7.40 | 7.35 | 0.421 | 0.674 |
| BKMI (score) | 18.27 | 5.48 | 20.31 | 5.48 | −2.504 | 0.013 |
| Variables | All (N = 235) | Perimenopausal (n = 62) | Postmenopausal (n = 173) | χ2 | p-Value ^ | |||
|---|---|---|---|---|---|---|---|---|
| n | % | n | % | n | % | |||
| Hypertension | 115 | 48.94 | 21 | 33.87 | 94 | 54.34 | 7.649 | 0.006 |
| Hyperlipidemia | 183 | 77.87 | 48 | 77.42 | 135 | 78.03 | 0.010 | 0.920 |
| Current smoking | 46 | 19.57 | 13 | 20.97 | 33 | 19.08 | 0.104 | 0.747 |
| Diabetes mellitus | 13 | 5.53 | 2 | 3.23 | 11 | 6.36 | 0.857 | 0.355 |
| General obesity | 74 | 31.49 | 20 | 32.26 | 54 | 31.21 | 0.045 | 0.832 |
| Abdominal obesity | 120 | 51.06 | 29 | 46.77 | 91 | 52.60 | 0.620 | 0.431 |
| BDI—no depression | 178 | 75.74 | 48 | 77.42 | 130 | 75.14 | 1.842 | 0.606 |
| BDI—mild depression | 45 | 19.15 | 12 | 19.35 | 33 | 19.08 | ||
| BDI—moderate depression | 7 | 2.98 | 2 | 3.23 | 5 | 2.89 | ||
| BDI—severe depression | 5 | 2.13 | 0 | 0.00 | 5 | 2.89 | ||
| BKMI—no climacteric symptoms | 146 | 61.13 | 47 | 75.81 | 99 | 57.23 | 8.086 | 0.044 |
| BKMI—mild symptoms | 50 | 21.28 | 6 | 9.68 | 44 | 25.43 | ||
| BKMI—moderate symptoms | 30 | 17.57 | 7 | 11.29 | 23 | 13.29 | ||
| BKMI—severe symptoms | 9 | 3.83 | 2 | 3.23 | 7 | 4.05 | ||
| MetS—no MetS | 41 | 17.45 | 15 | 24.19 | 26 | 15.03 | 4.601 | 0.100 |
| MetS—pre-MetS | 170 | 72.34 | 44 | 70.97 | 126 | 72.83 | ||
| MetS—MetS | 24 | 10.22 | 3 | 4.84 | 21 | 12.14 | ||
| Variables | All | Perimenopausal (n = 62) | Postmenopausal (n = 173) | ||||
|---|---|---|---|---|---|---|---|
| n | % | n | % | n | % | ||
| ASCVD Risk Calculator | Low risk | 204 | 86.8 | 60 | 96.8 | 144 | 83.2 |
| Moderate risk | 22 | 9.3 | 1 | 1.7 | 21 | 12.1 | |
| High risk | 9 | 3.8 | 1 | 1.7 | 8 | 4.6 | |
| POL-SCORE 2015 | Low risk | 196 | 83.4 | 61 | 98.4 | 135 | 78.0 |
| Moderate risk | 31 | 13.2 | 1 | 1.6 | 30 | 17.3 | |
| High risk | 8 | 3.4 | 0 | 0 | 8 | 4.6 | |
| SCORE-2 * | Low risk | 187 | 84.23 | 58 | 96.67 | 129 | 79.63 |
| Moderate risk | 29 | 13.06 | 2 | 3.33 | 27 | 16.67 | |
| High risk | 6 | 2.7 | 0 | 0 | 6 | 3.7 | |
| POL-SCORE 2015 | ||||||
|---|---|---|---|---|---|---|
| Model | Variables | OR | −95%CI | +95%CI | Wald’s Statistics | p-Value |
| Model 0 | Intercept | 0.016 | 0.002 | 0.118 | 16.627 | <0.001 |
| Group (pre vs. post) | 17.170 | 2.304 | 127.958 | 7.698 | 0.006 | |
| Model 1 | Intercept | 0.113 | 0.057 | 0.224 | 38.711 | <0.001 |
| General obesity | 2.115 | 0.507 | 8.814 | 1.058 | 0.304 | |
| Abdominal obesity | 1.858 | 0.908 | 3.801 | 2.880 | 0.090 | |
| Model 2 | Intercept | 0.005 | 0.000 | 0.145 | 9.609 | 0.002 |
| WC [cm] | 1.015 | 0.987 | 1.044 | 1.091 | 0.296 | |
| HbA1c [%] | 1.394 | 1.026 | 1.895 | 4.510 | 0.034 | |
| LDL-C [mg/dL] | 1.000 | 0.989 | 1.012 | 0.001 | 0.972 | |
| TG [mg/dL] | 1.004 | 0.996 | 1.011 | 0.988 | 0.320 | |
| Model 3 | Intercept | 0.127 | 0.043 | 0.375 | 13.950 | <0.001 |
| Diabetes | 2.034 | 0.476 | 8.694 | 0.918 | 0.338 | |
| MetS (no MetS vs. pre-MetS) | 1.389 | 0.450 | 4.286 | 0.326 | 0.568 | |
| MetS (no MetS vs. MetS) | 8.765 | 2.074 | 37.040 | 8.714 | 0.003 | |
| BDI score | 0.975 | 0.922 | 1.031 | 0.807 | 0.369 | |
| Model 4 | Intercept | 0.103 | 0.033 | 0.328 | 14.846 | <0.001 |
| General obesity | 3.137 | 0.729 | 13.491 | 2.359 | 0.125 | |
| Abdominal obesity | 1.462 | 0.611 | 3.495 | 0.728 | 0.393 | |
| Diabetes | 2.083 | 0.484 | 8.962 | 0.972 | 0.324 | |
| MetS (no MetS vs. pre-MetS) | 1.011 | 0.280 | 3.653 | 0.000 | 0.987 | |
| MetS (no MetS vs. MetS) | 6.586 | 1.290 | 33.635 | 5.133 | 0.023 | |
| BDI score | 0.975 | 0.921 | 1.033 | 0.725 | 0.395 | |
| Model | Variables | SCORE-2 | ||||
|---|---|---|---|---|---|---|
| Beta (β) | −95% CI | +95% CI | t | p | ||
| Model 0 | Intercept | 78.169 | <0.001 | |||
| Group (pre vs. post) | 0.067 | −0.062 | 0.195 | 1.020 | 0.309 | |
| Model 1 | Intercept | 87.409 | <0.001 | |||
| General obesity | 0.085 | −0.212 | 0.382 | 0.564 | 0.573 | |
| Abdominal obesity | 0.073 | −0.055 | 0.201 | 1.117 | 0.265 | |
| Model 2 | Intercept | 8.623 | <0.001 | |||
| WC [cm] | 0.004 | −0.101 | 0.109 | 0.076 | 0.940 | |
| HbA1C [%] | 0.073 | −0.036 | 0.182 | 1.315 | 0.190 | |
| TG [mg/dL] | 0.563 | 0.454 | 0.672 | 10.166 | <0.001 | |
| Model 3 | Intercept | 55.744 | <0.001 | |||
| BDI (score) | 0.004 | −0.118 | 0.126 | 0.071 | 0.944 | |
| MetS (no MetS vs. pre-MetS) | −0.230 | −0.374 | −0.087 | −3.163 | 0.002 | |
| MetS (no MetS vs. MetS) | 0.412 | 0.268 | 0.556 | 5.634 | <0.001 | |
| Model 4 | Intercept | 55.800 | <0.001 | |||
| General obesity | 0.136 | −0.144 | 0.416 | 0.959 | 0.339 | |
| Abdominal obesity | −0.047 | −0.184 | 0.091 | −0.671 | 0.503 | |
| BDI (score) | −0.010 | −0.131 | 0.112 | −0.161 | 0.873 | |
| MetS (no MetS vs. pre-MetS) | −0.205 | −0.351 | −0.060 | −2.777 | 0.006 | |
| MetS (no MetS vs. MetS) | 0.445 | 0.295 | 0.595 | 5.852 | <0.001 | |
| Model | Variables | ASCVD Risk Calculator | ||||
|---|---|---|---|---|---|---|
| OR | −95%CI | +95%CI | Wald’s Statistics | p-Value | ||
| Model 1 | Intercept | 0.164 | 0.079 | 0.342 | 23.202 | <0.001 |
| General obesity | 0.000 | 0.000 | 0.000 | 1213.184 | <0.001 | |
| Abdominal obesity | 1.128 | 0.502 | 2.535 | 0.086 | 0.770 | |
| Model 2 | Intercept | 0.001 | 0.000 | 0.041 | 11.431 | 0.001 |
| WC [cm] | 1.000 | 0.964 | 1.038 | 0.000 | 0.987 | |
| HbA1c [%] | 2.748 | 1.626 | 4.643 | 14.258 | <0.001 | |
| TG [mg/dL] | 1.001 | 0.992 | 1.011 | 0.085 | 0.771 | |
| Model 3 | Intercept | 0.077 | 0.017 | 0.343 | 11.309 | 0.001 |
| Mets (no MetS vs. pre-Mets) | 1.484 | 0.316 | 6.972 | 0.250 | 0.617 | |
| Mets (no MetS vs. Mets) | 19.138 | 3.522 | 103.979 | 11.684 | 0.001 | |
| BDI (score) | 1.012 | 0.956 | 1.072 | 0.171 | 0.679 | |
| Model 4 | Intercept | 0.066 | 0.014 | 0.312 | 11.763 | 0.001 |
| General obesity | 0.000 | 0.000 | 0.000 | 822.633 | <0.001 | |
| Abdominal obesity | 0.562 | 0.205 | 1.540 | 1.254 | 0.263 | |
| Mets (no MetS vs. pre-Mets) | 1.794 | 0.342 | 9.418 | 0.478 | 0.489 | |
| Mets (no MetS vs. Mets) | 25.623 | 3.885 | 169.002 | 11.357 | 0.001 | |
| BDI (score) | 1.022 | 0.964 | 1.082 | 0.520 | 0.471 | |
| Model | Variables | POL-SCORE | |||||
|---|---|---|---|---|---|---|---|
| b | OR | −95%CI | +95%CI | Wald’s Statistics | p-Value | ||
| Model 0 | Intercept | −2.556 | 0.078 | 0.001 | 4.429 | 1.535 | 0.215 |
| Age at menopause | 0.026 | 1.027 | 0.946 | 1.115 | 0.395 | 0.529 | |
| Model 1 | Intercept | −20.530 | 0.000 | 0.000 | 0.000 | 25.236 | <0.001 |
| Age at menopause | 0.324 | 1.382 | 1.200 | 1.592 | 20.145 | <0.001 | |
| Time since menopause (years) | 0.386 | 1.471 | 1.283 | 1.686 | 30.624 | <0.001 | |
| Model 2 | Intercept | −20.015 | 0.000 | 0.000 | 0.000 | 23.144 | <0.001 |
| Age at menopause | 0.323 | 1.381 | 1.199 | 1.591 | 19.942 | <0.001 | |
| Time since menopause (years) | 0.390 | 1.477 | 1.287 | 1.696 | 30.846 | <0.001 | |
| BKMI (score) | −0.026 | 0.975 | 0.897 | 1.059 | 0.365 | 0.546 | |
| Model 3 | Intercept | −20.818 | 0.000 | 0.000 | 0.000 | 23.025 | <0.001 |
| MetS (no MetS vs. pre-MetS) | 0.237 | 1.267 | 0.294 | 5.467 | 0.101 | 0.751 | |
| MetS (no MetS vs. MetS) | 2.364 | 10.631 | 1.840 | 61.438 | 6.975 | 0.008 | |
| Age at menopause | 0.332 | 1.394 | 1.202 | 1.618 | 19.206 | <0.001 | |
| Time since menopause (years) | 0.371 | 1.449 | 1.260 | 1.666 | 27.121 | <0.001 | |
| BKMI (score) | −0.028 | 0.973 | 0.891 | 1.062 | 0.388 | 0.534 | |
| Model 4 | Intercept | −2.225 | 0.108 | 0.039 | 0.303 | 17.865 | <0.001 |
| MetS (no MetS vs. pre-MetS) | 0.318 | 1.375 | 0.447 | 4.234 | 0.308 | 0.579 | |
| MetS (no MetS vs. MetS) | 2.392 | 10.932 | 2.958 | 40.405 | 12.858 | <0.001 | |
| Model | Variables | b | OR | −95%CI | +95%CI | Wald’s Statistics | p-Value |
|---|---|---|---|---|---|---|---|
| Model 0 | Intercept | 0.289 | 0.591 | ||||
| Age at menopause | −0.008 | 0.992 | 0.907 | 1.085 | 0.033 | 0.856 | |
| Model 1 | Intercept | 11.476 | 0.001 | ||||
| Age at menopause | 0.170 | 1.186 | 1.047 | 1.343 | 7.156 | 0.007 | |
| Time since menopause (years) | 0.237 | 1.267 | 1.129 | 1.422 | 16.145 | <0.001 | |
| Model 2 | Intercept | 11.796 | 0.001 | ||||
| Age at menopause | 0.173 | 1.189 | 1.050 | 1.347 | 7.439 | 0.006 | |
| Time since menopause (years) | 0.233 | 1.263 | 1.125 | 1.417 | 15.738 | <0.001 | |
| BKMI (score) | 0.027 | 1.027 | 0.949 | 1.112 | 0.443 | 0.506 | |
| Model 3 | Intercept | 11.478 | 0.001 | ||||
| MetS (no MetS vs. MetS) | 2.593 | 13.371 | 4.260 | 41.964 | 19.747 | <0.001 | |
| Age at menopause | 0.188 | 1.207 | 1.052 | 1.385 | 7.206 | 0.007 | |
| Time since menopause (years) | 0.214 | 1.238 | 1.097 | 1.398 | 11.923 | 0.001 | |
| BKMI (score) | 0.029 | 1.029 | 0.945 | 1.121 | 0.438 | 0.508 | |
| Model 4 | Intercept | 11.969 | 0.001 | ||||
| Abdominal obesity (no vs. yes) | −0.832 | 0.435 | 0.153 | 1.236 | 2.440 | 0.118 | |
| MetS (no MetS vs. MetS) | 2.831 | 16.967 | 5.013 | 57.427 | 20.715 | <0.001 | |
| Age at menopause | 0.202 | 1.223 | 1.061 | 1.410 | 7.740 | 0.005 | |
| Time since menopause (years) | 0.231 | 1.260 | 1.110 | 1.431 | 12.814 | <0.001 | |
| BKMI (score) | 0.044 | 1.045 | 0.958 | 1.139 | 0.970 | 0.325 | |
| Model 5 | Intercept | 65.565 | <0.001 | ||||
| MetS (no MetS vs. MetS) | 2.626 | 13.812 | 4.972 | 38.373 | 25.365 | <0.001 |
Disclaimer/Publisher’s Note: The statements, opinions and data contained in all publications are solely those of the individual author(s) and contributor(s) and not of MDPI and/or the editor(s). MDPI and/or the editor(s) disclaim responsibility for any injury to people or property resulting from any ideas, methods, instructions or products referred to in the content. |
© 2023 by the authors. Licensee MDPI, Basel, Switzerland. This article is an open access article distributed under the terms and conditions of the Creative Commons Attribution (CC BY) license (https://creativecommons.org/licenses/by/4.0/).
Share and Cite
Kamińska, M.S.; Schneider-Matyka, D.; Rachubińska, K.; Panczyk, M.; Grochans, E.; Cybulska, A.M. Menopause Predisposes Women to Increased Risk of Cardiovascular Disease. J. Clin. Med. 2023, 12, 7058. https://doi.org/10.3390/jcm12227058
Kamińska MS, Schneider-Matyka D, Rachubińska K, Panczyk M, Grochans E, Cybulska AM. Menopause Predisposes Women to Increased Risk of Cardiovascular Disease. Journal of Clinical Medicine. 2023; 12(22):7058. https://doi.org/10.3390/jcm12227058
Chicago/Turabian StyleKamińska, Magdalena Sylwia, Daria Schneider-Matyka, Kamila Rachubińska, Mariusz Panczyk, Elżbieta Grochans, and Anna Maria Cybulska. 2023. "Menopause Predisposes Women to Increased Risk of Cardiovascular Disease" Journal of Clinical Medicine 12, no. 22: 7058. https://doi.org/10.3390/jcm12227058
APA StyleKamińska, M. S., Schneider-Matyka, D., Rachubińska, K., Panczyk, M., Grochans, E., & Cybulska, A. M. (2023). Menopause Predisposes Women to Increased Risk of Cardiovascular Disease. Journal of Clinical Medicine, 12(22), 7058. https://doi.org/10.3390/jcm12227058