
Enhancing Cardiovascular Health and Functional Recovery in Stroke Survivors: A Randomized Controlled Trial of Stroke-Specific and Cardiac Rehabilitation Protocols for Optimized Rehabilitation

Abstract
1. Introduction:
2. Methodology
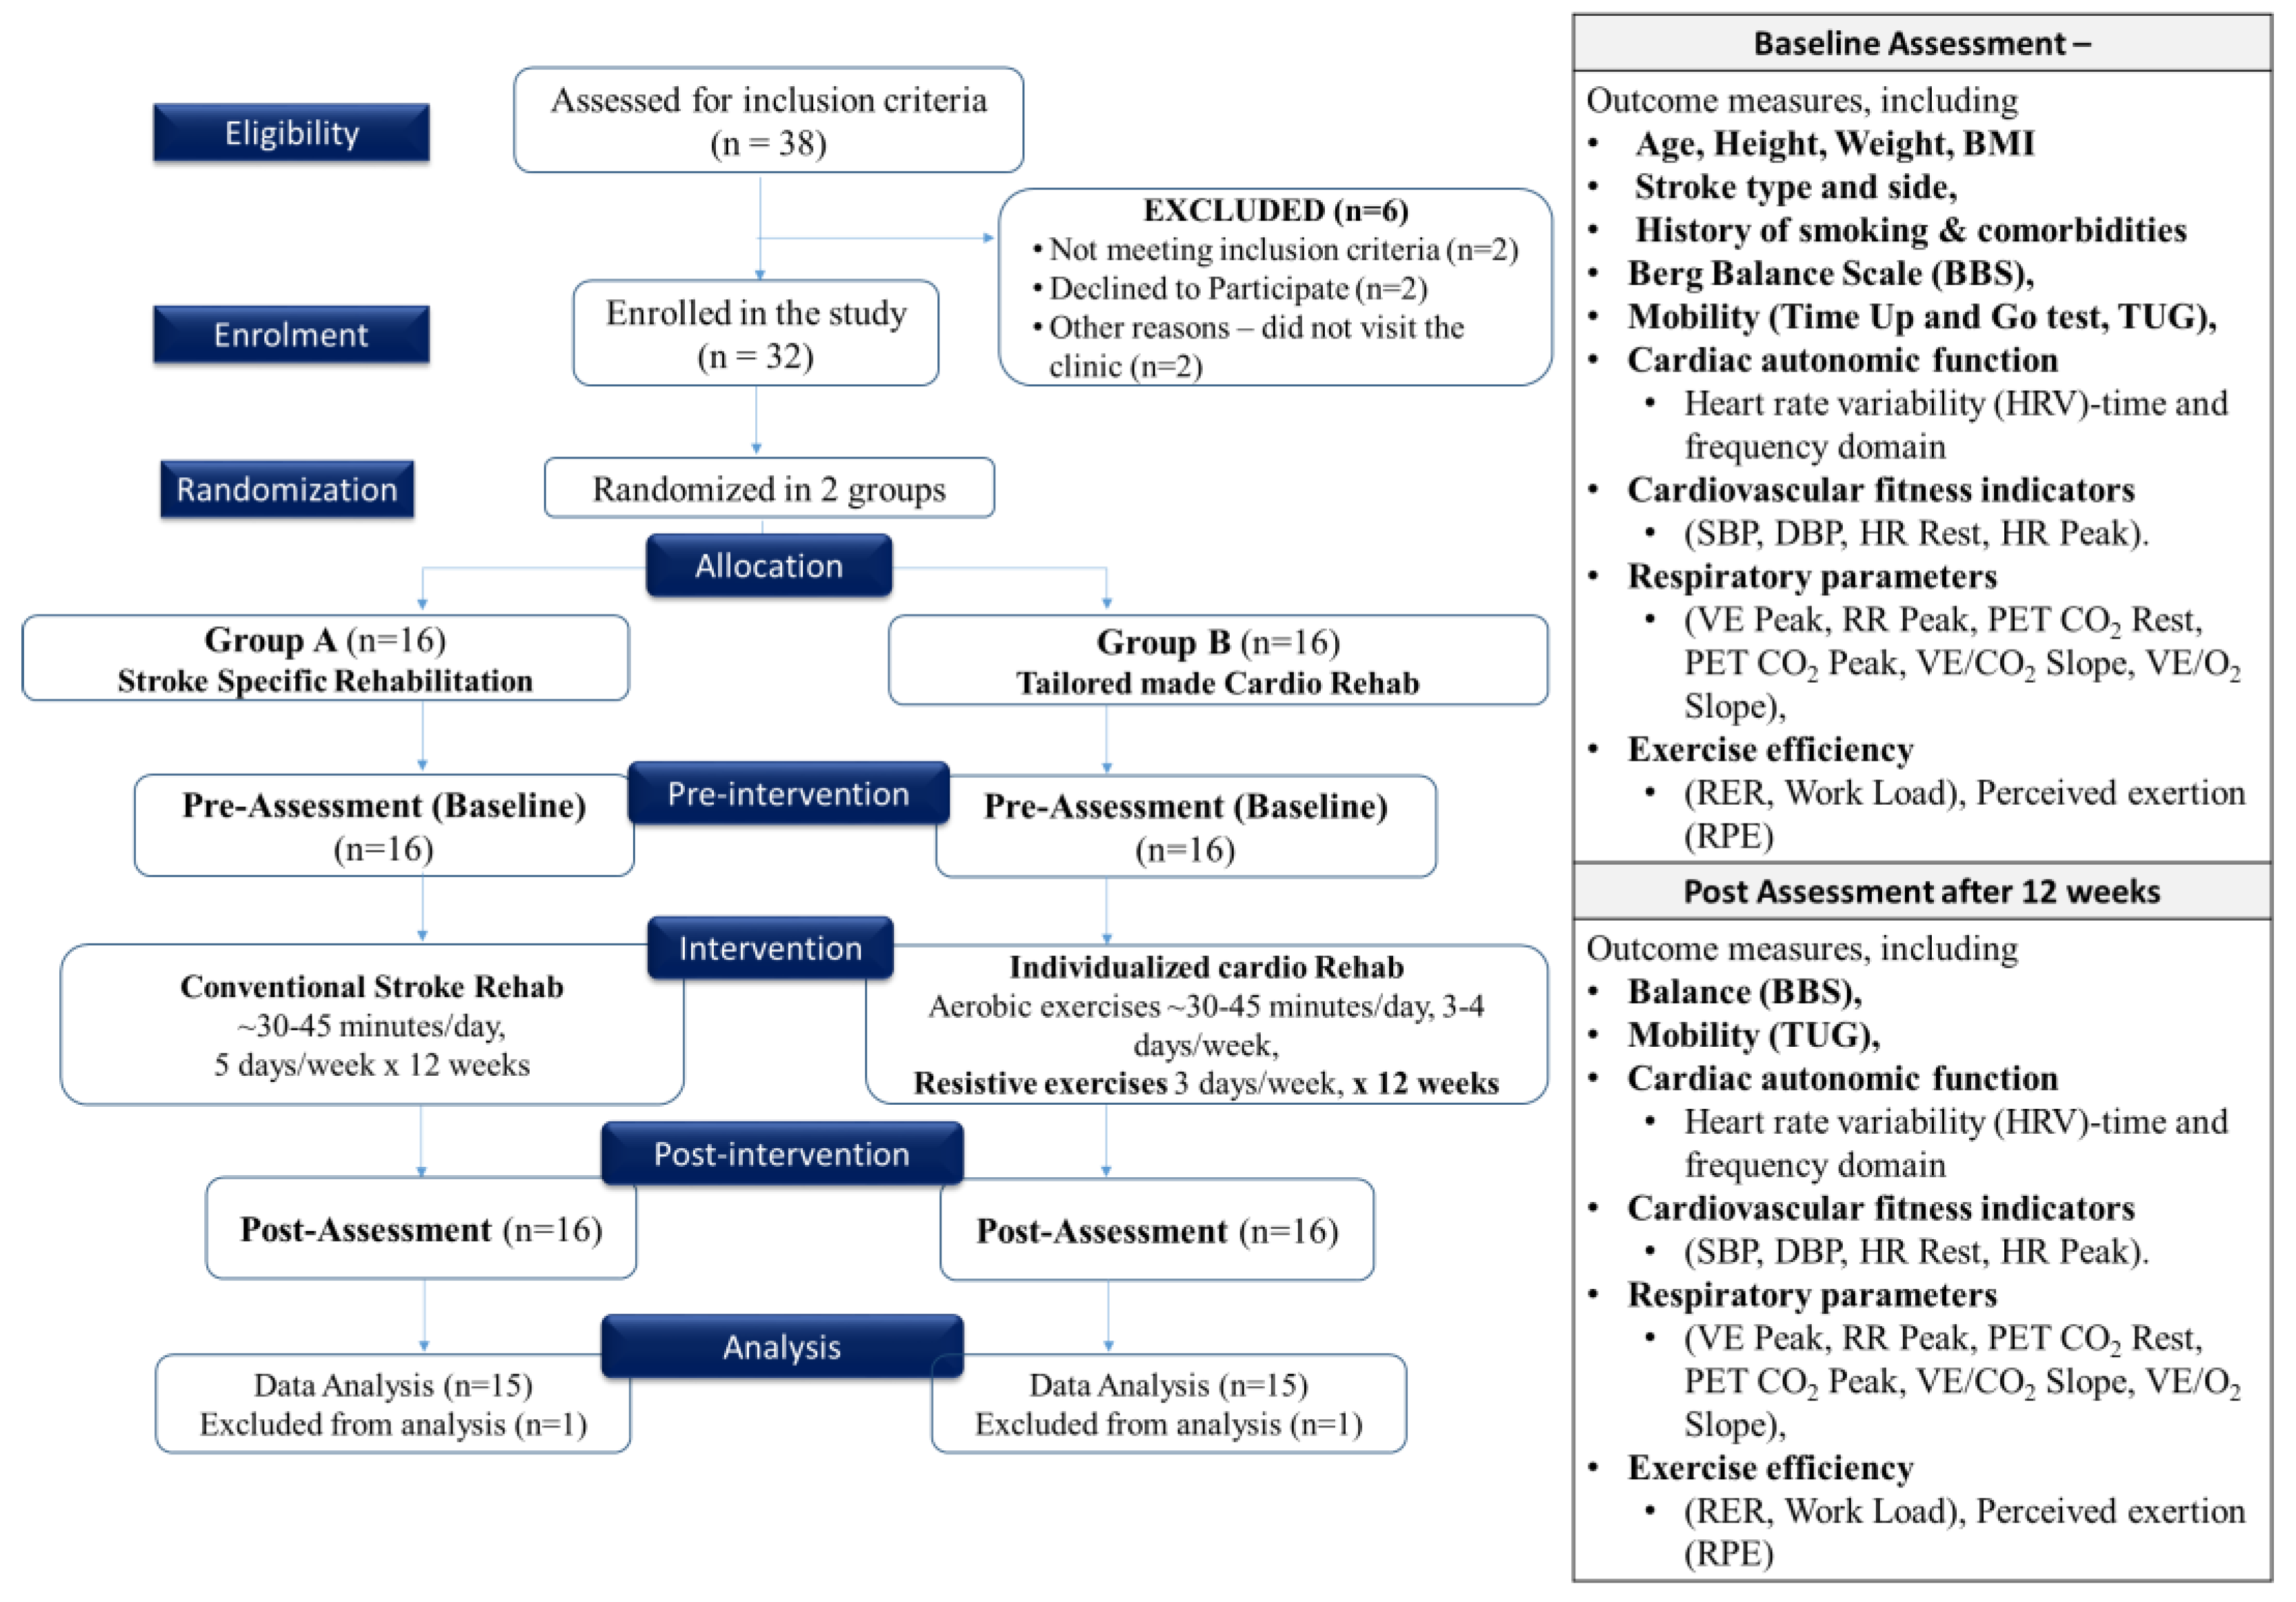
2.1. Study Design
2.2. Sample Size Calculation
2.3. Sampling Technique
2.4. Participants
2.5. Inclusion Criteria
2.6. Exclusion Criteria
2.7. Outcome Measures Evaluation
2.8. Stroke-Specific Rehabilitation Protocol
2.9. Individualized Cardiac Rehabilitation Exercise Protocol
2.10. Data Collection and Analysis
3. Results
4. Discussion
5. Conclusions
Author Contributions
Funding
Institutional Review Board Statement
Informed Consent Statement
Data Availability Statement
Acknowledgments
Conflicts of Interest
References
- Benjamin, E.J.; Muntner, P.; Alonso, A.; Bittencourt, M.S.; Callaway, C.W.; Carson, A.P.; Chamberlain, A.M.; Chang, A.R.; Cheng, S.; Das, S.R.; et al. Heart disease and stroke statistics—2019 update: A report from the American Heart Association. Circulation 2019, 139, e56–e528. [Google Scholar] [PubMed]
- Rizvi, M.R.; Ali, N.I.; Ahmed, A.I.; Adam, R.A.; Elgak, S.N. Knowledge, Attitude, and Practice of Stroke and Its Risk Factors and Warning Signals among the Students of the College of Applied Medicine at Majmaah University, Saudi Arabia. Biomedicine 2023, 13, 326–332. [Google Scholar] [CrossRef]
- Katan, M.; Luft, A. Global burden of stroke. Semin. Neurol. 2018, 38, 208–211. [Google Scholar] [CrossRef]
- Billinger, S.A.; Coughenour, E.; MacKay-Lyons, M.J.; Ivey, F.M. Reduced cardiorespiratory fitness after stroke: Biological consequences and exercise-induced adaptations. Stroke Res. Treat. 2012, 2012, 959120. [Google Scholar] [CrossRef] [PubMed]
- Esterov, D.; Greenwald, B.D. Autonomic dysfunction after mild traumatic brain injury. Brain Sci. 2017, 7, 100. [Google Scholar] [CrossRef] [PubMed]
- Chaitra, B.; Narhare, P.; Puranik, N.; Maitri, V. Moderate intensity aerobics training improves pulmonary function in young Indian men. Biomed. Res. 2012, 23, 231–233. [Google Scholar]
- Hoegg, S.; Elsner, B.; Saunders, D.H.; Wijck, F.; Mehrholz, J. Resistive strength training for arm rehabilitation after stroke. Cochrane Database Syst. Rev. 2021, 2021, CD014279. [Google Scholar] [CrossRef]
- Taylor, R.S.; Walker, S.; Smart, N.A.; Piepoli, M.F.; Warren, F.C.; Ciani, O.; O’Connor, C.; Whellan, D.; Keteyian, S.J.; Coats, A.; et al. Impact of exercise-based cardiac rehabilitation in patients with heart failure (ExTraMATCH II) on mortality and hospitalisation: An individual patient data meta-analysis of randomised trials. Eur. J. Heart Fail. 2018, 20, 1735–1743. [Google Scholar] [CrossRef]
- Billinger, S.A.; Arena, R.; Bernhardt, J.; Eng, J.J.; Franklin, B.A.; Johnson, C.M.; MacKay-Lyons, M.; Macko, R.F.; Mead, G.E.; Roth, E.J.; et al. Physical activity and exercise recommendations for stroke survivors: A statement for healthcare professionals from the American Heart Association/American Stroke Association. Stroke 2014, 45, 2532–2553. [Google Scholar] [CrossRef]
- Regan, E.W.; Handlery, R.; Stewart, J.C.; Pearson, J.L.; Wilcox, S.; Fritz, S. Integrating Survivors of Stroke into Exercise-Based Cardiac Rehabilitation Improves Endurance and Functional Strength. J. Am. Heart Assoc. 2021, 10, e017907. [Google Scholar] [CrossRef]
- Sun, X.; Gao, Q.; Dou, H.; Tang, S. Which is better in the rehabilitation of stroke patients, core stability exercises or conventional exercises? J. Phys. Ther. Sci. 2016, 28, 1131–1133. [Google Scholar] [CrossRef] [PubMed]
- Shahid, J.; Kashif, A.; Shahid, M.K. A Comprehensive Review of Physical Therapy Interventions for Stroke Rehabilitation: Impairment-Based Approaches and Functional Goals. Brain Sci. 2023, 13, 717. [Google Scholar] [CrossRef] [PubMed]
- Hebert, D.; Lindsay, M.P.; McIntyre, A.; Kirton, A.; Rumney, P.G.; Bagg, S.; Bayley, M.; Dowlatshahi, D.; Dukelow, S.; Garnhum, M.; et al. Canadian stroke best practice recommendations: Stroke rehabilitation practice guidelines, update 2015. Int. J. Stroke 2016, 11, 459–484. [Google Scholar] [CrossRef] [PubMed]
- Rodgers, H.; Price, C. Stroke unit care, inpatient rehabilitation and early supported discharge. Clin. Med. 2017, 17, 173. [Google Scholar] [CrossRef] [PubMed]
- Price, K.J.; Gordon, B.A.; Bird, S.R.; Benson, A.C. A review of guidelines for cardiac rehabilitation exercise programmes: Is there an international consensus? Eur. J. Prev. Cardiol. 2016, 23, 1715–1733. [Google Scholar] [CrossRef]
- Warburton, D.E.; Bredin, S.S. Health benefits of physical activity: A systematic review of current systematic reviews. Curr. Opin. Cardiol. 2017, 32, 541–556. [Google Scholar] [CrossRef]
- Aftyka, J.; Staszewski, J.; Dębiec, A.; Pogoda-Wesołowska, A.; Żebrowski, J. Heart rate variability as a predictor of stroke course, functional outcome, and medical complications: A systematic review. Front. Physiol. 2023, 14, 1115164. [Google Scholar] [CrossRef]
- Chen, Z.; Venkat, P.; Seyfried, D.; Chopp, M.; Yan, T.; Chen, J. Brain–heart interaction: Cardiac complications after stroke. Circ. Res. 2017, 121, 451–468. [Google Scholar] [CrossRef]
- Huang, C.-Y.; Lin, G.-H.; Huang, Y.-J.; Song, C.-Y.; Lee, Y.-C.; How, M.-J.; Chen, Y.-M.; Hsueh, I.-P.; Chen, M.-H.; Hsieh, C.-L. Improving the utility of the Brunnstrom recovery stages in patients with stroke: Validation and quantification. Medicine 2016, 95, e4508. [Google Scholar] [CrossRef]
- Keller, K.; Geyer, M.; Muenzel, T.; Ostad, M.A. Gender-differences in prevalence and outcome of ischemic stroke and promoting factors of atrial thrombi. Artery Res. 2018, 22, 68–78. [Google Scholar] [CrossRef]
- Gowland, C.; Stratford, P.; Ward, M.; Moreland, J.; Torresin, W.; Van Hullenaar, S.; Sanford, J.; Barreca, S.; Vanspall, B.; Plews, N. Measuring physical impairment and disability with the Chedoke-McMaster Stroke Assessment. Stroke 1993, 24, 58–63. [Google Scholar] [CrossRef] [PubMed]
- Botner, E.M.; Miller, W.C.; Eng, J.J. Measurement properties of the Activities-specific Balance Confidence Scale among individuals with stroke. Disabil. Rehabil. 2005, 27, 156–163. [Google Scholar] [CrossRef] [PubMed]
- Rössler, R.; Rommers, N.; Kim, E.-K.; Iendra, L.; Sofios, A.; Giannouli, E.; Portegijs, E.; Rantanen, T.; Infanger, D.; Bridenbaugh, S.; et al. Timed up-and-go performance is associated with objectively measured life space in patients 3 months after ischemic stroke: A cross-sectional observational study. J. Neurol. 2023, 270, 1999–2009. [Google Scholar] [CrossRef] [PubMed]
- Garg, S.; Saini, P.; Rizvi, M.R.; Ahmad, F.; AlTaweel, M.; Sabah, Z.U.; Durrani, H.K.; Almasswary, S.A.; Seyam, M.K.; Sharma, A.; et al. The Cardiac Comeback-Beating Stronger: Exploring the Remarkable Resilience of the Heart in COVID-19 Recovery through Cardiac Autonomic Analysis. Medicina 2023, 59, 1397. [Google Scholar] [CrossRef]
- Marsden, D.L.; Dunn, A.; Callister, R.; Levi, C.R.; Spratt, N.J. Characteristics of exercise training interventions to improve cardiorespiratory fitness after stroke: A systematic review with meta-analysis. Neurorehabilit. Neural Repair 2013, 27, 775–788. [Google Scholar] [CrossRef]
- Da Silva Raquel, D.; Quitério, R.; De Campos, M.; Vieira, S.; Ambrozin, A. Effects of the resisted exercise in the respiratory function of individuals with hemiparesis after stroke. Pulm. Res. Respir. Med. Open J. 2015, 2, 84–89. [Google Scholar] [CrossRef]
- Sage, M.; Middleton, L.E.; Tang, A.; Sibley, K.M.; Brooks, D.; McIlroy, W. Validity of rating of perceived exertion ranges in individuals in the subacute stage of stroke recovery. Top. Stroke Rehabil. 2013, 20, 519–527. [Google Scholar] [CrossRef]
- O’Sullivan, S.B.; Schmitz, T.J.; Fulk, G. Physical Rehabilitation; FA Davis: Philadelphia, PA, USA, 2019. [Google Scholar]
- Mezzani, A.; Hamm, L.F.; Jones, A.M.; McBride, P.E.; Moholdt, T.; Stone, J.A.; Urhausen, A.; Williams, M.A. Aerobic exercise intensity assessment and prescription in cardiac rehabilitation: A joint position statement of the European Association for Cardiovascular Prevention and Rehabilitation, the American Association of Cardiovascular and Pulmonary Rehabilitation and the Canadian Association of Cardiac Rehabilitation. Eur. J. Prev. Cardiol. 2013, 20, 442–467. [Google Scholar]
- Ezeugwu, V.E.; Manns, P.J. Sleep duration, sedentary behavior, physical activity, and quality of life after inpatient stroke rehabilitation. J. Stroke Cerebrovasc. Dis. 2017, 26, 2004–2012. [Google Scholar] [CrossRef]
- Mehrholz, J.; Thomas, S.; Kugler, J.; Pohl, M.; Elsner, B. Electromechanical-assisted training for walking after stroke. Cochrane Database Syst. Rev. 2017, 10, CD006185. [Google Scholar]
- Zanona, A.d.F.; Piscitelli, D.; Seixas, V.M.; Scipioni, K.R.; Bastos, M.S.C.; de Sá, L.C.K.; Monte-Silva, K.; Bolivar, M.; Solnik, S.; De Souza, R.F. Brain-computer interface combined with mental practice and occupational therapy enhances upper limb motor recovery, activities of daily living, and participation in subacute stroke. Front. Neurol. 2023, 13, 1041978. [Google Scholar] [CrossRef] [PubMed]
- Wüest, S.; Borghese, N.A.; Pirovano, M.; Mainetti, R.; van de Langenberg, R.; de Bruin, E.D. Usability and effects of an exergame-based balance training program. Games Health Res. Dev. Clin. Appl. 2014, 3, 106–114. [Google Scholar] [CrossRef] [PubMed]
- Aguiar, L.T.; Nadeau, S.; Martins, J.C.; Teixeira-Salmela, L.F.; Britto, R.R.; Faria, C.D. Efficacy of interventions aimed at improving physical activity in individuals with stroke: A systematic review. Disabil. Rehabil. 2020, 42, 902–917. [Google Scholar] [CrossRef]
- Mo, J.; Huang, L.; Peng, J.; Ocak, U.; Zhang, J.; Zhang, J.H. Autonomic disturbances in acute cerebrovascular disease. Neurosci. Bull. 2019, 35, 133–144. [Google Scholar] [CrossRef] [PubMed]
- Werner, G. Fractals in the nervous system: Conceptual implications for theoretical neuroscience. Front. Physiol. 2010, 1, 1787. [Google Scholar] [CrossRef] [PubMed]
- Woodward, M.; Webster, R.; Murakami, Y.; Barzi, F.; Lam, T.-H.; Fang, X.; Suh, I.; Batty, G.D.; Huxley, R.; Rodgers, A. The association between resting heart rate, cardiovascular disease and mortality: Evidence from 112,680 men and women in 12 cohorts. Eur. J. Prev. Cardiol. 2014, 21, 719–726. [Google Scholar] [CrossRef]
- Hu, L.; Huang, X.; Zhou, W.; You, C.; Liang, Q.; Zhou, D.; Li, J.; Li, P.; Wu, Y.; Wu, Q.; et al. Associations between resting heart rate, hypertension, and stroke: A population-based cross-sectional study. J. Clin. Hypertens. 2019, 21, 589–597. [Google Scholar] [CrossRef]
- Stein, P.K.; Barzilay, J.I.; Chaves, P.H.; Mistretta, S.Q.; Domitrovich, P.P.; Gottdiener, J.S.; Rich, M.W.; Kleiger, R.E. Novel measures of heart rate variability predict cardiovascular mortality in older adults independent of traditional cardiovascular risk factors: The Cardiovascular Health Study (CHS). J. Cardiovasc. Electrophysiol. 2008, 19, 1169–1174. [Google Scholar] [CrossRef]
- Kingsley, J.D.; Figueroa, A. Acute and training effects of resistance exercise on heart rate variability. Clin. Physiol. Funct. Imaging 2016, 36, 179–187. [Google Scholar] [CrossRef]
- Javorka, M.; Zila, I.; Balharek, T.; Javorka, K. Heart rate recovery after exercise: Relations to heart rate variability and complexity. Braz. J. Med. Biol. Res. 2002, 35, 991–1000. [Google Scholar] [CrossRef]
- Suminar, D.A.A.; Basri, M.I.; Tammasse, J.; Bintang, A.K.; Akbar, M. Autonomic dysregulation in acute ischemic stroke patient with insomnia. Med. Clínica Práctica 2021, 4, 100206. [Google Scholar] [CrossRef]
- Sandercock, G.R.; Grocott-Mason, R.; Brodie, D.A. Changes in short-term measures of heart rate variability after eight weeks of cardiac rehabilitation. Clin. Auton. Res. 2007, 17, 39–45. [Google Scholar] [CrossRef] [PubMed]
- Usui, H.; Nishida, Y. The very low-frequency band of heart rate variability represents the slow recovery component after a mental stress task. PLoS ONE 2017, 12, e0182611. [Google Scholar] [CrossRef] [PubMed]
- Günther, A.; Salzmann, I.; Nowack, S.; Schwab, M.; Surber, R.; Hoyer, H.; Witte, O.W.; Hoyer, D. Heart rate variability—A potential early marker of sub-acute post-stroke infections. Acta Neurol. Scand. 2012, 126, 189–196. [Google Scholar] [CrossRef] [PubMed]
- Besnier, F.; Labrunee, M.; Pathak, A.; Pavy-Le Traon, A.; Gales, C.; Senard, J.-M.; Guiraud, T. Exercise training-induced modification in autonomic nervous system: An update for cardiac patients. Ann. Phys. Rehabil. Med. 2017, 60, 27–35. [Google Scholar] [CrossRef]
- Riley, M.S.; Pórszász, J.; Engelen, M.P.; Brundage, B.H.; Wasserman, K. Gas exchange responses to continuous incremental cycle ergometry exercise in primary pulmonary hypertension in humans. Eur. J. Appl. Physiol. 2000, 83, 63–70. [Google Scholar] [CrossRef] [PubMed]
- Wannamethee, S.G.; Shaper, A.G.; Ebrahim, S. Respiratory function and risk of stroke. Stroke 1995, 26, 2004–2010. [Google Scholar] [CrossRef]
- Angane, E.Y.; Navare, A.A. Effects of aerobic exercise on pulmonary function tests in healthy adults. Int. J. Res. Med. Sci. 2017, 4, 2059–2063. [Google Scholar] [CrossRef][Green Version]
- Ramos-Jiménez, A.; Hernández-Torres, R.P.; Torres-Durán, P.V.; Romero-Gonzalez, J.; Mascher, D.; Posadas-Romero, C.; Juárez-Oropeza, M.A. The respiratory exchange ratio is associated with fitness indicators both in trained and untrained men: A possible application for people with reduced exercise tolerance. Clin. Medicine. Circ. Respir. Pulm. Med. 2008, 2, CCRPM-S449. [Google Scholar] [CrossRef]
- Kim, C.; Choi, H.E.; Lee, K.H.; Kim, Y.J.; Lee, S.J. Influence of low peak respiratory exchange ratio on cardiac rehabilitation in patients with coronary artery disease. Ann. Rehabi. Med. 2016, 40, 1114–1123. [Google Scholar] [CrossRef]
- Lefeber, N.; De Keersmaecker, E.; Henderix, S.; Michielsen, M.; Tamburella, F.; Tagliamonte, N.L.; Molinari, M.; de Geus, B.; Kerckhofs, E.; Swinnen, E. Physiological responses and perceived exertion during robot-assisted treadmill walking in non-ambulatory stroke survivors. Disabil. Rehabil. 2021, 43, 1576–1584. [Google Scholar] [CrossRef] [PubMed]


| Variable | Group A | Group B | χ2 (Chi-Square)/ t Value | p Value |
|---|---|---|---|---|
| Age | 59.60 ± 2.72 | 60.40 ± 3.20 | −0.74 | 0.47 |
| Height | 1.47 ± 0.44 | 1.45 ± 0.43 | 1.22 | 0.23 |
| Weight | 65.20 ± 9.72 | 64.80 ± 10.21 | 0.11 | 0.91 |
| BMI | 30.84 ± 1.79 | 30.62 ± 4.12 | 0.19 | 0.85 |
| Stroke type | ||||
| Ischemic | 13 (86.7%) | 11 (73.3%) | 0.83 | 0.36 |
| Hemorrhagic | 2 (13.3%) | 4 (26.7%) | ||
| Side | ||||
| Right | 11 (73.3%) | 12 (80.0%) | 0.19 | 0.67 |
| Left | 4 (26.7%) | 3 (20.0%) | ||
| Smoking | ||||
| Yes | 10 (66.7%) | 14 (93.3%) | 3.33 | 0.17 |
| No | 5 (33.3%) | 1 (5.7%) | ||
| Hypertension | ||||
| Yes | 10 (66.7%) | 11 (73.3%) | 0.16 | 0.69 |
| No | 5 (33.3%) | 4 (26.7%) | ||
| Diabetes | ||||
| Yes | 14 (93.3%) | 12 (80.0%) | 1.15 | 0.28 |
| No | 1 (6.7%) | 3 (20.0%) | ||
| Heart Failure | ||||
| Yes | 12 (80.0%) | 11 (73.3%) | 0.19 | 0.67 |
| No | 3 (20%) | 4 (26.7%) | ||
| Variable | Group A Mean ± SD | Group B Mean ± SD | t-Value | p-Value | 95% CI (Lower–Upper) | |
|---|---|---|---|---|---|---|
| Mean NN | Pre | 819.83 ± 62.12 | 834.72 ± 44.82 | −0.75 | 0.46 | −55.40–25.63 |
| Post | 839.69 ± 52.72 | 910.82 ± 72.93 | −3.06 | 0.01 | −118.73–−23.54 | |
| Resting HR | Pre | 75.27 ± 4.43 | 77.33 ± 6.31 | −1.04 | 0.31 | −6.15–2.01 |
| Post | 72.47 ± 7.07 | 70.13 ± 6.45 | 0.95 | 0.35 | −2.73–7.39 | |
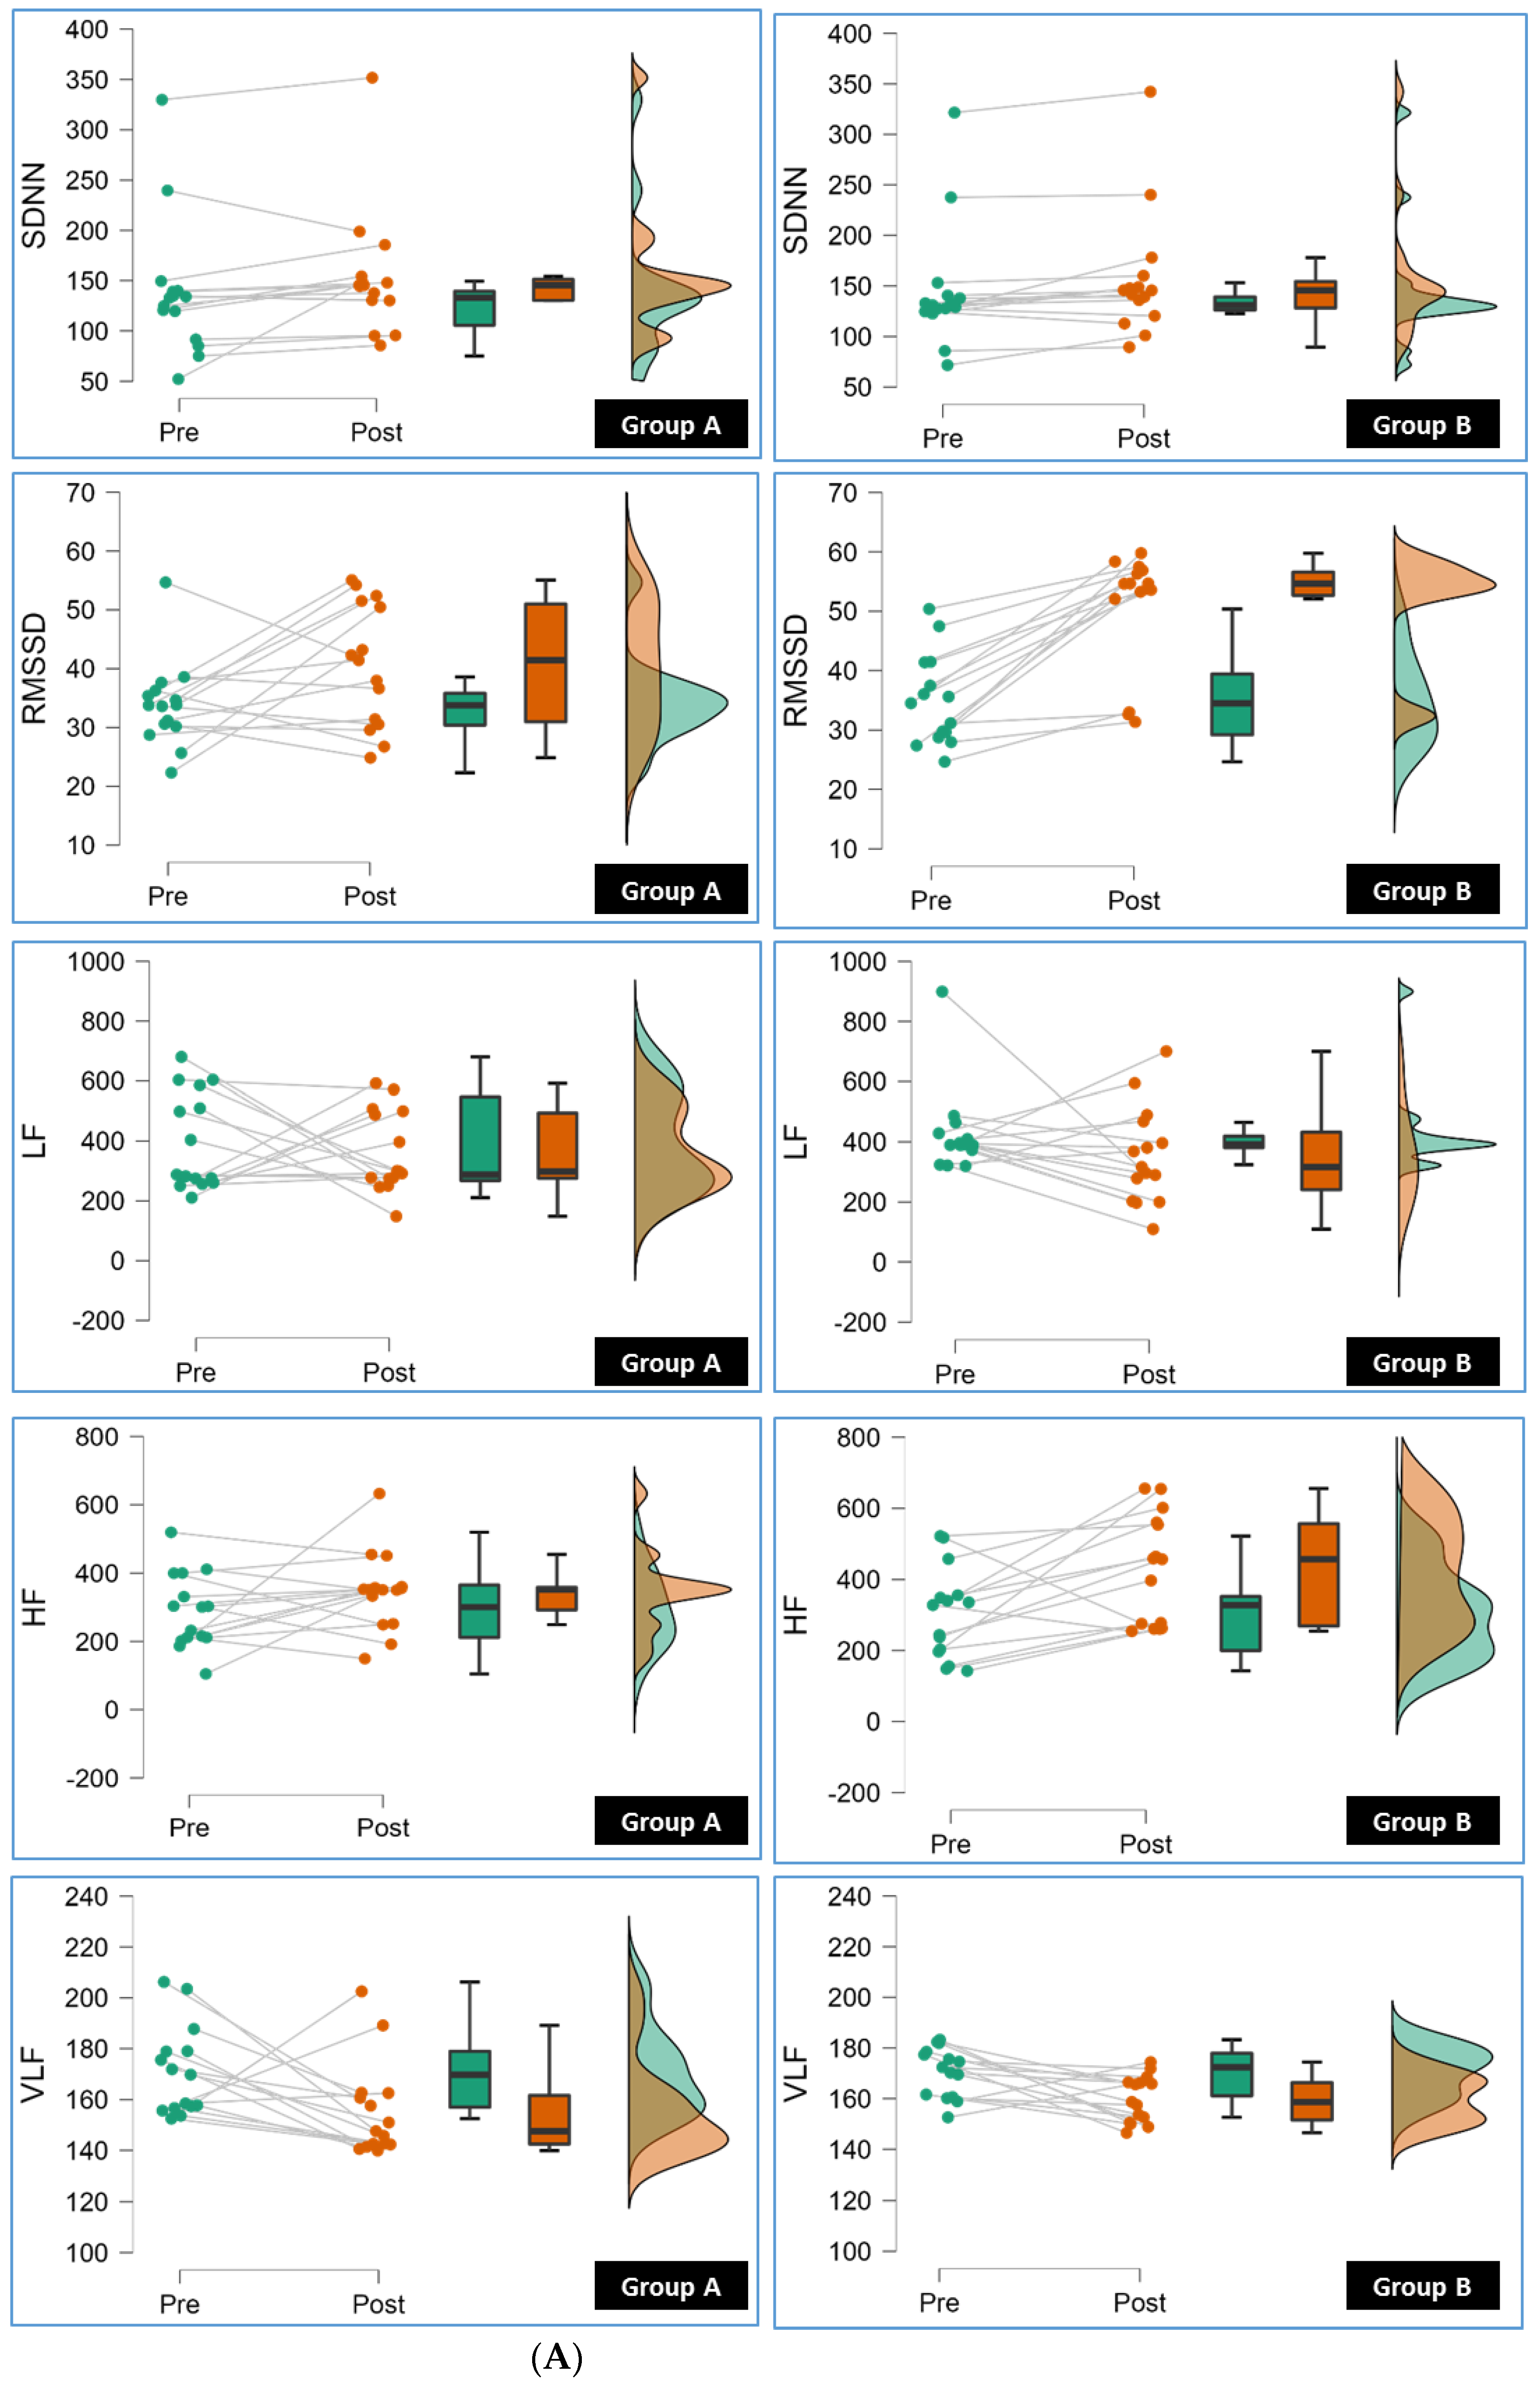
| SDNN | Pre | 137.94 ± 67.82 | 145.08 ± 60.40 | −0.31 | 0.76 | −55.18–40.88 |
| Post | 153.16 ± 62.83 | 156.55 ± 62.17 | −0.15 | 0.88 | −50.14–43.37 | |
| RMSSD | Pre | 33.79 ± 7.26 | 34.91 ± 7.59 | −0.41 | 0.68 | −6.67–4.44 |
| Post | 40.54 ± 10.46 | 50.83 ± 9.80 | −2.78 | 0.01 | −17.87–−2.71 | |
| pNN50 | Pre | 42.52 ± 6.49 | 42.05 ± 5.05 | 0.22 | 0.83 | −3.88–4.82 |
| Post | 43.99 ± 6.19 | 44.68 ± 5.20 | −0.33 | 0.75 | −4.96–3.59 | |
| LF | Pre | 398.73 ± 163.33 | 425.19 ± 139.34 | −0.48 | 0.64 | −140.01–87.09 |
| Post | 361.03 ± 136.36 | 352.56 ± 159.72 | 0.16 | 0.88 | −102.60–119.55 | |
| HF | Pre | 288.85 ± 109.40 | 301.94 ± 127.05 | −0.30 | 0.76 | −101.77–75.59 |
| Post | 346.13 ± 115.41 | 426.07 ± 153.52 | −1.61 | 0.12 | −181.52–21.64 | |
| VLF | Pre | 170.98 ± 17.60 | 170.67 ± 9.75 | 0.06 | 0.95 | −10.34–10.95 |
| Post | 155.27 ± 18.56 | 159.85 ± 9.12 | −0.86 | 0.40 | −15.52–6.36 | |
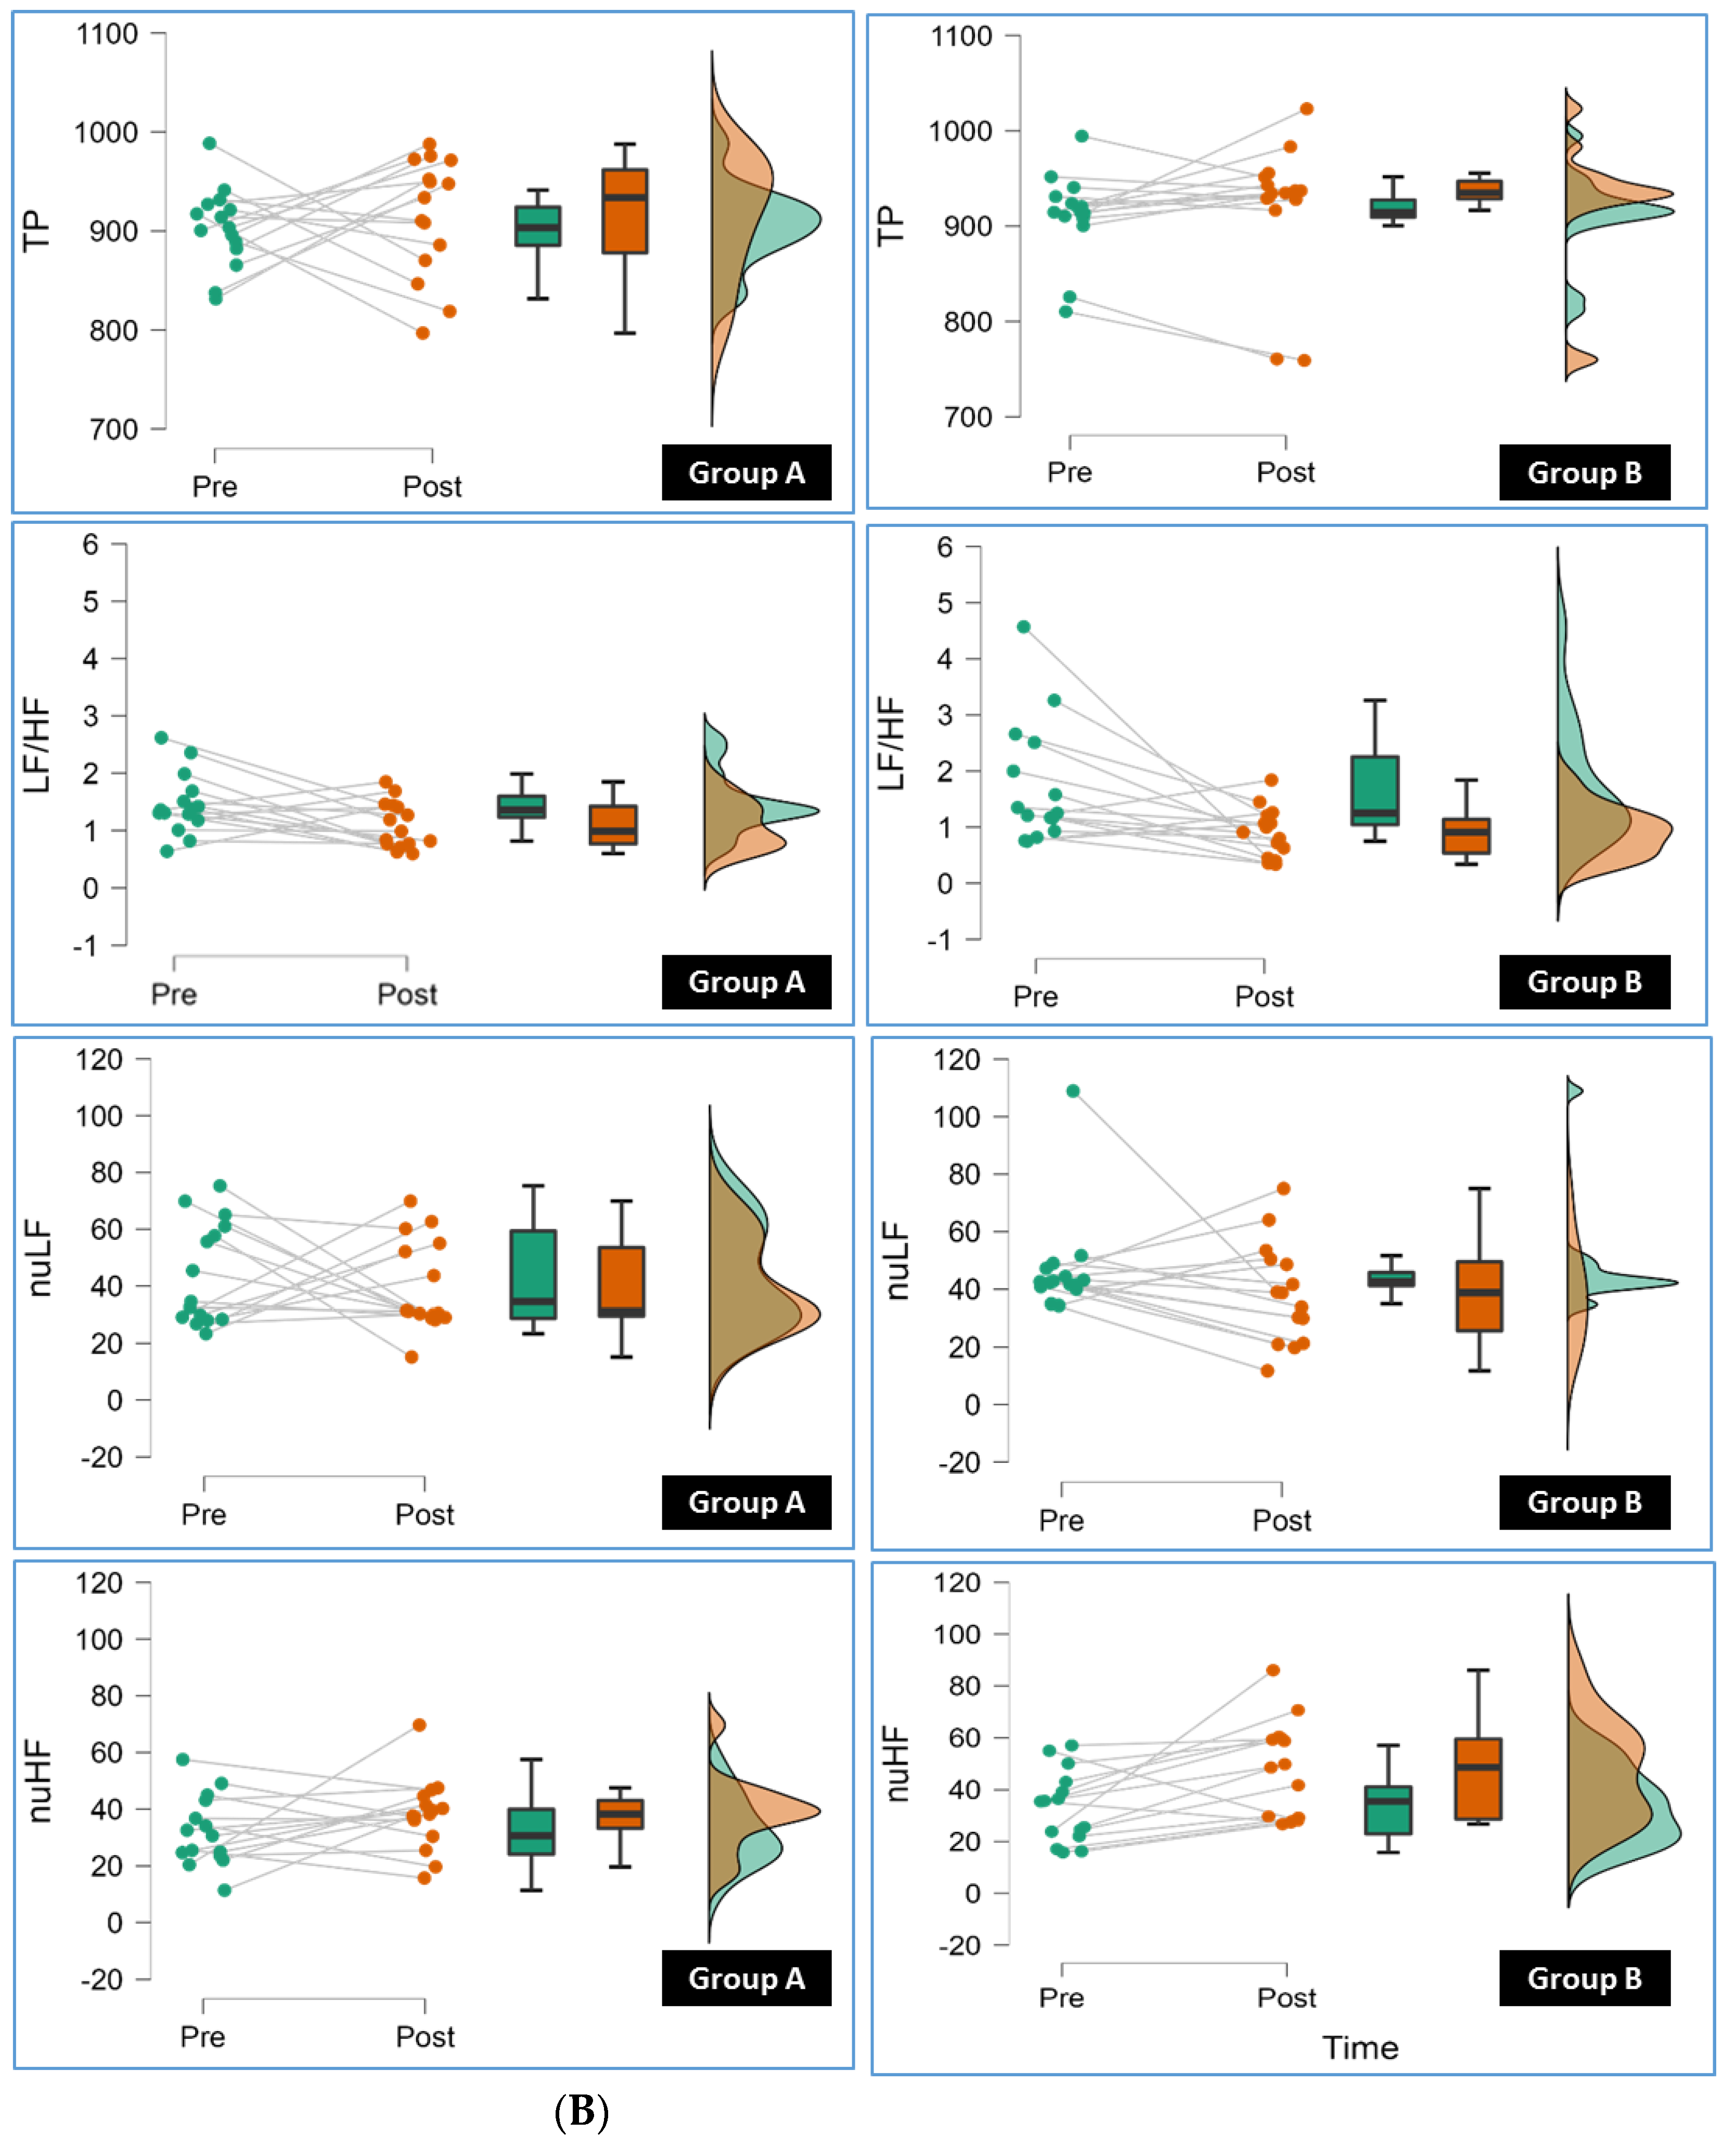
| TP | Pre | 903.13 ± 39.93 | 911.90 ± 44.54 | −0.57 | 0.57 | −40.41–22.87 |
| Post | 915.19 ± 59.93 | 921.43 ± 70.68 | −0.26 | 0.80 | −55.25–42.77 | |
| LF/HF | Pre | 1.46 ± 0.53 | 1.73 ± 1.09 | −0.87 | 0.39 | −0.91–0.37 |
| Post | 1.10 ± 0.40 | 0.90 ± 0.43 | 1.27 | 0.21 | −0.12–0.51 | |
| nLF | Pre | 44.20 ± 18.06 | 47.01 ± 17.70 | −0.43 | 0.67 | −16.19–10.56 |
| Post | 39.89 ± 16.12 | 38.57 ± 17.50 | 0.21 | 0.83 | −11.27–13.90 | |
| nHF | Pre | 32.08 ± 12.37 | 33.12 ± 13.84 | −0.22 | 0.83 | −10.86–8.78 |
| Post | 38.02 ± 12.78 | 46.91 ± 18.70 | −1.52 | 0.14 | −20.87–3.09 |
| Variable | Group A Mean ± SD | Group B Mean ± SD | t-Value | p-Value | 95% CI (Lower–Upper) | |
|---|---|---|---|---|---|---|
| SBP (mmHg) | Pre | 127.13 ± 14.01 | 125.80 ± 14.08 | 0.26 | 0.797 | −9.173–11.839 |
| Post | 122.73 ± 12.24 | 117.67 ± 15.12 | 1.01 | 0.322 | −5.222–15.356 | |
| DBP (mmHg) | Pre | 80.07 ± 6.11 | 79.80 ± 6.84 | 0.11 | 0.911 | −4.583–5.117 |
| Post | 77.87 ± 6.06 | 78.00 ± 7.28 | −0.06 | 0.957 | −5.142–4.876 | |
| HR Rest (bpm) | Pre | 75.13 ± 15.31 | 77.93 ± 10.28 | −0.59 | 0.561 | −12.553–6.953 |
| Post | 80.60 ± 9.92 | 70.47 ± 9.20 | 2.90 | 0.007 | 2.977–17.290 | |
| HR Peak bpm | Pre | 101.40 ± 5.15 | 109.60 ± 6.25 | −3.92 | 0.001 | −12.486–−3.914 |
| Post | 109.07 ± 8.05 | 115.27 ± 7.38 | −2.20 | 0.036 | −11.976–−0.424 | |
| VE Peak (L/min) | Pre | 42.25 ± 12.11 | 41.38 ± 13.73 | 0.19 | 0.854 | −8.806–10.561 |
| Post | 50.81 ± 10.11 | 59.30 ± 10.99 | −2.20 | 0.036 | −16.389–−0.586 | |
| RR Peak (bpm) | Pre | 20.60 ± 6.93 | 21.43 ± 4.77 | −0.38 | 0.706 | −5.274–3.621 |
| Post | 18.31 ± 3.85 | 15.74 ± 4.00 | 1.79 | 0.084 | −0.365–5.512 | |
| PET CO2 Rest (mmHg) | Pre | 34.29 ± 5.42 | 32.83 ± 4.29 | 0.82 | 0.420 | −2.196–5.116 |
| Post | 32.85 ± 5.22 | 30.147 ± 2.95 | 1.75 | 0.091 | −0.462- 5.876 | |
| PET CO2 Peak (mmHg) | Pre | 43.32 ± 3.32 | 41.49 ± 3.35 | 1.50 | 0.144 | −0.666–4.319 |
| Post | 40.96 ± 3.56 | 33.77 ± 2.68 | 6.25 | <0.001 | 4.832–9.541 | |
| VE/CO2 Slope | Pre | 38.51 ± 3.83 | 39.12 ± 3.75 | −0.44 | 0.661 | −3.448–2.221 |
| Post | 36.48 ± 3.59 | 32.24 ± 4.42 | 2.88 | 0.007 | 1.228–7.252 | |
| VE/O2 Slope | Pre | 24.38 ± 4.85 | 23.58 ± 2.58 | 0.56 | 0.579 | −2.108–3.708 |
| Post | 21.85 ± 4.76 | 17.94 ± 4.47 | 2.32 | 0.028 | 0.453–7.355 | |
| RER | Pre | 1.14 ± 0.14 | 1.09 ± 0.10 | 1.16 | 0.257 | −0.039–0.142 |
| Post | 1.10 ± 0.15 | 0.97 ± 0.16 | 2.36 | 0.026 | 0.017–0.249 | |
| Workload (watts) | Pre | 85.15 ± 16.50 | 82.29 ± 7.87 | 0.61 | 0.550 | −6.800–12.533 |
| Post | 97.54 ± 15.53 | 93.49 ± 20.07 | −0.62 | 0.541 | −9365–−17.477 | |
| RPE | Pre | 13.07 ± 2.34 | 14.23 ± 2.55 | −1.29 | 0.208 | −2.985–0.678 |
| Post | 12.02 ± 2.53 | 11.36 ± 2.34 | 0.75 | 0.460 | −1.155–2.488 |
| Variables | Group | Pre | Post | MD | SD | 95% CI (Lower–Upper) | t | p |
|---|---|---|---|---|---|---|---|---|
| Mean NN | Group A | 819.83 ± 62.12 | 839.69 ± 52.72 | −19.86 | 49.37 | −47.20–7.49 | −1.56 | 0.14 |
| Group B | 834.72 ± 44.82 | 910.82 ± 72.93 | −76.10 | 69.23 | −114.44–−37.76 | −4.26 | <0.001 | |
| Resting HR | Group A | 75.27 ± 4.43 | 72.47 ± 7.07 | 2.80 | 4.97 | 0.05–5.56 | 2.18 | 0.05 |
| Group B | 77.33 ± 6.31 | 70.13 ± 6.45 | 7.20 | 7.87 | 2.84–11.56 | 3.55 | <0.001 | |
| SDNN | Group A | 137.94 ± 67.82 | 153.16 ± 62.83 | −15.23 | 29.13 | −31.36–0.90 | −2.03 | 0.06 |
| Group B | 145.08 ± 60.40 | 156.55 ± 62.17 | −11.47 | 15.64 | −20.13–−2.81 | −2.84 | 0.01 | |
| RMSSD | Group A | 33.79 ± 7.26 | 40.54 ± 10.46 | −6.75 | 12.42 | −13.62–0.13 | −2.11 | 0.05 |
| Group B | 34.91 ± 7.59 | 50.83 ± 9.80 | −15.92 | 9.03 | −20.92–−10.92 | −6.83 | <0.001 | |
| pNN50 | Group A | 42.52 ± 6.49 | 43.99 ± 6.19 | −1.48 | 1.14 | −2.11–−0.84 | −5.01 | 0.00 |
| Group B | 42.05 ± 5.05 | 44.68 ± 5.20 | −2.63 | 1.11 | −3.24–−2.02 | −9.19 | <0.001 | |
| LF | Group A | 398.73 ± 163.33 | 361.03 ± 136.36 | 37.70 | 247.53 | −99.38–174.77 | 0.59 | 0.57 |
| Group B | 425.19 ± 139.34 | 352.56 ± 159.72 | 72.63 | 214.69 | −46.26–191.52 | 1.31 | 0.21 | |
| HF | Group A | 288.85 ± 109.40 | 346.13 ± 115.41 | −57.27 | 150.20 | −140.45–25.91 | −1.48 | 0.16 |
| Group B | 301.94 ± 127.05 | 426.07 ± 153.52 | −124.12 | 159.74 | −212.58–−35.66 | −3.01 | 0.01 | |
| VLF | Group A | 170.98 ± 17.60 | 155.27 ± 18.56 | 15.71 | 27.47 | 0.50–30.92 | 2.21 | 0.04 |
| Group B | 170.67 ± 9.75 | 159.85 ± 9.12 | 10.83 | 14.74 | 2.66–18.99 | 2.84 | 0.01 | |
| TP | Group A | 903.13 ± 39.93 | 915.19 ± 59.93 | −12.06 | 84.83 | −59.04–34.92 | −0.55 | 0.59 |
| Group B | 911.90 ± 44.54 | 921.43 ± 70.68 | −9.53 | 45.78 | −34.88–15.82 | −0.81 | 0.43 | |
| LF/HF | Group A | 1.46 ± 0.53 | 1.10 ± 0.40 | 0.36 | 0.66 | −0.00–0.73 | 2.14 | 0.05 |
| Group B | 1.73 ± 1.09 | 0.90 ± 0.44 | 0.83 | 1.19 | 0.17–1.49 | 2.70 | 0.02 | |
| nLF | Group A | 44.20 ± 18.06 | 39.89 ± 16.12 | 4.31 | 28.97 | −11.73–20.35 | 0.58 | 0.57 |
| Group B | 47.01 ± 17.71 | 38.57 ± 17.50 | 8.44 | 24.16 | −4.94–21.82 | 1.35 | 0.20 | |
| nHF | Group A | 32.08 ± 12.37 | 38.02 ± 12.78 | −5.94 | 17.91 | −15.86–3.97 | −1.29 | 0.22 |
| Group B | 33.12 ± 13.84 | 46.91 ± 18.70 | −13.79 | 19.38 | −24.53–−3.06 | −2.76 | 0.01 |
| Variables | Group | Pre | Post | MD | SD | 95% CI (Lower–Upper) | t | p |
|---|---|---|---|---|---|---|---|---|
| SBP (mmHg) | Group A | 127.13 ± 14.01 | 122.73 ± 12.24 | 4.4 | 8.92 | −0.54–9.34 | 1.91 | 0.08 |
| Group B | 125.80 ± 14.08 | 117.67 ± 15.12 | 8.13 | 5.45 | 5.12–11.15 | 5.78 | <0.001 | |
| DBP (mmHg) | Group A | 80.07 ± 6.11 | 77.87 ± 6.06 | 2.2 | 4.2 | −0.12–4.52 | 2.03 | 0.06 |
| Group B | 79.80 ± 6.84 | 78.00 ± 7.28 | 1.8 | 3.49 | −0.13–3.73 | 1.99 | 0.07 | |
| HR Rest (bpm) | Group A | 75.13 ± 15.31 | 80.60 ± 9.92 | −5.47 | 16.89 | −14.82–3.89 | −1.25 | 0.23 |
| Group B | 77.93 ± 10.28 | 70.47 ± 9.20 | 7.47 | 10.51 | 1.65–13.29 | 2.75 | 0.02 | |
| HR Peak (bpm) | Group A | 101.40 ± 5.15 | 109.07 ± 8.05 | −7.67 | 8.93 | −12.61–−2.71 | −3.32 | 0.01 |
| Group B | 109.60 ± 6.25 | 115.27 ± 7.38 | −5.67 | 8.64 | −10.45–−0.88 | −2.54 | 0.02 | |
| VE Peak L/min | Group A | 42.25 ± 12.11 | 50.81 ± 10.11 | −8.56 | 18.49 | −18.8–1.68 | −1.79 | 0.10 |
| Group B | 41.38 ± 13.73 | 59.30 ± 10.99 | −17.93 | 20.71 | −29.39–−6.46 | −3.35 | 0.01 | |
| RR Peak (bpm) | Group A | 20.60 ± 6.93 | 18.31 ± 3.86 | 2.29 | 8.03 | −2.16–6.74 | 1.1 | 0.29 |
| Group B | 21.43 ± 4.77 | 15.74 ± 4.00 | 5.69 | 4.99 | 2.92–8.45 | 4.41 | <0.001 | |
| PET CO2 Rest (mmHg) | Group A | 34.29 ± 5.42 | 32.85 ± 5.22 | 1.44 | 5.31 | −1.5–4.38 | 1.05 | 0.31 |
| Group B | 32.83 ± 4.29 | 30.15 ± 2.95 | 2.69 | 5.39 | −0.29–5.67 | 1.93 | 0.07 | |
| PET CO2 Peak (mmHg) | Group A | 43.32 ± 3.32 | 40.96 ± 3.56 | 2.36 | 4.17 | 0.05–4.67 | 2.19 | 0.05 |
| Group B | 41.49 ± 3.35 | 33.77 ± 2.68 | 7.72 | 4.04 | 5.48–9.96 | 7.4 | <0.001 | |
| VE/CO2 Slope | Group A | 38.51 ± 3.83 | 36.48 ± 3.59 | 2.03 | 5.19 | −0.85–4.9 | 1.51 | 0.15 |
| Group B | 39.12 ± 3.75 | 32.24 ± 4.42 | 6.88 | 1.56 | 6.01–7.74 | 17.13 | <0.001 | |
| VE/O2 Slope | Group A | 24.38 ± 4.85 | 21.85 ± 4.76 | 2.53 | 4.81 | −0.13–5.2 | 2.03 | 0.06 |
| Group B | 23.58 ± 2.58 | 17.94 ± 4.47 | 5.64 | 5.81 | 2.42–8.85 | 3.76 | <0.001 | |
| RER | Group A | 1.14 ± 0.14 | 1.10 ± 0.15 | 0.04 | 0.05 | 0.01–0.07 | 3.06 | 0.01 |
| Group B | 1.09 ± 0.10 | 0.97 ± 0.16 | 0.12 | 0.18 | 0.02–0.22 | 2.63 | 0.02 | |
| Workload (watts) | Group A | 85.15 ± 16.50 | 97.54 ± 15.53 | −12.39 | 23.12 | −25.19–0.42 | −2.07 | 0.06 |
| Group B | 82.29 ± 7.87 | 93.48 ± 20.07 | −11.2 | 20.12 | −22.34–−0.05 | −2.16 | 0.05 | |
| RPE | Group A | 13.07 ± 2.34 | 12.02 ± 2.53 | 1.05 | 3.94 | −1.13–3.23 | 1.03 | 0.32 |
| Group B | 14.23 ± 2.55 | 11.36 ± 2.34 | 2.87 | 3.04 | 1.18–4.56 | 3.65 | <0.001 |
Disclaimer/Publisher’s Note: The statements, opinions and data contained in all publications are solely those of the individual author(s) and contributor(s) and not of MDPI and/or the editor(s). MDPI and/or the editor(s) disclaim responsibility for any injury to people or property resulting from any ideas, methods, instructions or products referred to in the content. |
© 2023 by the authors. Licensee MDPI, Basel, Switzerland. This article is an open access article distributed under the terms and conditions of the Creative Commons Attribution (CC BY) license (https://creativecommons.org/licenses/by/4.0/).
Share and Cite
Rizvi, M.R.; Sharma, A.; Malki, A.; Sami, W. Enhancing Cardiovascular Health and Functional Recovery in Stroke Survivors: A Randomized Controlled Trial of Stroke-Specific and Cardiac Rehabilitation Protocols for Optimized Rehabilitation. J. Clin. Med. 2023, 12, 6589. https://doi.org/10.3390/jcm12206589
Rizvi MR, Sharma A, Malki A, Sami W. Enhancing Cardiovascular Health and Functional Recovery in Stroke Survivors: A Randomized Controlled Trial of Stroke-Specific and Cardiac Rehabilitation Protocols for Optimized Rehabilitation. Journal of Clinical Medicine. 2023; 12(20):6589. https://doi.org/10.3390/jcm12206589
Chicago/Turabian StyleRizvi, Moattar Raza, Ankita Sharma, Ahmed Malki, and Waqas Sami. 2023. "Enhancing Cardiovascular Health and Functional Recovery in Stroke Survivors: A Randomized Controlled Trial of Stroke-Specific and Cardiac Rehabilitation Protocols for Optimized Rehabilitation" Journal of Clinical Medicine 12, no. 20: 6589. https://doi.org/10.3390/jcm12206589
APA StyleRizvi, M. R., Sharma, A., Malki, A., & Sami, W. (2023). Enhancing Cardiovascular Health and Functional Recovery in Stroke Survivors: A Randomized Controlled Trial of Stroke-Specific and Cardiac Rehabilitation Protocols for Optimized Rehabilitation. Journal of Clinical Medicine, 12(20), 6589. https://doi.org/10.3390/jcm12206589