Article

Age-Related Variations in Postoperative Pain Intensity across 10 Surgical Procedures: A Retrospective Study of Five Hospitals in South Korea

1
Department of Anesthesiology and Pain Medicine, Chuncheon Sacred Heart Hospital, Hallym University College of Medicine, Chuncheon-si 24253, Republic of Korea
2
Institute of New Frontier Research Team, Hallym University College of Medicine, Chuncheon-si 24252, Republic of Korea
3
Department of Neurology, Chuncheon Sacred Heart Hospital, Hallym University College of Medicine, Chuncheon 24253, Republic of Korea
*
Author to whom correspondence should be addressed.
J. Clin. Med. 2023, 12(18), 5912; https://doi.org/10.3390/jcm12185912
Submission received: 1 August 2023 / Revised: 8 September 2023 / Accepted: 8 September 2023 / Published: 12 September 2023
(This article belongs to the Section Anesthesiology)

Abstract

:
Age-related differences in pain perception have been reported in various contexts; however, their impact on postoperative pain intensity remains poorly understood, especially across different surgical procedures. Data from five hospitals were retrospectively analyzed, encompassing patients who underwent 10 distinct surgical procedures. Numeric rating scale scores were used to assess the worst postoperative pain intensity during the 24 h after surgery. The multivariate linear regression model analyzed the relationship between age and pain intensity. Subgroup analyses were performed according to sex and patient-controlled analgesia (PCA). This study included 41,187 patients. Among the surgeries studied, lumbar spine fusion (β = −0.155, p < 0.001) consistently and significantly exhibited a decrease in worst postoperative pain with increasing age. Similar trends were observed in cholecystectomy (β = −0.029, p < 0.001) and several other surgeries; however, the results were inconsistent across all analyses. Surgeries with higher percentages of PCA administration had lower median worst-pain scores. In conclusion, age may affect postoperative pain intensity after specific surgeries; however, a comprehensive understanding of the complex interplay between age, surgical intervention, and pain intensity is required. Pain management strategies should consider various factors, including age-related variations.
Keywords:
age; pain; surgery; opioid

1. Introduction

Pain is a common and complex experience following surgical procedures that varies in intensity and duration across individuals and surgical interventions [1]. However, pain intensity on the first day after surgery is the highest in many surgical procedures [2,3]. Understanding the factors influencing postoperative pain on the first postoperative day is crucial for improving patient outcomes, optimizing pain management strategies, and enhancing overall patient satisfaction [4,5,6]. Pain management in the immediate postoperative period is critical because it can significantly affect recovery, patient comfort, and overall healthcare costs [7,8,9].
Among the various factors that can influence postoperative pain perception, age has been identified as a significant predictor [10,11,12]. However, in some studies, there were no differences in pain perception based on age [13,14]. However, the surgical incision, size of the surgical wound, method of anesthesia, and pain control differ according to the type of surgery. Therefore, it may be difficult to generalize the association between age and pain intensity. However, the results of these previous studies are limited [5,10,13,14].
This study investigated the association between age and pain intensity experienced on the first day after surgery in 10 distinct surgical procedures. The 10 surgeries under examination included arthroscopic rotator cuff repair (ARCR), cesarean section (C/sec), cholecystectomy, hip hemiarthroplasty, laparoscopic herniorrhaphy, open hernia repair, hysterectomy, lumbar spine fusion, total hip arthroplasty (THA), and total knee arthroplasty (TKA). By identifying the potential associations between age and pain intensity in various surgical contexts in five South Korean hospitals, we aimed to clarify age-related differences in postoperative pain perception, paving the way for tailored pain management strategies based on patient age and specific surgical procedures. The surgical types were determined based on previous studies; we extended our analysis to expand the scope of surgeries, encompassing obstetric and gynecologic surgeries—including cesarean sections and hysterectomies—and herniorrhaphies, a surgical procedure commonly performed on elderly patients.

2. Materials and Methods

2.1. Data Collection

The Clinical Research Ethics Committee of Chuncheon Sacred Heart Hospital, Hallym University, approved this retrospective cohort study. The need for informed consent was waived due to the study’s retrospective design. All data were collected from five hospitals at Hallym Medical Center through electronic medical records. Our dataset included patients’ baseline characteristics and records of anesthesia, surgery, laboratory examination, and prescription between 1 January 2013, and 30 June 2023.

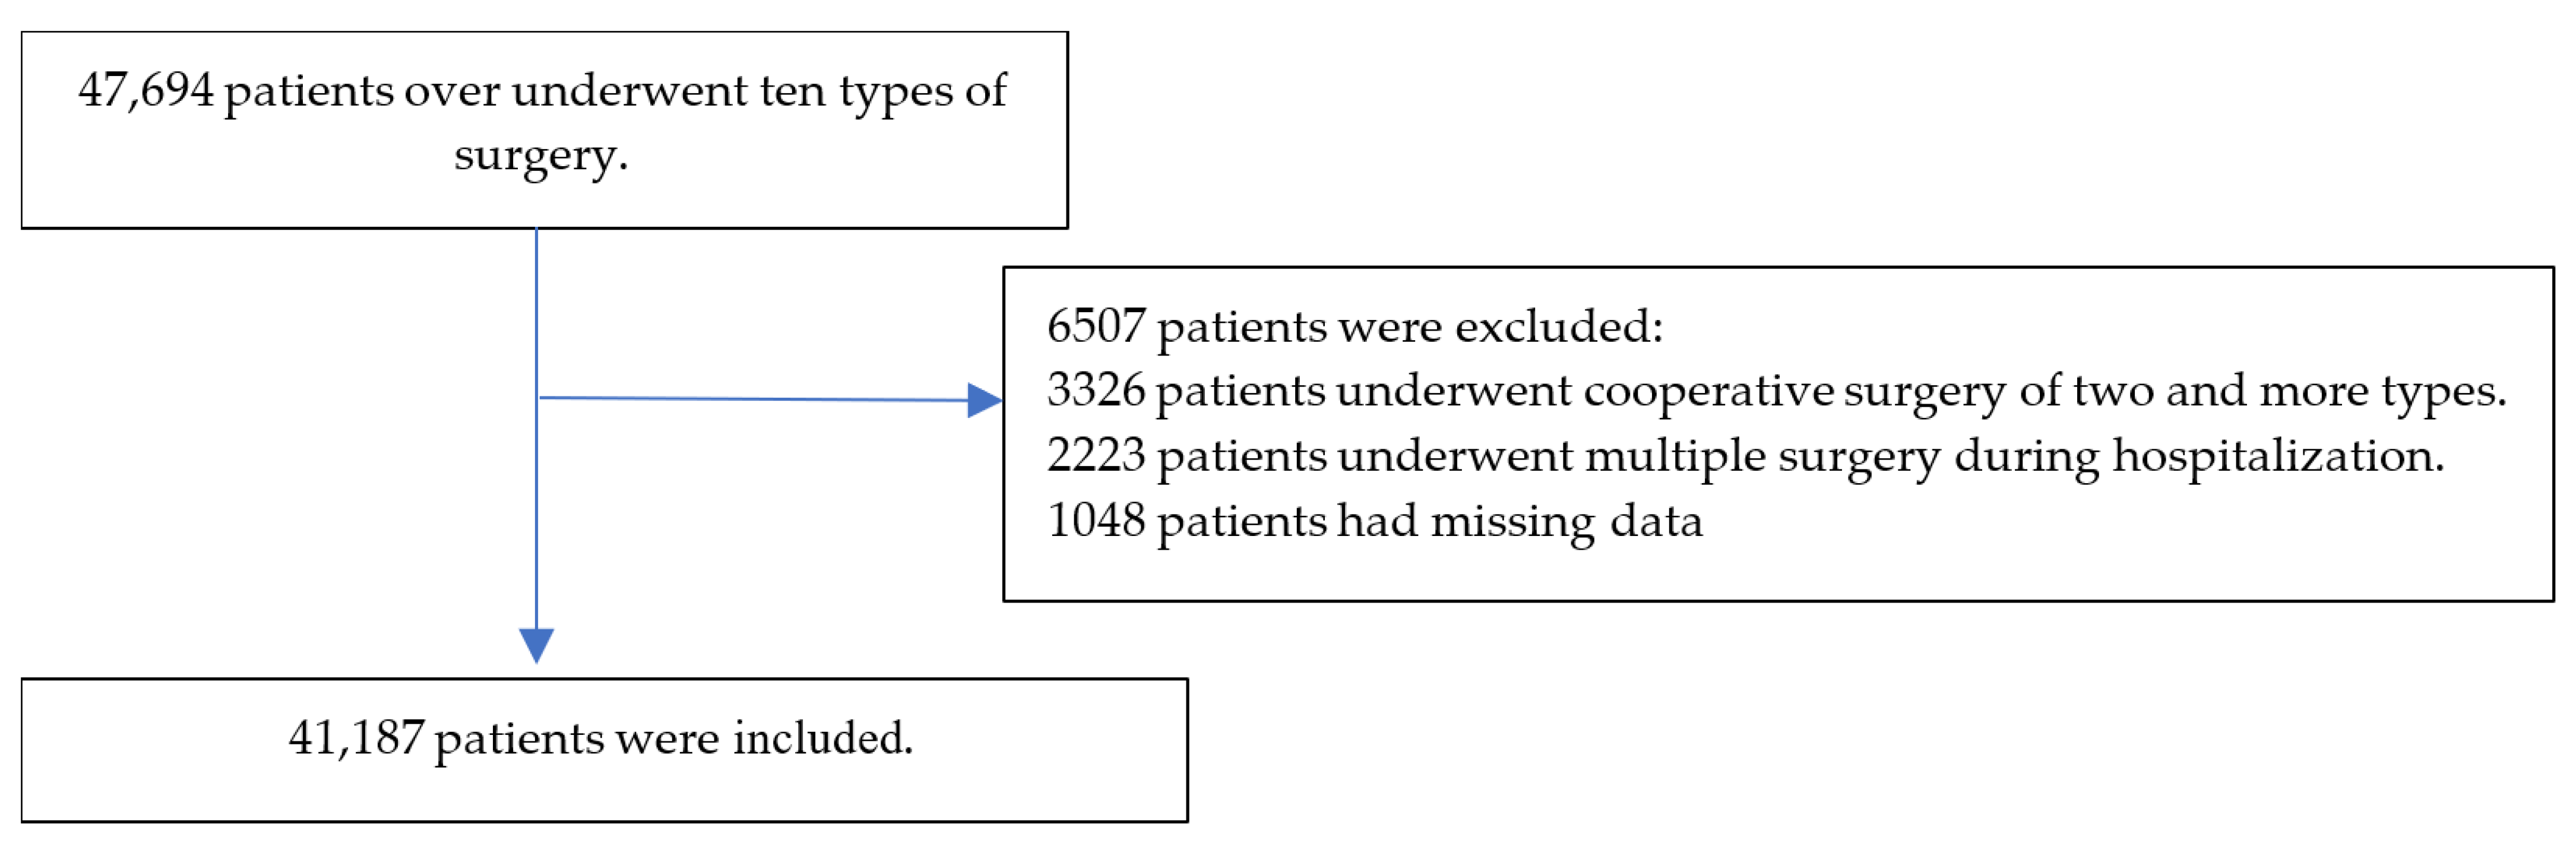
2.2. Inclusion and Exclusion Criteria

This study included adult patients aged ≥ 18 who underwent one of the 10 surgical procedures between 1 January 2013, and 30 June 2023. The 10 surgical procedures were as follows: ARCR, C/sec, laparoscopic cholecystectomy, hip hemiarthroplasty, laparoscopic inguinal herniorrhaphy, open inguinal herniorrhaphy, hysterectomy, lumbar spine fusion, THA, and TKA. Surgery types were classified according to the Health Insurance Charge Code of the Republic of Korea (Appendix A). Laparoscopic surgery is classified based on surgical records because the codes for laparoscopic and open surgery are identical.
This study excluded patients with cooperative surgery, missing data, or multiple surgeries.

2.3. Exposure and Primary and Secondary Outcomes

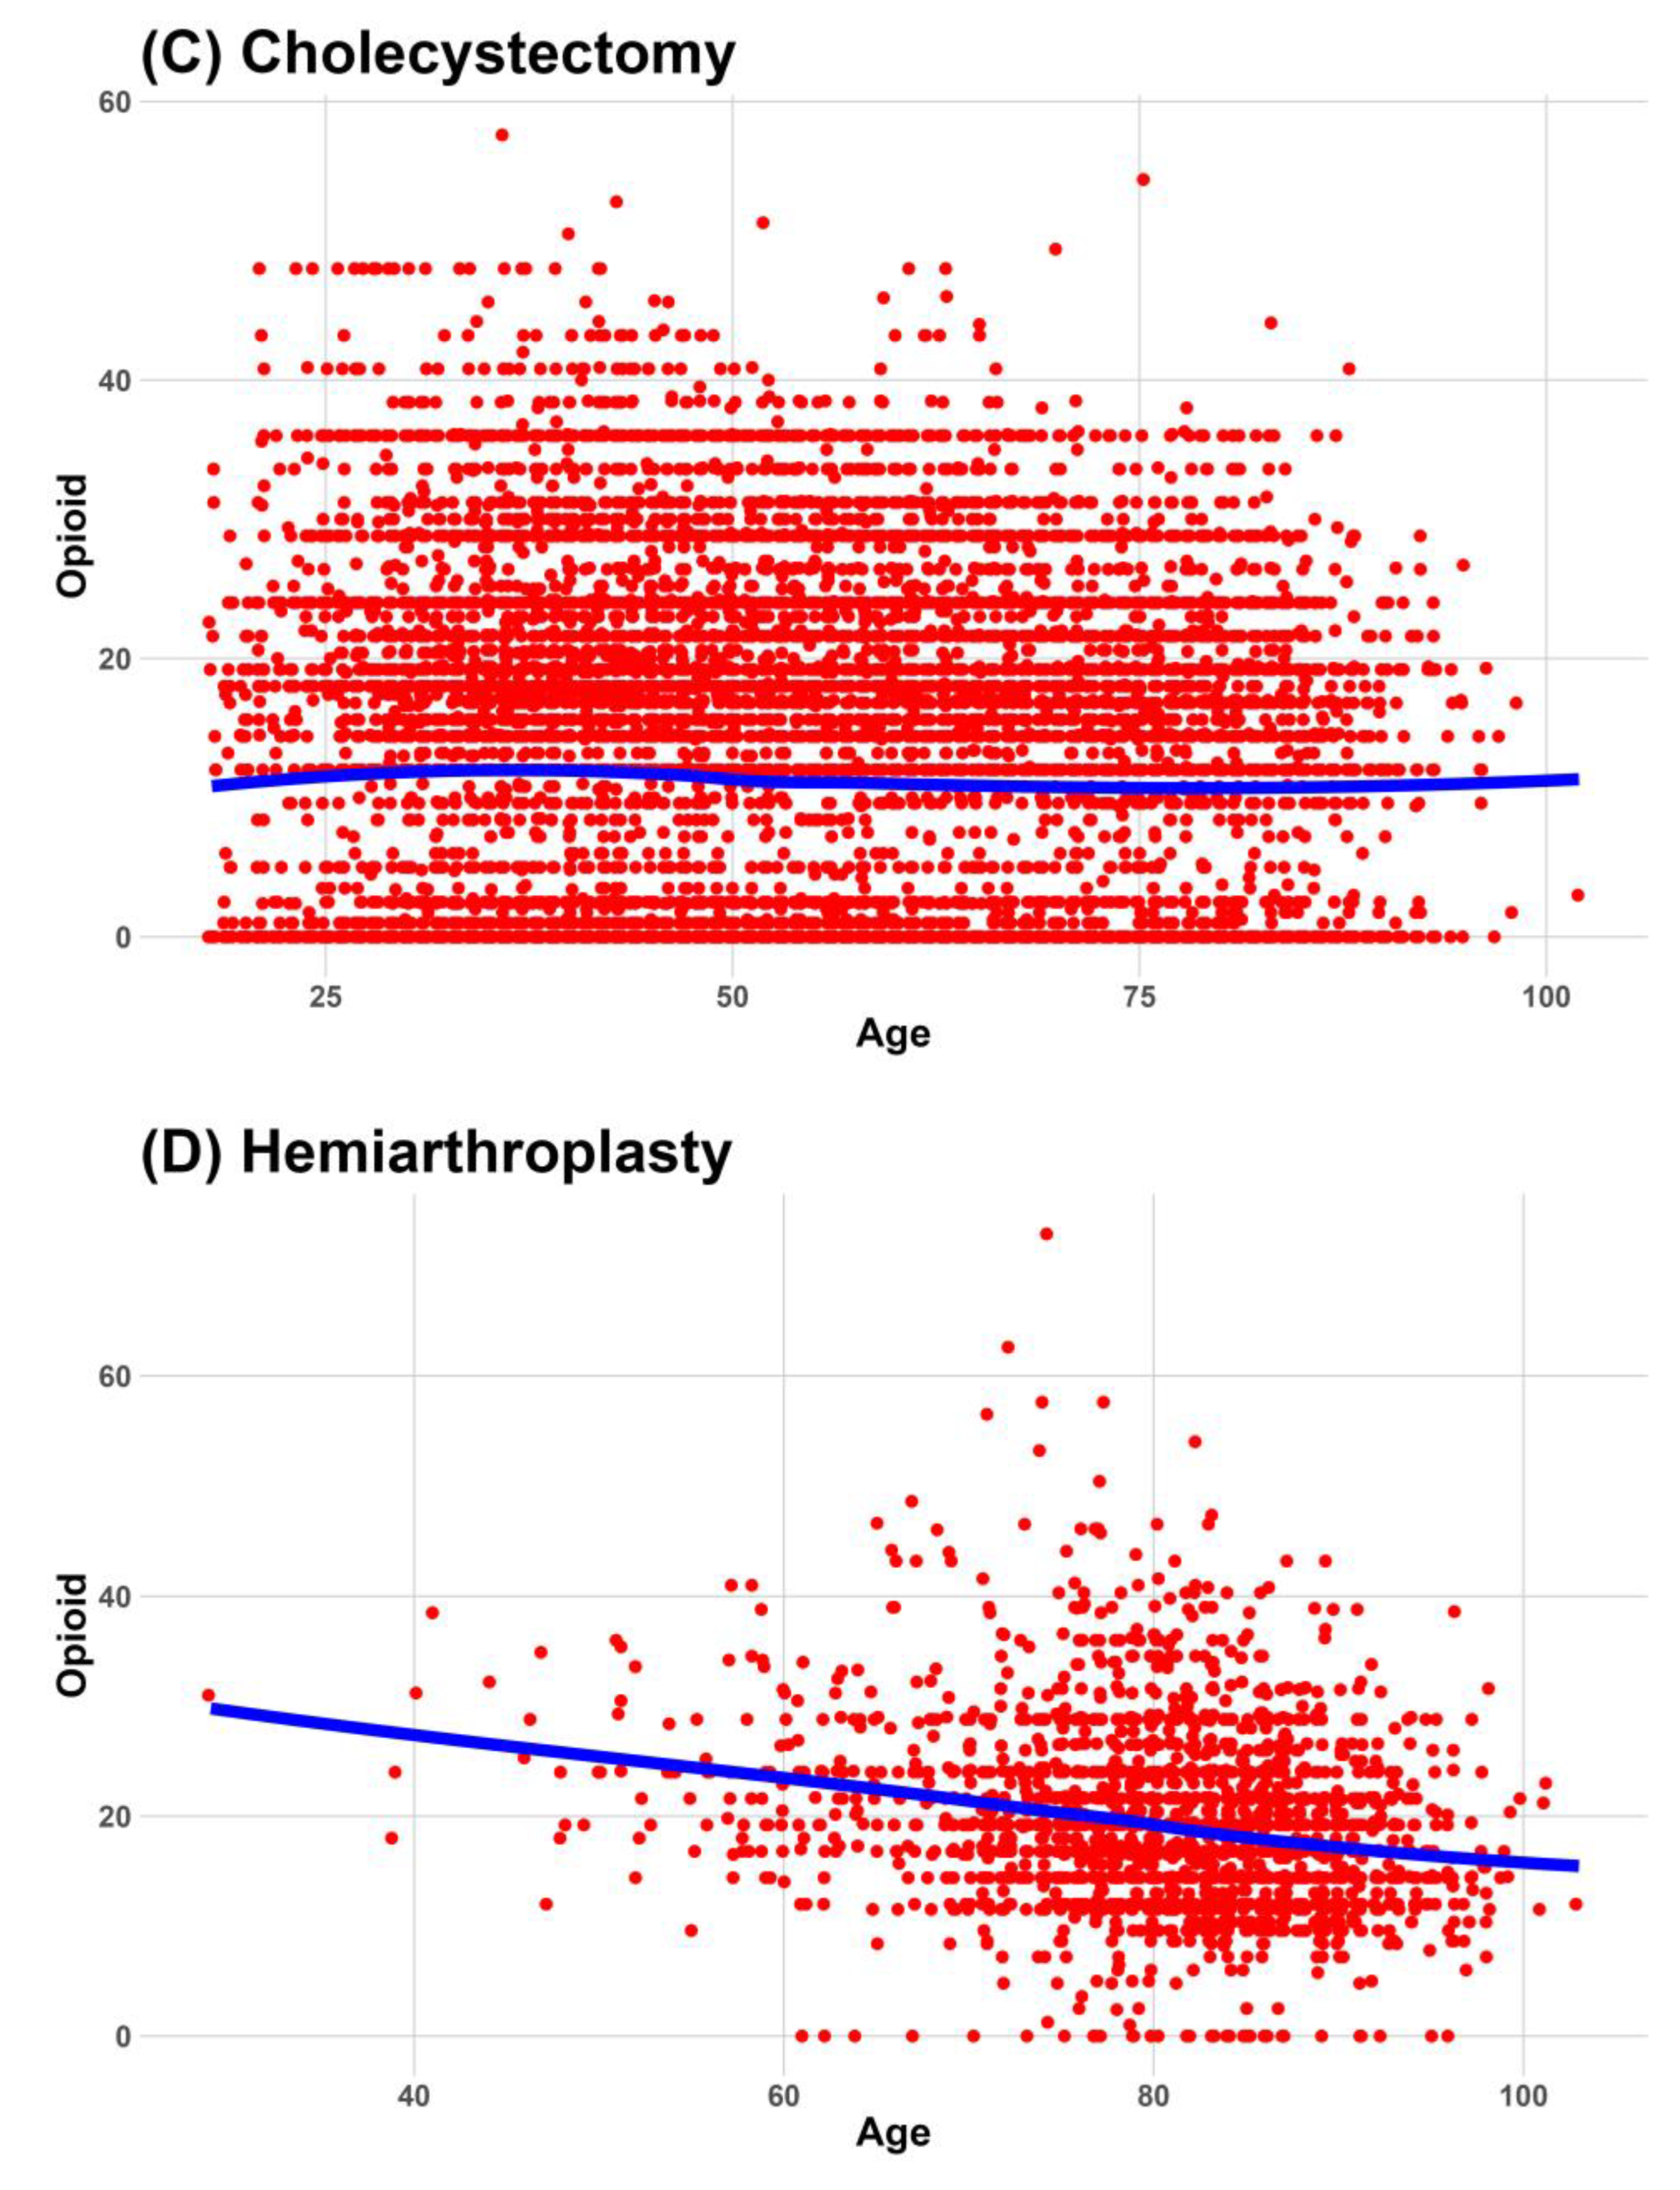
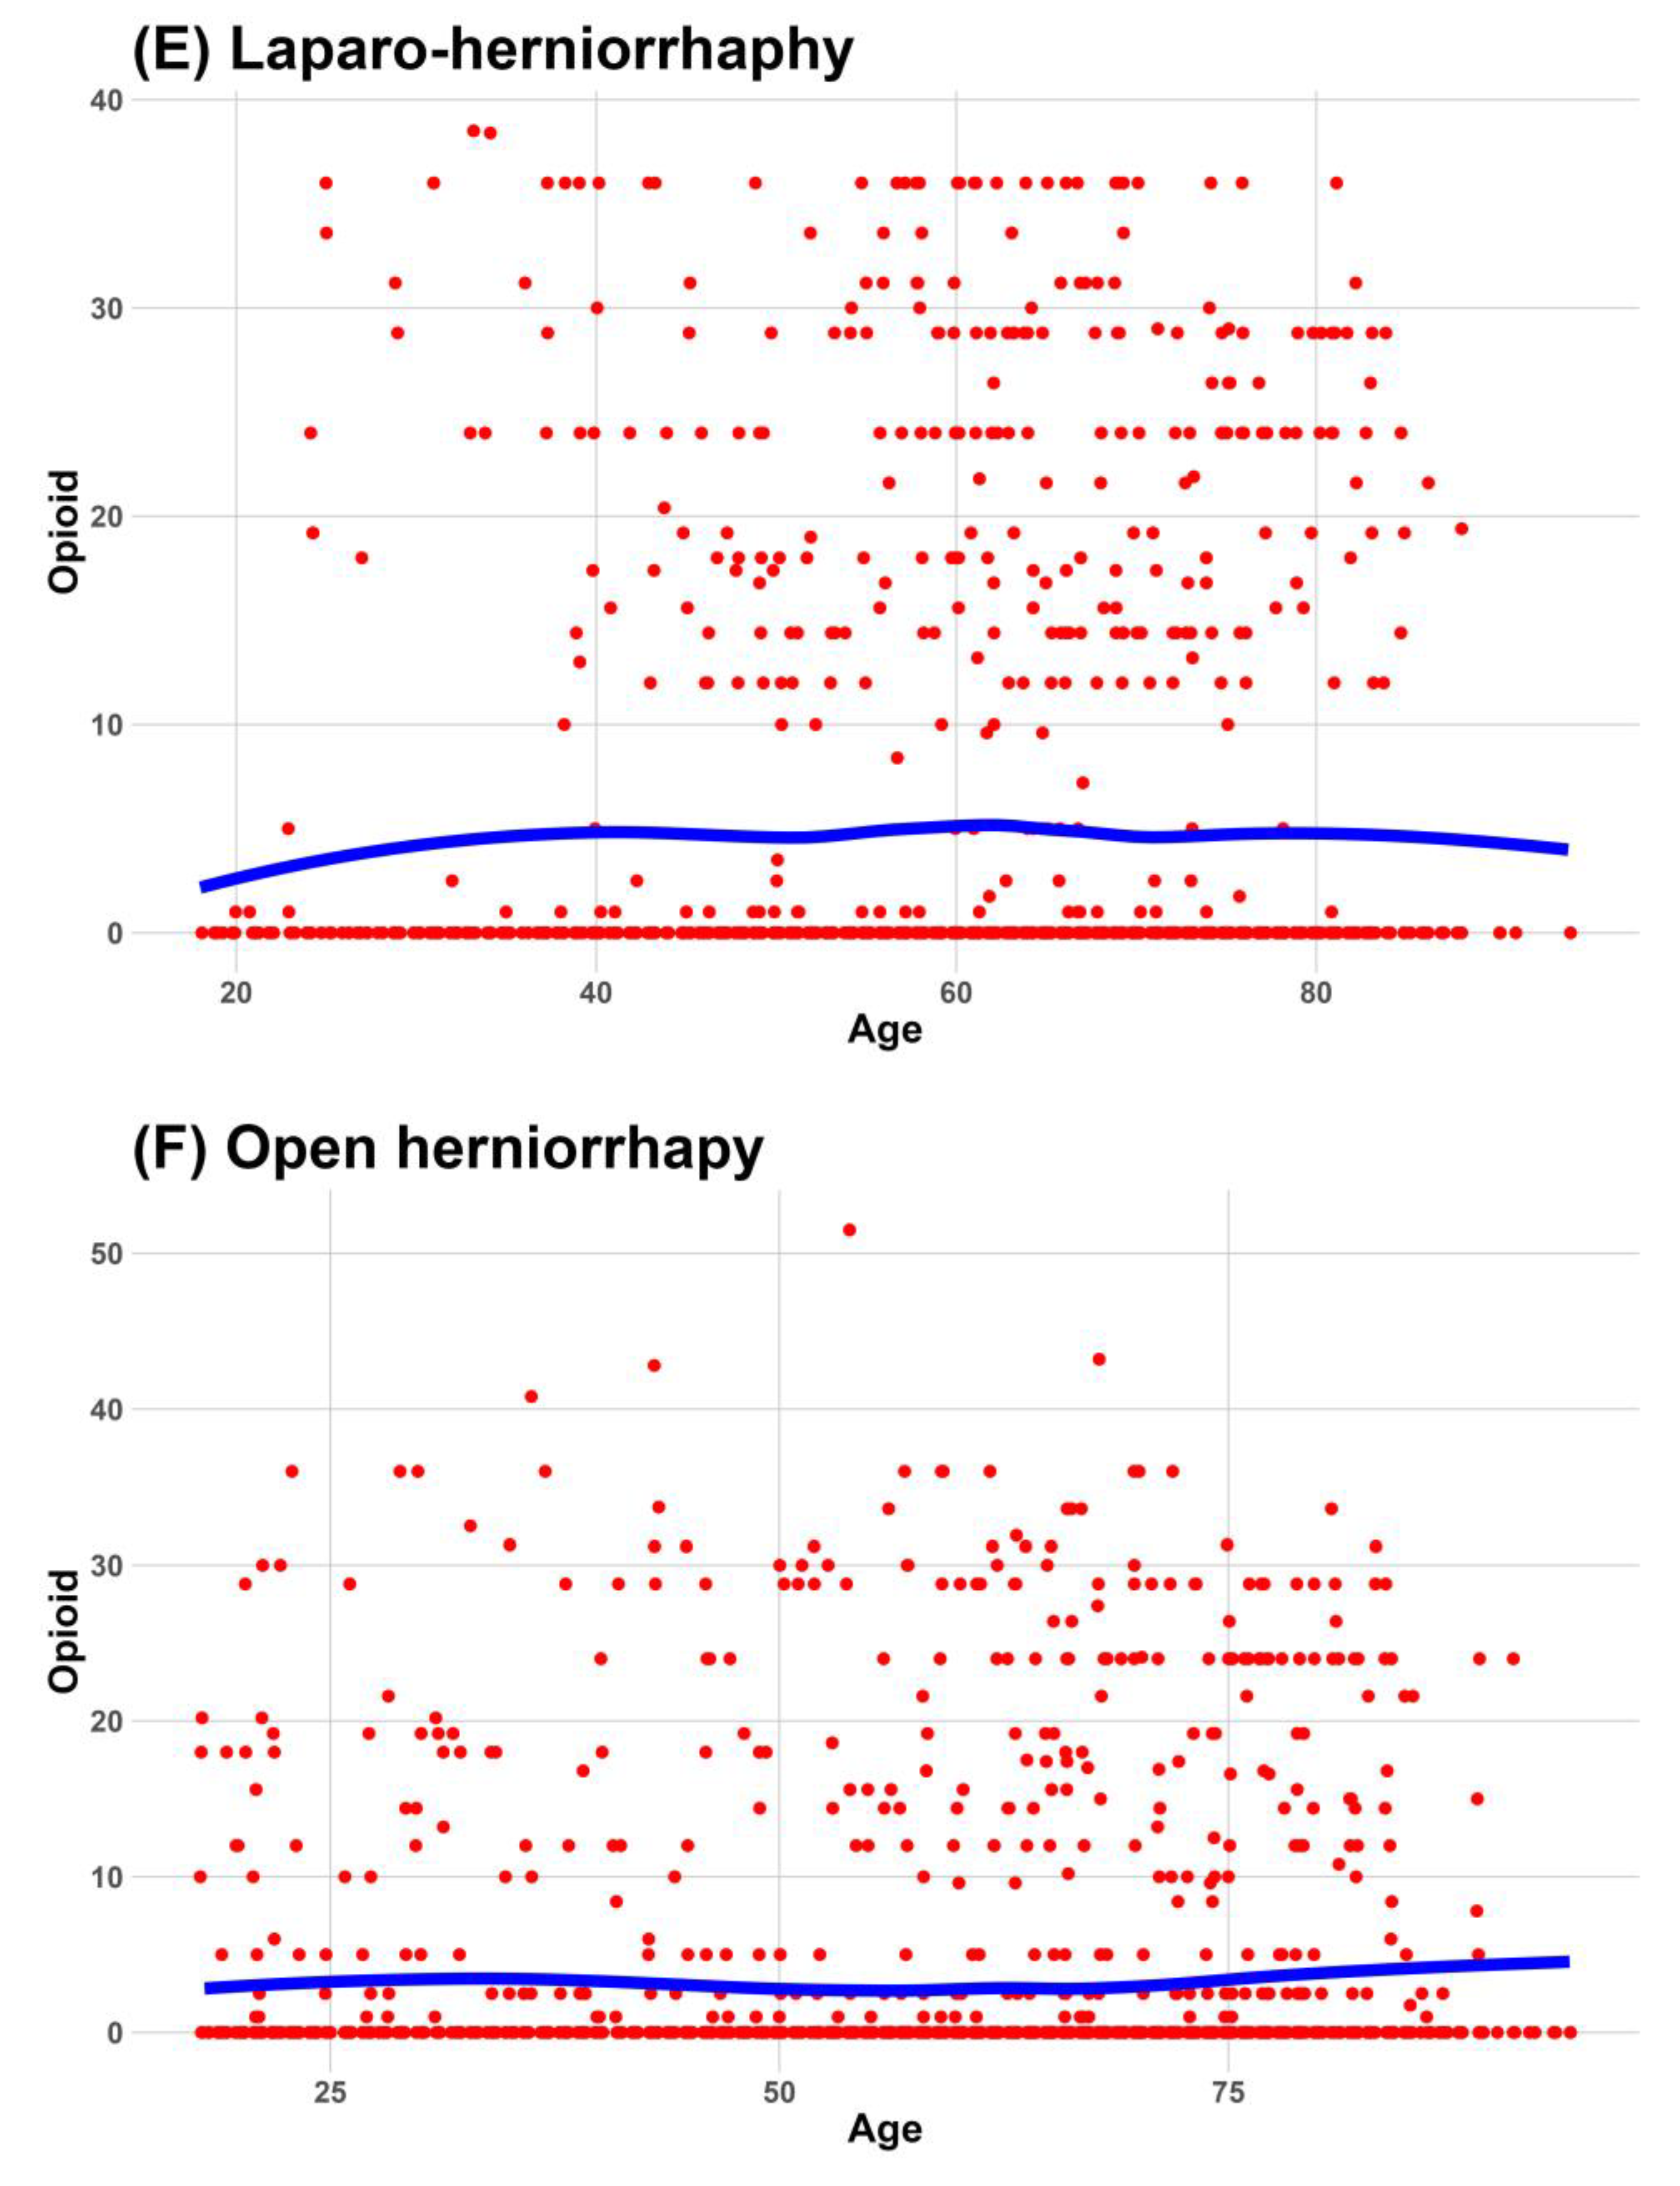
The exposure was the age (years) of the patients. The primary outcome was the worst pain intensity during the 24 h after surgery. Pain intensity was determined using a numeric rating scale (NRS) ranging from 0 (least) to 10 (worst). Secondary outcomes were the dose of opioids used during the postoperative 24 h. Opioids included morphine, oxycodone, meperidine, nalbuphine, tramadol, transdermal fentanyl patch, transdermal buprenorphine patch, fentanyl, and alfentanil. Because several types of opioids were included, the conversion dose was calculated based on morphine. The ratio of the conversion dose is presented in Appendix B.

2.4. Covariates

The covariates included patient characteristics, such as body mass index, comorbidities (hypertension, diabetes, tuberculosis, hepatitis, cardiac disease, cerebral vascular accident, cancer, hyperlipidemia, and sleep disorder), history of alcohol consumption, smoking, and medication (opioid, sleeping pills, and psychotropic drugs), and perioperative factors, such as physical status, emergency, anesthesia, surgery time, fluid balance, intraoperative monitoring (arterial and central venous pressures, Foley catheter, and Levin tube), and patient-controlled analgesia (route, adjuvant, and rate).

2.5. Statistics

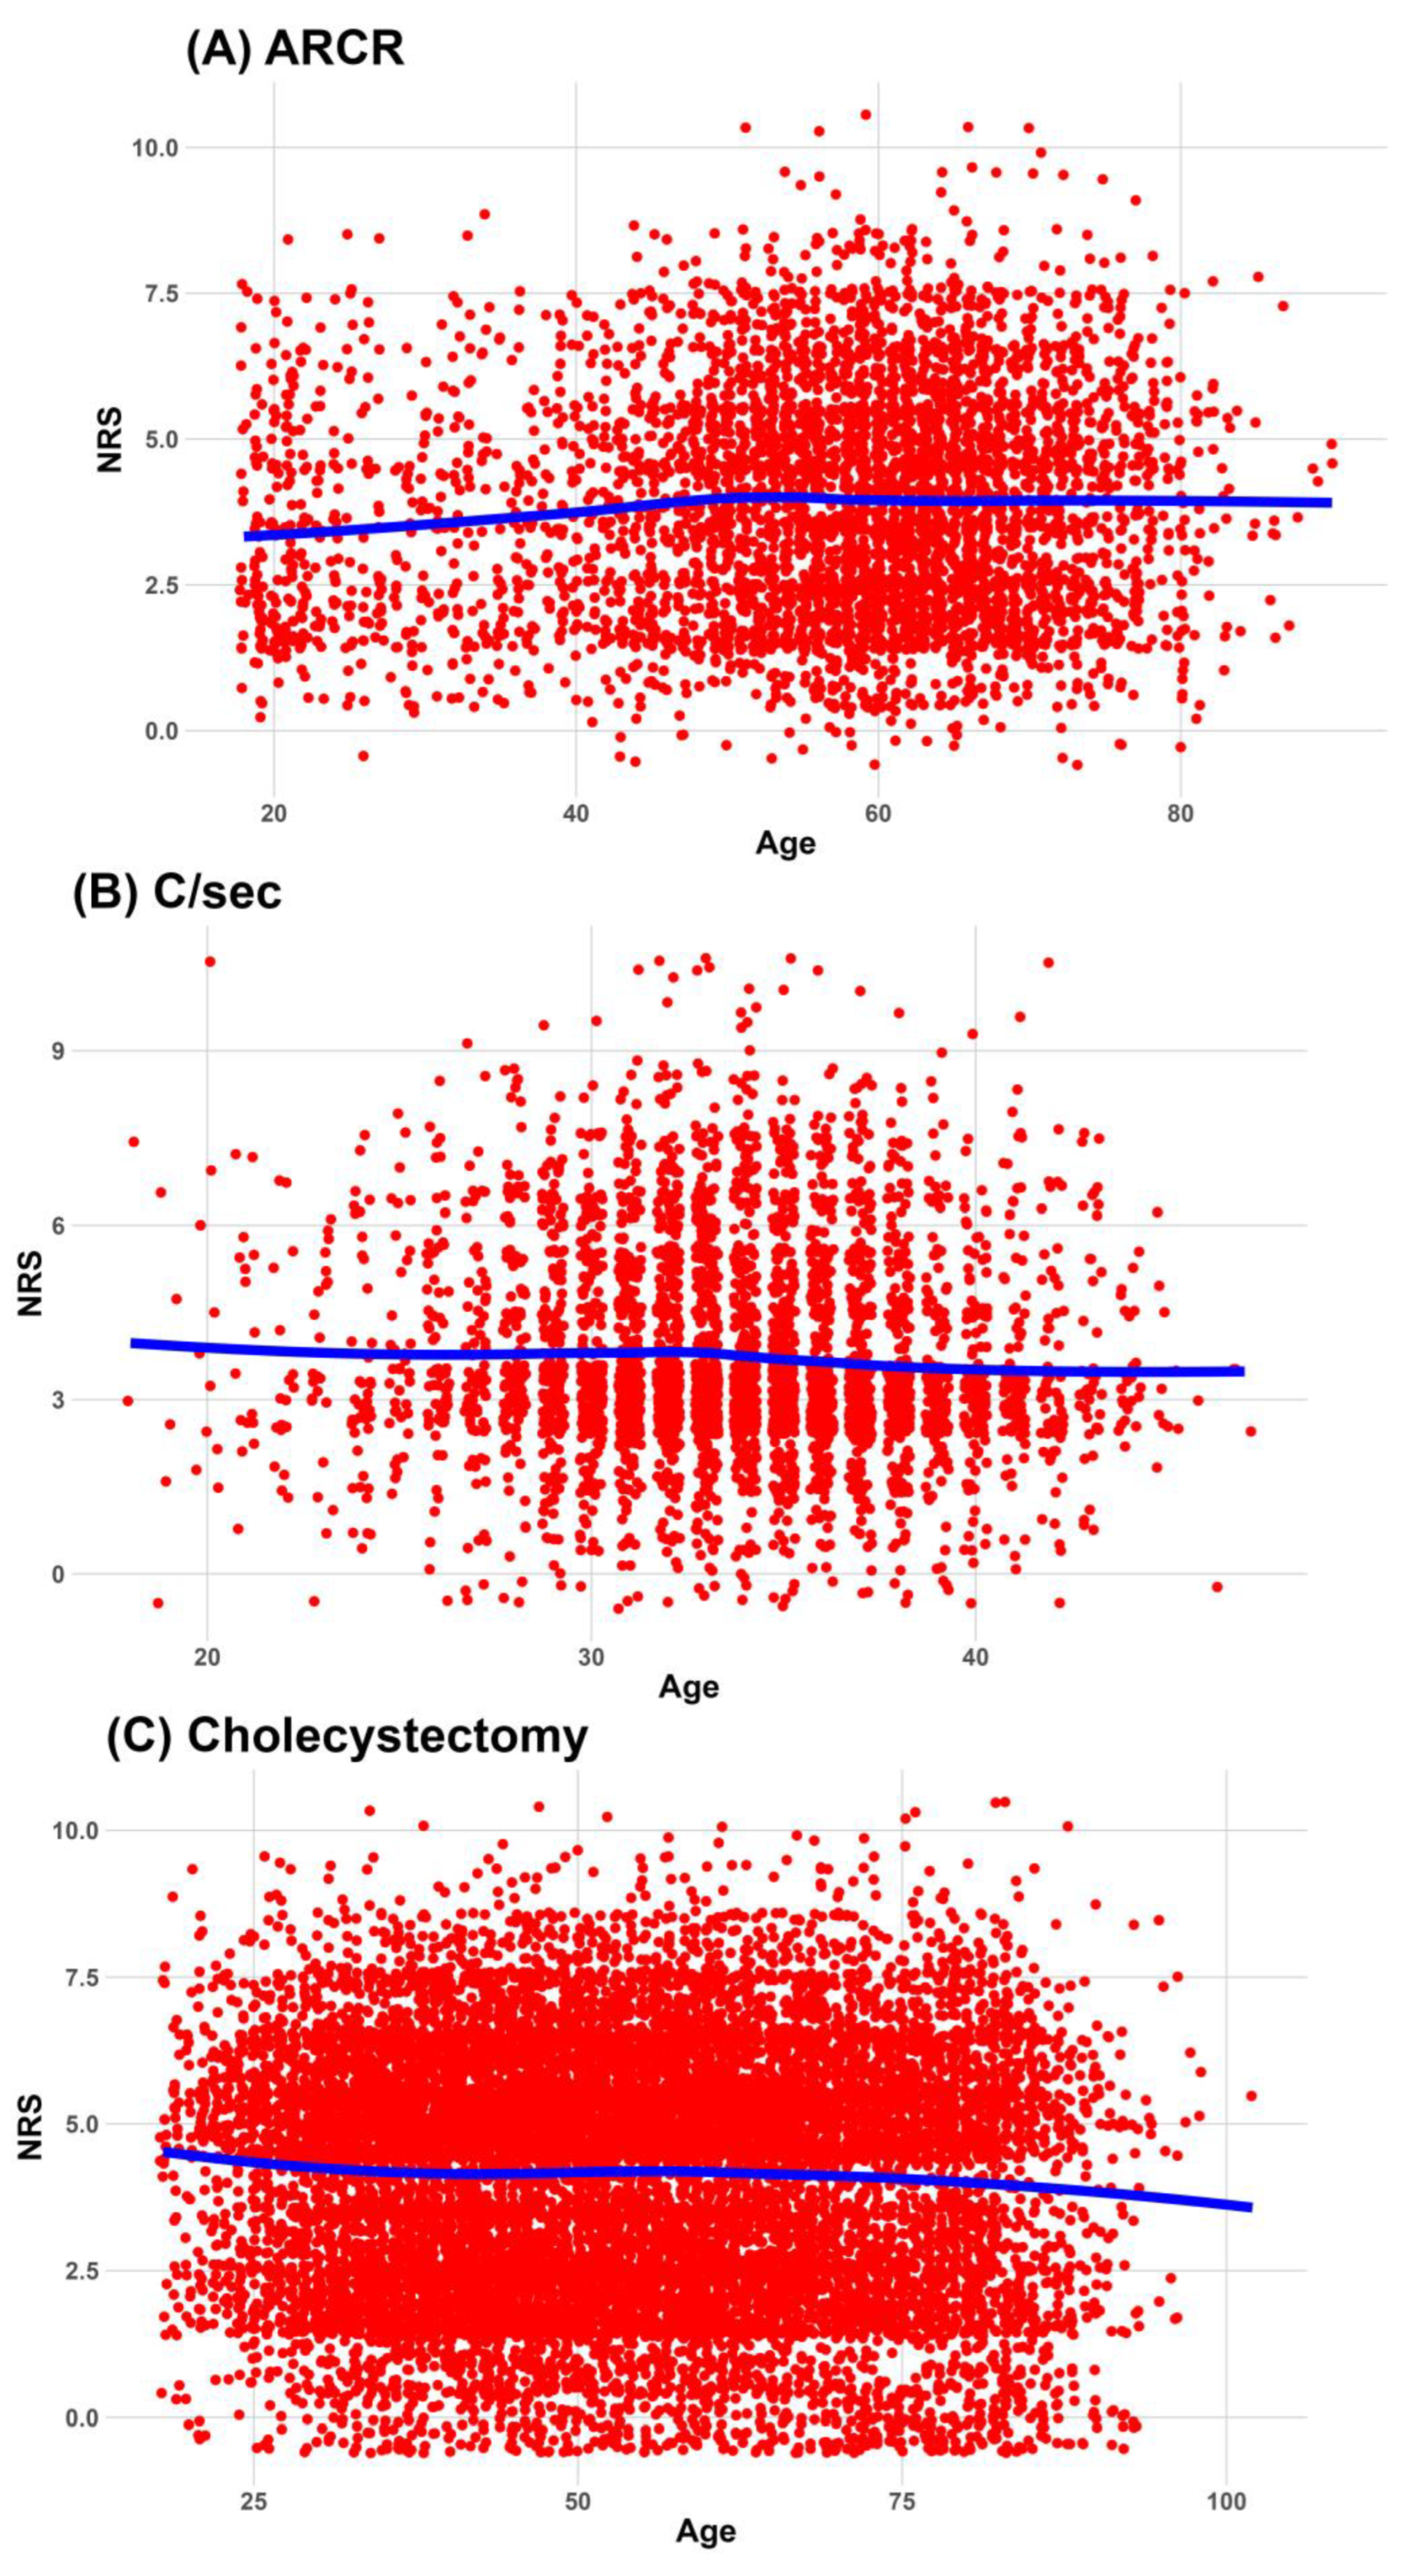
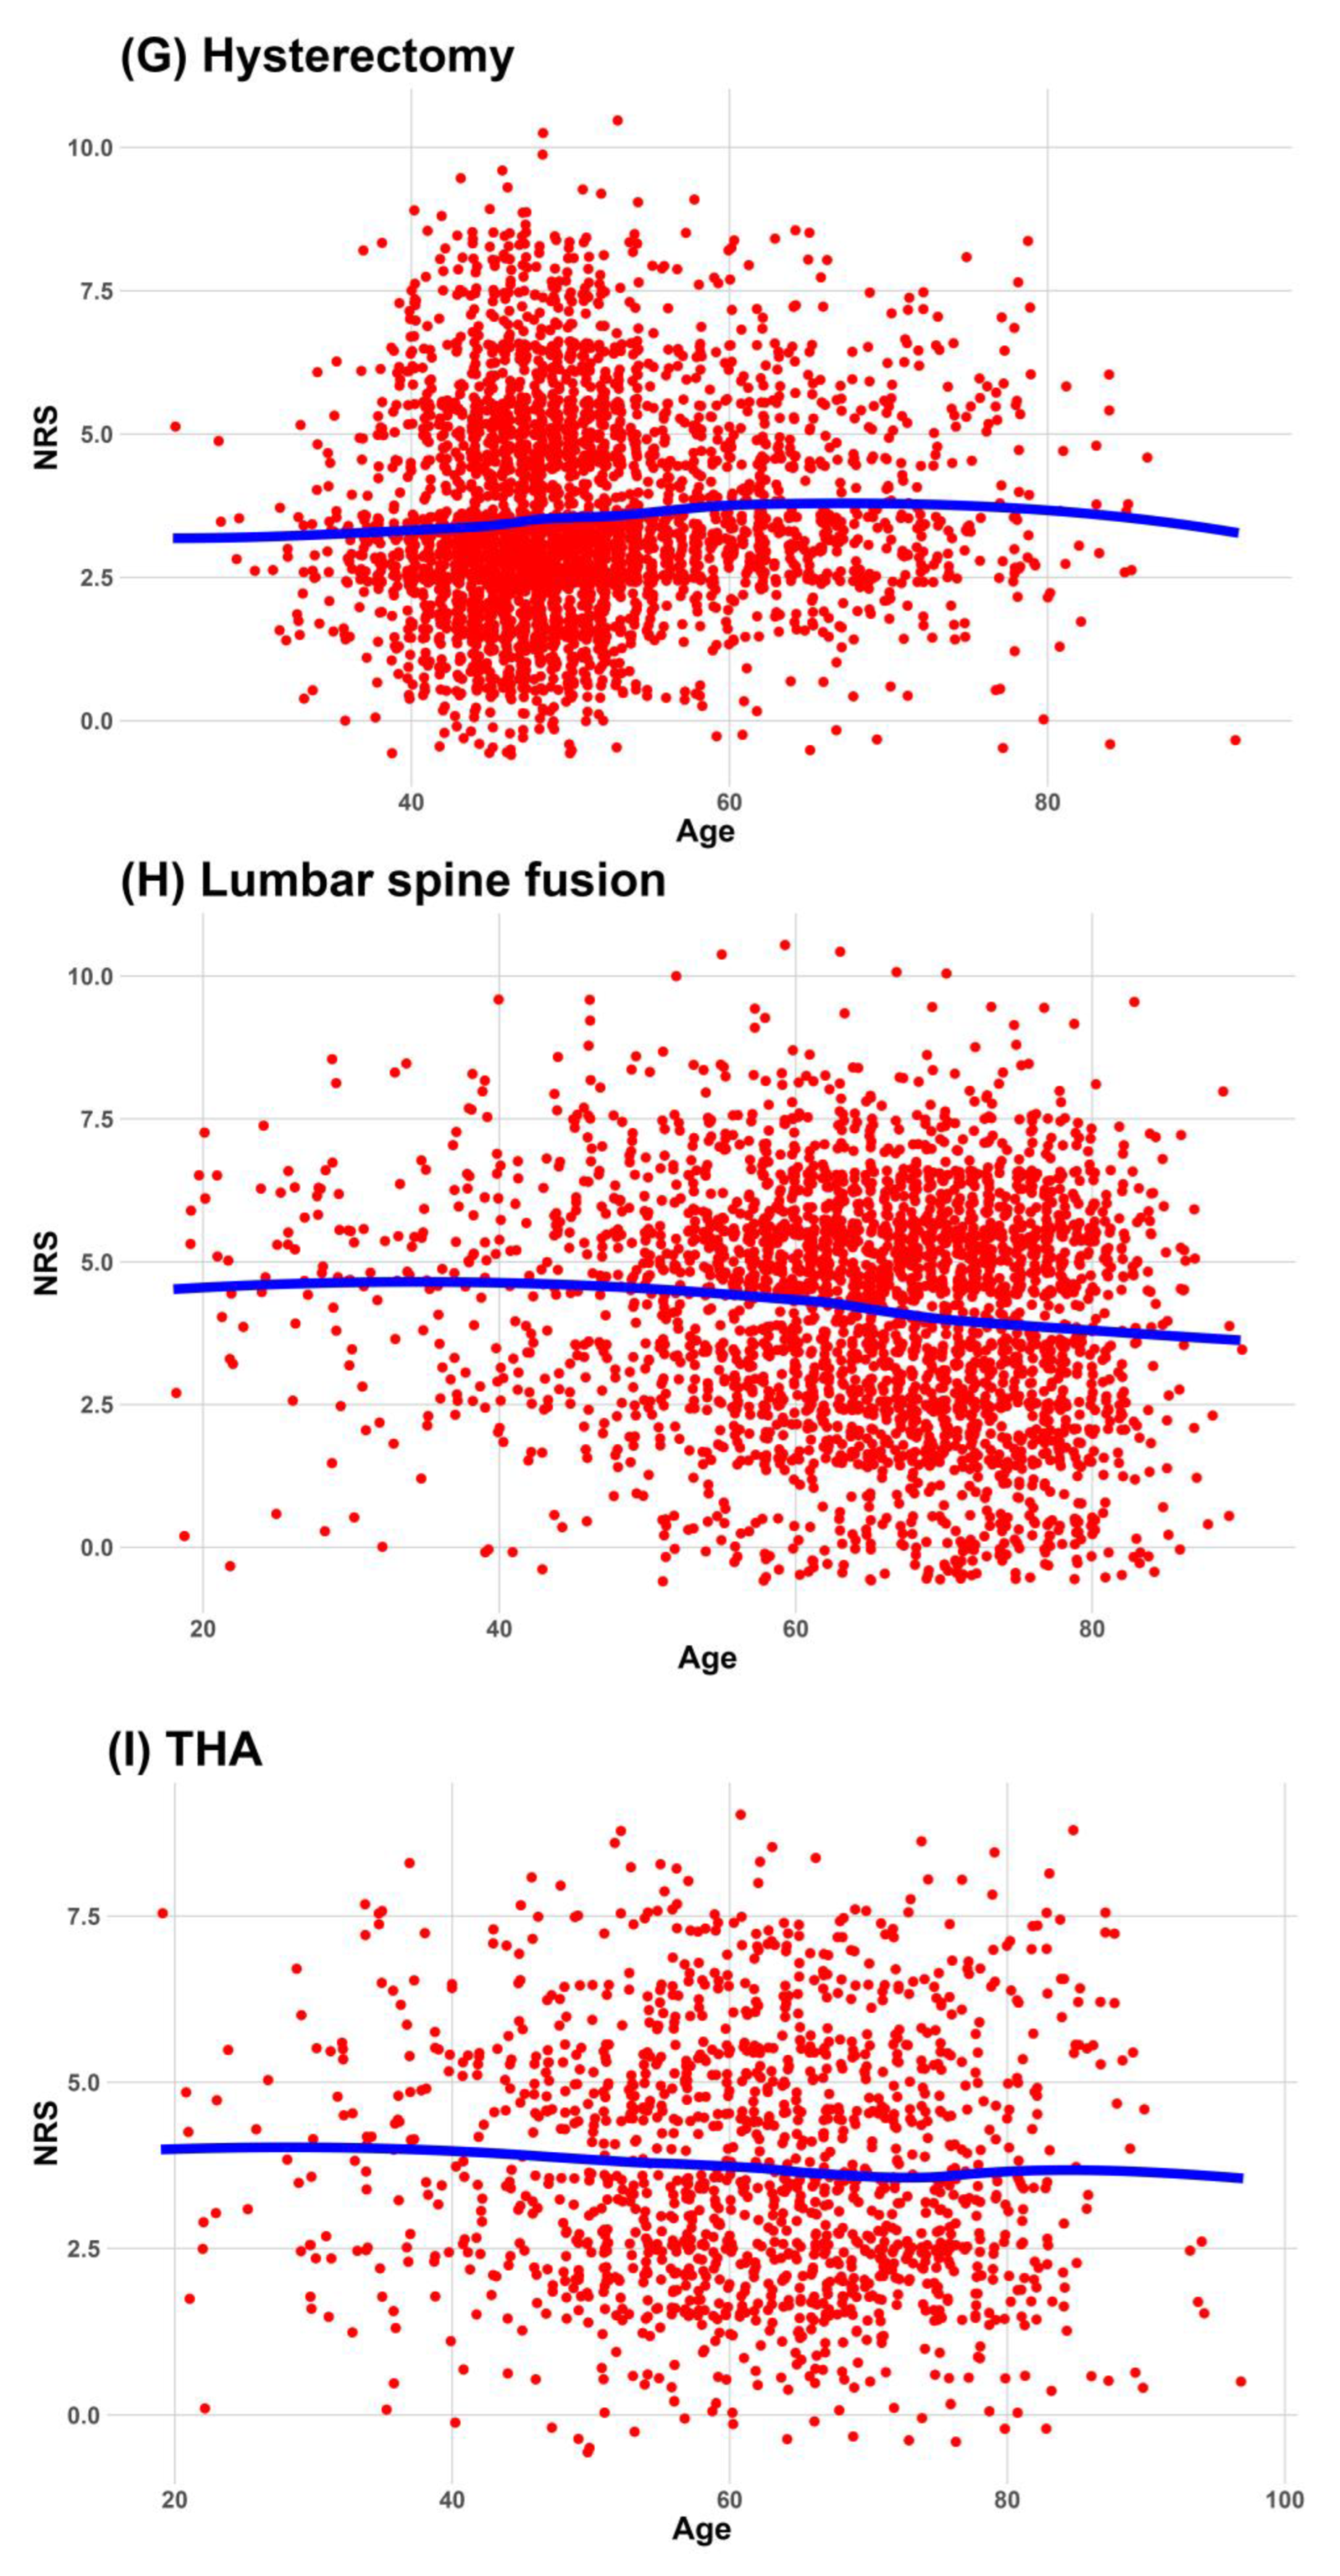
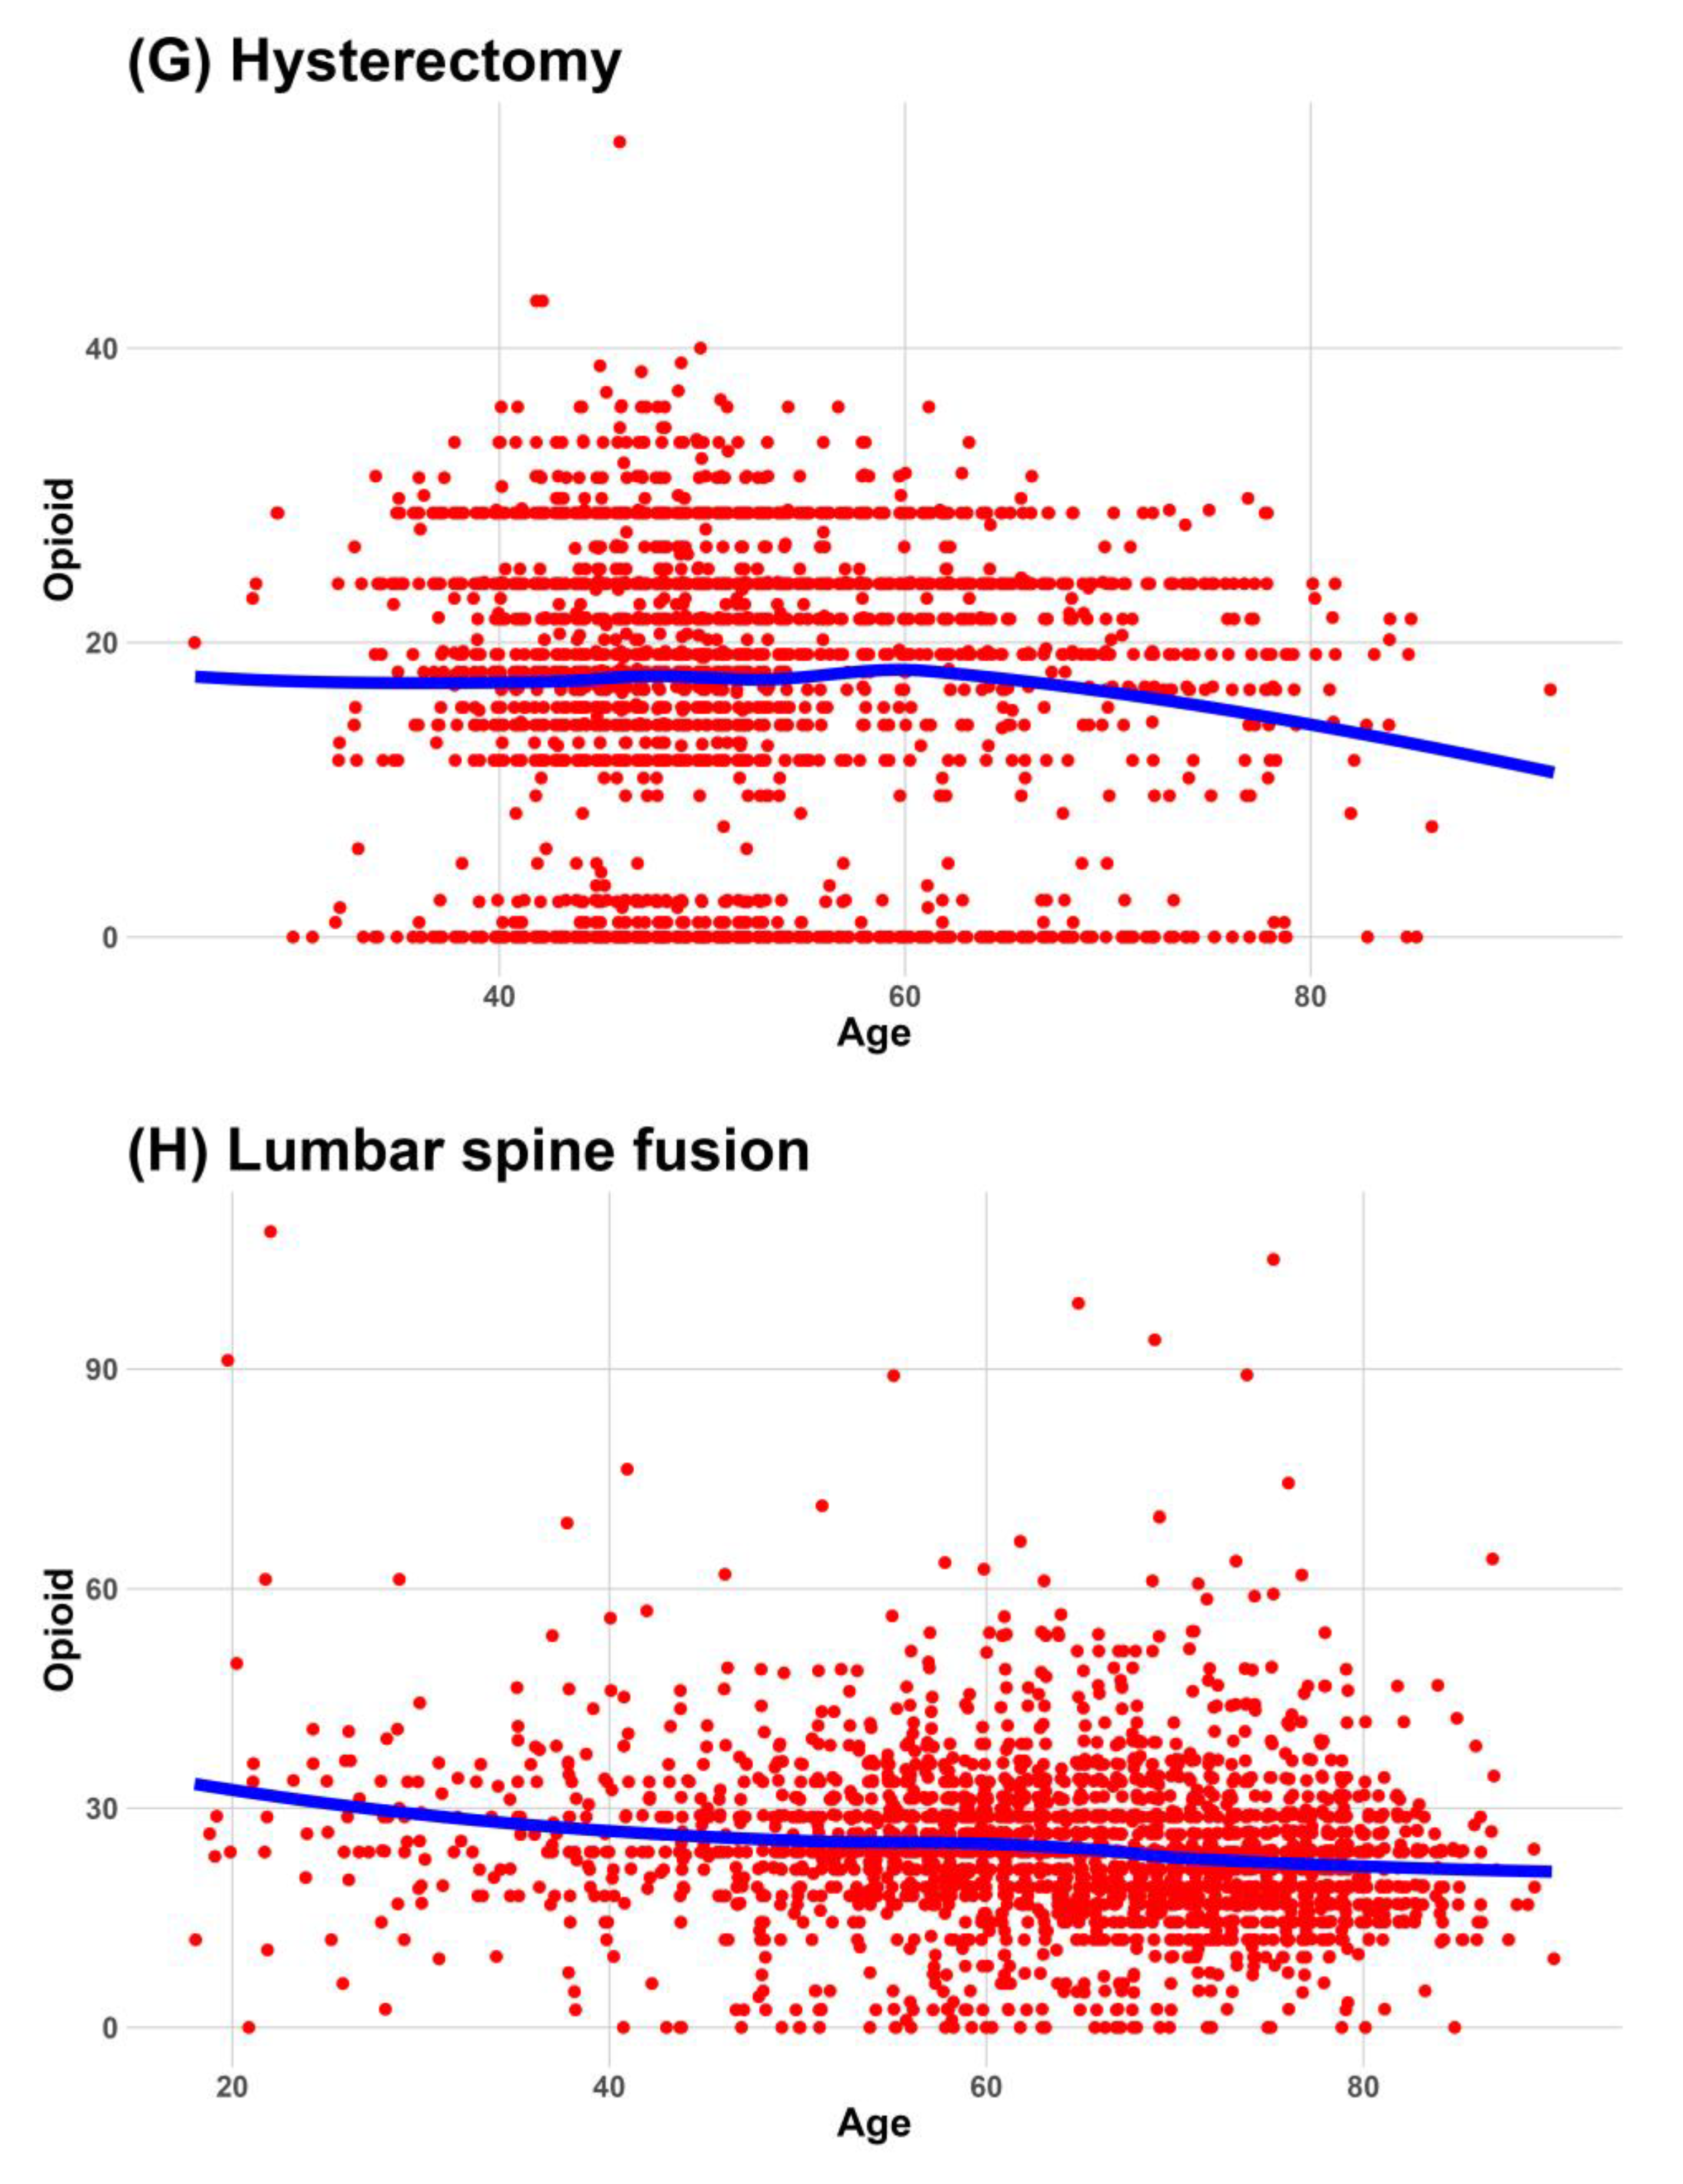
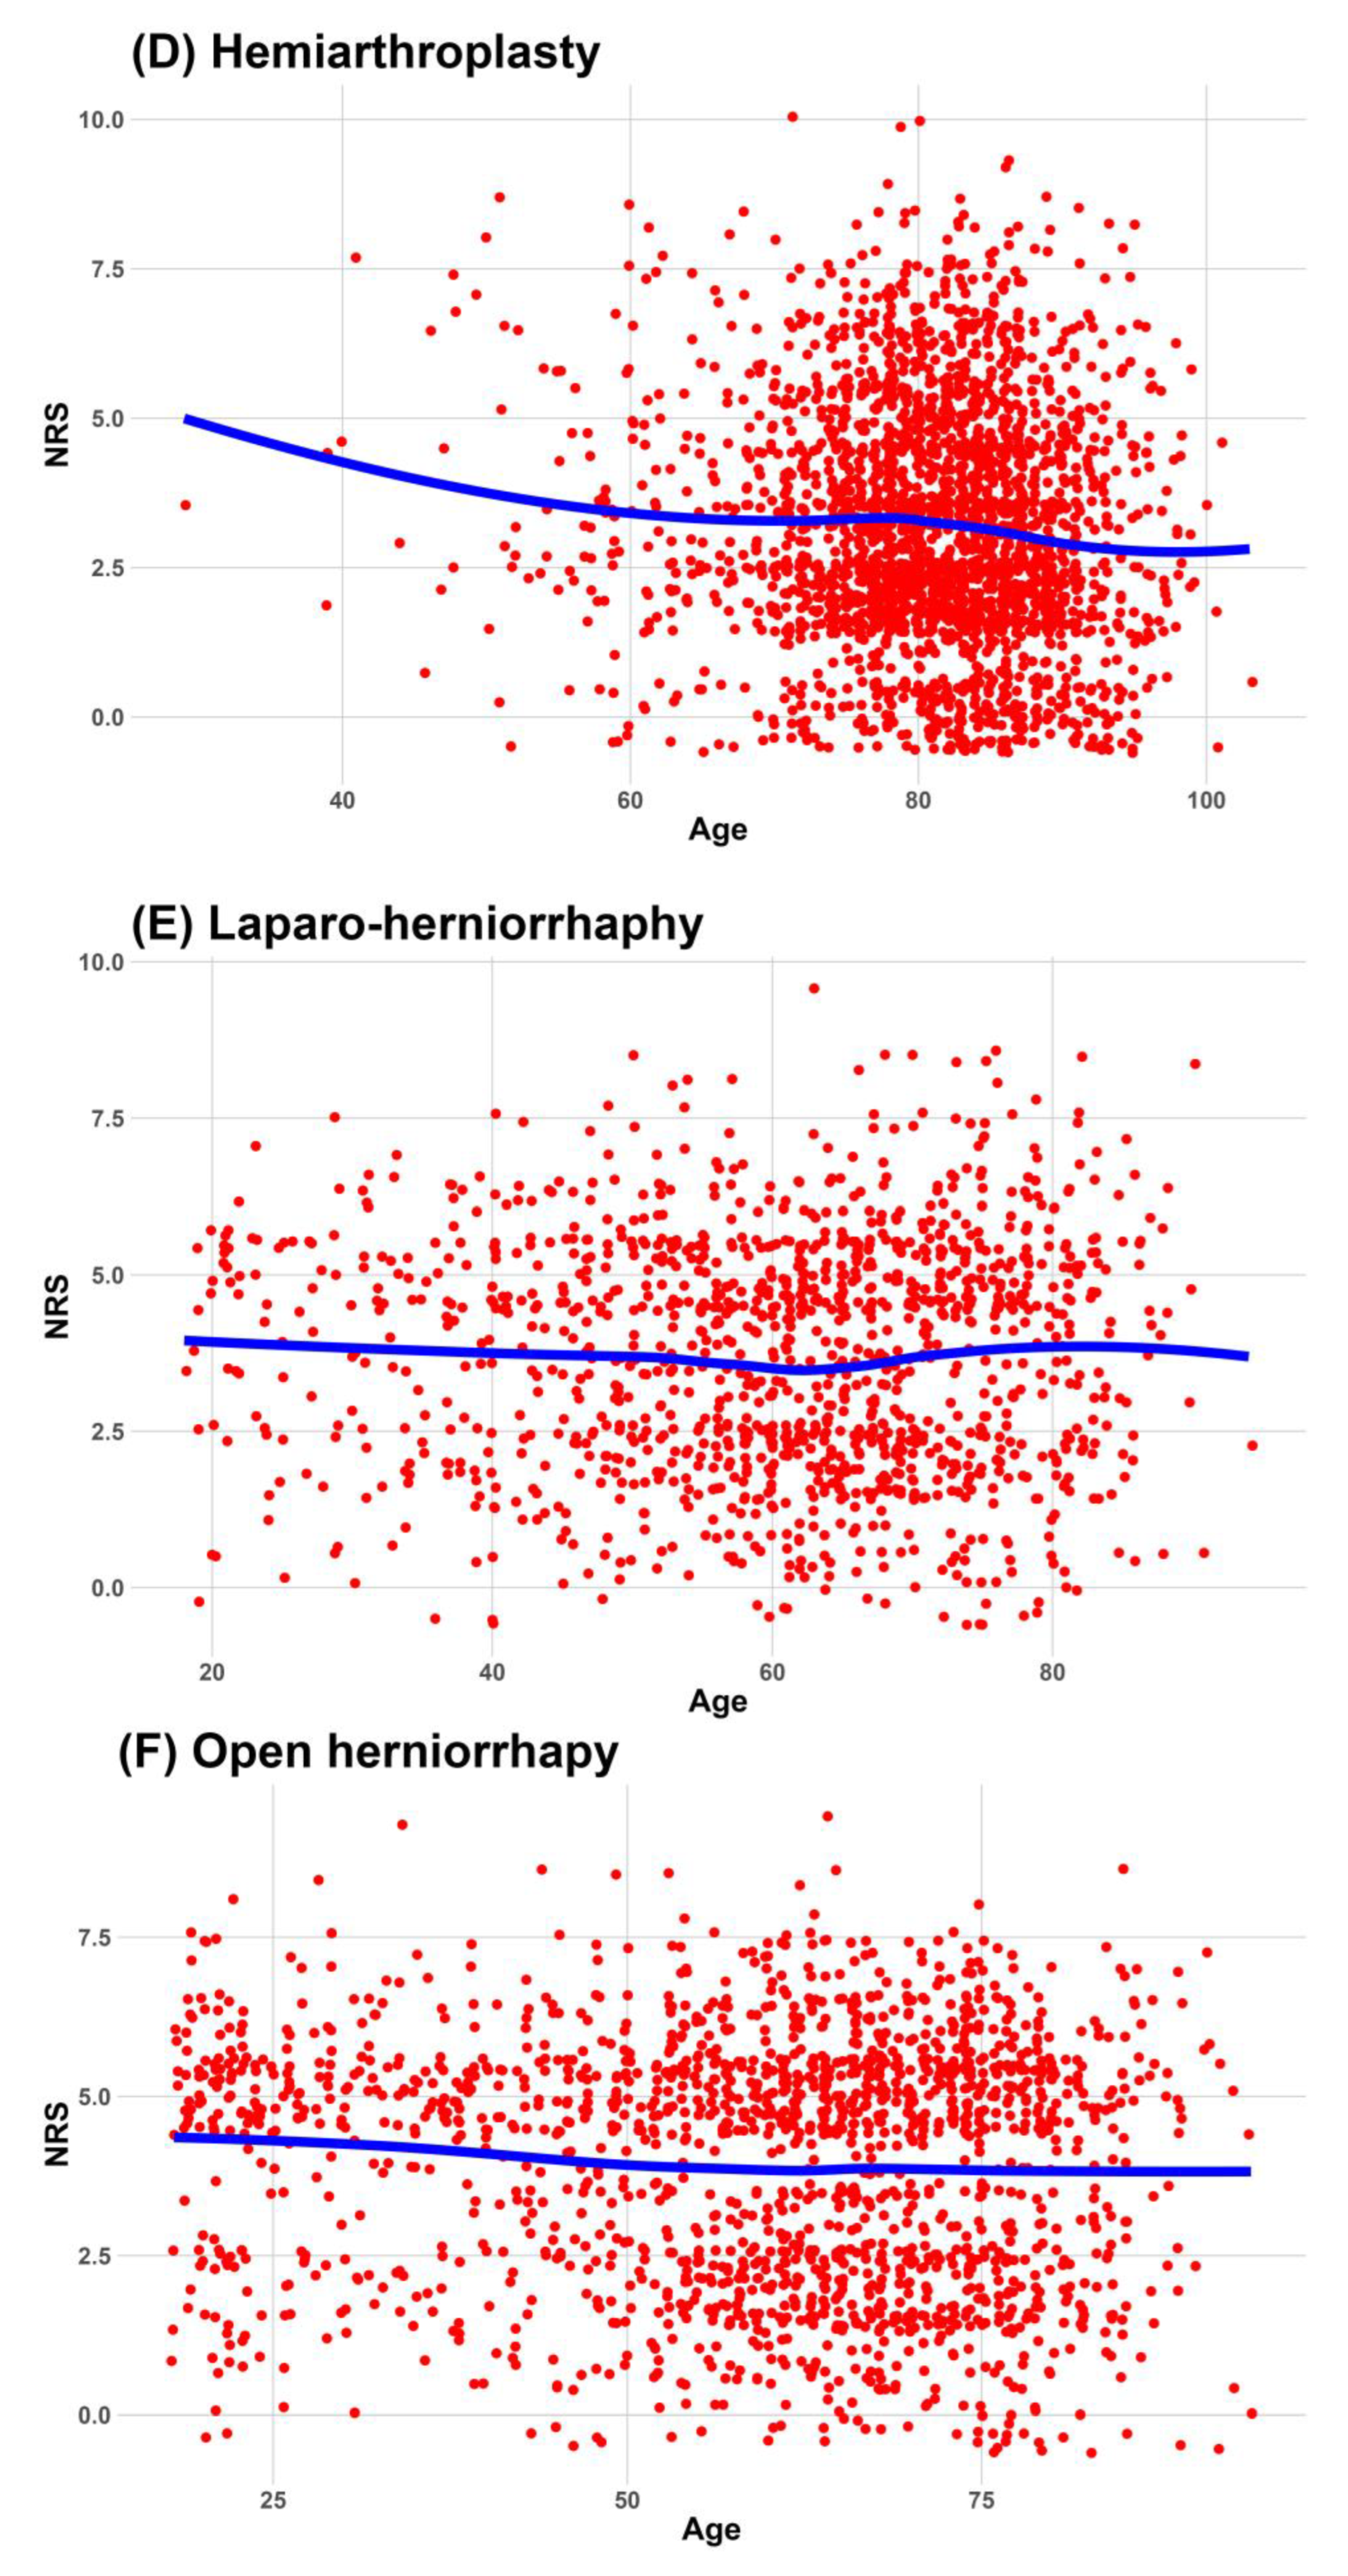
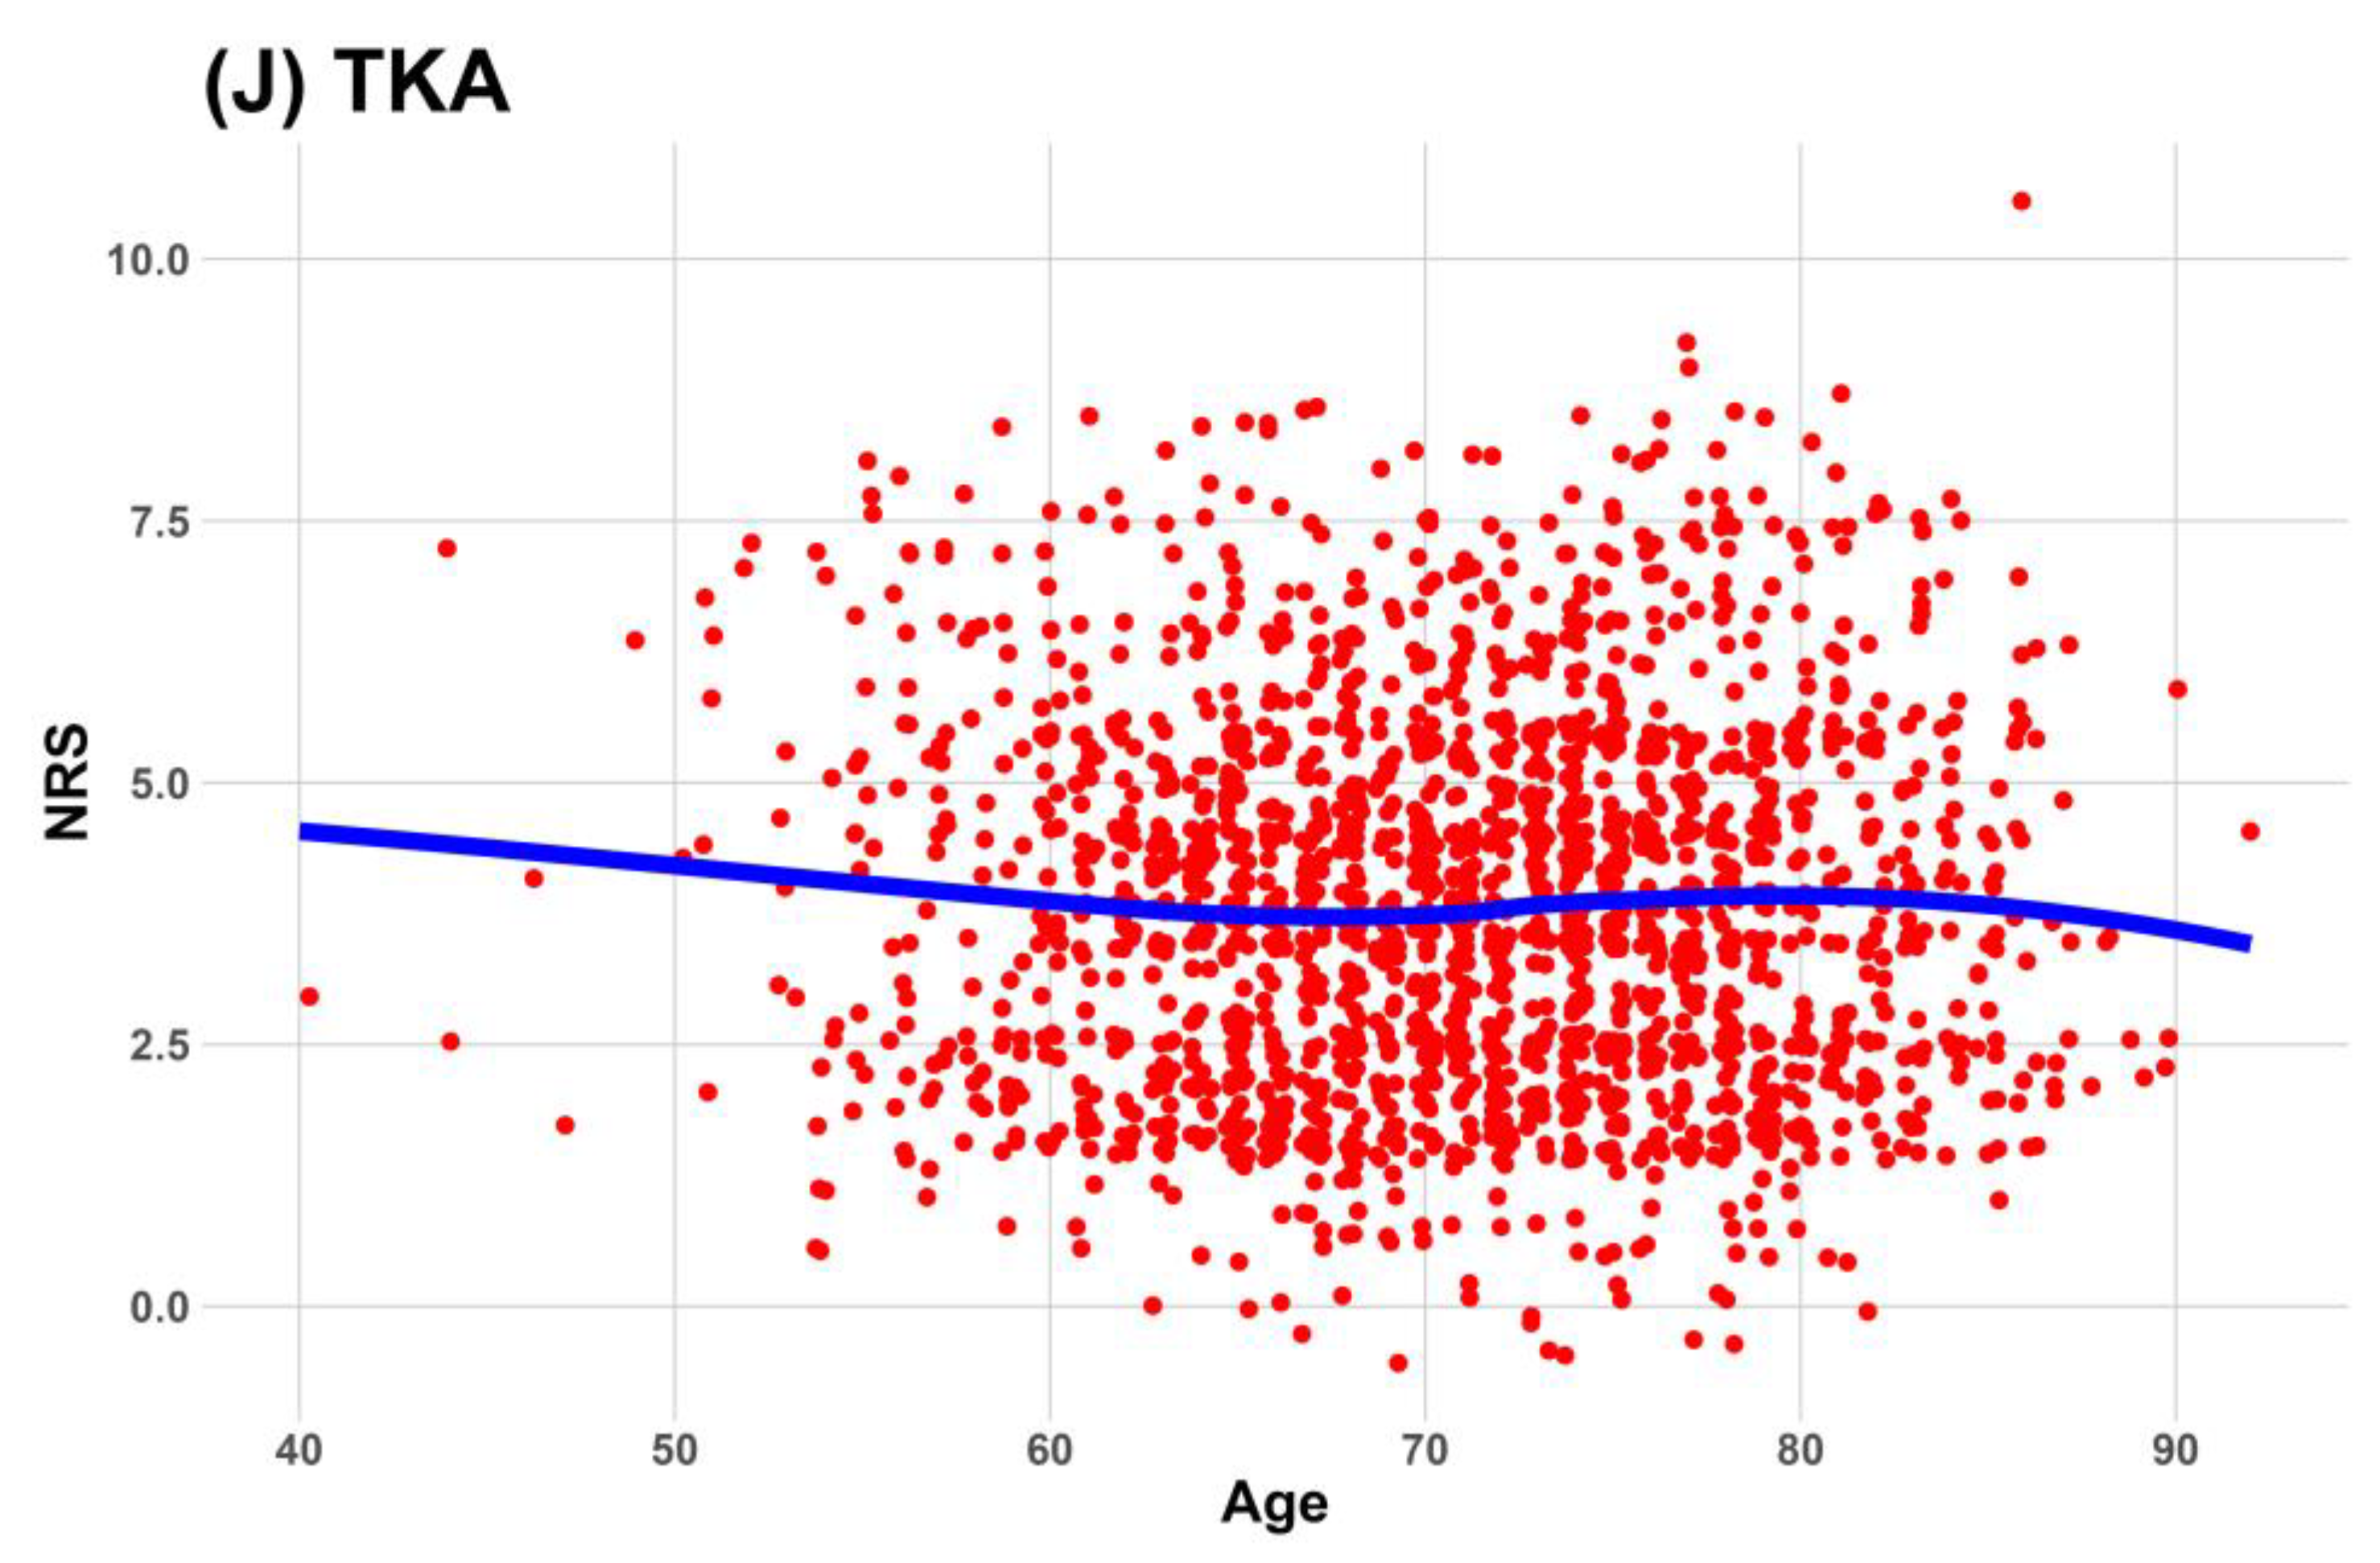
Continuous data were expressed as medians and interquartile ranges, and categorical data were expressed as frequencies and percentages. We used a locally estimated scatterplot smoothing line to fit a smooth curve through the scatterplot of age and NRS. Visualizing the relationship between age and NRS as an optimal-fit curve makes it easier for readers to understand.
Considering the covariates, we analyzed the adjusted association between age and worst pain at 24 h postoperatively using linear regression. The partial R2 between age and NRS score was also calculated. For the subgroup analysis, we analyzed the adjusted association between age and worst pain 24 h postoperatively depending on sex and patient-controlled analgesia (PCA) administration.
Using Bonferroni correction, a p-value ≤ 0.005 was considered statistically significant. SPSS version 26.0 (IBM, Armonk, NY, USA) was used for all analyses, and graphs were drawn using R version 4.2.3 (R Foundation for Statistical Computing, www.r-project.org [accessed on 10 September 2023]).

3. Results

3.1. Patient Characteristics

This study enrolled 47,694 patients aged ≥ 18 who underwent 10 types of surgical procedures between January 2013 and June 2023. A total of 6507 patients were excluded, and 41,187 patients were included in this study (Figure 1). The number, characteristics, and perioperative data according to surgery type are summarized in Table 1.

3.2. Pain Intensity and Dose of Opioid

The median worst pain intensity according to surgery ranged from 3 to 5 on the NRS. Surgeries with a median NRS score of ≥4 included ARCR, cholecystectomy, laparoscopic herniorrhaphy, open herniorrhaphy, lumbar spine fusion, and TKA.
The median opioid dose administered during surgery ranged from 0 to 28.8 mg, depending on the surgery. In herniorrhaphy, ≥75% of the patients did not use opioids. Details of pain intensity and opioid dose administered during the 24 h after surgery are summarized in Table 2.

3.3. Effects of Age on Worst Pain during the 24 h after Surgery

The association between the worst pain score during the 24 h after surgery and age is summarized in Figure 2. In most surgeries, locally estimated scatterplot smoothing lines did not show an age-related decrease in the worst pain score 24 h after surgery. Only after hip hemiarthroplasty does the worst pain score decrease with age and stabilize at approximately 70 years of age.
However, for seven types of surgery—those other than C/s, laparoscopic herniorrhaphy, and open herniorrhaphy—the worst pain scores decreased significantly with age when other factors were adjusted. Details of the association between age and worst pain during the 24 h after surgery are summarized in Table 3.

3.4. Association between Age and Worst Pain According to Sex and PCA Administration 24 h after Surgery

Considering the surgical characteristics, C/sec and hysterectomy were excluded from the analysis based on sex. The worst pain scores for cholecystectomy and lumbar spine fusion decreased significantly in males and females. Details of the association between age and worst pain according to sex during the 24 h after surgery are summarized in Table 4.
The number of patients who received PCA was 29,388. The percentage of patients who received PCA in ARCR, C/sec, hip hemiarthroplasty, hysterectomy, lumbar spine fusion, TKA, and THA was over 80%; however, that of herniorrhaphy was 10–20%. Except for ARCA and hysterectomy, the worst pain score significantly decreased with age in patients who received PCA. Details of the association between age and the worst pain during the 24 h after surgery in patients who received PCA are summarized in Table 5.

3.5. Effects of Age on the Administered Opioid Dose during the 24 h after Surgery

Locally estimated scatterplot smoothing lines show an age-related decrease in the administered dose of opioids during the 24 h after surgery in several surgeries, such as hip hemiarthroplasty, hysterectomy, lumbar spine fusion, THA, and TKA. The association between the administered dose of opioids during the 24 h after surgery and age is summarized in Figure 3.
However, for six types of surgery, including ARCR, cholecystectomy, hip hemiarthroplasty, lumbar spine fusion, THA, and TKA, the administered dose of opioids was significantly reduced with age when other factors were adjusted. Details of the association between age and the administered dose of opioids during the 24 h after surgery are summarized in Table 6.

4. Discussion

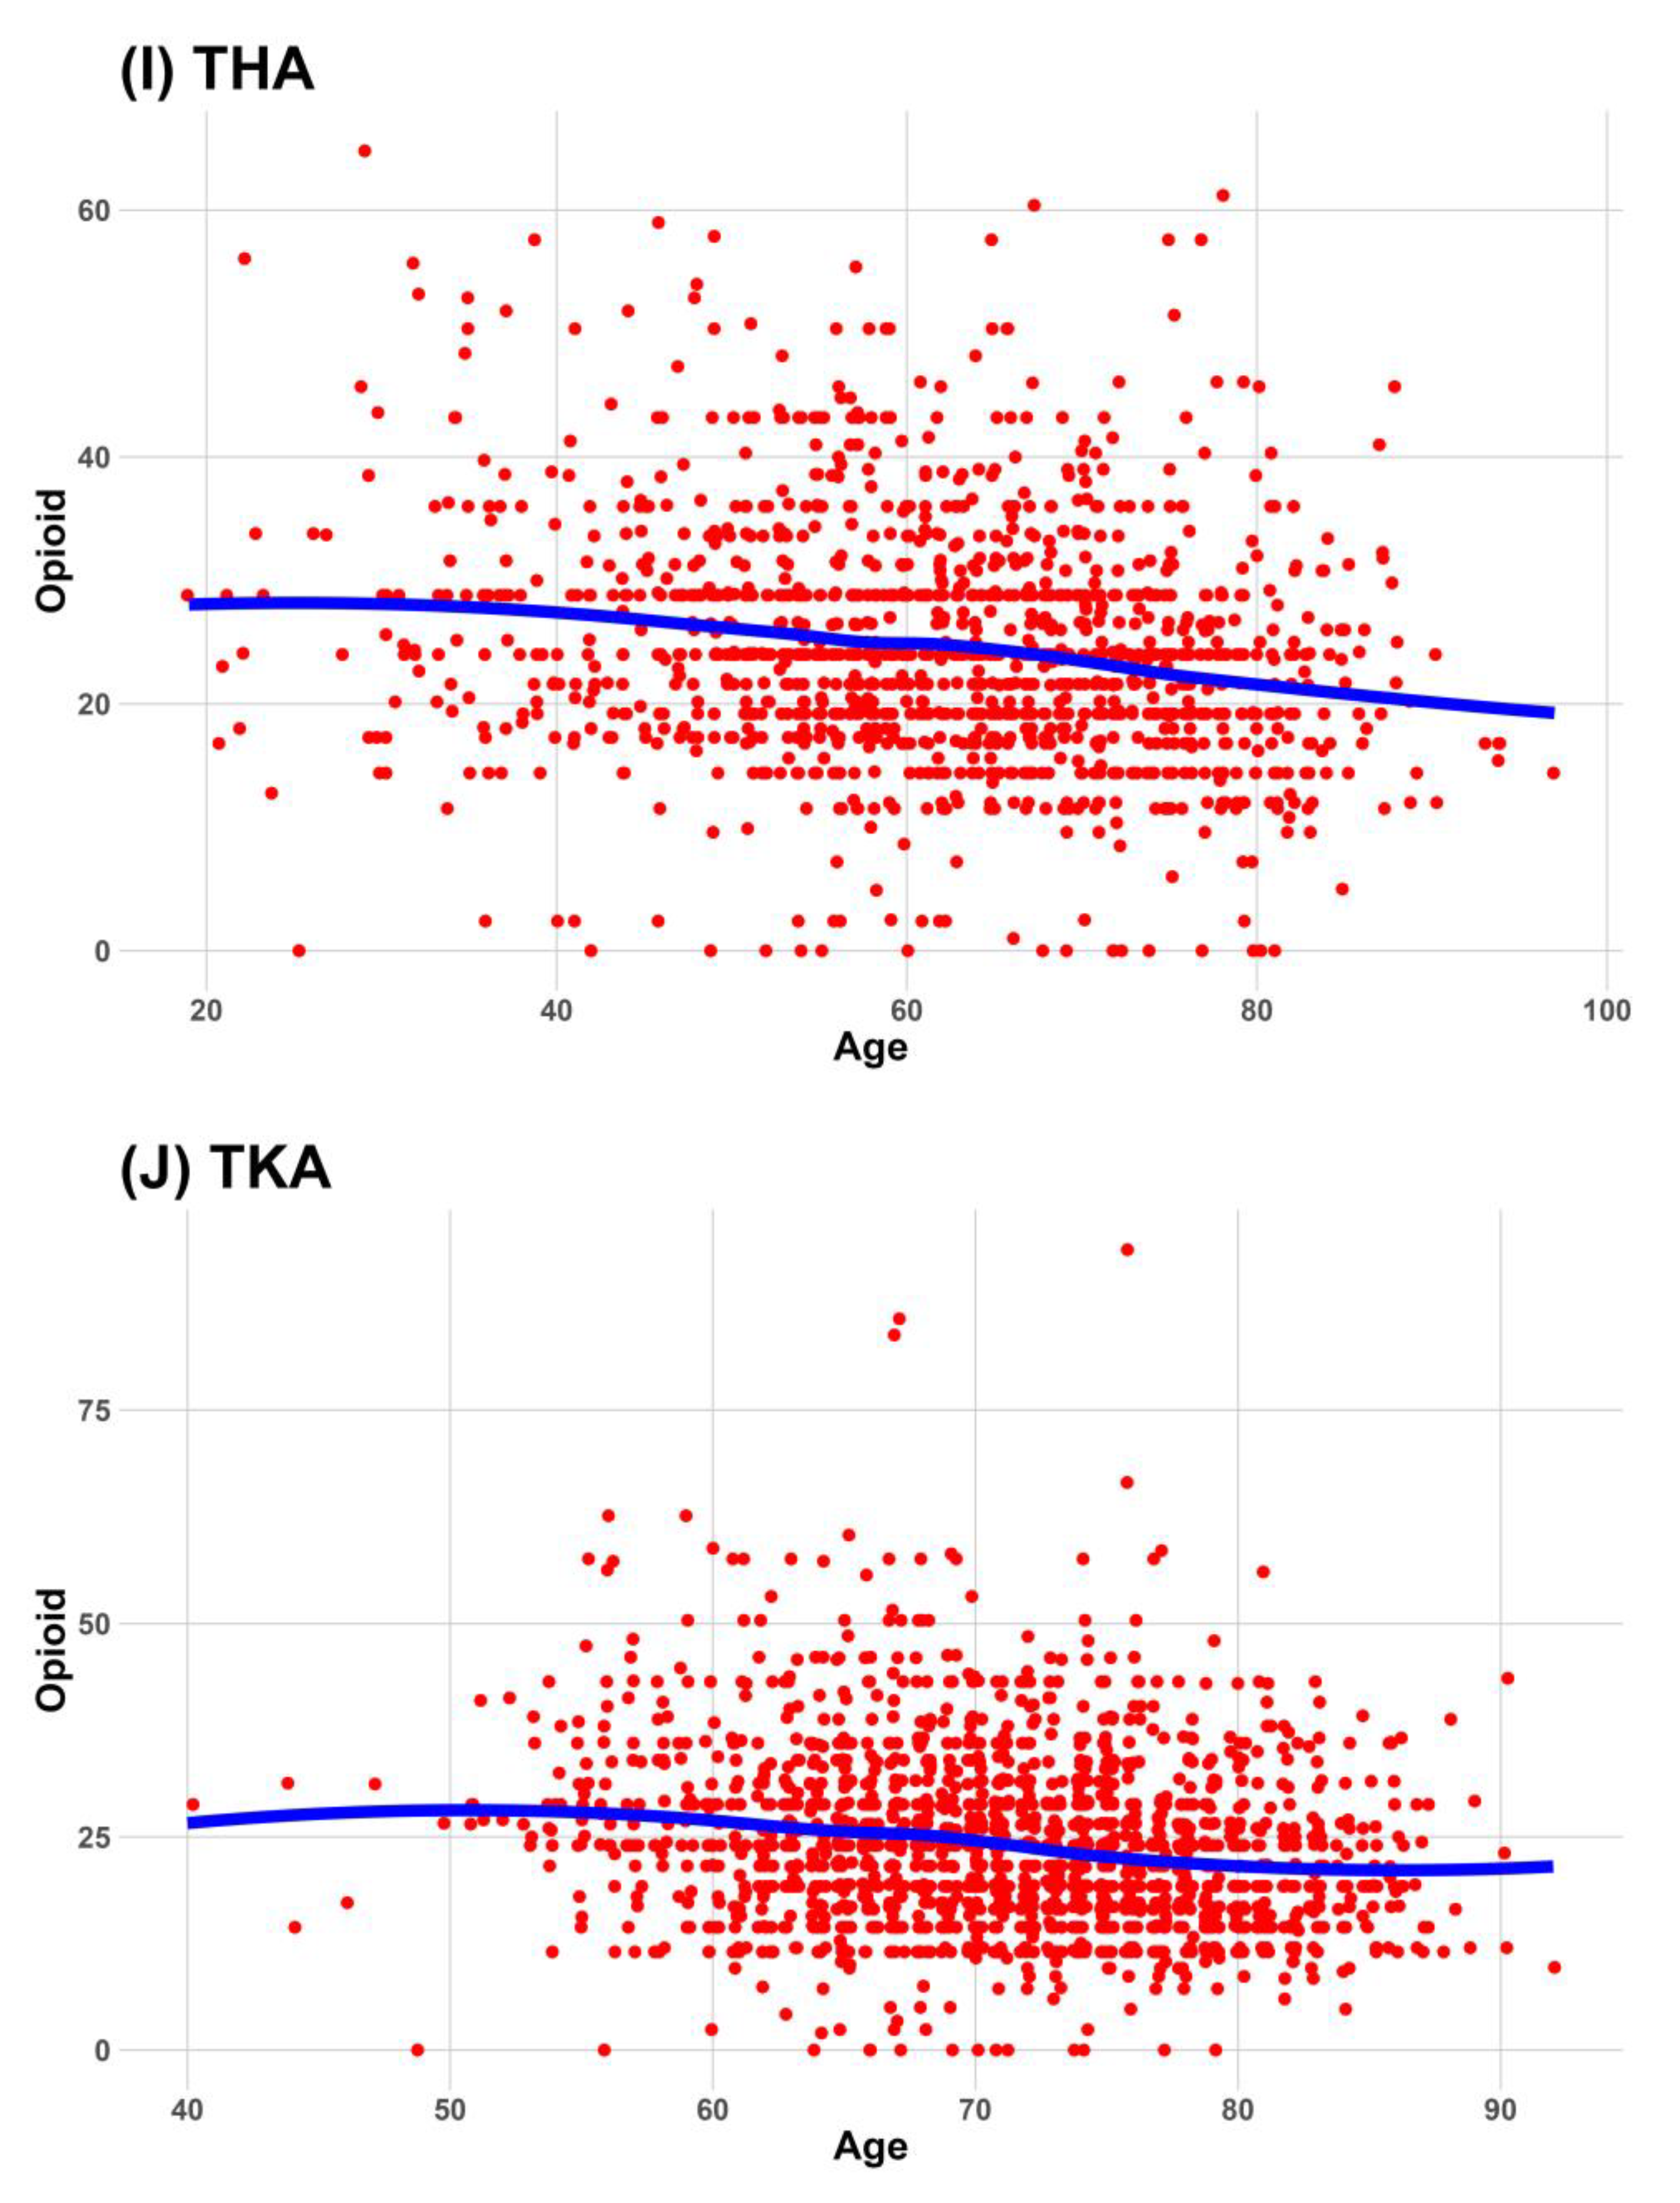
This study investigated the relationship between age and the worst postoperative pain during the 24 h after surgery in 10 surgical procedures. The worst pain associated with cholecystectomy and lumbar spine fusion decreased consistently and significantly with increasing age in all analyses, including the subgroup analysis. These were also included in six surgeries (ARCR, cholecystectomy, hip hemiarthroplasty, lumbar spine fusion, THA, and TKA), which decreased the administered dose of opioids with age. However, considering a 2.4 unit reduction in the NRS is required for clinically meaningful pain relief in moderate or severe pain [15], only lumbar spine fusion showed clinical and statistical decreases in pain with age consistently and significantly in several analyses.
Jacqueline et al. reported an association between postoperative pain and age using an international database of hip replacement, knee replacement, spinal fusion, and laparoscopic surgery [12]. Their study included various pain measurements such as worst pain, pain associated with moving, breathing/coughing, and sleeping, and the worst postoperative pain decreased with increasing age in all four types of surgeries. Our study included the types of surgeries used in their study; however, there were several differences between them. Our analyses did not all consistently show a decrease in worst pain with increasing age in hip hemiarthroplasty, THA, TKA, or laparoscopic cholecystectomy, except for lumbar spine fusion. Their worst NRS scores were generally higher than those in our study. The patients in our study who underwent lumbar spinal fusion, THA, TKA, or hip hemiarthroplasty had a worst NRS score approximately 1–2 units lower than others in their study. Considering their higher NRS scores, information on postoperative pain control modalities was insufficient. TKA, THA, hemiarthroplasty, and lumbar spinal fusion have long skin incisions and comparable surgical wounds, and several postoperative pain control modalities, including PCA, can be applied. Therefore, it is difficult to generalize the results without knowing how pain was controlled.
However, two studies reported an association between age and postoperative pain in patients using analgesic methods. Koh JC et al. investigated postoperative pain in young (age 20–39 years) and older adult (age ≥ 70 years) patients with patient-controlled epidural analgesia application [11]. Although they did not analyze the type of surgery, the mean NRS score for pain intensity within 24 h was 3–5. Young patients had significantly more severe pain than older adult patients 6 h after surgery. Barrington et al. studied postoperative pain after TKA in patients who received local analgesic injections [10]. They investigated average pain intensity using the visual analog scale (VAS) and age-reduced pain intensity using multivariate regression analysis for overall average VAS pain scores. Our study also showed that increasing age decreased pain intensity in patients who received PCA. However, the two previous studies did not investigate the worst pain separately, and the overall pain intensity of patients with pain control was not high. One study showed that the differences in NRS scores between old and young patients were <1 unit [11]. In our study, the median worst pain intensity in patients who received PCA was <4 in several surgeries. In patients with low pain intensity, the clinical effect of age on pain intensity was not statistically significant.
In our study, we found that the median NRS worst pain score was the same in all patients and in patients who received PCA in seven surgeries that had a high percentage of PCA administration, such as ARCR, C/sec, hip hemiarthroplasty, hysterectomy, lumbar spine fusion, THA, and TKA. In contrast, in surgeries with a low percentage of PCA administration, such as cholecystectomy and herniorrhaphy, the median NRS worst pain score in patients who received PCA was lower than that in all patients. These results were consistent with the order of the administered median doses of opioids according to surgery. According to the administered opioid dose, the top seven surgeries were those that had the same median NRS for patients with and without PCA, while the bottom three surgeries were those that had different median NRS for patients with and without PCA. However, to clarify the association between opioids and the worst pain, further studies that consider the adverse effects of high doses of opioids are needed.
The effects of aging on pain intensity should be considered based on several factors. Aging is associated with anatomical and neurochemical changes [16] affecting pain perception. Aging is associated with increased pain thresholds [17,18] and reflects reduced pain sensitivity [19]. It has been reported that pain intensity in chronic pain does not vary with age [20,21,22]; however, acute pain can be caused by damage, such as surgery, and is related to skeletal muscle spasms and sympathetic nervous system activation [23]. An experimental study showed that aging affects the fast initial pain response but does not affect the sustained pain response [24]. The effect of age on pain intensity may differ according to surgery as pain threshold differs according to the size of the surgery and the peripheral cutaneous or visceral sites [17].
The relationship observed between age and postoperative pain intensity in various surgical procedures should be considered the potential role of pharmacokinetics, especially in the context of opioids. Opioids are commonly used analgesics for postoperative pain management, and their pharmacokinetic profiles can vary with age, which could potentially impact pain outcomes in the elderly [25]. Elderly patients often show a decrease in hepatic enzyme activity, which can lead to an extended half-life of opioids [26], which can impact pain relief. Aging is also associated with changes in receptor sensitivity, including opioid receptors, so elderly patients may respond differently to opioids than younger patients [27,28]. Given these pharmacokinetic considerations, the variable effects of age on postoperative pain intensity observed in this study may be partly due to differences in the way opioids are metabolized and utilized in elderly patients compared to younger individuals.
The strength of this study is that it focused on 10 types of surgeries, which may represent the various spectra of surgical procedures, and investigated patients using pain control modalities, such as PCA. However, this study has some limitations:
The present study used the NRS to assess pain intensity. Although the NRS is a commonly used tool, it is subjective and may not capture the full complexity of pain experiences. Nonetheless, it provides a structured format, has good sensitivity, and generates data that can be statistically analyzed for audit purposes compared to the VAS, which may reduce variability in interpretation [29,30,31].
This study focused on postoperative pain within 24 h after surgery. Pain experiences might change over an extended period, and considering pain trajectories beyond the first 24 h could provide additional insights.
This study acknowledges that various pain control modalities may have been used and that some data may be heterogeneous, except for PCA, which could have influenced pain intensity. Recently, multimodal analgesic methods are used, even in minor surgeries such as laparoscopic cholecystectomy and inguinal hernia repair [29,30]. Specific details regarding the types of analgesic methods and their dosages, except for included factors, are yet to be discussed, making it challenging to understand their full impact on the results.
While our intention was to assemble a diverse dataset to bolster the generalizability of our results, this study may be susceptible to potential biases stemming from variations in hospital protocols, patient populations, and data-collection methodologies. Moreover, these variations may potentially influence the observed outcomes.
In conclusion, this study provided valuable insights into the relationship between patient age and postoperative pain during various surgical procedures. Although age influences postoperative pain intensity in some surgeries, the findings are inconsistent across all procedures. They can differ according to the type of surgery and PCA administration. These findings suggest that the impact of pain control modalities emphasizes the importance of personalized pain management approaches. Future research should address the limitations of this study and explore additional factors that might influence postoperative pain to enable better pain management practices and improve patient outcomes.

Author Contributions

Conceptualization, Y.-S.K. and J.-J.L.; methodology J.-H.K. and Y.-S.K.; software, J.-H.K.; validation, Y.-S.K.; formal analysis, Y.-S.K.; investigation, J.-H.K.; resources, J.-J.L. and J.-H.S.; data curation, J.-H.K.; writing—original draft preparation, Y.-S.K. and J.-H.K.; writing—editing, all authors; visualization, J.-H.K.; supervision, J.-H.S. and J.-J.L.; project administration, J.-J.L. and J.-H.S.; All authors have read and agreed to the published version of the manuscript.

Funding

This research was supported by the Bio&Medical Technology Development Program of the National Research Foundation (NRF) funded by the Korean government (MTIS) (No. RS-2023-00223501).

Institutional Review Board Statement

This study was conducted in accordance with the Declaration of Helsinki and approved by the Clinical Research Ethics Committee of Chuncheon Sacred Hospital.

Informed Consent Statement

Not applicable.

Data Availability Statement

Restrictions apply to data availability. Data were obtained from the Hallym Medical Center and are available from its clinical data warehouse with permission from the Hallym Medical Center.

Conflicts of Interest

The authors declare that this research was conducted in the absence of commercial or financial relationships that could be construed as potential conflict of interest.

Appendix A. Surgery-Specific Codes for Determining the Type of Surgery (https://www.koicd.kr/main.do, accessed on 24 July 2023)

Type of SurgeryCode
ARCRN0936, N0937, N0938,
Cesarean SectionR4514A, R4514J, R4516, R4517, R4517A, R4518, R4518A, R4519, R4519A, R4520, R4520A
Laparoscopic cholecystectomyQ7380, Q7380G
Lumbar spine FusionN0466, N0469, N1460, N1466, N1469, N2470
Hip HemiarthroplastyN0715, N0715A, N1715, N1715A, N1725, N2710, N2710A, N4710, N4710A
Inguinal HerniorrhaphyQ2753, Q2753G, Q2754G, Q2755, Q2755G, Q2756, Q2756G
HysterectomyR0141, R0142, R4143, R4144, R4147, R4148
THAN0711, N0711A, N0711R, N1711, N1711A, N1721, N2070, N2070A, N3710, N3710A, N3720
TKAN2072, N2077, N3712, N3717, N3722, N3727
ARCR, arthroscopic rotator cuff repair; THA, total hip arthroplasty; TKA, total knee arthroplasty.

Appendix B. Opioid Equivalent Dose for Opioid Dosage Calculation

Drugs
Morphine10 mg
Oxycodone10 mg
Meperidine100 mg
Nalbuphine10 mg
Tramadol100 mg
Transdermal Fentanyl patch 12.5 mcg/h
Transdermal Buprenorphine patch10 mcg/h
Fentanyl0.1 mg
Alfentanil1 mg
Sufentanil0.01 mg

References

  1. Raja, S.N.; Carr, D.B.; Cohen, M.; Finnerup, N.B.; Flor, H.; Gibson, S.; Keefe, F.J.; Mogil, J.S.; Ringkamp, M.; Sluka, K.A.; et al. The revised International Association for the Study of Pain definition of pain: Concepts, challenges, and compromises. Pain 2020, 161, 1976–1982. [Google Scholar] [CrossRef] [PubMed]
  2. Gerbershagen, H.J.; Aduckathil, S.; van Wijck, A.J.M.; Peelen, L.M.; Kalkman, C.J.; Meissner, W. Pain Intensity on the First Day after Surgery: A Prospective Cohort Study Comparing 179 Surgical Procedures. Anesthesiology 2013, 118, 934–944. [Google Scholar] [CrossRef] [PubMed]
  3. Svensson, I.; Sjöström, B.; Haljamäe, H. Assessment of Pain Experiences after Elective Surgery. J. Pain Symptom Manag. 2000, 20, 193–201. [Google Scholar] [CrossRef] [PubMed]
  4. DeVore, J.; Clontz, A.; Ren, D.; Cairns, L.; Beach, M. Improving Patient Satisfaction with Better Pain Management in Hospitalized Patients. J. Nurse Pract. 2017, 13, e23–e27. [Google Scholar] [CrossRef]
  5. Luo, L.; Forster, A.J.; Gartke, K.; Trickett, J.; Rubens, F.D. Developing a Strategy for the Improvement in Patient Experience in a Canadian Academic Department of Surgery. J. Patient Exp. 2019, 6, 11–20. [Google Scholar] [CrossRef]
  6. Wang, H.; Sherwood, G.D.; Liang, S.; Gong, Z.; Ren, L.; Liu, H.; Van, I.K. Comparison of Postoperative Pain Management Outcomes in the United States and China. Clin. Nurs. Res. 2021, 30, 1290–1300. [Google Scholar] [CrossRef]
  7. Bonnet, F.; Marret, E. Postoperative pain management and outcome after surgery. Best Pract. Res. Clin. Anaesthesiol. 2007, 21, 99–107. [Google Scholar] [CrossRef]
  8. Corke, P. Postoperative pain management. Aust. Prescr. 2013, 36, 205. [Google Scholar] [CrossRef]
  9. Hansen, R.N.; Pham, A.T.; Boing, E.A.; Lovelace, B.; Wan, G.J.; Urman, R.D. Reduced length of stay and hospitalization costs among inpatient hysterectomy patients with postoperative pain management including IV versus oral acetaminophen. PLoS ONE 2018, 13, e0203746. [Google Scholar] [CrossRef]
  10. Barrington, J.W.; Lovald, S.T.; Ong, K.L.; Watson, H.N.; Emerson, R.H. Postoperative Pain After Primary Total Knee Arthroplasty: Comparison of Local Injection Analgesic Cocktails and the Role of Demographic and Surgical Factors. J. Arthroplast. 2016, 31, 288–292. [Google Scholar] [CrossRef]
  11. Koh, J.C.; Song, Y.; Kim, S.Y.; Park, S.; Ko, S.H.; Han, D.W. Postoperative pain and patient-controlled epidural analgesia-related adverse effects in young and elderly patients: A retrospective analysis of 2,435 patients. J. Pain Res. 2017, 10, 897–904. [Google Scholar] [CrossRef] [PubMed]
  12. van Dijk, J.F.M.; Zaslansky, R.; van Boekel, R.L.M.; Cheuk-Alam, J.M.; Baart, S.J.; Huygen, F.J.P.M.; Rijsdijk, M. Postoperative Pain and Age: A Retrospective Cohort Association Study. Anesthesiology 2021, 135, 1104–1119. [Google Scholar] [CrossRef] [PubMed]
  13. Gagliese, L.; Jackson, M.; Ritvo, P.; Wowk, A.; Katz, J. Age Is Not an Impediment to Effective Use of Patient-controlled Analgesia by Surgical Patients. Anesthesiology 2000, 93, 601–610. [Google Scholar] [CrossRef] [PubMed]
  14. Gagliese, L.; Weizblit, N.; Ellis, W.; Chan, V.W. The measurement of postoperative pain: A comparison of intensity scales in younger and older surgical patients. Pain 2005, 117, 412–420. [Google Scholar] [CrossRef] [PubMed]
  15. Cepeda, S.M.; Africano, J.M.; Polo, R.; Alcala, R.; Carr, D.B. What decline in pain intensity is meaningful to patients with acute pain? Pain 2003, 105, 151–157. [Google Scholar] [CrossRef]
  16. Farrell, M.J. Age-related changes in the structure and function of brain regions involved in pain processing. Pain Med. 2012, 13 (Suppl. S2), S37–S43. [Google Scholar] [CrossRef] [PubMed]
  17. Gibson, S.J.; Farrell, M. A review of age differences in the neurophysiology of nociception and the perceptual experience of pain. Clin. J. Pain 2004, 20, 227–239. [Google Scholar] [CrossRef]
  18. Lautenbacher, S.; Peters, J.H.; Heesen, M.; Scheel, J.; Kunz, M. Age changes in pain perception: A systematic-review and meta-analysis of age effects on pain and tolerance thresholds. Neurosci. Biobehav. Rev. 2017, 75, 104–113. [Google Scholar] [CrossRef]
  19. Daguet, I.; Bergeron-Vezina, K.; Harvey, M.P.; Martel, M.; Coulombe-Leveque, A.; Leonard, G. Decreased Initial Peak Pain Sensation with Aging: A Psychophysical Study. J. Pain Res. 2020, 13, 2333–2341. [Google Scholar] [CrossRef]
  20. Riley III, J.L.; Wade, J.B.; Robinson, M.E.; Price, D.D. The stages of pain processing across the adult lifespan. J. Pain 2000, 1, 162–170. [Google Scholar] [CrossRef]
  21. Rustøen, T.; Wahl, A.K.; Hanestad, B.R.; Lerdal, A.; Paul, S.; Miaskowski, C. Age and the experience of chronic pain: Differences in health and quality of life among younger, middle-aged, and older adults. Clin. J. Pain 2005, 21, 513–523. [Google Scholar] [CrossRef] [PubMed]
  22. Wettstein, M.; Eich, W.; Bieber, C.; Tesarz, J. Pain Intensity, Disability, and Quality of Life in Patients with Chronic Low Back Pain: Does Age Matter? Pain Med. 2019, 20, 464–475. [Google Scholar] [CrossRef] [PubMed]
  23. Grichnik, K.P.; Ferrante, F.M. The difference between acute and chronic pain. Mt. Sinai J. Med. 1991, 58, 217–220. [Google Scholar] [PubMed]
  24. Helme, R.D.; Gibson, S.J. The epidemiology of pain in elderly people. Clin. Geriatr. Med. 2001, 17, 417–431. [Google Scholar] [CrossRef] [PubMed]
  25. Mangoni, A.A.; Jackson, S.H. Age-related changes in pharmacokinetics and pharmacodynamics: Basic principles and practical applications. Br. J. Clin. Pharmacol. 2004, 57, 6–14. [Google Scholar] [CrossRef]
  26. Chau, D.L.; Walker, V.; Pai, L.; Cho, L.M. Opiates and elderly: Use and side effects. Clin. Interv. Aging 2008, 3, 273–278. [Google Scholar] [CrossRef] [PubMed]
  27. McCleane, G. Pharmacological pain management in the elderly patient. Clin. Interv. Aging 2007, 2, 637–643. [Google Scholar] [CrossRef]
  28. Olson, K.A. Pain and Aging “Age is an issue of mind over matter. If you don’t mind, it doesn’t matter.”—Mark Twain CITE THIS ARTICLE. Pract. Pain Manag. 2015, 15. Available online: https://www.practicalpainmanagement.com/pain/pain-aging (accessed on 10 September 2023).
  29. Mulita, F.; Karpetas, G.; Liolis, E.; Vailas, M.; Tchabashvili, L.; Maroulis, I. Comparison of analgesic efficacy of acetaminophen monotherapy versus acetaminophen combinations with either pethidine or parecoxib in patients undergoing laparoscopic cholecystectomy: A randomized prospective study. Med. Glas. 2021, 18, 27–32. [Google Scholar] [CrossRef]
  30. Mulita, F.; Parchas, N.; Solou, K.; Tchabashvili, L.; Gatomati, F.; Iliopoulos, F.; Maroulis, I. Postoperative Pain Scores After Open Inguinal Hernia Repair: Comparison of Three Postoperative Analgesic Regimens. Med. Arch. 2020, 74, 355–358. [Google Scholar] [CrossRef]
  31. Williamson, A.; Hoggart, B. Pain: A review of three commonly used pain rating scales. J. Clin. Nurs. 2005, 14, 798–804. [Google Scholar] [CrossRef]
Figure 1. Flow chart of participant selection.
Jcm 12 05912 g001
Figure 2. Association between the worst pain during 24 h after surgery and age. Red dots are scatterplot of Age and NRS. Blue line is estimated scatterplot smoothing line. (A) association between Age and NRS in ARCR, (B) association between Age and NRS in C/sec, (C) association between Age and NRS in cholecystectomy, (D) association between Age and NRS in hemiarthroplasty, (E) association between Age and NRS in laparo-herniorrhaphy, (F) association between Age and NRS in open-herniorrhaphy, (G) association between Age and NRS in hysterectomy, (H) association between Age and NRS in lumbar spine fusion, (I) association between Age and NRS in THA, (J) association between Age and NRS in TKA. ARCR, arthroscopic rotator cuff repair; C/sec, cesarean section; NRS, numeric rating scale; THA, total hip arthroplasty; TKA, total knee arthroplasty.
Jcm 12 05912 g002aJcm 12 05912 g002bJcm 12 05912 g002cJcm 12 05912 g002d
Figure 3. Association between the administered opioid dose during 24 h after surgery and age. Red dots are scatterplot of Age and administered opioid dose during 24 h after surgery. Blue line is estimated scatterplot smoothing line. (A) association between Age and administered opioid dose during 24 h after surgery in ARCR, (B) association between Age and administered opioid dose during 24 h after surgery in C/sec, (C) association between Age and administered opioid dose during 24 h after surgery in cholecystectomy, (D) association between Age and administered opioid dose during 24 h after surgery in hemiarthroplasty, (E) association between Age and administered opioid dose during 24 h after surgery in laparo-herniorrhaphy, (F) association between Age and administered opioid dose during 24 h after surgery in open-herniorrhaphy, (G) association between Age and administered opioid dose during 24 h after surgery in hysterectomy, (H) association between Age and administered opioid dose during 24 h after surgery in lumbar spine fusion, (I) association between Age and administered opioid dose during 24 h after surgery in THA, (J) association between Age and administered opioid dose during 24 h after surgery in TKA. ARCR, arthroscopic rotator cuff repair; C/sec, cesarean section; NRS, numeric rating scale; THA, total hip arthroplasty; TKA, total knee arthroplasty. ARCR, arthroscopic rotator cuff repair; C/sec, cesarean section; THA, total hip arthroplasty; TKA, total knee arthroplasty.
Jcm 12 05912 g003aJcm 12 05912 g003bJcm 12 05912 g003cJcm 12 05912 g003dJcm 12 05912 g003e
Table 1. Characteristics and perioperative patient data.
ARCR (n = 4875)C/Sec (n = 4146)CC (n = 15,947)HHA (n = 2697)LH (n = 1322)OH (n = 1822)HyE (n = 3977)LSF (n = 3024)THA (n = 1471) TKA (n= 1906)
Age (year)59 (50–66)34 (31–37)52 (40–65)82 (77–86)63 (51–72)63 (49–72)49 (45–54)66 (58–73)63 (54–71)71 (66–76)
Female2180 (44.7)4146 (100)8346 (52.3)2088 (77.4)78 (5.9)148 (8.1)3977 (100)1668 (55.2)697 (47.4)1479 (77.6)
BMI (kg/m2)25 (22.9–27.2)27.5 (25.1–30.7)25 (22.7–27.5)22.1 (19.6–24.5)23.6 (21.9–25.4)23.7 (21.8–25.4)24.3 (22.2–26.9)24.9 (22.6–27.2)23.7 (21.4–26.4)26.4 (24.1–28.9)
HTN1436 (29.5)100 (2.4)4264 (26.7)1373 (50.9)415 (31.4)509 (27.9)784 (19.7)1372 (45.4)490 (33.3)1016 (53.3)
DM616 (12.6)226 (5.5)2063 (12.9)667 (24.7)123 (9.3)157 (8.6)272 (6.8)644 (21.3)209 (14.2)426 (22.4)
TB46 (0.9)39 (0.9)168 (1.1)48 (1.8)24 (1.8)31 (1.7)35 (0.9)43 (1.4)21 (1.4)18 (0.9)
Hepatitis68 (1.4)52 (1.3)218 (1.4)16 (0.6)14 (1.1)29 (1.6)59 (1.5)37 (1.2)18 (1.2)14 (0.7)
Cardiac disease151 (3.1)11 (0.3)453 (2.8)213 (7.9)51 (3.9)71 (3.9)47 (1.2)179 (5.9)64 (4.4)117 (6.1)
CVA56 (1.1)2 (0)230 (1.4)149 (5.5)16 (1.2)28 (1.5)20 (0.5)58 (1.9)31 (2.1)43 (2.3)
Cancer103 (2.1)36 (0.9)451 (2.8)169 (6.3)32 (2.4)93 (5.1)156 (3.9)132 (4.4)53 (3.6)74 (3.9)
Hyperlipidemia651 (13.4)13 (0.3)1655 (10.4)242 (9)107 (8.1)93 (5.1)387 (9.7)415 (13.7)169 (11.5)340 (17.8)
Alcohol1569 (32.2)28 (0.7)4535 (28.4)133 (4.9)440 (33.3)591 (32.4)416 (10.5)603 (19.9)414 (28.1)195 (10.2)
Smoking861 (17.7)34 (0.8)2646 (16.6)126 (4.7)240 (18.2)350 (19.2)154 (3.9)416 (13.8)340 (23.1)85 (4.5)
Sleep disorder152 (3.1)15 (0.4)418 (2.6)183 (6.8)14 (1.1)22 (1.2)74 (1.9)160 (5.3)63 (4.3)89 (4.7)
Sleep pills114 (2.3)2 (0)326 (2)186 (6.9)11 (0.8)21 (1.2)46 (1.2)118 (3.9)64 (4.4)79 (4.1)
Psychotropic drug57 (1.2)11 (0.3)187 (1.2)91 (3.4)3 (0.2)13 (0.7)39 (1)53 (1.8)34 (2.3)39 (2)
ASA PS (grade)2 (1–2)2 (1–2)2 (1–2)3 (2–3)2 (1–2)2 (1–2)2 (1–2)2 (2–3)2 (2–3)2 (2–3)
EM54 (1.1)1886 (45.5)2681 (16.8)312 (11.6)25 (1.9)73 (4)42 (1.1)158 (5.2)67 (4.6)17 (0.9)
GA4870 (99.9)1627 (39.2)15,946 (100)1763 (65.4)1322 (100)1134 (62.2)3975 (99.9)3024 (100)922 (62.7)901 (47.3)
OP time (hour)1.3 (1–1.6)1 (0.8–1.2)0.8 (0.6–1)1.2 (0.9–1.5)1 (0.8–1.3)0.8 (0.5–1.1)2 (1.6–2.5)3.5 (2.8–4.6)1.6 (1.3–2)1.8 (1.4–2.3)
Fluid balance (L)0.5 (0.4–0.6)0.7 (0.4–1)0.3 (0.2–0.5)0.6 (0.3–0.9)0.4 (0.3–0.5)0.4 (0.2–0.5)0.5 (0.3–0.8)1 (0.6–1.5)0.7 (0.3–1.1)0.4 (0.1–0.7)
A-line3084 (63.3)363 (8.8)2949 (18.5)2624 (97.3)215 (16.3)151 (8.3)1293 (32.5)2951 (97.6)1329 (90.3)1435 (75.3)
C-line12 (0.2)44 (1.1)94 (0.6)663 (24.6)2 (0.2)6 (0.3)59 (1.5)920 (30.4)311 (21.1)221 (11.6)
Foley302 (6.2)4041 (97.5)1125 (7.1)2415 (89.5)19 (1.4)30 (1.6)3829 (96.3)2978 (98.5)1192 (81)1516 (79.5)
L-tube2 (0)3 (0.1)102 (0.6)7 (0.3)3 (0.2)4 (0.2)4 (0.1)5 (0.2)1 (0.1)2 (0.1)
Opioids Hx.420 (8.6)8 (0.2)516 (3.2)159 (5.9)16 (1.2)41 (2.3)45 (1.1)723 (23.9)200 (13.6)248 (13)
NSAIDs HX.1423 (29.2)110 (2.7)1677 (10.5)243 (9)63 (4.8)90 (4.9)281 (7.1)998 (33)325 (22.1)559 (29.3)
IV-PCA 4167 (85.5)2191 (52.8)8610 (54)2029 (75.2)265 (20)231 (12.7)3179 (79.9)2937 (97.1)995 (67.6)1055 (55.4)
PCA adjuvant1521 (31.2)972 (23.4)1554 (9.7)364 (13.5)97 (7.3)75 (4.1)764 (19.2)652 (21.6)276 (18.8)300 (15.7)
PCA flow rate (mg/h)1.6 (1.2–2)2.4 (2–3.6)1 (0–1.6)1.4 (1–1.8)0 (0–0)0 (0–0)1.6 (1–2)1.8 (1.4–2)1.9 (1.5–2.4)1.8 (1.2–2)
The data have been presented in terms of the median and interquartile range or as numerical counts and corresponding percentages. The numeric values provided without specified units correspond to the patient count A-line, arterial cannulation line; ARCR, arthroscopic rotator cuff repair; ASA PS; American Society of Anesthesiologists physical status; BMI, body mass index; CC, cholecystectomy; C-line, central venous line; L-tube, Levin tube; C/sec, cesarean section; CVA, cerebral vascular accident; DM, diabetes; EM, emergency; GA, general anesthesia; HHA, hip hemi-arthroplasty; HTN, hypertension; HyE, hysterectomy; Hx. History; LH, laparoscopic herniorrhaphy; LSF, lumbar spine fusion; NSAID Hx., taking non-steroidal anti-inflammatory drugs for 30 days before hospitalization, OH, open herniorrhaphy; OP, operation; Opioid Hx., taking opioids for 30 days before hospitalization; PCA, patient-controlled analgesia; TB, tuberculosis; THA, total hip arthroplasty; TKA, total knee arthroplasty.
Table 2. Pain intensity and administered opioid dose during 24 h after surgery.
Number of PatientsWorst NRS during Postoperative 24 hLeast NRS during Postoperative 24 hDose of Opioid during Postoperative 24 h, mg (IQR, Minimum, and Maximum)
ARCR47254 (2–5)1 (1–2)21.6 (15.6–25.2, 0, 65.5)
C/sec41053 (3–5)2 (1–3)28.8 (24–43.2, 0, 77.6)
Cholecystectomy13,1515 (2–6)1 (0–2)12 (0–19.2, 0, 57.6)
Hip hemiarthroplasty25813 (2–5)1 (0–2)18 (14.4–24, 0, 72.9)
Laparo-herniorrhaphy3444 (2–5)0 (0–1)0 (0–0, 0, 38.5)
Open herniorrhaphy7835 (2–5)1 (0–2)0 (0–0, 0, 51.5)
Hysterectomy39383 (3–5)2 (1–3)19.4 (12–24, 0, 54)
Lumbar spine fusion28725 (3–6)1 (0–2)24 (19.2–28.8, 0, 108)
THA14463 (2–5)2 (1–2)24 (19.2–28.8, 0, 64.8)
TKA18884 (2–5)2 (1–2)24 (16.8–28.8, 0, 93.8)
ARCR, arthroscopic rotator cuff repair; C/sec, cesarean section; IQR, interquartile range; NRS, numeric rating scale; PCA, patient-controlled analgesia; THA, total hip arthroplasty; TKA, total knee arthroplasty.
Table 3. Linear regression of the relationship between age and the worst pain during 24 h after surgery for 10 types of surgeries.
Type of SurgeryPartial R2β ± SEp ValueNumeric Rating Scale Score Difference over a Time Span of 30 Years
ARCR (n = 4875)−0.059−0.077 ± 0.008<0.0012.3
C/sec (n = 4146)−0.014−0.014 ± 0.0270.1150.4
Cholecystectomy (n = 15,947) −0.021−0.029 ± 0.003<0.0010.9
Hip hemiarthroplasty (n = 2697)−0.143−0.153 ± 0.016<0.0014.6
Laparoscopic herniorrhaphy (n = 1322)−0.02−0.026 ± 0.0080.0280.8
Open herniorrhaphy (n = 1822)−0.013−0.016 ± 0.0050.150.5
Hysterectomy (n = 3977)−0.021−0.024 ± 0.0090.0040.7
Lumbar spine fusion (n = 3024)−0.126−0.155 ± 0.017<0.0014.6
THA (n = 1471)−0.087−0.105 ± 0.019<0.0013.1
TKA (n = 1906)−0.09−0.101 ± 0.03<0.0013
ARCR, arthroscopic rotator cuff repair; C/sec, cesarean section; SE, standard error; THA, total hip arthroplasty; TKA, total knee arthroplasty.
Table 4. Linear regression of the relationship between age and the worst pain during 24 h after surgery according to sex for eight types of surgeries.
MaleFemale
Type of Surgery (Male/Female)Partial R2β ± SEp ValuePartial R2β ± SEp Value
ARCR (2695/2180)0.0470.06 ± 0.0030.016−0.021−0.025 ± 0.0050.322
Cholecystectomy (7061/8346)−0.055−0.073 ± 0.002<0.001−0.065−0.088 ± 0.002<0.001
Hip hemiarthroplasty (609/2088)−0.055−0.063 ± 0.0090.17−0.052−0.054 ± 0.0060.015
Laparoscopic herniorrhaphy (1244/78)−0.104−0.136 ± 0.0080.049−0.089−0.162 ± 0.0590.772
Open-herniorrhaphy (1674/148)−0.112−0.147 ± 0.0050.0020.0660.142 ± 0.030.617
Lumbar spine fusion (1356/1668)−0.116−0.148 ± 0.005<0.001−0.127−0.15 ± 0.005<0.001
THA (774/697)−0.052−0.062 ± 0.0060.124−0.013−0.015 ± 0.0060.731
TKA (427/1479)−0.032−0.037 ± 0.0120.498−0.003−0.004 ± 0.0060.9
ARCR, arthroscopic rotator cuff repair; SE, standard error; THA, total hip arthroplasty; TKA, total knee arthroplasty.
Table 5. Worst NRS and linear regression of the relationship between age and the worst pain in patients with PCA application during 24 h after surgery.
Type of Surgery (n)Partial R2β ± SEp ValueWorst NRS during Postoperative 24 h in Patients with PCA
ARCR (n = 4167)0.0210.028 ± 0.0030.0284 (2–5)
C/sec (n = 4013)−0.04−0.041 ± 0.006<0.0013 (3–5)
Cholecystectomy (n = 8610) −0.057−0.077 ± 0.002<0.0013 (2–5)
Hip hemiarthroplasty (n = 2650)−0.059−0.063 ± 0.005<0.0013 (2–5)
Laparoscopic herniorrhaphy (n = 265)−0.012−0.016 ± 0.009<0.0012 (2–3)
Open herniorrhaphy (n = 233)−0.099−0.144 ± 0.009<0.0013 (2–5)
Hysterectomy (n = 3183)0.0610.07 ± 0.0040.073 (2–5)
Lumbar spine fusion (n = 2937)−0.119−0.146 ± 0.004<0.0015 (3–6)
THA (n = 1448)−0.028−0.033 ± 0.004<0.0013 (2–5)
TKA (n = 1882)−0.006−0.007 ± 0.006<0.0014 (2–5)
ARCR, arthroscopic rotator cuff repair; C/sec, cesarean section; NRS, numeric rating scale; PCA, patient-controlled analgesia; SE, standard error; THA, total hip arthroplasty; TKA, total knee arthroplasty.
Table 6. Linear regression of the relationship between age and the administered opioid dose during 24 h after surgery for ten types of surgeries.
Type of Surgery (n)Partial R2β ± SEp Value
ARCR (n = 4875)−0.064−0.083 ± 0.009<0.001
C/sec (n = 4146)−0.012−0.013 ± 0.0270.149
Cholecystectomy (n = 15,947) −0.023−0.031 ± 0.004<0.001
Hip hemiarthroplasty (n = 2697)−0.14−0.15 ± 0.017<0.001
Laparoscopic herniorrhaphy (n = 1322)−0.042−0.055 ± 0.0220.026
Open herniorrhaphy (n = 1822)−0.028−0.037 ± 0.010.029
Hysterectomy (n = 3977)−0.019−0.021 ± 0.0090.009
Lumbar spine fusion (n = 3024)−0.129−0.158 ± 0.017<0.001
THA (n = 1471)−0.086−0.103 ± 0.019<0.001
TKA (n = 1906)−0.087−0.098 ± 0.03<0.001
ARCR, arthroscopic rotator cuff repair; C/sec, cesarean section; SE, standard error; THA, total hip arthroplasty; TKA, total knee arthroplasty.
Disclaimer/Publisher’s Note: The statements, opinions and data contained in all publications are solely those of the individual author(s) and contributor(s) and not of MDPI and/or the editor(s). MDPI and/or the editor(s) disclaim responsibility for any injury to people or property resulting from any ideas, methods, instructions or products referred to in the content.

