

Minimal Clinically Important Difference (MCID) in the Functional Status Measures in Patients with Stroke: Inverse Probability Treatment Weighting


Abstract
:1. Introduction
2. Methods
2.1. The PAC-CVD Program
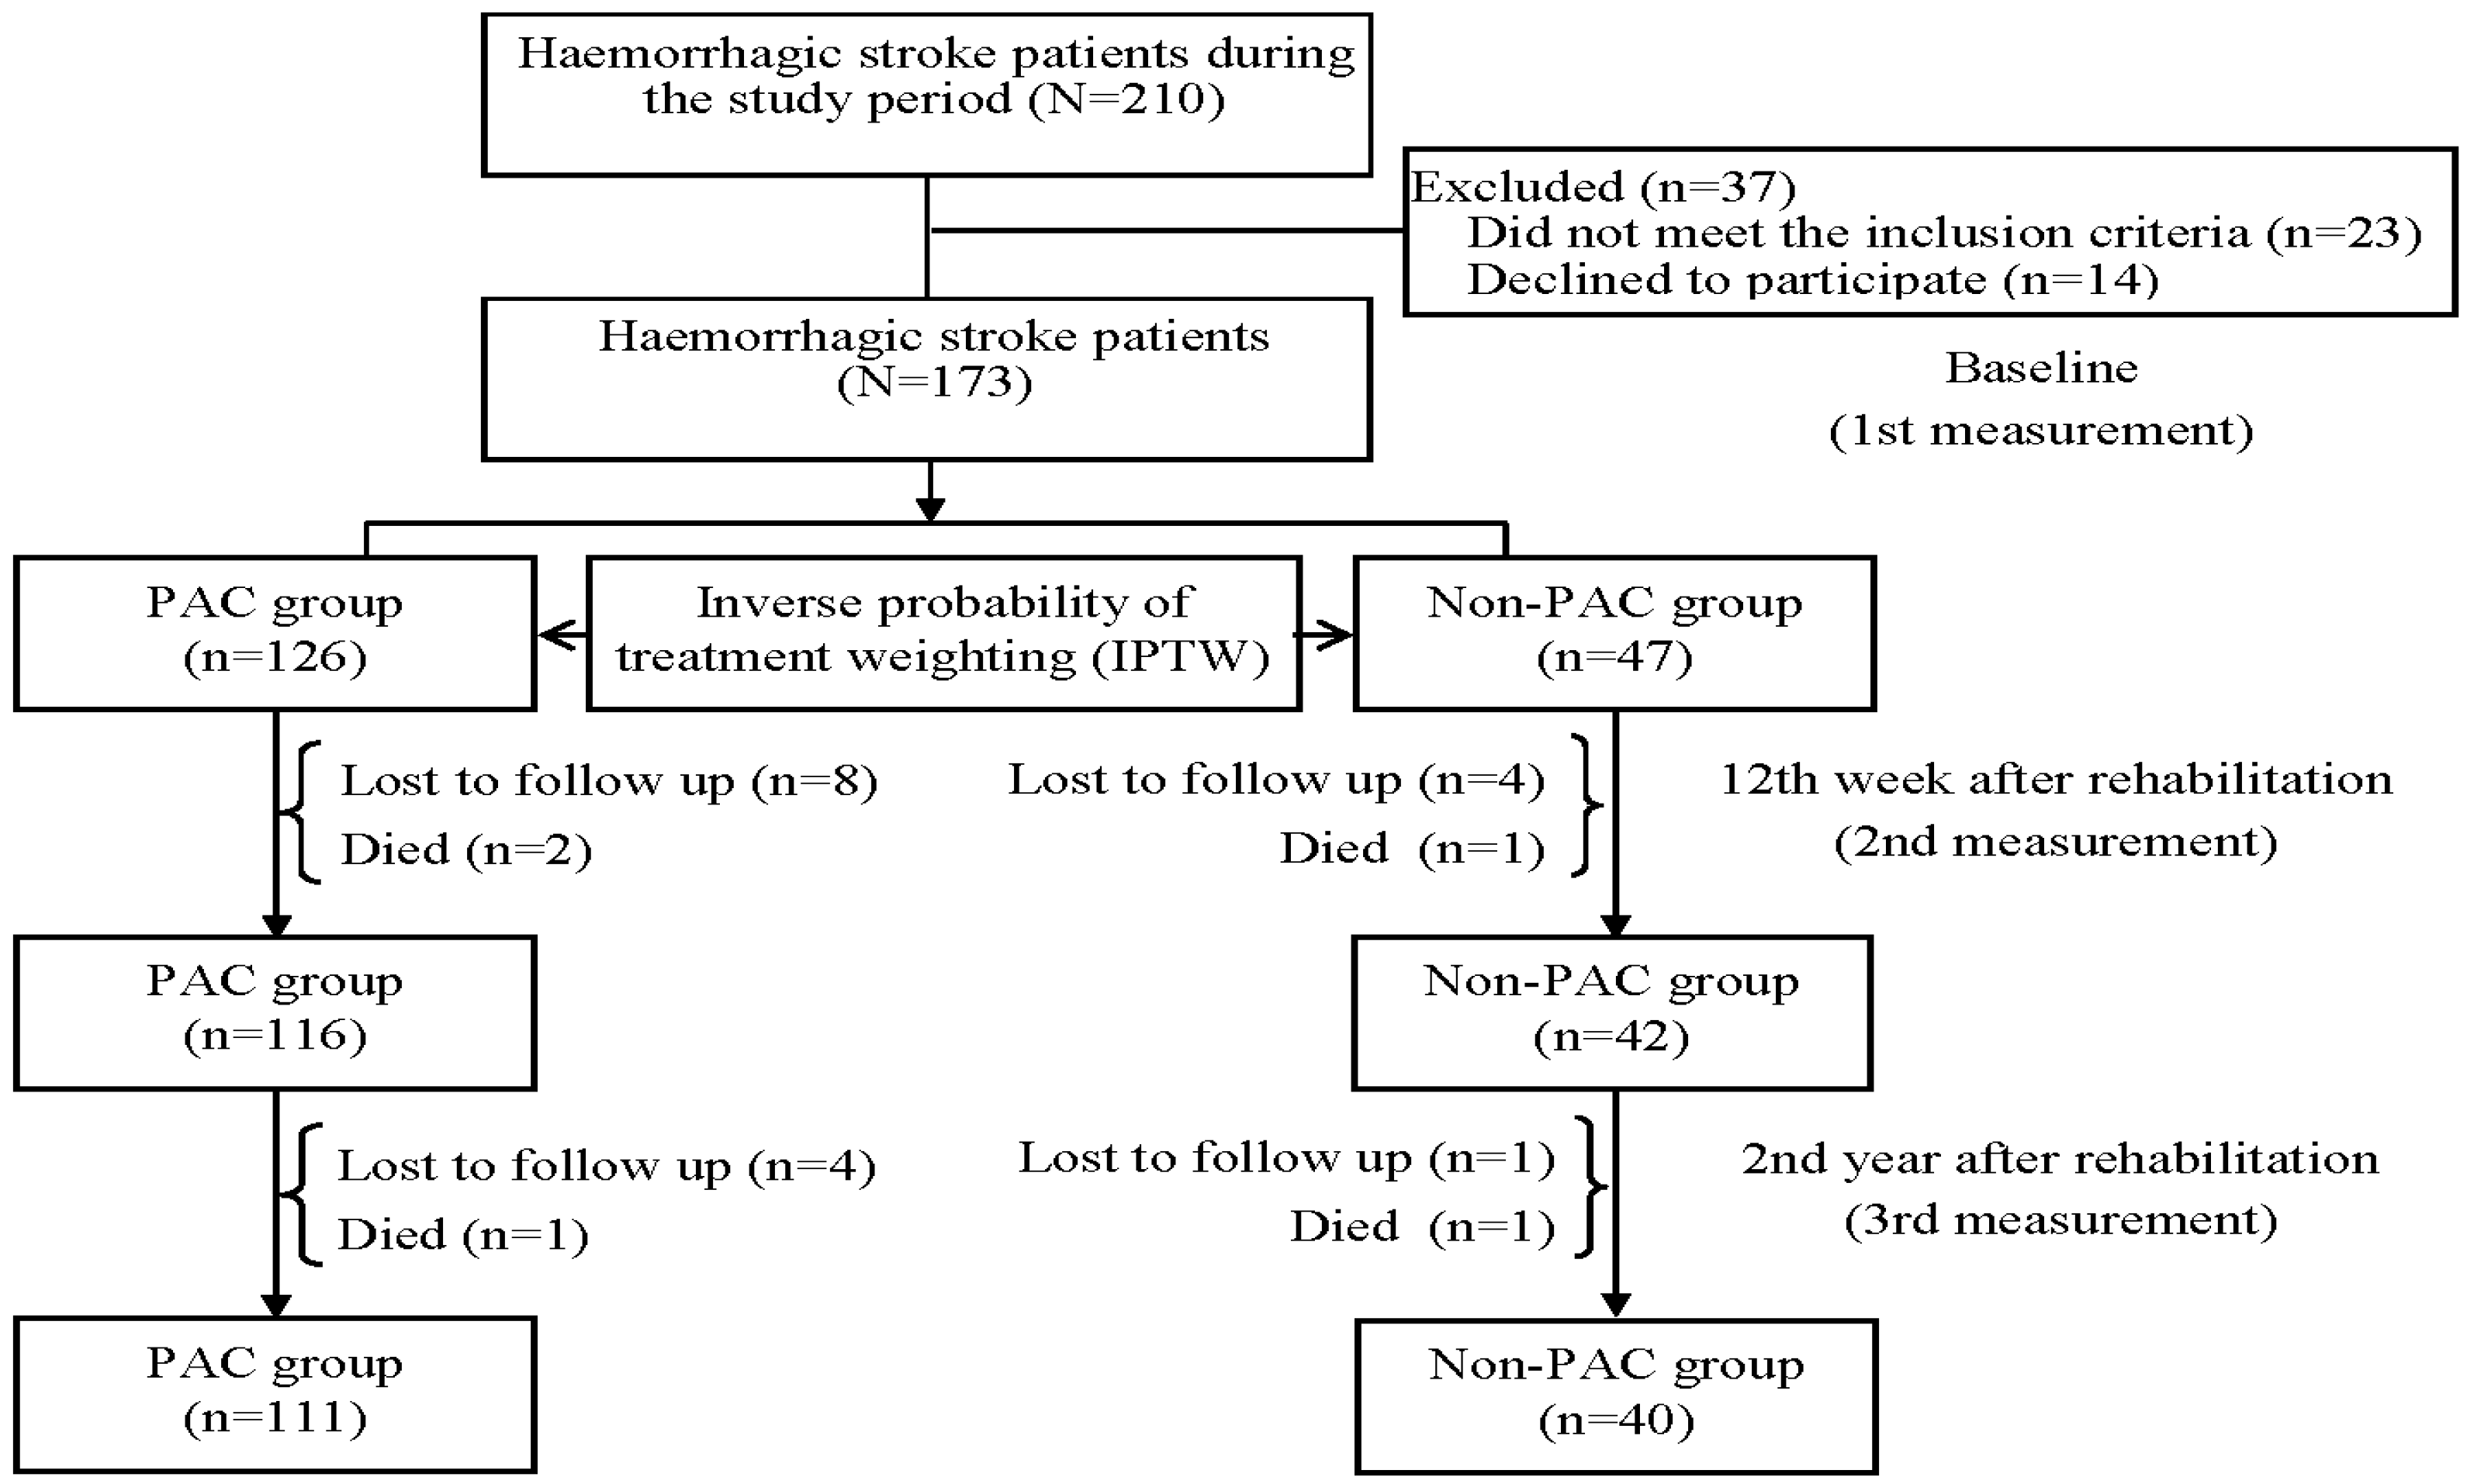
2.2. Study Population and Study Design
2.3. Instruments and Potential Covariates
2.4. The Anchor Question
2.5. The Minimal Clinical Important Difference (MCID)
2.6. Statistical Analysis
3. Results
3.1. Study Characteristics of Patients before and after IPTW
3.2. Temporal Trends in Functional Status Measures at Different Time Points
3.3. MCIDs in Functional Status Measures at Different Time Points
3.4. Risk Factors of MCIDs in Functional Status Measures at Different Time Points
4. Discussion
5. Conclusions
Author Contributions
Funding
Institutional Review Board Statement
Informed Consent Statement
Data Availability Statement
Conflicts of Interest
References
- McArthur, K.S.; Quinn, T.J.; Higgins, P.; Langhorne, P. Post-acute care and secondary prevention after ischaemic stroke. BMJ 2011, 342, d2083. [Google Scholar] [CrossRef] [PubMed]
- Kim, C.; Sung, J.; Han, J.-Y.; Jee, S.; Lee, J.W.; Lee, J.H.; Kim, W.-S.; Bang, H.J.; Baek, S.; Joa, K.-L.; et al. Current Status of Cardiac Rehabilitation in the Regional Cardiocerebrovascular Centers in Korea. J. Clin. Med. 2021, 10, 5079. [Google Scholar] [CrossRef] [PubMed]
- Chiu, C.C.; Wang, J.J.; Hung, C.M.; Lin, H.F.; Hsien, H.H.; Hung, K.W.; Chiu, H.C.; Yeh, S.C.J.; Shi, H.Y. Impact of Multi-disciplinary Stroke Post-Acute Care on Cost and Functional Status: A Prospective Study Based on Propensity Score Matching. Brain Sci. 2021, 11, 161. [Google Scholar] [CrossRef]
- Chiu, C.-C.; Lin, H.-F.; Lin, C.-H.; Chang, H.-T.; Hsien, H.-H.; Hung, K.-W.; Tung, S.-L.; Shi, H.-Y. Multidisciplinary Care after Acute Care for Stroke: A Prospective Comparison between a Multidisciplinary Post-Acute Care Group and a Standard Group Matched by Propensity Score. Int. J. Environ. Res. Public Health 2021, 18, 7696. [Google Scholar] [CrossRef] [PubMed]
- Wang, C.-Y.; Miyoshi, S.; Chen, C.-H.; Lee, K.-C.; Chang, L.-C.; Chung, J.-H.; Shi, H.-Y. Walking ability and functional status after post-acute care for stroke rehabilitation in different age groups: A prospective study based on propensity score matching. Aging 2020, 12, 10704–10714. [Google Scholar] [CrossRef]
- Werner, R.M.; Konetzka, R.T. Trends in Post–Acute Care Use Among Medicare Beneficiaries: 2000 to 2015. JAMA 2018, 319, 1616–1617. [Google Scholar] [CrossRef]
- Shi, S.M.; Kosar, C.M.; Gouskova, N.; Berry, S. Post–Acute Care Rehabilitation Services and Outcomes in Skilled Nursing Facilities Before and During the COVID-19 Pandemic. JAMA Health Forum 2023, 4, e230019. [Google Scholar] [CrossRef]
- Wang, J.; Mao, Y.; McGarry, B.; Temkin-Greener, H. Post-acute care transitions and outcomes among medicare beneficiaries in assisted living communities. J. Am. Geriatr. Soc. 2022, 70, 1429–1441. [Google Scholar] [CrossRef]
- Khera, R.; Wang, Y.; Bernheim, S.M.; Lin, Z.; Krumholz, H.M. Post-discharge acute care and outcomes following readmission reduction initiatives: National retrospective cohort study of Medicare beneficiaries in the United States. BMJ 2020, 368, l6831. [Google Scholar] [CrossRef]
- Hosey, M.M.; Wegener, S.T.; Hinkle, C.; Needham, D.M. A Cognitive Behavioral Therapy-Informed Self-Management Pro-gram for Acute Respiratory Failure Survivors: A Feasibility Study. J. Clin. Med. 2021, 10, 872. [Google Scholar] [CrossRef]
- Chen, C.-L.; Chen, C.-Y.; Chen, H.-C.; Wu, C.-Y.; Lin, K.-C.; Hsieh, Y.-W.; Shen, I.-H. Responsiveness and minimal clinically important difference of Modified Ashworth Scale in patients with stroke. Eur. J. Phys. Rehabil. Med. 2019, 55, 754–760. [Google Scholar] [CrossRef] [PubMed]
- Butler, J.; Khan, M.S.; Mori, C.; Filippatos, G.S.; Ponikowski, P.; Comin-Colet, J.; Roubert, B.; Spertus, J.A.; Anker, S.D. Minimal clinically important difference in quality of life scores for patients with heart failure and reduced ejection fraction. Eur. J. Heart Fail. 2020, 22, 999–1005. [Google Scholar] [CrossRef]
- Rapin, A.; Noujaim, P.-J.; Taiar, R.; Carazo-Mendez, S.; Deslee, G.; Jolly, D.; Boyer, F.C. Characteristics of COVID-19 Inpatients in Rehabilitation Units during the First Pandemic Wave: A Cohort Study from a Large Hospital in Champagne Region. Biology 2022, 11, 937. [Google Scholar] [CrossRef] [PubMed]
- Alma, H.; de Jong, C.; Jelusic, D.; Wittmann, M.; Schuler, M.; Kollen, B.; Sanderman, R.; Kocks, J.; Schultz, K.; van der Molen, T. Baseline health status and setting impacted minimal clinically important differences in COPD: An exploratory study. J. Clin. Epidemiol. 2019, 116, 49–61. [Google Scholar] [CrossRef]
- Fearon, P.; McArthur, K.S.; Garrity, K.; Graham, L.J.; McGroarty, G.; Vincent, S.; Quinn, T.J. Prestroke modified rankin stroke scale has moderate interobserver reliability and validity in an acute stroke setting. Stroke 2012, 43, 3184–3188. [Google Scholar] [CrossRef]
- Leung, S.O.; Chan, C.C.; Shah, S. Development of a Chinese version of the Modified Barthel Index—Validity and reliability. Clin. Rehabil. 2007, 21, 912–922. [Google Scholar] [CrossRef] [PubMed]
- Crary, M.A.; Mann, G.D.C.; Groher, M.E. Initial Psychometric Assessment of a Functional Oral Intake Scale for Dysphagia in Stroke Patients. Arch. Phys. Med. Rehabil. 2005, 86, 1516–1520. [Google Scholar] [CrossRef]
- Vittengl, J.R.; White, C.N.; McGovern, R.J.; Morton, B.J. Comparative validity of seven scoring systems for the instrumental activities of daily living scale in rural elders. Aging Ment. Health 2006, 10, 40–47. [Google Scholar] [CrossRef] [PubMed]
- Chou, C.Y.; Chien, C.W.; Hsueh, I.P.; Sheu, C.F.; Wang, C.H.; Hsieh, C.L. Developing a short form of the Berg Balance Scale for people with stroke. Phys. Ther. 2006, 86, 195–204. [Google Scholar] [CrossRef]
- Agrell, B.; Dehlin, O. Mini Mental State Examination in geriatric stroke patients. Validity, differences between subgroups of patients, and relationships to somatic and mental variables. Aging Clin. Exp. Res. 2000, 12, 439–444. [Google Scholar] [CrossRef]
- Wells, G.; Beaton, D.; Shea, B.; Boers, M.; Simon, L.; Strand, V.; Brooks, P.; Tugwell, P. Minimal clinically important differences: Review of methods. J. Rheumatol. 2001, 28, 406–412. [Google Scholar] [PubMed]
- Mouelhi, Y.; Jouve, E.; Castelli, C.; Gentile, S. How is the minimal clinically important difference established in health-related quality of life instruments? Review of anchors and methods. Health Qual. Life Outcomes 2020, 18, 136. [Google Scholar] [CrossRef] [PubMed]
- Saengsuwan, J.; Vichiansiri, R. Minimal clinically important difference of Gait Assessment and Intervention Tool (GAIT) in patients with sub-acute stroke. Eur. J. Phys. Rehabil. Med. 2021, 57, 874–878. [Google Scholar] [CrossRef] [PubMed]
- Beauchamp, M.K.; Niebuhr, R.; Roche, P.; Kirkwood, R.; Sibley, K.M. A prospective study to establish the minimal clinically important difference of the Mini-BESTest in individuals with stroke. Clin. Rehabil. 2021, 35, 1207–1215. [Google Scholar] [CrossRef]
- Austin, P.C. The performance of different propensity-score methods for estimating differences in proportions (risk differences or absolute risk reductions) in observational studies. Stat. Med. 2010, 29, 2137–2148. [Google Scholar] [CrossRef]
- Austin, P.C.; Stuart, E.A. Moving towards best practice when using inverse probability of treatment weighting (IPTW) using the propensity score to estimate causal treatment effects in observational studies. Stat. Med. 2015, 34, 3661–3679. [Google Scholar] [CrossRef]
- Kazis, L.E.; Anderson, J.J.; Meenan, R.F. Effect Sizes for Interpreting Changes in Health Status. Med. Care 1989, 27, S178–S189. [Google Scholar] [CrossRef]
- Liu, K.Y.; Schneider, L.S.; Howard, R. The need to show minimum clinically important differences in Alzheimer’s disease trials. Lancet Psychiatry 2021, 8, 1013–1016. [Google Scholar] [CrossRef]
- Fernandes-Taylor, S.; Zhao, J.; Francis, D.O. New Directions for Improving the Minimal Clinically Important Difference in Patient-Reported Outcome Measures for Use in Clinical Care and Research. JAMA Otolaryngol. Neck Surg. 2023, 149, 276–277. [Google Scholar] [CrossRef]
- O’Dell, M.W.; Jaywant, A.; Frantz, M.; Patel, R.; Kwong, E.; Wen, K.; Taub, M.; Campo, M.; Toglia, J. Changes in the Activity Measure for Post-Acute Care Domains in Persons with Stroke During the First Year after Discharge from Inpatient Rehabil-itation. Arch. Phys. Med. Rehabil. 2021, 102, 645–655. [Google Scholar] [CrossRef]
- Elik, D.; Çoban, Ö.; Kııçoğlu, Ö. Minimal clinically important difference of commonly used hip-, knee-, foot-, and an-kle-specific questionnaires: A systematic review. J. Clin. Epidemiol. 2019, 113, 44–57. [Google Scholar]
- Andersen, K.K.; Olsen, T.S.; Dehlendorff, C.; Kammersgaard, L.P. Hemorrhagic and ischemic strokes compared: Stroke severity, mortality, and risk factors. Stroke 2009, 40, 2068–2072. [Google Scholar] [CrossRef] [PubMed]
- Tamura, S.; Miyata, K.; Kobayashi, S.; Takeda, R.; Iwamoto, H. The minimal clinically important difference in Berg Balance Scale scores among patients with early subacute stroke: A multicenter, retrospective, observational study. Top. Stroke Rehabil. 2022, 29, 423–429. [Google Scholar] [CrossRef]
- Hayashi, S.; Miyata, K.; Takeda, R.; Iizuka, T.; Igarashi, T.; Usuda, S. Minimal clinically important difference of the Berg Balance Scale and comfortable walking speed in patients with acute stroke: A multicenter, prospective, longitudinal study. Clin. Rehabil. 2022, 36, 1512–1523. [Google Scholar] [CrossRef] [PubMed]
- Gullón, A.; Formiga, F.; Camafort, M.; Mostaza, J.; Díez-Manglano, J.; Cepeda, J.; Novo-Veleiro, I.; Pose, A.; Fernández, C.S. Baseline functional status as the strongest predictor of in-hospital mortality in elderly patients with non-valvular atrial fibrillation: Results of the NONAVASC registry. Eur. J. Intern. Med. 2017, 47, 69–74. [Google Scholar] [CrossRef]
- Thakkar, H.K.; Liao, W.-W.; Wu, C.-Y.; Hsieh, Y.-W.; Lee, T.-H. Predicting clinically significant motor function improvement after contemporary task-oriented interventions using machine learning approaches. J. Neuroeng. Rehabil. 2020, 17, 131. [Google Scholar] [CrossRef]
- Hsieh, C.-Y.; Tsao, W.-C.; Lin, R.-T.; Chao, A.-C. Three years of the nationwide post-acute stroke care program in Taiwan. J. Chin. Med. Assoc. 2018, 81, 87–88. [Google Scholar] [CrossRef]
- Alexandre, A.M.; Valente, I.; Consoli, A.; Trombatore, P.; Scarcia, L.; Piano, M.; Limbucci, N.; Gabrieli, J.D.; Russo, R.; Caragliano, A.A.; et al. Posterior Circulation Endovascular Thrombectomy for Large Vessels Occlusion in Patients Presenting with NIHSS Score ≤ 10. Life 2021, 11, 1423. [Google Scholar] [CrossRef]
- Alexandre, A.M.; Colò, F.; Brunetti, V.; Valente, I.; Frisullo, G.; Pedicelli, A.; Scarcia, L.; Rollo, C.; Falcou, A.; Milonia, L.; et al. Mechanical thrombectomy in minor stroke due to isolated M2 occlusion: A multicenter retrospective matched analysis. J. NeuroInterv. Surg. 2022, jnis-2022-019557, Online ahead of print. [Google Scholar] [CrossRef]


| Variables | Before IPTW | After IPT | ||||
|---|---|---|---|---|---|---|
| PAC Group | Non-PAC Group | p Value | PAC Group | Non-PAC Group | p Value | |
| Ischaemic stroke (n = 680) | ||||||
| Age, years | 69.91 ± 12.42 | 71.43 ± 13.25 | 0.162 | 70.48 ± 14.38 | 72.4 ± 25.61 | 0.890 |
| Gender, male (%) | 314 (63.8%) | 117 (62.2%) | 0.768 | 64.3% | 60.9% | 0.220 |
| Education, years | 7.93 ± 1.90 | 8.37 ± 4.91 | 0.097 | 7.9 ± 2.41 | 7.78 ± 9.24 | 0.730 |
| Body mass index, kg/m2 | 24.08 ± 3.72 | 24.34 ± 3.38 | 0.389 | 24.31 ± 4.52 | 24.27 ± 6.39 | 0.890 |
| Smoking, yes (%) | 84 (17.1%) | 63 (33.5%) | <0.001 | 23.3% | 20.6% | 0.250 |
| Drinking, yes (%) | 40 (8.1%) | 44 (23.4%) | <0.001 | 11.9% | 12.0% | 1.000 |
| Average lengths of stay, days | 18.66 ± 9.42 | 14.96 ± 9.35 | <0.001 | 17.19 ± 11.1 | 17.87 ± 22.25 | 0.480 |
| Readmission in 30 days, yes (%) | 23 (4.7%) | 16(8.5%) | 0.082 | 8.0% | 6.0% | 0.940 |
| Recurrence, yes (%) | 6 (1.2%) | 25 (13.3%) | <0.001 | 6.0% | 4.9% | 0.460 |
| Modified Rankin Scale, MRS = 2 (%) | 17 (3.5%) | 10 (5.3%) | 2.429 | 5.8% | 4.9% | 0.790 |
| MRS = 3 (%) | 64 (13.0%) | 30 (16.0%) | 12.5% | 12.6% | ||
| MRS = 4 (%) | 411 (83.5%) | 148 (78.7%) | 81.7% | 82.5% | ||
| Foley catheter, yes (%) | 41 (8.3%) | 34(18.1%) | <0.001 | 10.4% | 12.5% | 0.220 |
| Nasogastric tube, yes (%) | 120 (24.4%) | 54 (28.7%) | 0.289 | 24.8% | 28.9% | 0.090 |
| Hypertension, yes (%) | 352 (71.5%) | 134 (71.3%) | 1.000 | 70.3% | 69.8% | 0.880 |
| Diabetes mellitus, yes (%) | 222 (45.1%) | 71 (37.8%) | 0.100 | 46.1% | 45.3% | 0.060 |
| Hyperlipidemia, yes (%) | 218 (44.3%) | 55 (29.3%) | <0.001 | 38.4% | 37.4% | 0.690 |
| Atrial fibrillation, yes (%) | 59 (12.0%) | 18 (9.6%) | 0.451 | 11.2% | 13.8% | 0.170 |
| Previous stroke, yes (%) | 80 (16.3%) | 47 (25.0%) | 0.012 | 19.7% | 22.2% | 0.290 |
| Hemorrhagic stroke (n = 151) | ||||||
| Age, years | 62.19 ± 12.57 | 68.9 ± 14.63 | 0.006 | 62.1 ± 14.31 | 65.94 ± 27.81 | 0.140 |
| Gender, male (%) | 69 (62.2%) | 27 (67.5%) | 0.682 | 60.06% | 55.4% | 0.490 |
| Education, years | 8.22 ± 1.36 | 7.45 ± 5.62 | 0.398 | 8.28 ± 1.84 | 7.96 ± 5.65 | 0.560 |
| BMI, kg/m2 | 23.86 ± 4.64 | 23.77 ± 3.2 | 0.901 | 23.77 ± 5.23 | 23.04 ± 5.99 | 0.250 |
| Smoking, yes (%) | 12 (10.8%) | 9 (22.5%) | 0.118 | 15.0% | 14.6% | 1.000 |
| Drinking, yes (%) | 5 (4.5%) | 10 (25.0%) | 0.001 | 9.4% | 11.3% | 0.670 |
| Average lengths of stay, days | 22.21 ± 8.14 | 15.38 ± 12 | <0.001 | 22.08 ± 9.7 | 23.04 ± 19.78 | 0.600 |
| Readmission in 30 days, yes (%) | 4 (3.6%) | 7 (17.5%) | 0.008 | 19.0% | 23.0% | 0.150 |
| Recurrence, yes (%) | 4 (3.6%) | 3 (7.5%) | 0.382 | 3.7% | 3.3% | 1.000 |
| Modified Rankin Scale, MRS = 2 (%) | 1 (0.9%) | 1 (2.5%) | 0.733 | 1.1% | 1.1% | 0.880 |
| MRS = 3 (%) | 10 (9.0%) | 4 (10.0%) | 10.0% | 11.7% | ||
| MRS = 4 (%) | 100 (90.1%) | 35 (87.5%) | 88.9% | 87.2% | ||
| Foley catheter, yes (%) | 13 (11.7%) | 8 (20.0%) | 0.302 | 13.4% | 13.4% | 1.000 |
| Nasogastric tube, yes (%) | 31 (27.9%) | 9 (22.5%) | 0.647 | 25.8% | 21.6% | 0.460 |
| Hypertension, yes (%) | 101 (91.0%) | 29 (72.5%) | 0.009 | 83.6% | 81.7% | 0.770 |
| Diabetes mellitus, yes (%) | 28 (25.2%) | 15 (37.5%) | 0.204 | 25.1% | 20.5% | 0.410 |
| Hyperlipidemia, yes (%) | 18 (16.2%) | 11 (27.5%) | 0.187 | 20.9% | 23.5% | 0.650 |
| Atrial fibrillation, yes (%) | 2 (1.8%) | 3 (7.5%) | 0.116 | 3.3% | 3.4% | 1.000 |
| Previous stroke, yes (%) | 9 (8.1%) | 4 (10.0%) | 0.746 | 8.5% | 7.1% | 0.830 |
| PAC Group | Non-PAC Group | |||||||||||||
|---|---|---|---|---|---|---|---|---|---|---|---|---|---|---|
| Measure | Baseline (T1) | 12th Week after Rehabilitation (T2) | 2nd Year after Rehabilitation (T3) | Baseline (T1) | 12th Week after Rehabilitation (T2) | 2nd Year after Rehabilitation (T3) | ||||||||
| Mean ± SD | Mean ± SD | ES † | P † | Mean ± SD | ES ‡ | P ‡ | Mean ± SD | Mean ± SD | ES † | p † | Mean ± SD | ES ‡ | p ‡ | |
| Ischaemic stroke (n = 680) | ||||||||||||||
| BI | 39.18 ± 27.17 | 58.37 ± 27.50 | 0.33 | <0.001 | 59.58 ± 27.40 | 0.04 | 0.044 | 40.11 ± 27.18 | 56.75 ± 26.52 | 0.30 | <0.001 | 57.60 ± 32.63 | 0.03 | 0.040 |
| FOIS | 4.90 ± 2.38 | 6.00 ± 1.54 | 0.26 | <0.001 | 6.10 ± 1.76 | 0.06 | 0.139 | 5.35 ± 2.42 | 5.78 ± 3.38 | 0.01 | 0.800 | 5.83 ± 3.64 | 0.01 | 0.649 |
| IADL | 0.87 ± 0.52 | 2.00 ± 1.20 | 0.45 | <0.001 | 2.09 ± 1.98 | 0.08 | 0.089 | 1.28 ± 1.76 | 1.50 ± 1.43 | 0.24 | 0.488 | 1.60 ± 2.21 | 0.07 | 0.084 |
| BBS | 16.97 ± 19.80 | 30.94 ± 16.22 | 0.67 | <0.001 | 32.02 ± 20.20 | 0.07 | 0.551 | 18.84 ± 13.91 | 22.99 ± 21.20 | 0.19 | <0.001 | 23.47 ± 20.02 | 0.02 | 0.093 |
| MMSE | 18.06 ± 10.34 | 20.37 ± 8.80 | 0.14 | <0.001 | 21.40 ± 10.10 | 0.12 | 0.251 | 18.99 ± 12.48 | 19.54 ± 14.30 | −0.03 | 0.319 | 19.93 ± 14.04 | 0.03 | 0.184 |
| Haemorrhagic stroke (n = 151) | ||||||||||||||
| BI | 29.88 ± 20.56 | 43.21 ± 26.24 | 0.75 | <0.001 | 53.78 ± 26.56 | 0.40 | <0.001 | 32.8 ± 21.93 | 47.04 ± 14.60 | 0.42 | 0.007 | 52.11 ± 17.70 | 0.35 | <0.001 |
| FOIS | 5.43 ± 1.00 | 6.05 ± 1.05 | 0.46 | <0.001 | 6.46 ± 0.95 | 0.39 | 0.031 | 5.36 ± 2.53 | 5.85 ± 1.90 | 0.17 | 0.059 | 5.93 ± 1.77 | 0.04 | 0.315 |
| IADL | 0.93 ± 0.65 | 1.30 ± 1.37 | 0.87 | <0.001 | 1.61 ± 1.37 | 0.23 | 0.038 | 0.52 ± 1.20 | 0.89 ± 1.83 | 0.27 | 0.015 | 0.92 ± 1.90 | 0.02 | 0.296 |
| BBS | 13.12 ± 7.65 | 26.15 ± 12.02 | 1.48 | <0.001 | 30.42 ± 12.61 | 0.36 | <0.001 | 7.97 ± 6.34 | 13.74 ± 7.73 | 1.08 | 0.014 | 14.40 ± 8.92 | 0.05 | 0.062 |
| MMSE | 18.82 ± 8.06 | 22.06 ± 8.75 | 0.41 | <0.001 | 22.70 ± 8.64 | 0.07 | 0.206 | 15.82 ± 12.64 | 17.47 ± 13.59 | 0.12 | 0.010 | 17.94 ± 12.77 | 0.03 | 0.082 |
| PAC Group | Non-PAC Group | |||||||||||
|---|---|---|---|---|---|---|---|---|---|---|---|---|
| Measure | 12th Week after Rehabilitation vs. Baseline | 2nd Year after Rehabilitation vs. Baseline | 12th Week after Rehabilitation vs. Baseline | 2nd Year after Rehabilitation vs. Baseline | ||||||||
| Mean Change | SD | MCID | Mean Change | SD | MCID | Mean Change | SD | MCID | Mean Change | SD | MCID | |
| Ischaemic stroke (n = 680) | ||||||||||||
| Barthel Index | ||||||||||||
| Improvement | 29.79 | 17.02 | 16.18 | 31.84 | 16.79 | 18.43 | 21.13 | 17.34 | 10.40 | 22.94 | 17.43 | 9.40 |
| Maintain (no change) | 13.61 | 12.64 | 13.41 | 12.72 | 10.73 | 8.12 | 13.54 | 10.60 | ||||
| Deterioration | −2.51 | 10.74 | 16.12 | −3.85 | 1.74 | 17.26 | −0.71 | 1.93 | 11.44 | −1.34 | 1.73 | 14.88 |
| Functional Oral Intake Scale | ||||||||||||
| Improvement | 0.76 | 1.51 | 0.66 | 0.90 | 1.54 | 0.64 | 0.95 | 2.50 | 0.12 | 1.07 | 2.11 | 0.37 |
| Maintenance (no change) | 0.10 | 2.21 | 0.26 | 1.85 | 0.83 | 2.89 | 0.70 | 1.70 | ||||
| Deterioration | −1.91 | 3.47 | 2.01 | −1.16 | 3.46 | 1.93 | 0.02 | 1.47 | 0.81 | 0.02 | 1.97 | 0.68 |
| Instrumental Activities of Daily Living Scale | ||||||||||||
| Improvement | 1.42 | 1.21 | 0.98 | 1.36 | 1.21 | 0.92 | 1.95 | 1.74 | 1.63 | 2.07 | 1.66 | 1.79 |
| Maintenance (no change) | 0.44 | 0.83 | 0.44 | 0.85 | 0.32 | 1.08 | 0.28 | 1.23 | ||||
| Deterioration | −0.45 | 0.53 | 0.89 | −0.39 | 0.54 | 0.83 | −0.81 | 0.88 | 1.13 | −1.09 | 0.85 | 1.37 |
| Berg Balance Scale | ||||||||||||
| Improvement | 19.90 | 14.14 | 9.76 | 19.24 | 14.02 | 9.14 | 10.05 | 8.15 | 3.56 | 12.27 | 7.52 | 4.39 |
| Maintenance (no change) | 10.14 | 9.11 | 10.10 | 9.66 | 6.49 | 5.48 | 7.88 | 5.46 | ||||
| Deterioration | −1.64 | 2.53 | 11.78 | −3.44 | 1.81 | 13.54 | −0.05 | 1.28 | 6.54 | −0.21 | 1.78 | 8.09 |
| Mini-Mental State Examination | ||||||||||||
| Improvement | 2.59 | 1.23 | 1.19 | 3.62 | 2.21 | 1.11 | 1.56 | 5.55 | 1.42 | 1.67 | 5.37 | 2.31 |
| Maintenance (no change) | 1.40 | 0.40 | 2.51 | 1.81 | 0.14 | 1.09 | −0.64 | 1.89 | ||||
| Deterioration | −3.56 | 2.66 | 4.95 | −3.61 | 2.83 | 6.12 | −6.06 | 5.38 | 6.20 | −3.08 | 3.52 | 2.44 |
| Haemorrhagic stroke (n = 151) | ||||||||||||
| Barthel Index | ||||||||||||
| Improvement | 14.75 | 8.79 | 5.02 | 15.79 | 9.65 | 5.58 | 14.05 | 6.78 | 5.16 | 14.00 | 5.47 | 4.51 |
| Maintenance (no change) | 9.73 | 4.58 | 10.21 | 5.37 | 8.89 | 4.02 | 9.49 | 5.73 | ||||
| Deterioration | −0.50 | 1.00 | 10.23 | −0.60 | 1.60 | 10.81 | −3.21 | 2.11 | 12.10 | −2.60 | 1.43 | 12.09 |
| Functional Oral Intake Scale | ||||||||||||
| Improvement | 1.03 | 1.87 | 0.01 | 1.05 | 1.91 | 0.01 | 0.76 | 1.14 | 0.39 | 0.55 | 0.61 | 0.06 |
| Maintenance (no change) | 1.04 | 1.53 | 1.04 | 1.52 | 0.37 | 1.18 | 0.49 | 1.45 | ||||
| Deterioration | −1.75 | 0.50 | 2.79 | −2.12 | 2.06 | 3.16 | −0.29 | 0.76 | 0.66 | −3.64 | 1.15 | 4.13 |
| Instrumental Activities of Daily Living Scale | ||||||||||||
| Improvement | 1.45 | 1.24 | 1.07 | 1.47 | 1.27 | 1.08 | 0.81 | 1.03 | 0.57 | 0.85 | 1.04 | 0.61 |
| Maintenance (no change) | 0.38 | 0.64 | 0.39 | 0.64 | 0.24 | 0.63 | 0.24 | 0.61 | ||||
| Deterioration | −0.75 | 0.50 | 1.13 | −0.72 | 0.52 | 1.11 | −0.14 | 0.38 | 0.38 | −0.76 | 0.90 | 1.00 |
| Berg Balance Scale | ||||||||||||
| Improvement | 13.48 | 5.17 | 9.25 | 15.68 | 6.60 | 10.47 | 15.07 | 7.50 | 8.82 | 14.40 | 10.82 | 7.96 |
| Maintenance (no change) | 4.23 | 0.64 | 5.21 | 3.09 | 6.25 | 3.33 | 6.44 | 4.65 | ||||
| Deterioration | −2.50 | 3.00 | 6.73 | −2.92 | 1.67 | 8.13 | −1.71 | 4.54 | 7.96 | −3.28 | 3.20 | 9.72 |
| Mini-Mental State Examination | ||||||||||||
| Improvement | 4.98 | 2.17 | 1.50 | 4.95 | 2.30 | 1.43 | 1.95 | 2.66 | 0.48 | 1.65 | 2.32 | 0.57 |
| Maintenance (no change) | 3.48 | 2.08 | 3.52 | 2.07 | 1.47 | 2.20 | 1.08 | 2.84 | ||||
| Deterioration | −6.75 | 4.50 | 10.23 | −5.68 | 3.09 | 9.20 | −5.29 | 3.40 | 6.76 | −8.04 | 1.34 | 9.12 |
| Ischaemic Stroke (n = 680) | Haemorrhagic Stroke (n = 151) | |||
|---|---|---|---|---|
| Measure | Odds Ratio (95%CI) | p Value | Odds Ratio (95%CI) | p Value |
| Barthel Index (BI) | ||||
| 12th week after rehabilitation vs. baseline | ||||
| Diabetes mellitus, yes | 1.97 (1.04~3.73) | <0.001 | – | |
| Post-acute care program, yes | 0.96 (0.95~0.98) | <0.001 | 0.95 (0.91~0.99) | <0.001 |
| Readmission in 30 days, yes | 1.09 (1.04~1.14) | <0.001 | – | |
| Nasogastric tube, yes | – | 1.02 (1.01~1.04) | <0.001 | |
| Functional status at baseline, scores | 0.98 (0.98~0.99) | <0.001 | 0.96 (0.94~0.98) | <0.001 |
| 2nd year after rehabilitation vs. baseline | ||||
| Post-acute care program, yes | 0.97 (0.95~0.99) | <0.001 | 0.93 (0.89~0.97) | <0.001 |
| Readmission in 30 days, yes | 1.10 (1.08~1.12) | <0.001 | – | |
| Nasogastric tube, yes | 1.87 (1.67~2.01) | <0.001 | 1.48 (1.15~1.82) | <0.001 |
| Functional status at baseline, scores | 0.96 (0.95~0.97) | <0.001 | 0.96 (0.94~0.98) | <0.001 |
| Functional Oral Intake Scale (FOIS) | ||||
| 12th week after rehabilitation vs. baseline | ||||
| Body mass index, kg/m2 | 1.06 (1.01~1.12) | 0.017 | – | |
| Drinking, yes | 3.53 (1.60~7.80) | 0.001 | – | |
| Post-acute care program, yes | 0.94 (0.92~0.96) | <0.001 | 0.95 (0.90~0.99) | <0.001 |
| Readmission in 30 days, yes | 1.80 (1.08~3.00) | <0.001 | – | |
| Recurrence, yes | 2.76 (1.07~7.12) | <0.001 | – | |
| Nasogastric tube, yes | 2.15 (1.11~4.14) | <0.001 | 4.96 (1.65~6.93) | <0.001 |
| Functional status at baseline, scores | 0.44 (0.38~0.51) | <0.001 | 0.42 (0.28~0.63) | <0.001 |
| 2nd year after rehabilitation vs. baseline | ||||
| Body mass index, kg/m2 | 1.17 (1.10~1.25) | 0.009 | – | |
| Drinking, yes | 3.91 (1.45~10.57) | <0.001 | 1.16 (1.09~1.24) | <0.001 |
| Post-acute care program, yes | 0.94 (0.90~0.98) | <0.001 | 0.92 (0.84~0.99) | <0.001 |
| Nasogastric tube, yes | 2.54 (1.59~4.06) | <0.001 | 1.09 (0.01~2.73) | <0.001 |
| Hyperlipidemia, yes | 1.84 (1.07~3.16) | <0.001 | – | |
| Functional status at baseline, scores | 0.34 (0.28~0.42) | <0.001 | 0.39 (0.23~0.67) | <0.001 |
| Instrumental Activities of Daily Living Scale (IADL) | ||||
| 12th week after rehabilitation vs. baseline | ||||
| Age, years | 0.98 (0.97~0.99) | 0.009 | – | |
| Post-acute care program, yes | 0.90 (0.87~0.92) | <0.001 | 0.87 (0.74~0.58) | <0.001 |
| Nasogastric tube, yes | 2.06 (1.26~3.36) | <0.001 | 4.36 (1.67~6.43) | <0.001 |
| Atrial fibrillation, yes | 1.84 (1.07~3.16) | <0.001 | 2.79 (1.03~7.55) | <0.001 |
| Previous stroke, yes | 2.13 (1.05~4.33) | <0.001 | – | |
| Functional status at baseline, scores | 0.78 (0.65~0.94) | <0.001 | 0.54 (0.38~0.76) | <0.001 |
| 2nd year after rehabilitation vs. baseline | ||||
| Education, years | 1.14 (1.06~1.22) | <0.001 | – | |
| Post-acute care program, yes | 0.95 (0.92~0.99) | <0.001 | 0.92 (0.88~0.96) | <0.001 |
| Foley catheter, yes | – | 3.35 (0.83~0.93) | <0.001 | |
| Nasogastric tube, yes | 2.37 (1.08~5.17) | <0.001 | 4.36 (1.67~6.43) | <0.001 |
| Hyperlipidemia, yes | 2.38 (1.30~4.37) | <0.001 | 4.79 (0.08~0.40) | <0.001 |
| Functional status at baseline, scores | 0.75 (0.61~0.93) | <0.001 | 0.51 (0.28~0.93) | <0.001 |
| Berg Balance Scale (BBS) | ||||
| 12th week after rehabilitation vs. baseline | ||||
| Age, years | 0.98 (0.97~0.99) | 0.031 | – | |
| Education, years | 1.09 (1.03~1.14) | <0.001 | – | |
| Smoking, yes | – | 2.77 (1.70~4.53) | <0.001 | |
| Post-acute care program, yes | 0.94 (0.92~0.96) | <0.001 | 0.93 (0.89~0.97) | <0.001 |
| Nasogastric tube, yes | 2.94 (1.77~4.87) | <0.001 | 2.90 (1.21~6.92) | <0.001 |
| Hypertension, yes | – | 3.63 (1.36~9.73) | <0.001 | |
| Atrial fibrillation, yes | 3.25 (1.36~7.20) | <0.001 | – | |
| Previous stroke, yes | 2.19 (1.22~3.92) | <0.001 | 2.86 (1.04~7.91) | <0.001 |
| Functional status at baseline, scores | 1.03 (1.01~1.04) | <0.001 | 0.81 (0.67~0.99) | <0.001 |
| 2nd year after rehabilitation vs. baseline | ||||
| Smoking, yes | 6.27 (2.18~8.76) | <0.001 | – | |
| Post-acute care program, yes | 0.95 (0.93~0.97) | <0.001 | 0.91 (0.84~0.98) | <0.001 |
| Hypertension, yes | 1.71 (1.20~2.42) | <0.001 | 1.61 (1.17~2.23) | <0.001 |
| Previous stroke, yes | 7.12 (2.04~7.95) | <0.001 | 8.14 (3.65~7.68) | <0.001 |
| Functional status at baseline, scores | 0.94 (0.93~0.95) | <0.001 | 0.57 (0.40~0.81) | <0.001 |
| Mini-Mental State Examination (MMSE) | ||||
| 12th week after rehabilitation vs. baseline | ||||
| Education, years | 1.12 (1.02~1.22) | 0.001 | 1.19 (1.04~1.16) | <0.001 |
| Readmission in 30 days, yes | – | 5.29 (1.25~6.38) | <0.001 | |
| Foley catheter, yes | 2.13 (1.05~4.33) | <0.001 | – | |
| Previous stroke, yes | 3.25 (1.36~7.20) | <0.001 | 3.91 (1.09~9.10) | <0.001 |
| Functional status at baseline, scores | 0.89 (0.85~0.92) | <0.001 | 0.95 (0.91~0.99) | <0.001 |
| 2nd year after rehabilitation vs. baseline | ||||
| Smoking, yes | 6.10 (1.55~6.75) | <0.001 | 4.87 (1.07~6.69) | <0.001 |
| Post-acute care program, yes | – | 0.72 (0.53~0.96) | <0.001 | |
| Foley catheter, yes | 3.54 (1.13~11.08) | <0.001 | 3.03 (1.40~5.57) | <0.001 |
| Functional status at baseline, scores | 0.76 (0.68~0.85) | <0.001 | 0.81 (0.73~0.91) | <0.001 |
Disclaimer/Publisher’s Note: The statements, opinions and data contained in all publications are solely those of the individual author(s) and contributor(s) and not of MDPI and/or the editor(s). MDPI and/or the editor(s) disclaim responsibility for any injury to people or property resulting from any ideas, methods, instructions or products referred to in the content. |
© 2023 by the authors. Licensee MDPI, Basel, Switzerland. This article is an open access article distributed under the terms and conditions of the Creative Commons Attribution (CC BY) license (https://creativecommons.org/licenses/by/4.0/).
Share and Cite
Chang, Y.-C.; Lin, H.-F.; Chen, Y.-F.; Chen, H.-Y.; Shiu, Y.-T.; Shi, H.-Y. Minimal Clinically Important Difference (MCID) in the Functional Status Measures in Patients with Stroke: Inverse Probability Treatment Weighting. J. Clin. Med. 2023, 12, 5828. https://doi.org/10.3390/jcm12185828
Chang Y-C, Lin H-F, Chen Y-F, Chen H-Y, Shiu Y-T, Shi H-Y. Minimal Clinically Important Difference (MCID) in the Functional Status Measures in Patients with Stroke: Inverse Probability Treatment Weighting. Journal of Clinical Medicine. 2023; 12(18):5828. https://doi.org/10.3390/jcm12185828
Chicago/Turabian StyleChang, Yu-Chien, Hsiu-Fen Lin, Yu-Fu Chen, Hong-Yaw Chen, Yu-Tsz Shiu, and Hon-Yi Shi. 2023. "Minimal Clinically Important Difference (MCID) in the Functional Status Measures in Patients with Stroke: Inverse Probability Treatment Weighting" Journal of Clinical Medicine 12, no. 18: 5828. https://doi.org/10.3390/jcm12185828
APA StyleChang, Y.-C., Lin, H.-F., Chen, Y.-F., Chen, H.-Y., Shiu, Y.-T., & Shi, H.-Y. (2023). Minimal Clinically Important Difference (MCID) in the Functional Status Measures in Patients with Stroke: Inverse Probability Treatment Weighting. Journal of Clinical Medicine, 12(18), 5828. https://doi.org/10.3390/jcm12185828