
Usefulness of Three-Dimensional Iodine Mapping Quantified by Dual-Energy CT for Differentiating Thymic Epithelial Tumors
 , , , ,
Abstract
:
1. Introduction
2. Materials and Methods
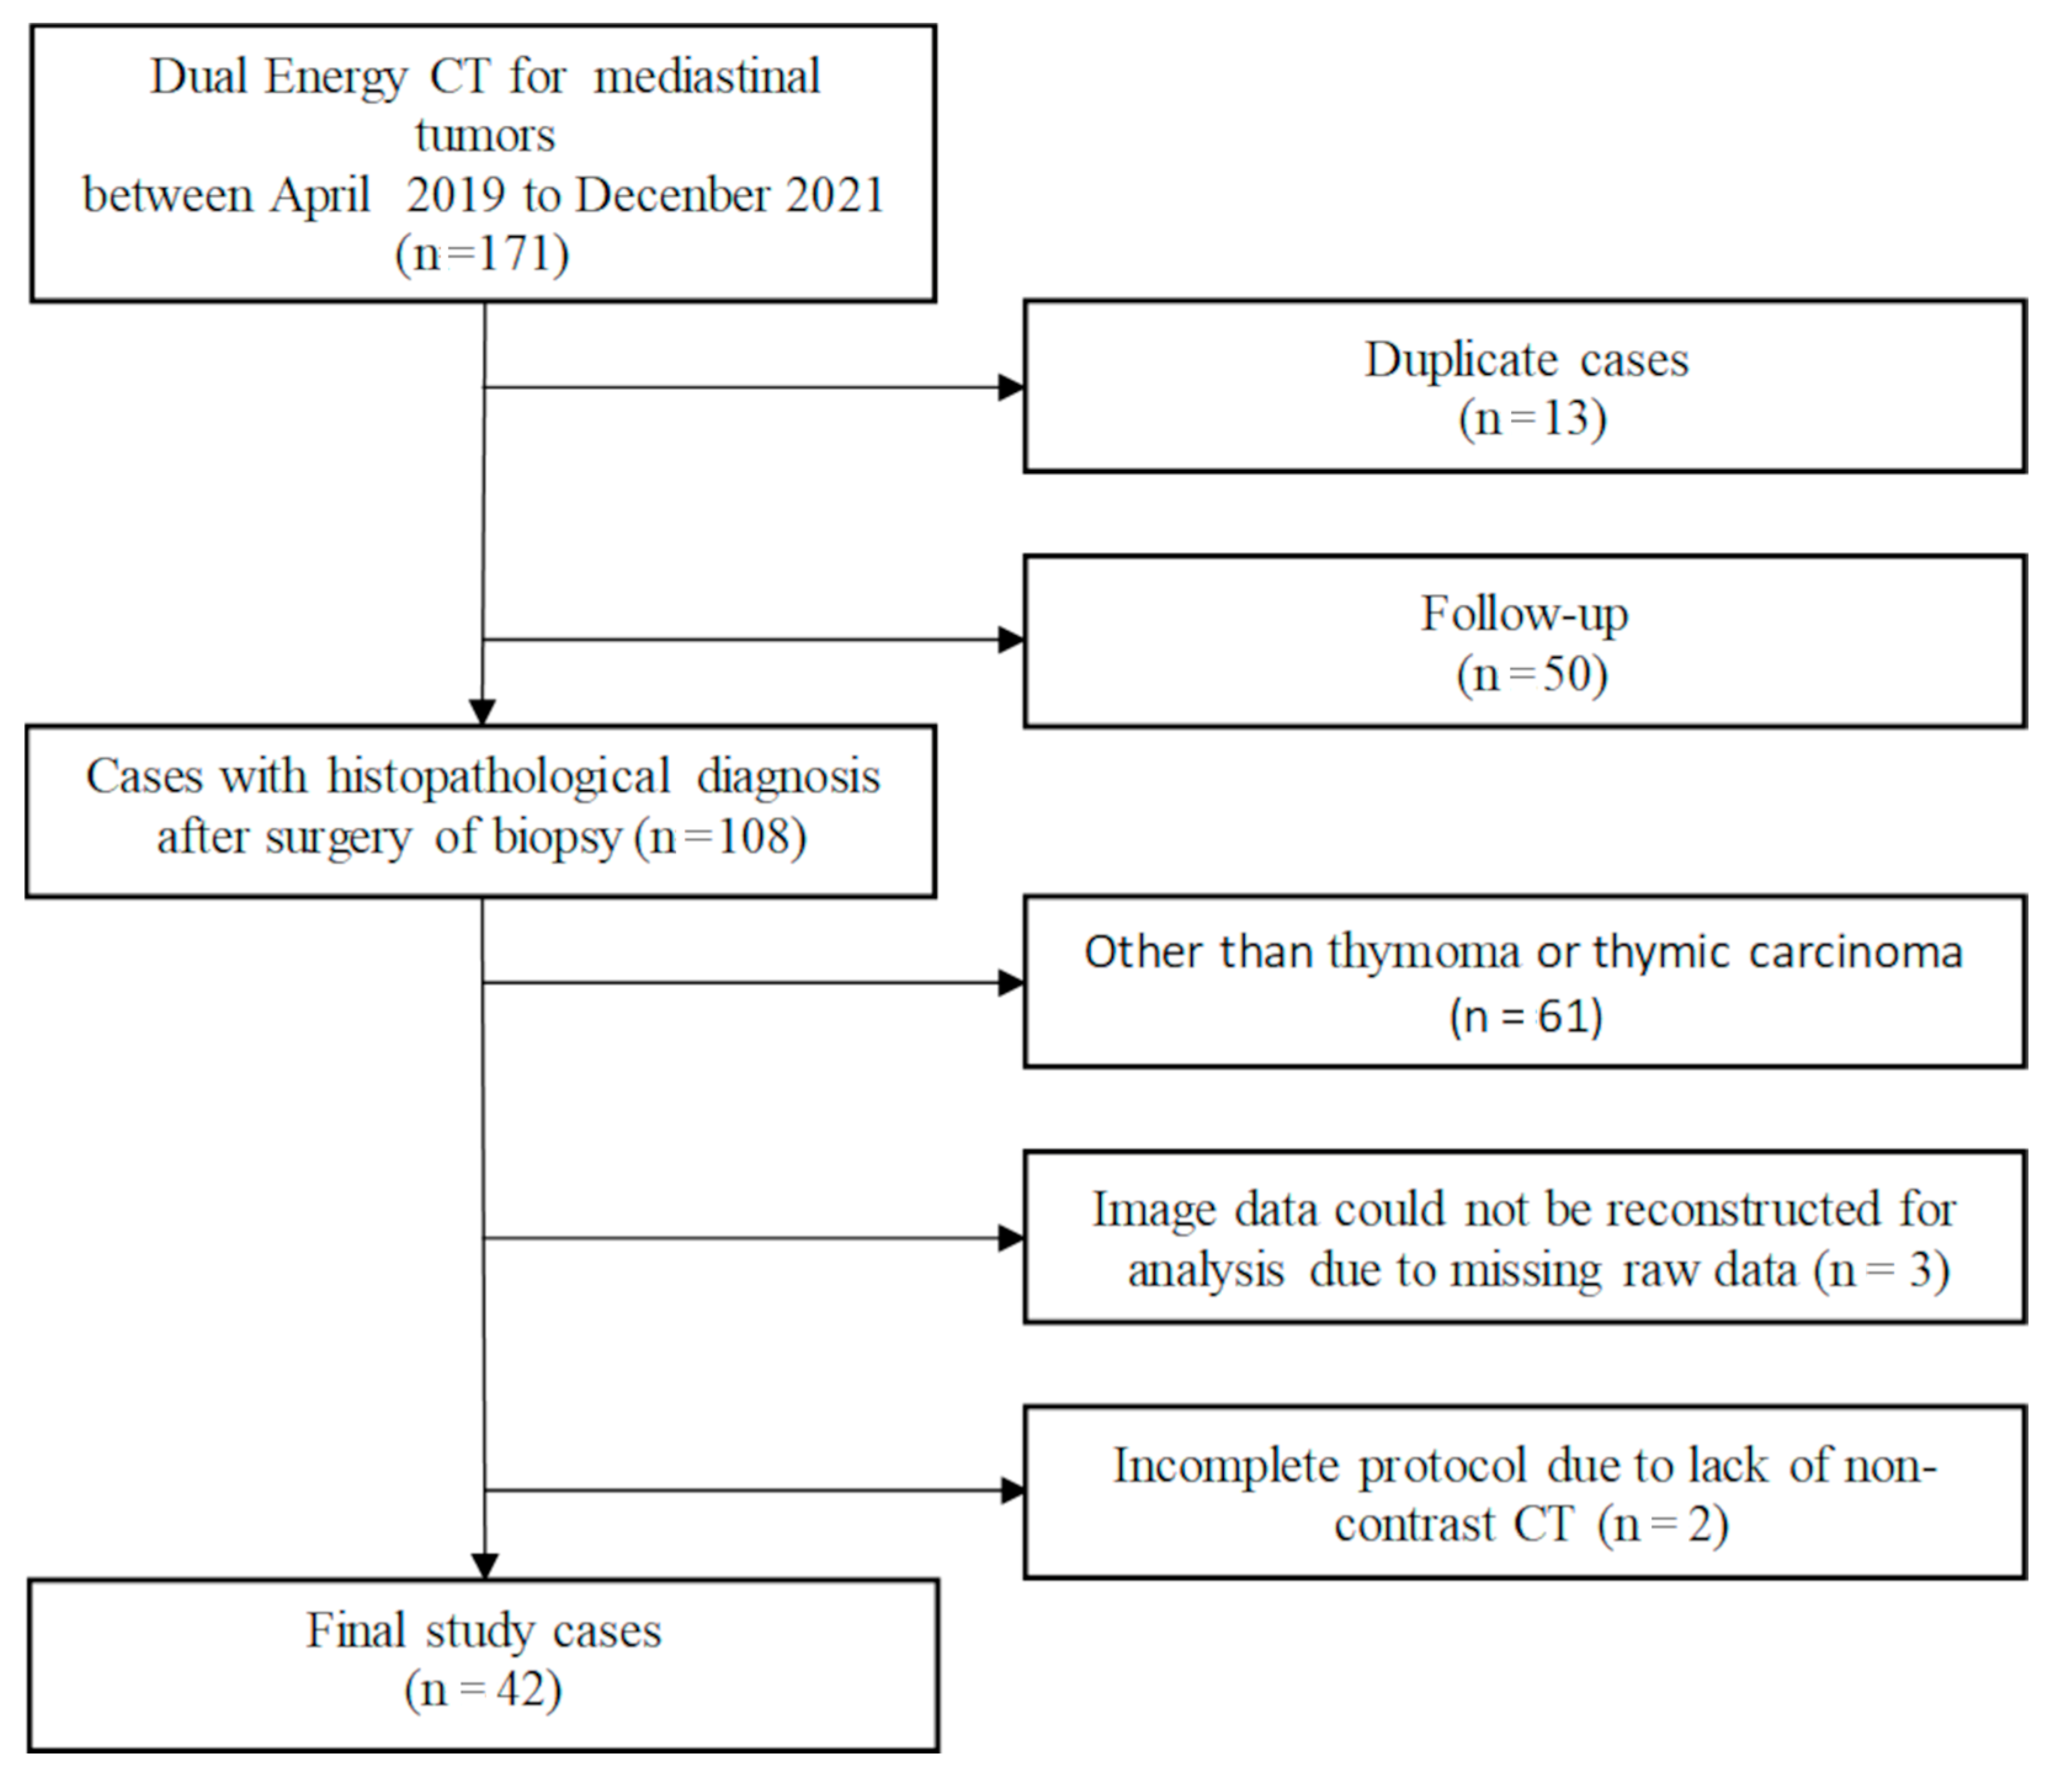
2.1. Patients
2.2. Dual-Energy CT protocols
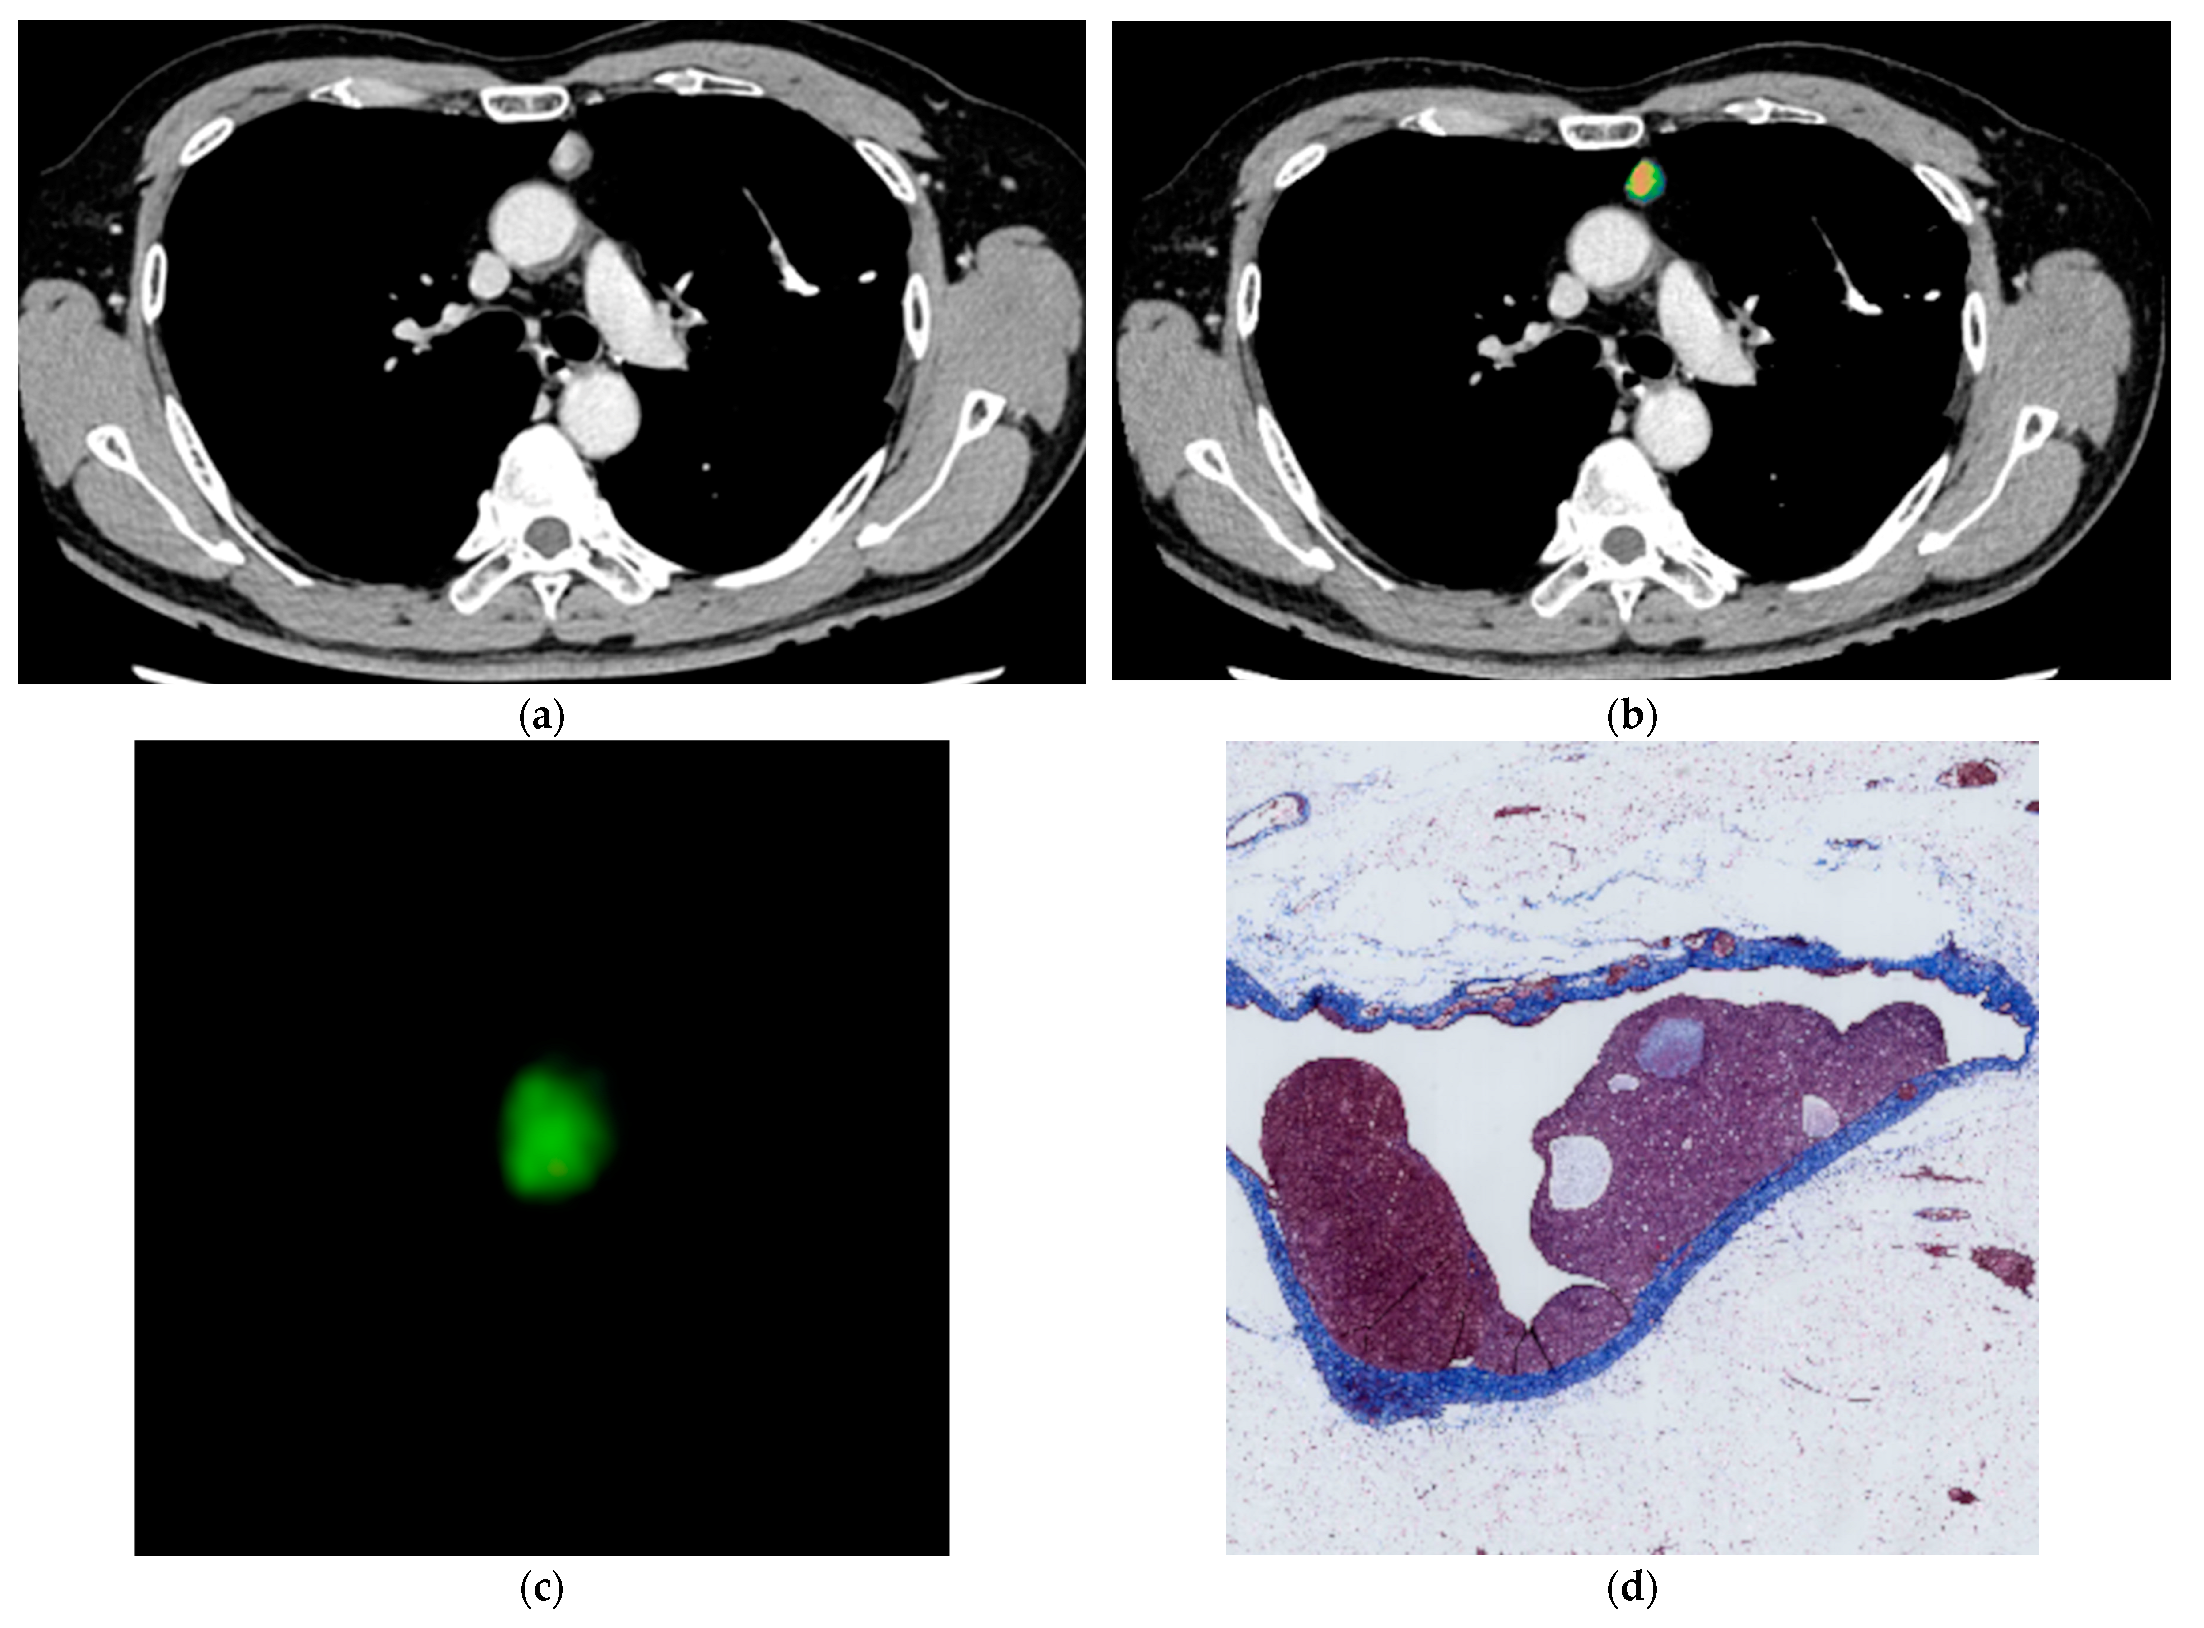
2.3. Image Analysis
2.4. Histological Evaluation
2.5. Statistical Analysis
3. Results
3.1. Study Population
3.2. Quantitative Date
3.3. Predictive Performance for Thymic Carcinoma Using Quantitative Features
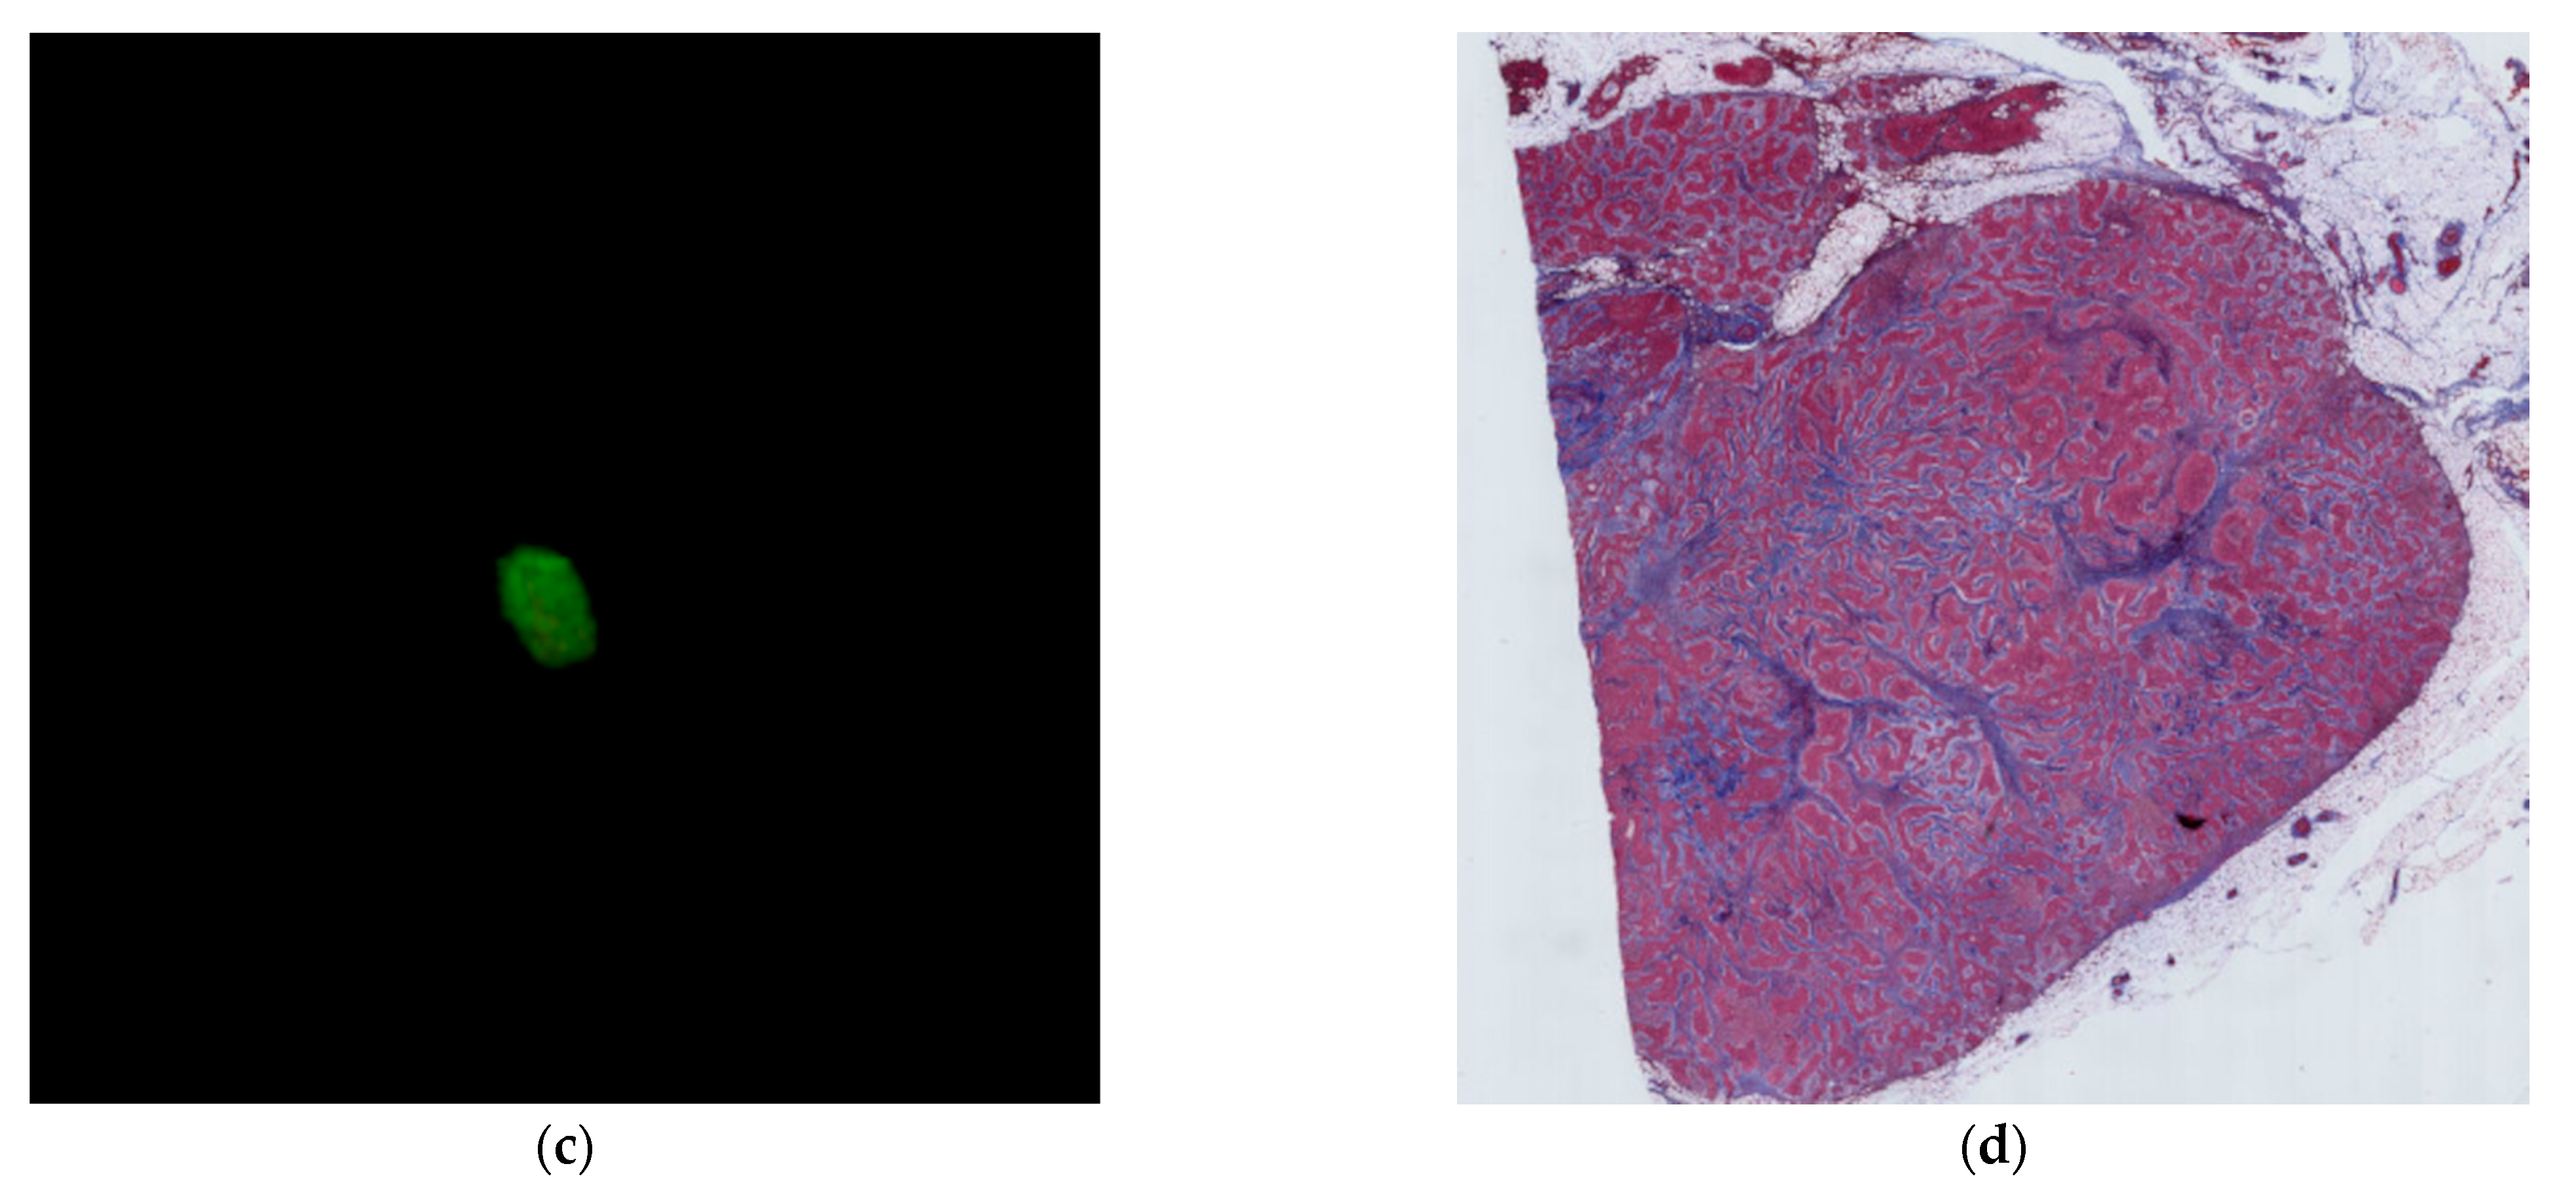
3.4. Pathological Evaluation of Fibrosis within the Tumor
4. Discussion
Author Contributions
Funding
Institutional Review Board Statement
Informed Consent Statement
Data Availability Statement
Conflicts of Interest
References
- Knetki-Wróblewska, M.; Kowalski, D.M.; Olszyna-Serementa, M.; Krzakowski, M.; Szołkowska, M. Thymic epithelial tumors: Do we know all the prognostic factors? Thorac. Cancer 2021, 12, 339–348. [Google Scholar] [CrossRef]
- Ohira, R.; Yanagawa, M.; Suzuki, Y.; Hata, A.; Miyata, T.; Kikuchi, N.; Yoshida, Y.; Yamagata, K.; Doi, S.; Ninomiya, K.; et al. CT-based radiomics analysis for differentiation between thymoma and thymic carcinoma. J. Thorac. Dis. 2022, 14, 1342–1352. [Google Scholar] [CrossRef] [PubMed]
- Marx, A.; Chan, J.K.; Coindre, J.M.; Detterbeck, F.; Girard, N.; Harris, N.L.; Jaffe, E.S.; Kurrer, M.O.; Marom, E.M.; Moreira, A.L.; et al. The 2015 World Health Organization Classification of Tumors of the Thymus: Continuity and Changes. J. Thorac. Oncol. 2015, 10, 1383–1395. [Google Scholar] [CrossRef]
- Kayi Cangir, A.; Orhan, K.; Kahya, Y.; Özakıncı, H.; Kazak, B.B.; Konuk Balcı, B.M.; Karasoy, D.; Uzun, Ç. CT imaging-based machine learning model: A potential modality for predicting low-risk and high-risk groups of thymoma: "Impact of surgical modality choice". World J. Surg. Oncol. 2021, 19, 147. [Google Scholar] [CrossRef] [PubMed]
- Sadohara, J.; Fujimoto, K.; Müller, N.L.; Kato, S.; Takamori, S.; Ohkuma, K.; Terasaki, H.; Hayabuchi, N. Thymic epithelial tumors: Comparison of CT and MR imaging findings of low-risk thymomas, high-risk thymomas, and thymic carcinomas. Eur. J. Radiol. 2006, 60, 70–79. [Google Scholar] [CrossRef] [PubMed]
- Strange, C.D.; Ahuja, J.; Shroff, G.S.; Truong, M.T.; Marom, E.M. Imaging Evaluation of Thymoma and Thymic Carcinoma. Front. Oncol. 2022, 11, 810419. [Google Scholar] [CrossRef] [PubMed]
- Bakan, S.; Kandemirli, S.G.; Dikici, A.S.; Erşen, E.; Yıldırım, O.; Samancı, C.; Batur, Ş.; Çebi Olgun, D.; Kantarcı, F.; Akman, C. Evaluation of anterior mediastinal solid tumors by CT perfusion: A preliminary study. Diagn. Interv. Radiol. 2017, 23, 10–14. [Google Scholar] [CrossRef]
- Abdel Razek, A.A.; Khairy, M.; Nada, N. Diffusion-weighted MR imaging in thymic epithelial tumors: Correlation with World Health Organization classification and clinical staging. Radiology 2014, 273, 268–275. [Google Scholar] [CrossRef]
- Zhang, W.; Zhou, Y.; Xu, X.Q.; Kong, L.Y.; Xu, H.; Yu, T.F.; Shi, H.B.; Feng, Q. A Whole-Tumor Histogram Analysis of Apparent Diffusion Coefficient Maps for Differentiating Thymic Carcinoma from Lymphoma. Korean J. Radiol. 2018, 19, 358–365. [Google Scholar] [CrossRef]
- Xiao, G.; Rong, W.C.; Hu, Y.C.; Shi, Z.Q.; Yang, Y.; Ren, J.L.; Cui, G.B. MRI Radiomics Analysis for Predicting the Pathologic Classification and TNM Staging of Thymic Epithelial Tumors: A Pilot Study. AJR Am. J. Roentgenol. 2020, 214, 328–340. [Google Scholar] [CrossRef]
- Chang, S.; Hur, J.; Im, D.J.; Suh, Y.J.; Hong, Y.J.; Lee, H.J.; Kim, Y.J.; Han, K.; Kim, D.J.; Lee, C.Y.; et al. Volume-based quantification using dual-energy computed tomography in the differentiation of thymic epithelial tumours: An initial experience. Eur. Radiol. 2017, 27, 1992–2001. [Google Scholar] [CrossRef] [PubMed]
- Haaf, P.; Garg, P.; Messroghli, D.R.; Broadbent, D.A.; Greenwood, J.P.; Plein, S. Cardiac T1 Mapping and Extracellular Volume (ECV) in clinical practice: A comprehensive review. J. Cardiovasc. Magn. Reson. 2016, 18, 89. [Google Scholar] [CrossRef] [PubMed]
- Yoon, J.H.; Lee, J.M.; Kim, J.H.; Lee, K.B.; Kim, H.; Hong, S.K.; Yi, N.J.; Lee, K.W.; Suh, K.S. Hepatic fibrosis grading with extracellular volume fraction from iodine mapping in spectral liver CT. Eur. J. Radiol. 2021, 137, 109604. [Google Scholar] [CrossRef] [PubMed]
- Fukui, H.; Onishi, H.; Nakamoto, A.; Tsuboyama, T.; Ota, T.; Yano, K.; Enchi, Y.; Yamada, D.; Takeda, Y.; Kobayashi, S.; et al. Pancreatic fibrosis by extracellular volume fraction using Contrast-enhanced computed tomography and relationship with pancreatic cancer. Eur. J. Radiol. 2022, 156, 110522. [Google Scholar] [CrossRef]
- Hasebe, T.; Sasaki, S.; Imoto, S.; Mukai, K.; Yokose, T.; Ochiai, A. Prognostic Significance of Fibrotic Focus in Invasive Ductal Carcinoma of the Breast: A Prospective Observational Study. Mod. Pathol. 2002, 15, 502–516. [Google Scholar] [CrossRef]
- Okumura, M.; Ohta, M.; Tateyama, H.; Nakagawa, K.; Matsumura, A.; Maeda, H.; Tada, H.; Eimoto, T.; Matsuda, H.; Masaoka, A. The World Health Organization histologic classification system reflects the oncologic behavior of thymoma: A clinical study of 273 patients. Cancer 2002, 94, 624–632. [Google Scholar] [CrossRef]
- Berghmans, T.; Durieux, V.; Holbrechts, S.; Jungels, C.; Lafitte, J.J.; Meert, A.P.; Moretti, L.; Ocak, S.; Roelandts, M.; Girard, N. Systemic treatments for thymoma and thymic carcinoma: A systematic review. Lung Cancer 2018, 126, 25–31. [Google Scholar] [CrossRef]
- Falkson, C.B.; Bezjak, A.; Darling, G.; Gregg, R.; Malthaner, R.; Maziak, D.E.; Yu, E.; Smith, C.A.; McNair, S.; Ung, Y.C.; et al. Lung Cancer Disease Site Group of Cancer Care Ontario’s Program in Evidence-Based Care. The management of thymoma: A systematic review and practice guideline. J. Thorac. Oncol. 2009, 4, 911–919. [Google Scholar] [CrossRef]
- Messroghli, D.R.; Moon, J.C.; Ferreira, V.M.; Grosse-Wortmann, L.; He, T.; Kellman, P.; Mascherbauer, J.; Nezafat, R.; Salerno, M.; Schelbert, E.B.; et al. Clinical recommendations for cardiovascular magnetic resonance mapping of T1, T2, T2* and extracellular volume: A consensus statement by the Society for Cardiovascular Magnetic Resonance (SCMR) endorsed by the European Association for Cardiovascular Imaging (EACVI). J. Cardiovasc. Magn. Reson. 2017, 19, 75. [Google Scholar] [CrossRef]
- Xing, F.; Saidou, J.; Watabe, K. Cancer associated fibroblasts (CAFs) in tumor microenvironment. Front. Biosci. 2010, 15, 166–179. [Google Scholar] [CrossRef]
- Chang, C.C.; Lin, C.Y.; Chu, C.Y.; Hsiung, Y.C.; Chuang, M.T.; Tseng, Y.L.; Yen, Y.T. Extracellular volume fraction measurement correlates with lymphocyte abundance in thymic epithelial tumors. Cancer Imaging 2020, 20, 71. [Google Scholar] [CrossRef]
- Yan, W.Q.; Xin, Y.K.; Jing, Y.; Li, G.F.; Wang, S.M.; Rong, W.C.; Xiao, G.; Lei, X.B.; Li, B.; Hu, Y.C.; et al. Iodine Quantification Using Dual-Energy Computed Tomography for Differentiating Thymic Tumors. J. Comput. Assist. Tomogr. 2018, 42, 873–880. [Google Scholar] [CrossRef] [PubMed]
- Zhang, D.; Li, X.; Liu, B. Objective characterization of GE discovery CT750 HD scanner: Gemstone spectral imaging mode. Med. Phys. 2011, 38, 1178–1188. [Google Scholar] [CrossRef]
- Maass, C.; Baer, M.; Kachelriess, M. Image-based dual-energy CT using optimized precorrection functions: A practical new approach of material decomposition in image domain. Med. Phys. 2009, 36, 3818–3829. [Google Scholar] [CrossRef] [PubMed]
- Yanagawa, M.; Tomiyama, N. Prediction of thymoma histology and stage by radiographic criteria. Thorac. Surg. Clin. 2011, 21, 1–12. [Google Scholar] [CrossRef] [PubMed]
- Tomiyama, N.; Johkoh, T.; Mihara, N.; Honda, O.; Kozuka, T.; Koyama, M.; Hamada, S.; Okumura, M.; Ohta, M.; Eimoto, T.; et al. Using the World Health Organization Classification of thymic epithelial neoplasms to describe CT findings. Am. J. Roentgenol. 2002, 179, 881–886. [Google Scholar] [CrossRef] [PubMed]
- Tortora, M.; Gemini, L.; D’Iglio, I.; Ugga, L.; Spadarella, G.; Cuocolo, R. Spectral Photon-Counting Computed Tomography: A Review on Technical Principles and Clinical Applications. J. Imaging. 2022, 8, 112. [Google Scholar] [CrossRef]


| Mean ± SD | |||
|---|---|---|---|
| Low-Risk Thymoma | High-Risk Thymoma | Thymic Carcinoma | |
| Maximum | 5.61 ± 3.64 | 6.02 ± 5.05 | 4.67 ± 2.93 |
| Minimum | −2.87 ± 0.047 | −2.89 ± 0.034 | −2.9 ± 0 |
| Median | 1.59 ± 0.67 | 1.54 ± 0.47 | 1.9 ± 0.35 |
| Average | 1.46 ± 0.55 | 1.35 ± 0.44 | 1.65 ± 0.29 |
| SD | 0.80 ± 0.28 | 0.86 ± 0.23 | 0.97 ± 0.18 |
| Skewness | −0.97 ± 1.36 | −1.01 ± 1.68 | −1.61 ± 0.78 |
| Kurtosis | 8.28 ± 3.87 | 9.69 ± 8.09 | 6.69 ± 3.56 |
| Iodine effect | 1.31 ± 0.51 | 1.20 ± 0.36 | 1.61 ± 0.26 |
| ECV | 20.49 ± 7.22 | 18.65 ± 5.97 | 25.58 ± 4.67 |
| Thymic Carcinoma vs. Thymoma | High-Risk Thymoma vs. Low-Risk Thymoma | |||||
|---|---|---|---|---|---|---|
| Features | N | Cut-Off Value | Mean ± SD | N | Cut-Off Value | Mean ± SD |
| Maximum | ||||||
| Score = 0 | 24 | 7.56 ± 4.54 | 18 | 8.42 ± 4.75 | ||
| Score = 1 | 18 | ≤3.6 | 3.06 ± 0.41 | 18 | ≤3.9 | 3.16 ± 0.51 |
| Minimum | ||||||
| Score = 0 | 8 | −2.8 | 8 | −2.8 | ||
| Score = 1 | 34 | ≤−2.9 | −2.9 | 28 | ≤−2.9 | −2.9 |
| Median | ||||||
| Score = 0 | 22 | 1.21 ± 0.40 | 10 | 2.26 ± 0.31 | ||
| Score = 1 | 20 | >1.6 | 2.06 ± 0.35 | 26 | ≤1.7 | 1.30 ± 0.41 |
| Average | ||||||
| Score = 0 | 29 | 1.20 ± 0.34 | 9 | 2.06 ± 0.29 | ||
| Score = 1 | 13 | >1.61 | 1.98 ± 0.27 | 27 | ≤1.61 | 1.20 ± 0.35 |
| SD | ||||||
| Score = 0 | 25 | 6.83 ± 1.13 | 15 | 6.19 ± 0.99 | ||
| Score = 1 | 17 | >8.41 | 10.83 ± 1.97 | 21 | >7.41 | 9.72 ± 2.31 |
| Skewness | ||||||
| Score = 0 | 31 | −0.65 ± 1.41 | 30 | −0.71 ± 1.47 | ||
| Score = 1 | 11 | ≤−2 | −2.29 ± 0.29 | 6 | ≤−2.14 | −2.39 ± 0.29 |
| Kurtosis | ||||||
| Score = 0 | 31 | 10.41 ± 5.65 | 7 | 2.91 ± 0.82 | ||
| Score = 1 | 11 | ≤4.78 | 3.33 ± 0.96 | 29 | >4.13 | 10.30 ± 5.90 |
| Iodine effect | ||||||
| Score = 0 | 18 | 0.93 ± 0.26 | 12 | 1.76 ± 0.28 | ||
| Score = 1 | 24 | >1.2 | 1.60 ± 0.31 | 24 | ≤1.31 | 1.01 ± 0.27 |
| ECV | ||||||
| Score = 0 | 26 | 16.51 ± 4.87 | 11 | 27.05 ± 3.25 | ||
| Score = 1 | 16 | >21.47 | 27.04 ± 3.18 | 25 | ≤21.47 | 16.43 ± 4.95 |
| Univariate Analysis | Multivariate Analysis | |||||||||
|---|---|---|---|---|---|---|---|---|---|---|
| Features | Thymoma (n) | Thymic Carcinoma (n) | Odds Ratio | 95% Confidence Interval | p Value | Thymoma (n) | Thymic Carcinoma (n) | Odds Ratio | 95% Confidence Interval | p Value |
| Maximum | 3.1 | 0.5–19.5 | 0.219 | |||||||
| Score = 0 (n = 24) | 22 | 2 | ||||||||
| Score = 1 (n = 18) | 14 | 4 | ||||||||
| Minimum | 1.68 × 10⁸ | 0.997 | ||||||||
| Score = 0 (n = 8) | 8 | 0 | ||||||||
| Score = 1 (n = 34) | 28 | 6 | ||||||||
| Median | 7 | 0.7–66.2 | 0.090 | |||||||
| Score = 0 (n = 22) | 21 | 1 | ||||||||
| Score = 1 (n = 20) | 15 | 5 | ||||||||
| Average | 6 | 0.9–38.4 | 0.059 | |||||||
| Score = 0 (n = 29) | 27 | 2 | ||||||||
| Score = 1 (n = 13) | 9 | 4 | ||||||||
| SD | 10 | 1.0–95.5 | 0.046 | |||||||
| Score = 0 (n = 25) | 24 | 1 | ||||||||
| Score = 1 (n = 17) | 12 | 5 | ||||||||
| Skewness | 3.5 | 0.6–20.8 | 0.168 | |||||||
| Score = 0 (n = 31) | 28 | 3 | ||||||||
| Score = 1 (n = 11) | 8 | 3 | ||||||||
| Kurtosis | 3.5 | 0.6–20.8 | 0.168 | |||||||
| Score = 0 (n = 31) | 28 | 3 | ||||||||
| Score = 1 (n = 11) | 8 | 3 | ||||||||
| Iodine effect | 7.09 × 10⁸ | 0.998 | ||||||||
| Score = 0 (n = 18) | 18 | 0 | ||||||||
| Score = 1 (n = 24) | 18 | 6 | ||||||||
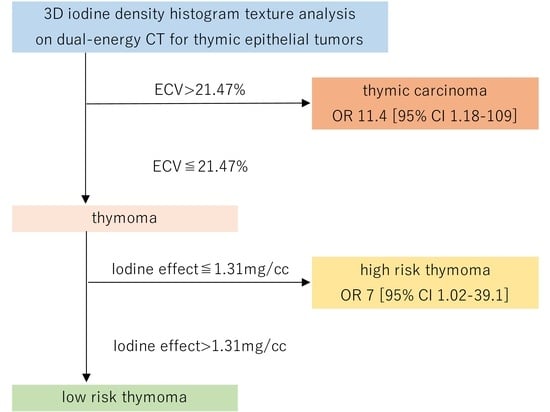
| ECV | 11.4 | 1.2–109.2 | 0.035 | 11.4 | 1.2–109.2 | 0.035 | ||||
| Score = 0 (n = 26) | 25 | 1 | 25 | 1 | ||||||
| Score = 1 (n = 16) | 11 | 5 | 11 | 5 | ||||||
| Univariate Analysis | Multivariate Analysis | |||||||||
|---|---|---|---|---|---|---|---|---|---|---|
| Features | Low-Risk Thymoma (n) | High-Risk Thymoma (n) | Odds Ratio | 95% Confidence Interval | p Value | Low-Risk Thymoma (n) | High-Risk Thymoma (n) | Odds Ratio | 95% Confidence Interval | p Value |
| Maximum | 2.5 | 0.6–9.7 | 0.184 | |||||||
| Score = 0 (n = 18) | 12 | 6 | ||||||||
| Score = 1 (n = 18) | 8 | 10 | ||||||||
| Minimum | 3 | 0.5–17.5 | 0.222 | |||||||
| Score = 0 (n = 8) | 6 | 2 | ||||||||
| Score = 1 (n = 28) | 14 | 14 | ||||||||
| Median | 4.7 | 0.8–26.3 | 0.081 | |||||||
| Score = 0 (n = 10) | 8 | 2 | ||||||||
| Score = 1 (n = 26) | 12 | 14 | ||||||||
| Average | 10 | 1.1–91.4 | 0.041 | |||||||
| Score = 0 (n = 9) | 8 | 1 | ||||||||
| Score = 1 (n = 27) | 12 | 15 | ||||||||
| SD | 3.7 | 0.9–15.4 | 0.076 | |||||||
| Score = 0 (n = 15) | 11 | 4 | ||||||||
| Score = 1 (n = 21) | 9 | 12 | ||||||||
| Skewness | 8.6 | 0.9–83.8 | 0.063 | |||||||
| Score = 0 (n = 30) | 19 | 11 | ||||||||
| Score = 1 (n = 6) | 1 | 5 | ||||||||
| Kurtosis | 0.2 | 0.04–1.5 | 0.126 | |||||||
| Score = 0 (n = 7) | 18 | 11 | ||||||||
| Score = 1 (n = 29) | 2 | 5 | ||||||||
| Iodine effect | 7 | 1.3–39.1 | 0.027 | 7 | 1.3–39.1 | 0.027 | ||||
| Score = 0 (n = 12) | 10 | 2 | 10 | 2 | ||||||
| Score = 1 (n = 24) | 10 | 14 | 10 | 14 | ||||||
| ECV | 5.7 | 1.0–32.1 | 0.047 | |||||||
| Score = 0 (n = 11) | 9 | 2 | ||||||||
| Score = 1 (n = 25) | 11 | 14 | ||||||||
Disclaimer/Publisher’s Note: The statements, opinions and data contained in all publications are solely those of the individual author(s) and contributor(s) and not of MDPI and/or the editor(s). MDPI and/or the editor(s) disclaim responsibility for any injury to people or property resulting from any ideas, methods, instructions or products referred to in the content. |
© 2023 by the authors. Licensee MDPI, Basel, Switzerland. This article is an open access article distributed under the terms and conditions of the Creative Commons Attribution (CC BY) license (https://creativecommons.org/licenses/by/4.0/).
Share and Cite
Doi, S.; Yanagawa, M.; Matsui, T.; Hata, A.; Kikuchi, N.; Yoshida, Y.; Yamagata, K.; Ninomiya, K.; Kido, S.; Tomiyama, N. Usefulness of Three-Dimensional Iodine Mapping Quantified by Dual-Energy CT for Differentiating Thymic Epithelial Tumors. J. Clin. Med. 2023, 12, 5610. https://doi.org/10.3390/jcm12175610
Doi S, Yanagawa M, Matsui T, Hata A, Kikuchi N, Yoshida Y, Yamagata K, Ninomiya K, Kido S, Tomiyama N. Usefulness of Three-Dimensional Iodine Mapping Quantified by Dual-Energy CT for Differentiating Thymic Epithelial Tumors. Journal of Clinical Medicine. 2023; 12(17):5610. https://doi.org/10.3390/jcm12175610
Chicago/Turabian StyleDoi, Shuhei, Masahiro Yanagawa, Takahiro Matsui, Akinori Hata, Noriko Kikuchi, Yuriko Yoshida, Kazuki Yamagata, Keisuke Ninomiya, Shoji Kido, and Noriyuki Tomiyama. 2023. "Usefulness of Three-Dimensional Iodine Mapping Quantified by Dual-Energy CT for Differentiating Thymic Epithelial Tumors" Journal of Clinical Medicine 12, no. 17: 5610. https://doi.org/10.3390/jcm12175610
APA StyleDoi, S., Yanagawa, M., Matsui, T., Hata, A., Kikuchi, N., Yoshida, Y., Yamagata, K., Ninomiya, K., Kido, S., & Tomiyama, N. (2023). Usefulness of Three-Dimensional Iodine Mapping Quantified by Dual-Energy CT for Differentiating Thymic Epithelial Tumors. Journal of Clinical Medicine, 12(17), 5610. https://doi.org/10.3390/jcm12175610