
Machine Learning Based Linking of Patient Reported Outcome Measures to WHO International Classification of Functioning, Disability, and Health Activity/Participation Categories
 ,
,
Abstract
:1. Introduction
2. Material and Methods
2.1. Ethics Statement
2.2. Participants and Study Design
2.3. Measures
2.3.1. Demographics and Pain Level
2.3.2. ICF Core Set for LBP
2.3.3. Questionnaires
2.4. Data Preparation and Selection of Classifier
2.5. Development and Tuning of RFs
2.6. Evaluation of RFs
- (1)
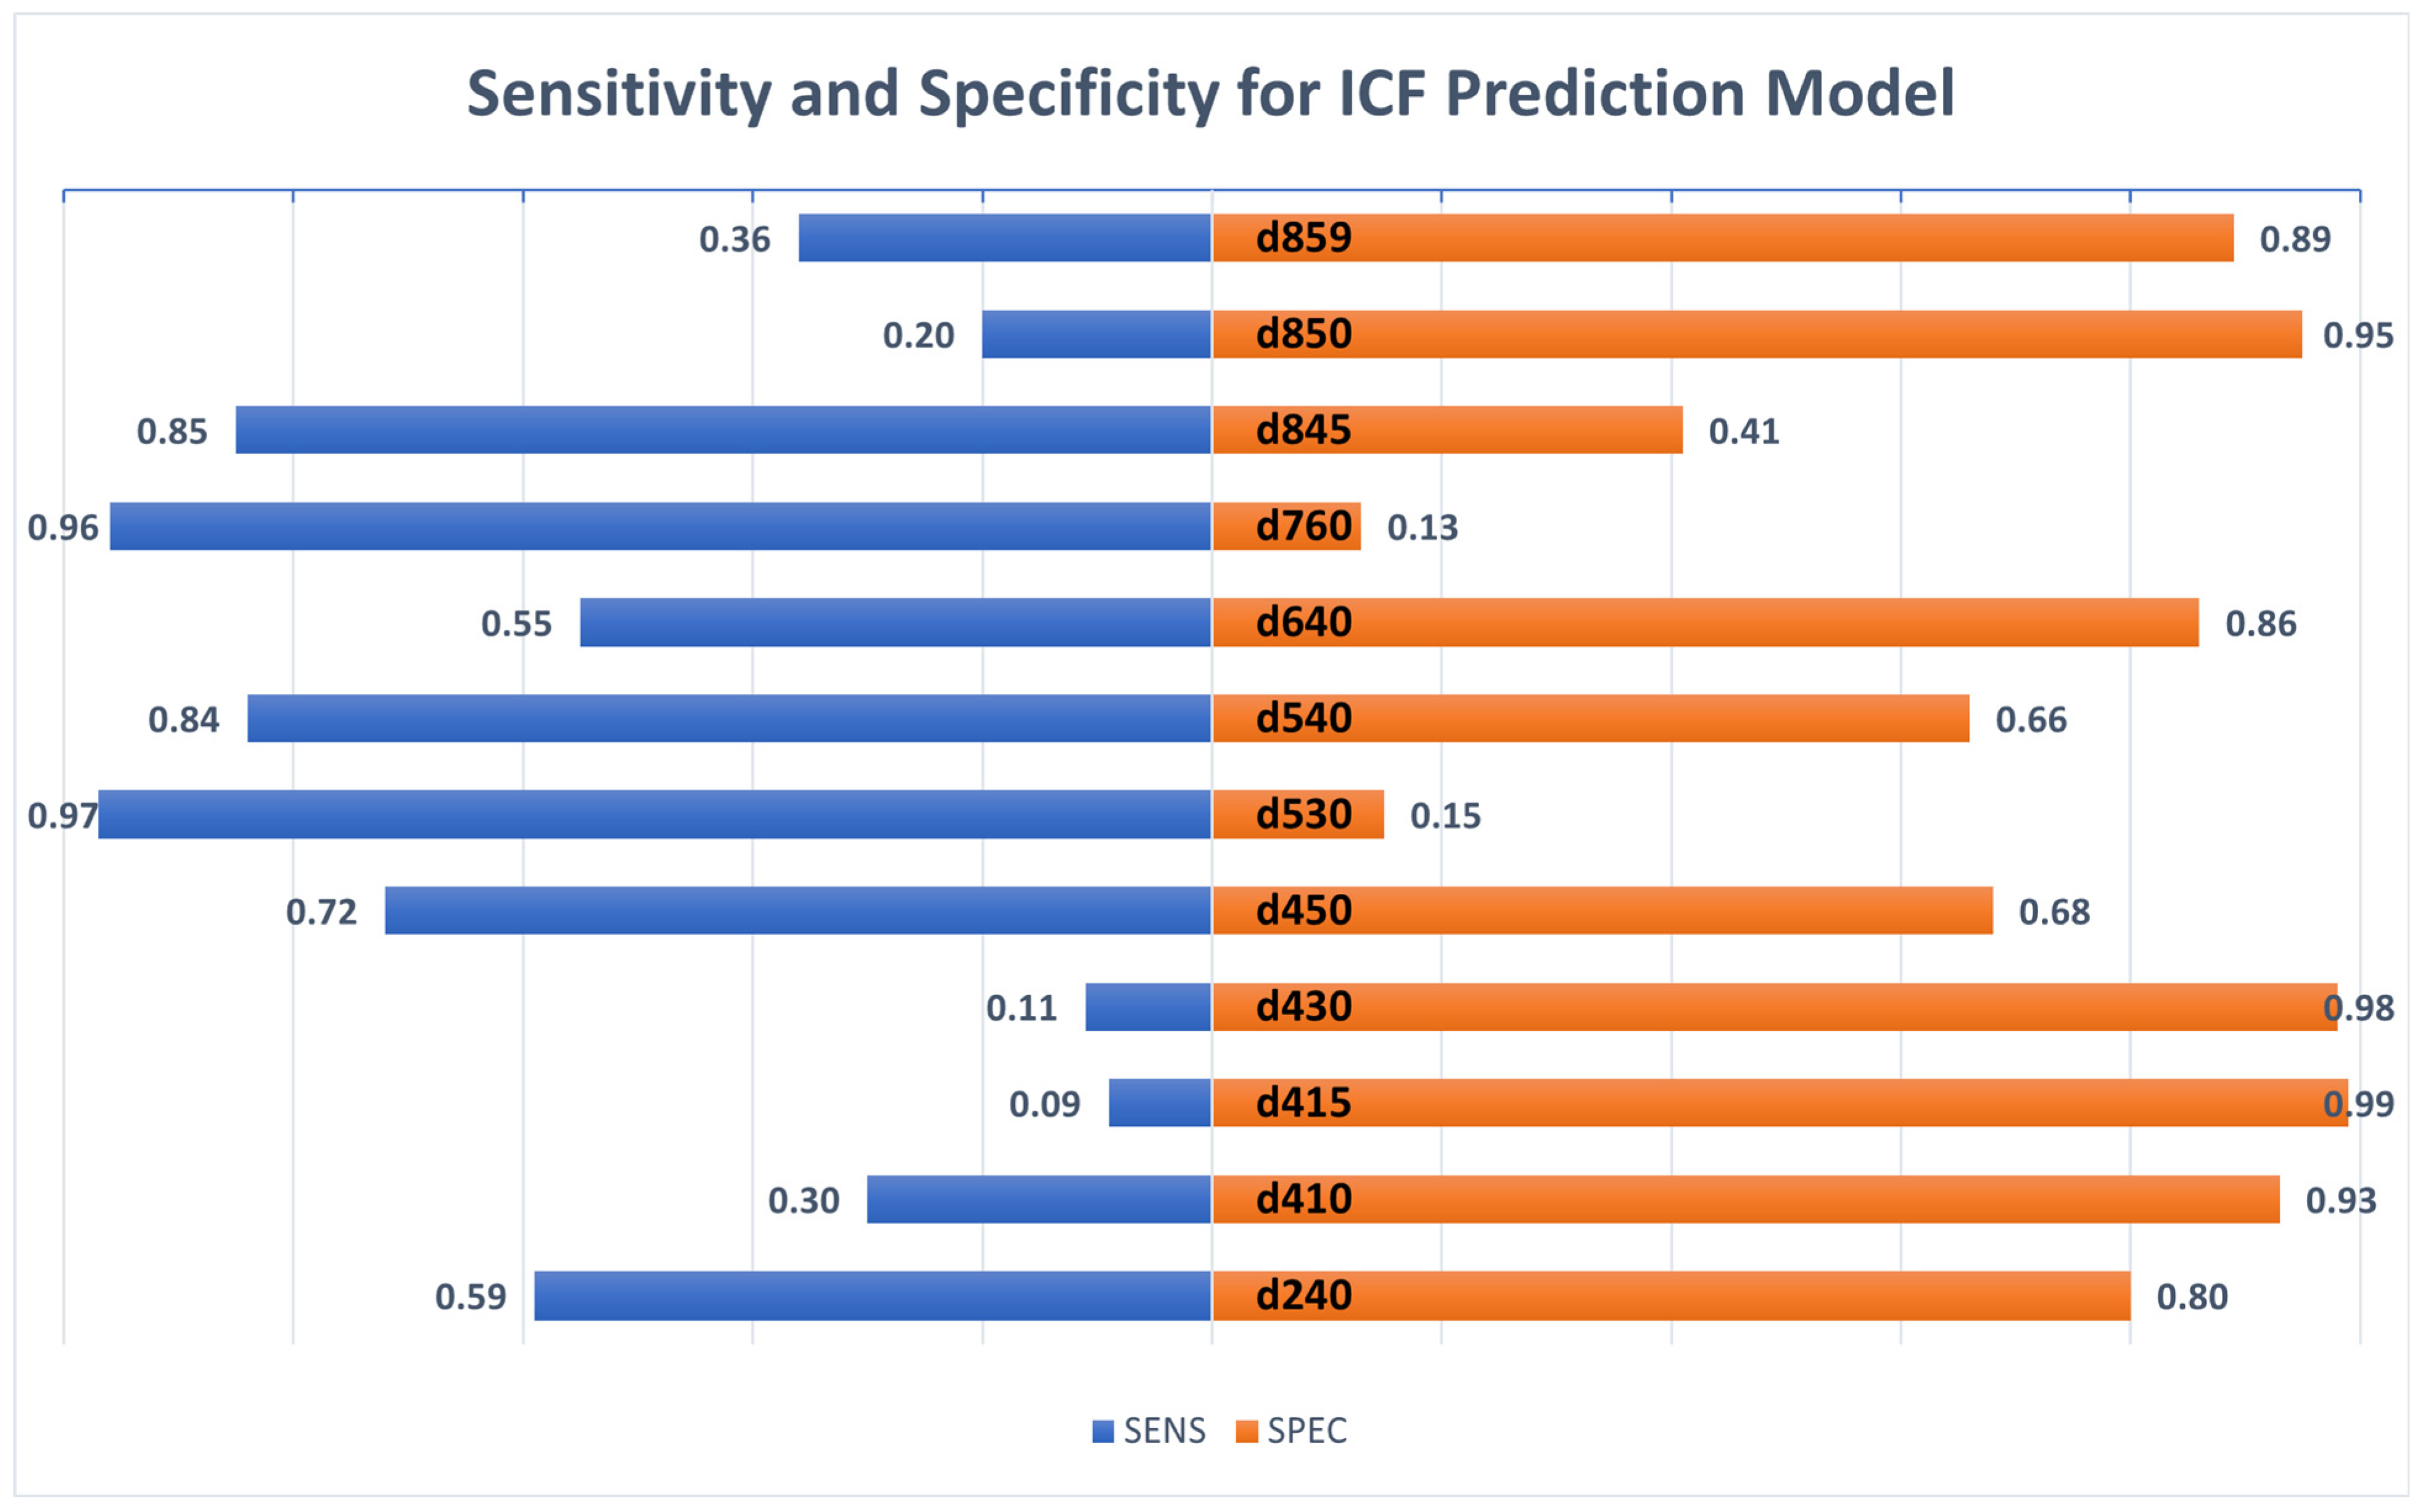
- The ROC-AUC was used to compare performance of the methods. The ROC-AUC is recommended to investigate imbalanced data as this was the case for most of the ICF categories in this dataset. The ROC AUC defines the optimal balance of sensitivity and specificity and can take a value between 0.5 and 1, where a ROC value of 1 would represent a perfect classifier and a value of 0.5 would mean that the classifier is not better than a random guess. Sensitivity is defined as the true positive rate, whereas specificity is referred to as the true negative rate. For the ROC AUC values, the following considerations can be made: 0.7 to 0.8—fair; 0.8 to 0.9—good; 0.9 to 1—excellent [28,39,40].
- (2)
- It is possible, especially with imbalanced data, that the AUC values show good performance even when either the sensitivity or the specificity values are low. Therefore, specificity and sensitivity are also reported as these metrics provide useful information about the model performance.
- (3)
- Precision provides further information as it is the rate of true positives divided by all positive predictions.
- (4)
- As the harmonic mean of precision and sensitivity, the F1 score was also included as a performance metric.
- (5)
- The overall accuracy, defined as the proportion of correctly predicted instances out of the total number of instances, was also provided as additional information. Due to the fact that most ICF categories in the dataset of this study are imbalanced, it should be noted that accuracy as a metric can be misleading [28].
- (6)
- Cohen’s Kappa coefficient of agreement between a problem observed within a category and a predicted problem within a category was used as a further metric. Scores range between −1 and 1, with negative values indicating worse performance than random chance and positive values indicating better performance than random chance [28]. Values exceeding 0.2 suggest fair agreement; those exceeding 0.4, moderate agreement; and those exceeding 0.6, substantial agreement [41,42].
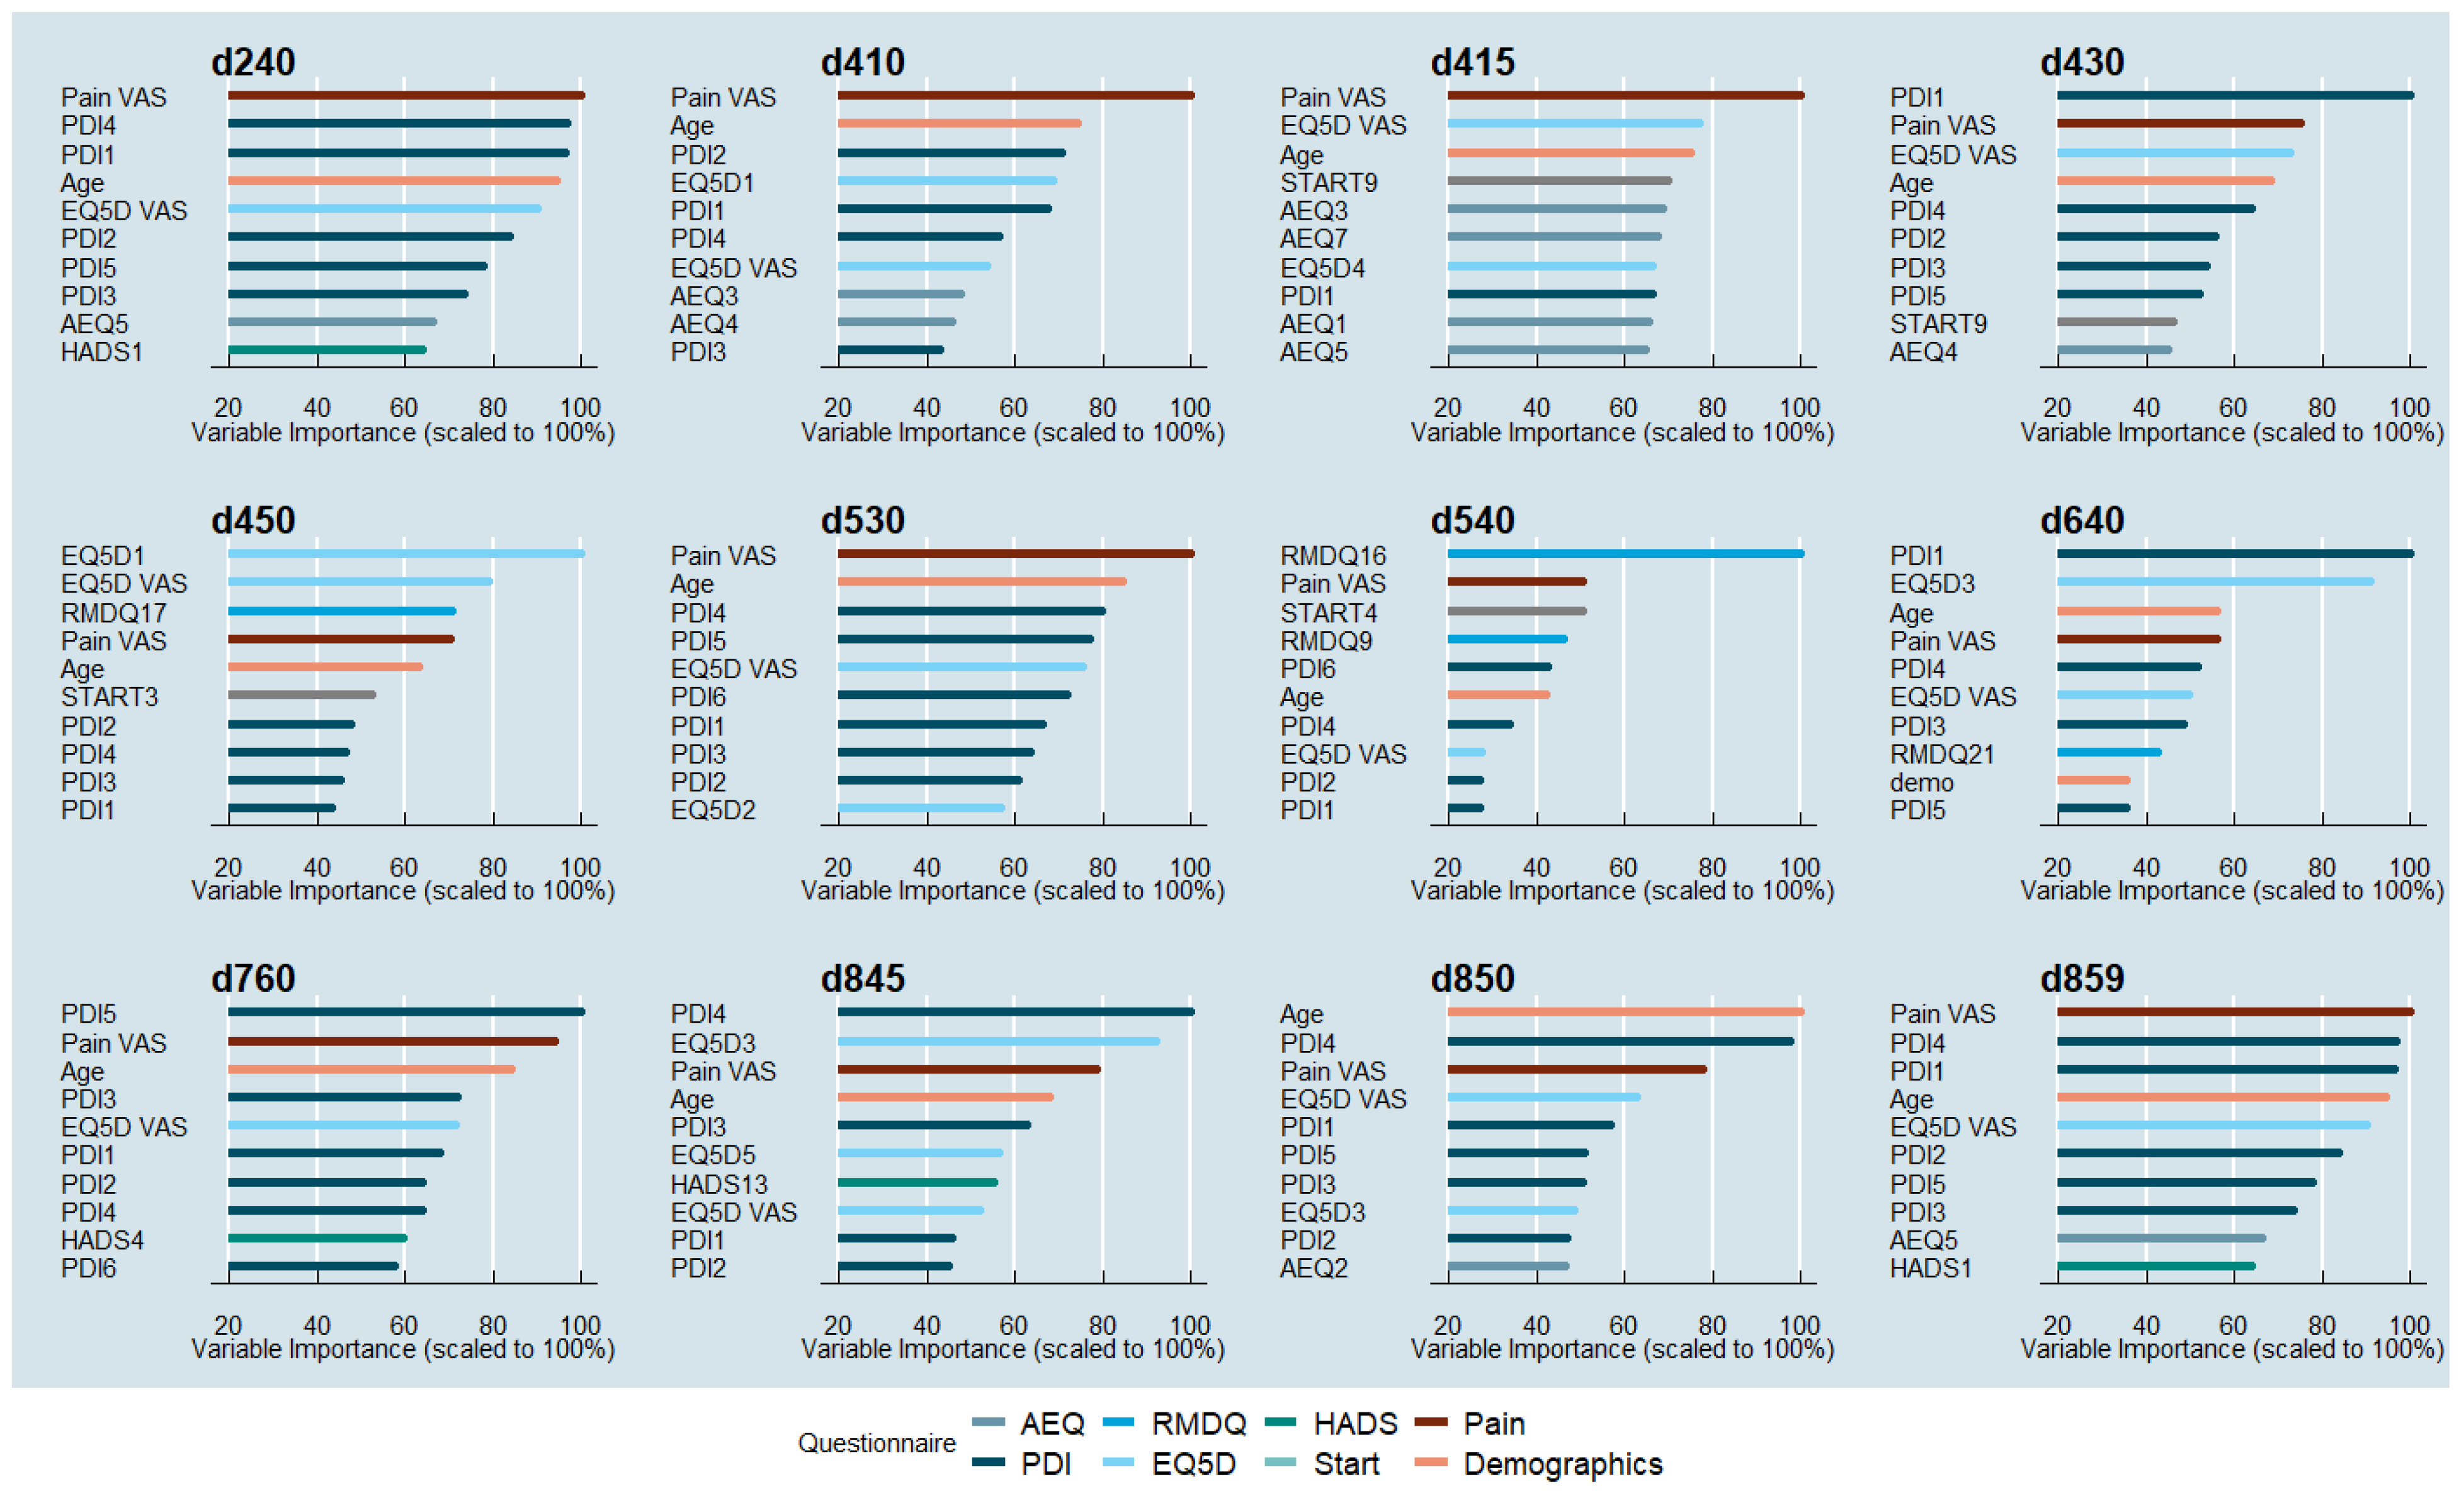
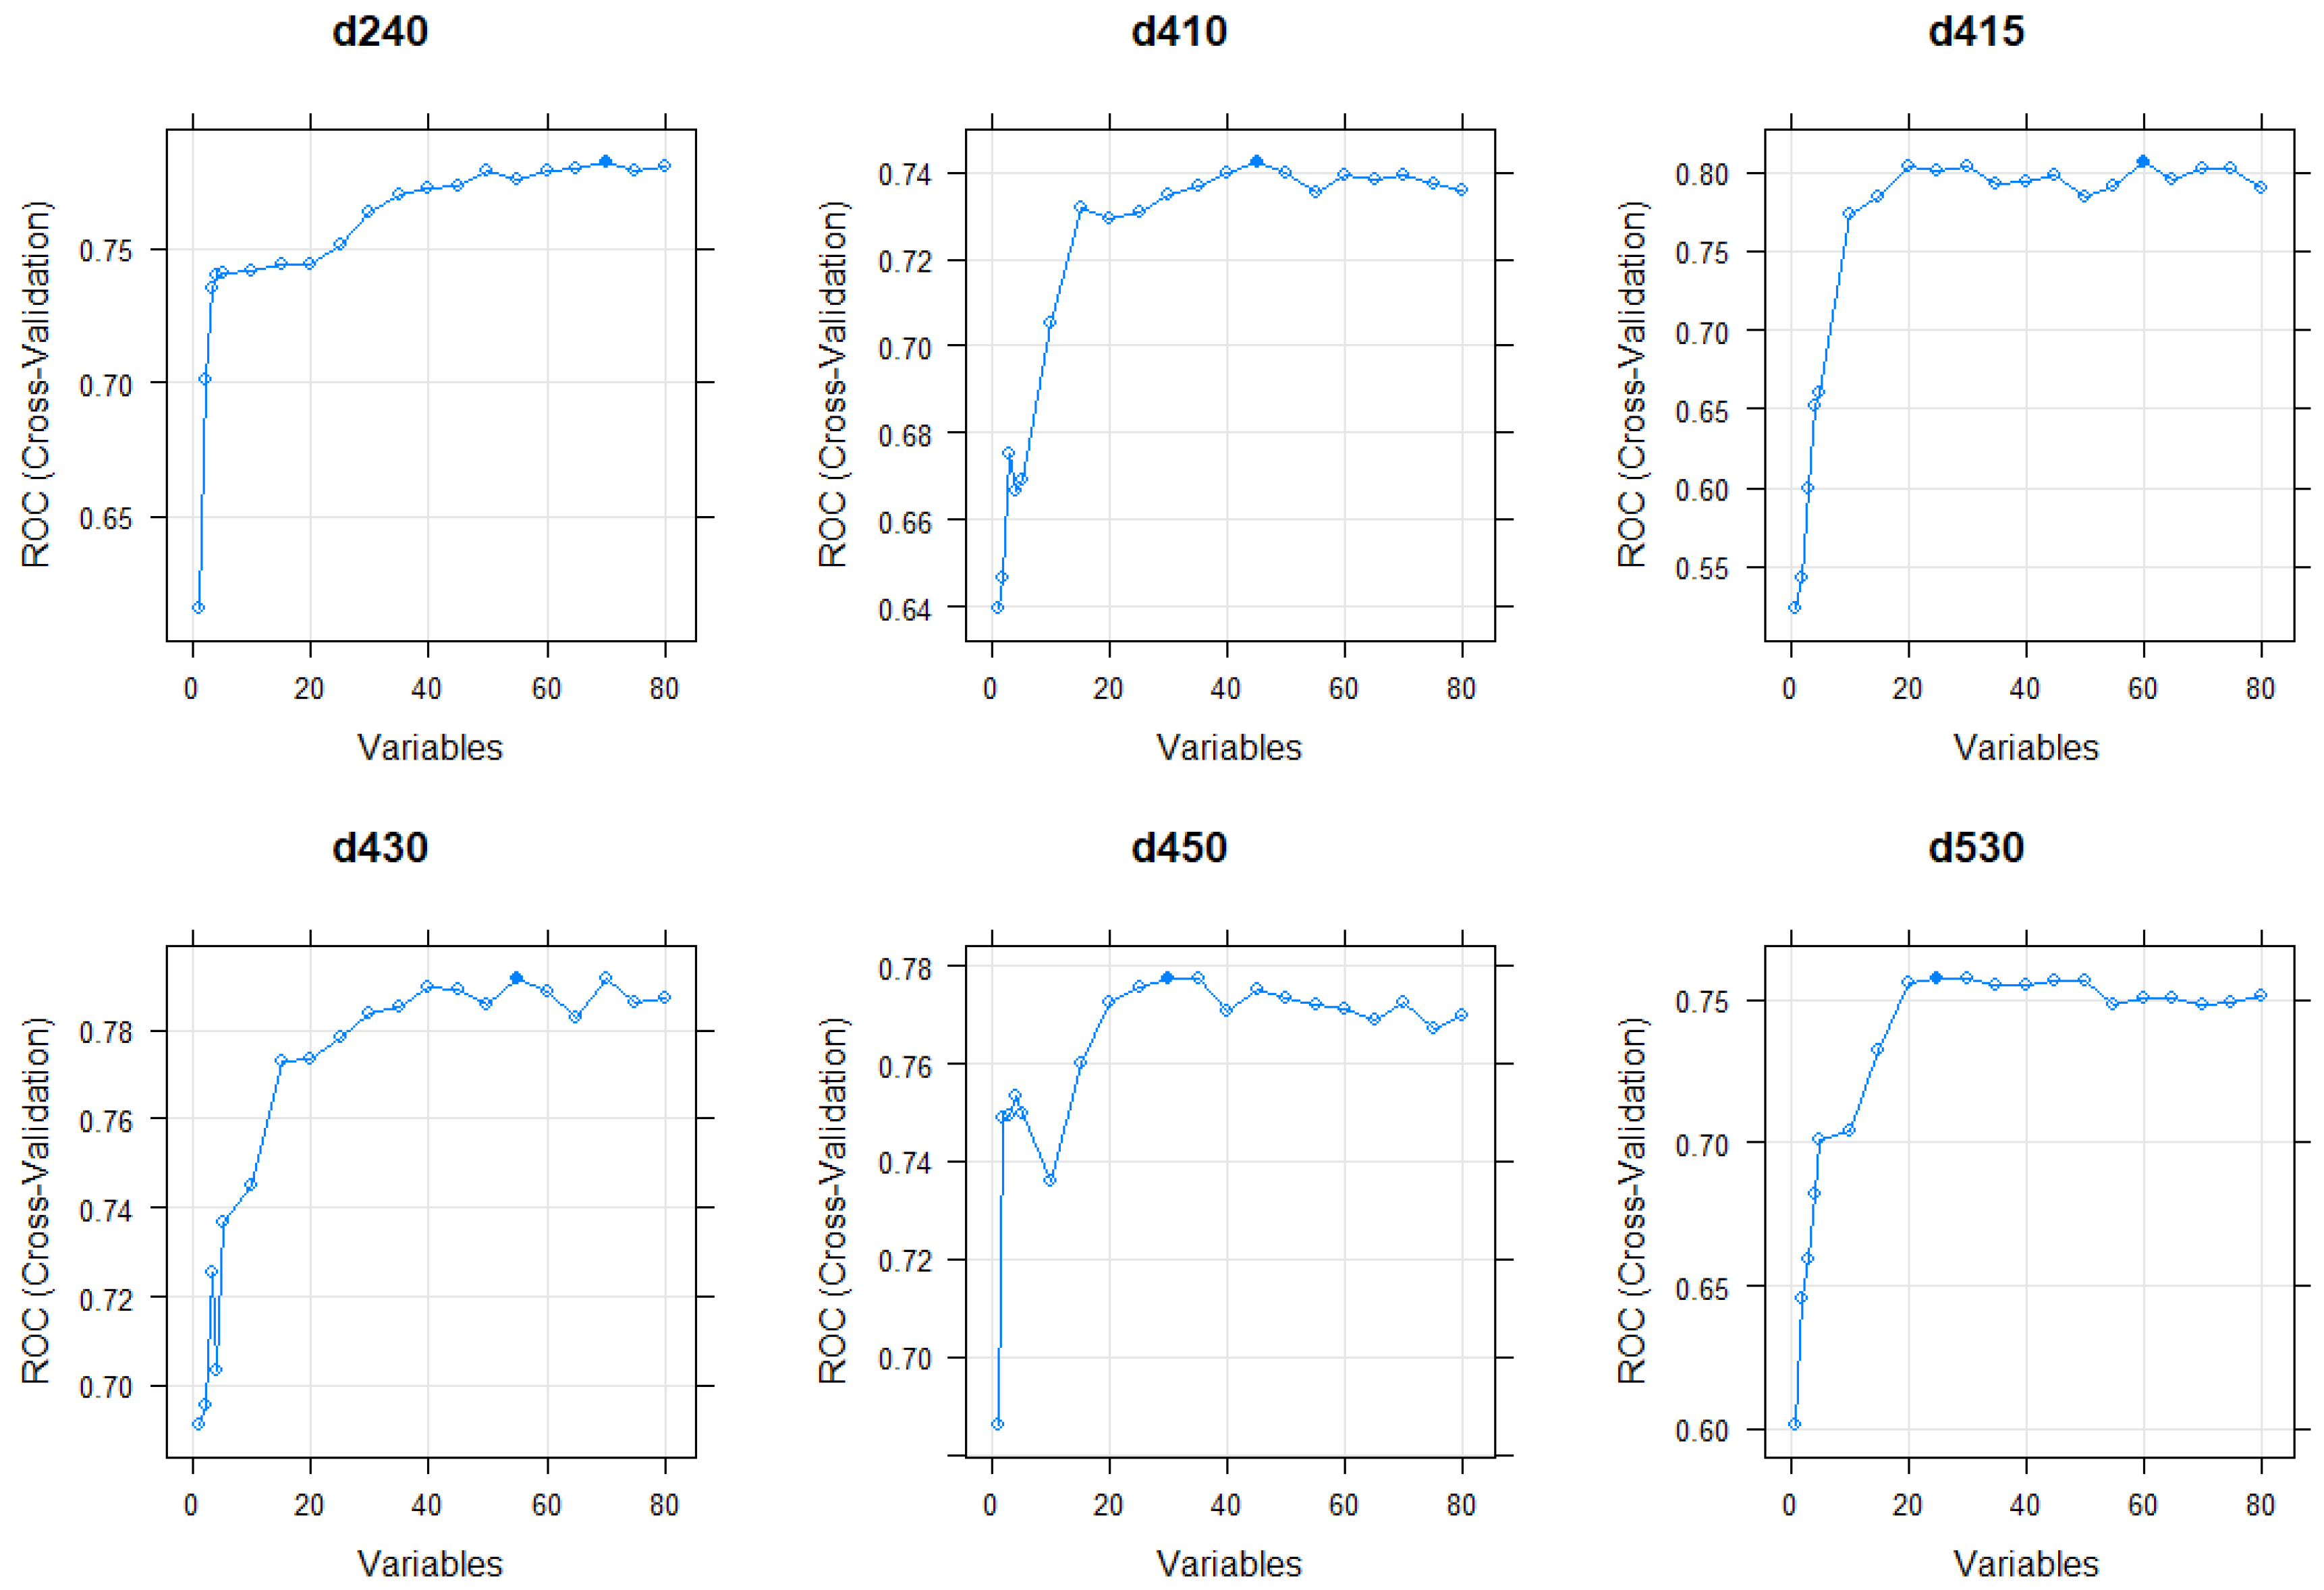
2.7. Reduction in PROM Items Based on Variable Importance Measures
2.8. Data Availability
3. Results
3.1. Performance of the Linking Methods
3.2. Reducing the Number of Items Utilized for the Linking Process
4. Discussion
- the modified RFs with and without feature extraction achieved fair to good accuracy and a consistently fair to good performance for all the 12 ICF core categories investigated with no major differences between each other. These modified ML linking methods performed better than a previously published one.
- A minimum data set of PROM items (24 items) that allowed for automatic linking to the WHO ICF activity/participation core categories for LBP at a performance that was similar to that of the full PROM data set was identified. Additionally, the automatic linking performance was only slightly decreased when a subset of 15 important PROM items was considered. The time required for patients’ to complete the questionnaires could be considerably reduced from 25 min for the full set to less than 10 min for the set of 24 items.
4.1. Influence of Class Imbalance within ICF Categories on RF Performance
4.2. Performance Problem with Work-Related ICF Categories
4.3. Increasing Feasibility of Linking Process by Finding a Minimal Set of PROMs
4.4. Performance of Novel ML Methods Compared to a Previously Published One
4.5. Clinical Implications
4.6. Limitations
5. Conclusions
Author Contributions
Funding
Institutional Review Board Statement
Informed Consent Statement
Data Availability Statement
Acknowledgments
Conflicts of Interest
List of Abbreviations:
| PROM | patient reported outcome measures |
| WHO | World Health Organization |
| ICF | International Classification of Functioning, Disability and Health |
| ML | machine learning |
| cLBP | chronic low back pain |
| LBP | low back pain |
| RF | random forest |
| ROC | receiver operating characteristic |
| AUC | area under the curve |
| VAS | Visual Analogue Scale |
| RMQ/RMDQ | Roland-Morris disability questionnaire |
| PDI | Pain Disability Index |
| EQ5D | European Quality of Life Questionnaire 5 Dimensions 5 Level Version |
| HADS | Hospital Anxiety and Depression Scale |
| AEQ | Avoidance endurance questionnaire |
| PPS | pain persistence behavior scale |
| START | Subgroups for Targeted Treatment Back Screening Tool |
| OOB | out of bag |
| CV | cross validation |
| RFE | recursive feature elimination |
| SPS-6 | Stanford Presenteeism Scale |
| SIMBO-C | screening instrument for the identification of extensive work-related problems in patients with chronic diseases |
References
- Cieza, A.; Hilfiker, R.; Boonen, A.; Chatterji, S.; Kostanjsek, N.; Ustun, B.T.; Stucki, G. Items from patient-oriented instruments can be integrated into interval scales to operationalize categories of the International Classification of Functioning, Disability and Health. J. Clin. Epidemiol. 2009, 62, 912–921.e3. [Google Scholar] [CrossRef]
- World Health Organization. IFC: International Classification of Functioning, Disability and Health; WHO: Geneva, Switzerland, 2001. [Google Scholar]
- Cieza, A.; Fayed, N.; Bickenbach, J.; Prodinger, B. Refinements of the ICF Linking Rules to strengthen their potential for establishing comparability of health information. Disabil. Rehabil. 2019, 41, 574–583. [Google Scholar] [CrossRef]
- Cieza, A.; Causey, K.; Kamenov, K.; Hanson, S.W.; Chatterji, S.; Vos, T. Global estimates of the need for rehabilitation based on the Global Burden of Disease study 2019: A systematic analysis for the Global Burden of Disease Study 2019. Lancet 2021, 396, 2006–2017. [Google Scholar] [CrossRef]
- Cieza, A.; Geyh, S.; Chatterji, S.; Kostanjsek, N.; Ustun, B.T.; Stucki, G. Identification of candidate categories of the International Classification of Functioning Disability and Health (ICF) for a Generic ICF Core Set based on regression modelling. BMC Med. Res. Methodol. 2006, 6, 36. [Google Scholar] [CrossRef]
- Cieza, A.; Brockow, T.; Ewert, T.; Amman, E.; Kollerits, B.; Chatterji, S.; Ustun, T.B.; Stucki, G. Linking health-status measurements to the international classification of functioning, disability and health. J. Rehabil. Med. 2002, 34, 205–210. [Google Scholar] [CrossRef]
- Cieza, A.; Geyh, S.; Chatterji, S.; Kostanjsek, N.; Ustun, B.; Stucki, G. ICF linking rules: An update based on lessons learned. J. Rehabil. Med. 2005, 37, 212–218. [Google Scholar] [CrossRef]
- Tuechler, K.; Fehrmann, E.; Kienbacher, T.; Mair, P.; Fischer-Grote, L.; Ebenbichler, G. Mapping patient reported outcome measures for low back pain to the International Classification of Functioning, Disability and Health using random forests. Eur. J. Phys. Rehabil. Med. 2020, 56, 286–296. [Google Scholar] [CrossRef]
- Prodinger, B.; Tennant, A.; Stucki, G. Standardized reporting of functioning information on ICF-based common metrics. Eur. J. Phys. Rehabil. Med. 2018, 54, 110–117. [Google Scholar] [CrossRef] [PubMed]
- Prodinger, B.; Stucki, G.; Coenen, M.; Tennant, A. The measurement of functioning using the International Classification of Functioning, Disability and Health: Comparing qualifier ratings with existing health status instruments. Disabil. Rehabil. 2019, 41, 541–548. [Google Scholar] [CrossRef]
- O’Reilly-Shah, V.N. Factors influencing healthcare provider respondent fatigue answering a globally administered in-app survey. PeerJ 2017, 5, e3785. [Google Scholar] [CrossRef]
- Knop, C.; Oeser, M.; Bastian, L.; Lange, U.; Zdichavsky, M.; Blauth, M. Development and validation of the visual analogue scale (VAS) spine score. Der Unfallchirurg 2001, 104, 488–497. [Google Scholar] [CrossRef]
- Roland, M.; Morris, R. A study of the natural history of back pain. Part I: Development of a reliable and sensitive measure of disability in low-back pain. Spine 1983, 8, 141–144. [Google Scholar] [CrossRef] [PubMed]
- Roland, M.; Fairbank, J. The Roland-Morris Disability Questionnaire and the Oswestry Disability Questionnaire. Spine 2000, 25, 3115–3124. [Google Scholar] [CrossRef]
- Sigl, T.; Cieza, A.; Brockow, T.; Chatterji, S.; Kostanjsek, N.; Stucki, G. Content comparison of low back pain-specific measures based on the International Classification of Functioning, Disability and Health (ICF). Clin. J. Pain 2006, 22, 147–153. [Google Scholar] [CrossRef]
- Wang, P.; Zhang, J.; Liao, W.; Zhao, L.; Guo, Y.; Qiu, Z.; Yue, G. Content comparison of questionnaires and scales used in low back pain based on the international classification of functioning, disability and health: A systematic review. Disabil. Rehabil. 2012, 34, 1167–1177. [Google Scholar] [CrossRef] [PubMed]
- Chapman, J.R.; Norvell, D.C.; Hermsmeyer, J.T.; Bransford, R.J.; DeVine, J.; McGirt, M.J.; Lee, M.J. Evaluating common outcomes for measuring treatment success for chronic low back pain. Spine 2011, 36, S54–S68. [Google Scholar] [CrossRef]
- Pollard, C.A. Preliminary validity study of the pain disability index. Percept. Mot. Ski. 1984, 59, 974. [Google Scholar] [CrossRef] [PubMed]
- Herdman, M.; Gudex, C.; Lloyd, A.; Janssen, M.; Kind, P.; Parkin, D.; Bonsel, G.; Badia, X. Development and preliminary testing of the new five-level version of EQ-5D (EQ-5D-5L). Qual. Life Res. 2011, 20, 1727–1736. [Google Scholar] [CrossRef] [PubMed]
- Zigmond, A.S.; Snaith, R.P. The hospital anxiety and depression scale. Acta Psychiatr. Scand. 1983, 67, 361–370. [Google Scholar] [CrossRef]
- Hasenbring, M.I.; Hallner, D.; Rusu, A.C. Fear-avoidance- and endurance-related responses to pain: Development and validation of the Avoidance-Endurance Questionnaire (AEQ). Eur. J. Pain 2009, 13, 620–628. [Google Scholar] [CrossRef]
- Hill, J.C.; Dunn, K.M.; Lewis, M.; Mullis, R.; Main, C.J.; Foster, N.E.; Hay, E.M. A primary care back pain screening tool: Identifying patient subgroups for initial treatment. Arthritis Rheum. 2008, 59, 632–641. [Google Scholar] [CrossRef]
- Karstens, S.; Krug, K.; Hill, J.C.; Stock, C.; Steinhaeuser, J.; Szecsenyi, J.; Joos, S. Validation of the German version of the STarT-Back Tool (STarT-G): A cohort study with patients from primary care practices. BMC Musculoskelet. Disord. 2015, 16, 346. [Google Scholar] [CrossRef] [PubMed]
- R Core Team. R: A Language and Environment for Statistical Computing. Available online: https://www.R-project.org/ (accessed on 9 May 2023).
- Wickham, H.; Chang, W.; Wickham, M.H. Package ‘ggplot2’: Create Elegant Data Visualisations Using the Grammar of Graphics; Stata Software Package: College Station, TX, USA, 2016; Volume 2, pp. 1–189. [Google Scholar]
- Kalisch, M.; Fellinghauer, B.A.; Grill, E.; Maathuis, M.H.; Mansmann, U.; Buhlmann, P.; Stucki, G. Understanding human functioning using graphical models. BMC Med. Res. Methodol. 2010, 10, 14. [Google Scholar] [CrossRef]
- Paanalahti, M.; Berzina, G.; Lundgren-Nilsson, A.; Arndt, T.; Sunnerhagen, K.S. Examination of the relevance of the ICF cores set for stroke by comparing with the Stroke Impact Scale. Disabil. Rehabil. 2019, 41, 508–513. [Google Scholar] [CrossRef]
- Kuhn, M.; Johnson, K. Applied Predictive Modeling; Springer: Berlin/Heidelberg, Germany, 2013; Volume 26. [Google Scholar]
- Emmanuel, T.; Maupong, T.; Mpoeleng, D.; Semong, T.; Mphago, B.; Tabona, O. A survey on missing data in machine learning. J. Big Data 2021, 8, 140. [Google Scholar] [CrossRef]
- Kowarik, A.; Templ, M. Imputation with the R Package VIM. J. Stat. Softw. 2016, 74, 1–16. [Google Scholar] [CrossRef]
- Breiman, L. Classification and Regression Trees; Routledge: Abingdon, UK, 2017. [Google Scholar]
- Breiman, L. Random forests. Mach. Learn. 2001, 45, 5–32. [Google Scholar] [CrossRef]
- Sarica, A.; Cerasa, A.; Quattrone, A. Random forest algorithm for the classification of neuroimaging data in Alzheimer’s disease: A systematic review. Front. Aging Neurosci. 2017, 9, 329. [Google Scholar] [CrossRef]
- Schonlau, M.; Zou, R.Y. The random forest algorithm for statistical learning. Stata J. 2020, 20, 3–29. [Google Scholar] [CrossRef]
- Liaw, A.; Wiener, M. Classification and regression by randomForest. R News 2002, 2, 18–22. [Google Scholar]
- Strobl, C.; Hothorn, T.; Zeileis, A. Party on! Department of Statistics University of Munich, GER: Munich, Germany, 2009; Volume 50. [Google Scholar]
- Altman, D.G.; Bland, J.M. Diagnostic tests 3: Receiver operating characteristic plots. BMJ Br. Med. J. 1994, 309, 188. [Google Scholar] [CrossRef]
- Kuhn, M. Caret: Classification and Regression Training, Version 6.0-90; R Package. 2021. Available online: https://cran.r-project.org/web/packages/caret/ (accessed on 13 June 2023).
- Hanley, J.A.; McNeil, B.J. The meaning and use of the area under a receiver operating characteristic (ROC) curve. Radiology 1982, 143, 29–36. [Google Scholar] [CrossRef]
- Metz, C.E. Basic principles of ROC analysis. Semin. Nucl. Med. 1978, 8, 283–298. [Google Scholar] [CrossRef] [PubMed]
- Cohen, J. A coefficient of agreement for nominal scales. Educ. Psychol. Meas. 1960, 20, 37–46. [Google Scholar] [CrossRef]
- Viera, A.J.; Garrett, J.M. Understanding interobserver agreement: The kappa statistic. Fam. Med. 2005, 37, 360–363. [Google Scholar] [PubMed]
- Guyon, I.; Weston, J.; Barnhill, S.; Vapnik, V. Gene selection for cancer classification using support vector machines. Mach. Learn. 2002, 46, 389–422. [Google Scholar] [CrossRef]
- Sculley, D.; Holt, G.; Golovin, D.; Davydov, E.; Phillips, T.; Ebner, D.; Chaudhary, V.; Young, M.; Crespo, J.-F.; Dennison, D. Hidden technical debt in machine learning systems. In Proceedings of the Advances in Neural Information Processing Systems 28, Montreal, QC, Canada, 7–12 December 2015. [Google Scholar]
- Lipton, Z.C. The mythos of model interpretability: In machine learning, the concept of interpretability is both important and slippery. Queue 2018, 16, 31–57. [Google Scholar] [CrossRef]
- Fehrmann, E.; Kotulla, S.; Fischer, L.; Kienbacher, T.; Tuechler, K.; Mair, P.; Ebenbichler, G.; Paul, B. The impact of age and gender on the ICF-based assessment of chronic low back pain. Disabil. Rehabil. 2019, 41, 1190–1199. [Google Scholar] [CrossRef]
- Jonsdottir, J.; Rainero, G.; Racca, V.; Glassel, A.; Cieza, A. Functioning and disability in persons with low back pain. Disabil. Rehabil. 2010, 32 (Suppl. 1), S78–S84. [Google Scholar] [CrossRef]
- Ewert, T.; Fuessl, M.; Cieza, A.; Andersen, C.; Chatterji, S.; Kostanjsek, N.; Stucki, G. Identification of the most common patient problems in patients with chronic conditions using the ICF checklist. J. Rehabil. Med. 2004, 44 Suppl, 22–29. [Google Scholar] [CrossRef]
- Santos, M.S.; Soares, J.P.; Abreu, P.H.; Araujo, H.; Santos, J. Cross-validation for imbalanced datasets: Avoiding overoptimistic and overfitting approaches [research frontier]. IEEE Comput. Intell. Mag. 2018, 13, 59–76. [Google Scholar] [CrossRef]
- Misra, P.; Yadav, A.S. Improving the classification accuracy using recursive feature elimination with cross-validation. Int. J. Emerg. Technol. 2020, 11, 659–665. [Google Scholar]
- Delgado, R.; Tibau, X.-A. Why Cohen’s Kappa should be avoided as performance measure in classification. PLoS ONE 2019, 14, e0222916. [Google Scholar] [CrossRef] [PubMed]
- Feinstein, A.R.; Cicchetti, D.V. High agreement but low kappa: I. The problems of two paradoxes. J. Clin. Epidemiol. 1990, 43, 543–549. [Google Scholar] [CrossRef]
- Cicchetti, D.V.; Feinstein, A.R. High agreement but low kappa: II. Resolving the paradoxes. J. Clin. Epidemiol. 1990, 43, 551–558. [Google Scholar] [CrossRef] [PubMed]
- Lalkhen, A.G.; McCluskey, A. Clinical tests: Sensitivity and specificity. Contin. Educ. Anaesth. Crit. Care Pain 2008, 8, 221–223. [Google Scholar] [CrossRef]
- Herman, C. What makes a screening exam “good”? AMA J. Ethics 2006, 8, 34–37. [Google Scholar]
- Thai-Nghe, N.; Gantner, Z.; Schmidt-Thieme, L. Cost-sensitive learning methods for imbalanced data. In Proceedings of the The 2010 International Joint Conference on Neural Networks (IJCNN), Barcelona, Spain, 18–23 July 2010; pp. 1–8. [Google Scholar]
- Koopman, C.; Pelletier, K.R.; Murray, J.F.; Sharda, C.E.; Berger, M.L.; Turpin, R.S.; Hackleman, P.; Gibson, P.; Holmes, D.M.; Bendel, T. Stanford presenteeism scale: Health status and employee productivity. J. Occup. Environ. Med. 2002, 4, 14–20. [Google Scholar] [CrossRef] [PubMed]
- Streibelt, M.; Gerwinn, H.; Hansmeier, T.; Thren, K.; Müller-Fahrnow, W. SIMBO: Ein Screening-Instrument zur Feststellung des Bedarfs an Medizinisch-Beruflich Orientierten Maßnahmen in der medizinischen Rehabilitation-Analysen zur Konstruktvalidität und Prognosegüte. Die Rehabil. 2007, 46, 266–275. [Google Scholar] [CrossRef]
- Cieza, A.; Stucki, G.; Weigl, M.; Disler, P.; Jackel, W.; van der Linden, S.; Kostanjsek, N.; de Bie, R. ICF Core Sets for low back pain. J. Rehabil. Med. 2004, 36, 69–74. [Google Scholar] [CrossRef]
- Heerkens, Y.F.; de Brouwer, C.P.; Engels, J.A.; van der Gulden, J.W.; Kant, I. Elaboration of the contextual factors of the ICF for occupational health care. Work 2017, 57, 187–204. [Google Scholar] [CrossRef] [PubMed]
- Jeon, H.; Oh, S. Hybrid-recursive feature elimination for efficient feature selection. Appl. Sci. 2020, 10, 3211. [Google Scholar] [CrossRef]
- Han, S.; Williamson, B.D.; Fong, Y. Improving random forest predictions in small datasets from two-phase sampling designs. BMC Med. Inform. Decis. Mak. 2021, 21, 322. [Google Scholar] [CrossRef]
- Frontera, W.; Gimigliano, F.; Melvin, J.; Li, J.; Li, L.; Lains, J.; Stucki, G. ClinFIT: ISPRM’s Universal Functioning Information Tool based on the WHO’s ICF. J. Int. Soc. Phys. Rehabil. Med. 2019, 2, 19–21. [Google Scholar] [CrossRef]
- Ghassemi, M.; Naumann, T.; Schulam, P.; Beam, A.L.; Chen, I.Y.; Ranganath, R. A review of challenges and opportunities in machine learning for health. AMIA Summits Transl. Sci. Proc. 2020, 2020, 191–200. [Google Scholar]
- Sahiner, B.; Pezeshk, A.; Hadjiiski, L.M.; Wang, X.; Drukker, K.; Cha, K.H.; Summers, R.M.; Giger, M.L. Deep learning in medical imaging and radiation therapy. Med. Phys. 2019, 46, e1–e36. [Google Scholar] [CrossRef] [PubMed]
- Goodrich, M.T.; Tamassia, R.; Goldwasser, M.H. Data Structures and Algorithms in Python; Wiley: Hoboken, NJ, USA, 2013. [Google Scholar]


| Mean (SE) or N (%) * | |
|---|---|
| n | 805 |
| Female | 494 (61%) |
| Age (years) | 48.8 (0.42) |
| BMI (kg/m2) | 27.1 (0.2) |
| Pain (VAS) | 42.61 (0.91) |
| AEQ PPS | 3.35 (0.04) |
| RMQ | 5.63 (0.17) |
| PDI | 22.00 (0.56) |
| EQ5D score | 0.76 (0.01) |
| EQ5D VAS | 64.75 (0.72) |
| HADS depression | 4.93 (0.15) |
| HADS anxiety | 6.34 (0.15) |
| START group | low risk 114 (14%) medium risk 532 (66%) high risk 91 (11%) |
| Education | university degree 157 (20%) high school degree 213 (26%) professional training 325 (40%) primary school 98 (12%) |
| Marital status | single 117 (15%) partnership 116 (14%) married 418 (52%) divorced/widowed 135 (17%) |
| Employment status | employed 542 (67%) self-employed 11 (1%) retired 64 (8%) student 16 (2%) unemployed 146 (18%) other 15 (2%) |
| ICF Category | Random Forest | Random Forest with Feature Selection | ||||||||||||
|---|---|---|---|---|---|---|---|---|---|---|---|---|---|---|
| AUC | SEN | SPE | PRE | F1 | ACC | K | AUC | SEN | SPE | PRE | F1 | ACC | K | |
| d240 | 0.78 | 0.59 | 0.80 | 0.68 | 0.63 | 0.71 | 0.40 | 0.78 | 0.60 | 0.79 | 0.68 | 0.63 | 0.71 | 0.41 |
| d410 | 0.76 | 0.30 | 0.93 | 0.67 | 0.41 | 0.75 | 0.28 | 0.77 | 0.31 | 0.93 | 0.66 | 0.41 | 0.75 | 0.29 |
| d415 | 0.80 | 0.09 | 0.99 | 0.83 | 0.30 | 0.91 | 0.14 | 0.81 | 0.08 | 0.99 | 0.83 | 0.27 | 0.91 | 0.10 |
| d430 | 0.80 | 0.11 | 0.98 | 0.53 | 0.19 | 0.82 | 0.12 | 0.81 | 0.14 | 0.98 | 0.61 | 0.22 | 0.83 | 0.10 |
| d450 | 0.77 | 0.72 | 0.68 | 0.71 | 0.71 | 0.70 | 0.41 | 0.78 | 0.74 | 0.65 | 0.69 | 0.71 | 0.70 | 0.39 |
| d530 | 0.76 | 0.97 | 0.15 | 0.82 | 0.89 | 0.81 | 0.17 | 0.78 | 0.97 | 0.20 | 0.83 | 0.90 | 0.82 | 0.18 |
| d540 | 0.81 | 0.84 | 0.66 | 0.76 | 0.79 | 0.76 | 0.50 | 0.81 | 0.84 | 0.66 | 0.75 | 0.79 | 0.76 | 0.50 |
| d640 | 0.81 | 0.55 | 0.86 | 0.69 | 0.61 | 0.75 | 0.43 | 0.81 | 0.57 | 0.87 | 0.70 | 0.63 | 0.76 | 0.44 |
| d760 | 0.74 | 0.96 | 0.13 | 0.78 | 0.86 | 0.76 | 0.12 | 0.74 | 0.96 | 0.13 | 0.78 | 0.86 | 0.76 | 0.15 |
| d845 | 0.75 | 0.85 | 0.41 | 0.73 | 0.78 | 0.69 | 0.28 | 0.75 | 0.86 | 0.39 | 0.73 | 0.78 | 0.69 | 0.25 |
| d850 | 0.73 | 0.19 | 0.95 | 0.65 | 0.28 | 0.75 | 0.18 | 0.74 | 0.19 | 0.96 | 0.68 | 0.28 | 0.75 | 0.19 |
| d859 | 0.73 | 0.36 | 0.89 | 0.63 | 0.45 | 0.71 | 0.28 | 0.73 | 0.36 | 0.90 | 0.64 | 0.45 | 0.71 | 0.28 |
| ICF | All Variables, Cutoff: Pain > 30 * | All Variables, Cutoff: Pain > 40 * | Tuechler et al., 2020 [8]: Old Algorithm | |||||||||
|---|---|---|---|---|---|---|---|---|---|---|---|---|
| 80 Items n = 545 | 80 Items n = 438 | New Dataset, 32 Items n = 809 | Old ** Dataset, 32 Items n = 448 | |||||||||
| AUC | SEN | SPE | K | AUC | SEN | SPE | K | AUC | K | AUC | K | |
| d240 | 0.75 | 0.44 | 0.87 | 0.34 | 0.74 | 0.32 | 0.92 | 0.27 | 0.64 | 0.30 | 0.70 | 0.30 |
| d410 | 0.69 | 0.06 | 0.99 | 0.06 | 0.71 | 0.09 | 0.97 | 0.09 | 0.72 | 0.32 | 0.75 | 0.37 |
| d415 | 0.78 | 0.07 | 0.99 | 0.09 | 0.72 | 0.01 | 0.99 | 0.01 | 0.76 | 0.23 | 0.72 | 0.40 |
| d430 | 0.77 | 0.01 | 0.99 | 0.01 | 0.79 | 0.01 | 0.99 | 0.01 | 0.73 | 0.30 | 0.73 | 0.29 |
| d450 | 0.75 | 0.56 | 0.76 | 0.33 | 0.75 | 0.52 | 0.79 | 0.32 | 0.72 | 0.38 | 0.78 | 0.40 |
| d530 | 0.75 | 0.94 | 0.20 | 0.17 | 0.72 | 0.96 | 0.12 | 0.11 | - | - | - | - |
| d540 | 0.80 | 0.76 | 0.71 | 0.47 | 0.80 | 0.64 | 0.76 | 0.40 | 0.79 | 0.39 | 0.87 | 0.55 |
| d640 | 0.82 | 0.41 | 0.93 | 0.39 | 0.80 | 0.30 | 0.94 | 0.28 | 0.75 | 0.36 | 0.71 | 0.34 |
| d760 | 0.74 | 0.94 | 0.24 | 0.21 | 0.75 | 0.93 | 0.25 | 0.22 | 0.70 | 0.31 | 0.67 | 0.12 |
| d845 | 0.68 | 0.78 | 0.38 | 0.17 | 0.68 | 0.81 | 0.37 | 0.18 | 0.69 | 0.31 | 0.79 | 0.27 |
| d850 | 0.77 | 0.11 | 0.97 | 0.11 | 0.76 | 0.10 | 0.99 | 0.11 | 0.67 | 0.22 | 0.69 | 0.16 |
| d859 | 0.70 | 0.17 | 0.95 | 0.15 | 0.71 | 0.16 | 0.96 | 0.16 | 0.65 | 0.31 | 0.61 | 0.20 |
| ICF Category | Predicted Condition | ICF Category | Predicted Condition | ||||||
|---|---|---|---|---|---|---|---|---|---|
| imp. | Not imp. | imp. | Not imp. | ||||||
| d240 | Actual condition | impaired | 195 | 131 | d410 | Actual condition | impaired | 70 | 154 |
| not imp. | 100 | 361 | not imp. | 44 | 519 | ||||
| d415 | impaired | 5 | 74 | d430 | impaired | 18 | 122 | ||
| not imp. | 1 | 704 | not imp. | 17 | 625 | ||||
| d450 | impaired | 291 | 108 | d530 | impaired | 612 | 20 | ||
| not imp. | 126 | 261 | not imp. | 130 | 24 | ||||
| d540 | impaired | 368 | 68 | d640 | impaired | 155 | 118 | ||
| not imp. | 130 | 24 | not imp. | 64 | 442 | ||||
| d760 | impaired | 565 | 27 | d845 | impaired | 390 | 69 | ||
| not imp. | 159 | 28 | not imp. | 149 | 95 | ||||
| d850 | impaired | 32 | 131 | d859 | impaired | 77 | 154 | ||
| not imp. | 20 | 423 | not imp. | 45 | 413 | ||||
| ICF Category | Age; VAS; PDI 1–5; RMDQ 9,16,17,21; EQ5D 1,3; EQ5D VAS; AEQ 1–7; HADS 1,2,13 = 24 Items | Age; VAS; PDI 2–4; RMDQ 9,16,17,21; EQ5D 1,3; EQ5D VAS; HADS 1,2,13 = 15 Items | ||||||||||||
|---|---|---|---|---|---|---|---|---|---|---|---|---|---|---|
| AUC | SEN | SPE | PRE | F1 | ACC | K | AUC | SEN | SPE | PRE | F1 | ACC | K | |
| d240 | 0.78 | 0.59 | 0.82 | 0.70 | 0.64 | 0.72 | 0.42 | 0.76 | 0.58 | 0.79 | 0.67 | 0.62 | 0.70 | 0.38 |
| d410 | 0.74 | 0.28 | 0.94 | 0.66 | 0.38 | 0.75 | 0.25 | 0.73 | 0.32 | 0.91 | 0.60 | 0.41 | 0.74 | 0.27 |
| d415 | 0.77 | 0.05 | 0.99 | 0.75 | 0.30 | 0.90 | 0.08 | 0.73 | 0.05 | 0.99 | 0.60 | 0.30 | 0.90 | 0.08 |
| d430 | 0.79 | 0.18 | 0.98 | 0.71 | 0.27 | 0.84 | 0.22 | 0.79 | 0.17 | 0.97 | 0.56 | 0.25 | 0.82 | 0.19 |
| d450 | 0.76 | 0.73 | 0.68 | 0.71 | 0.72 | 0.71 | 0.41 | 0.75 | 0.73 | 0.69 | 0.71 | 0.72 | 0.71 | 0.42 |
| d530 | 0.75 | 0.98 | 0.12 | 0.82 | 0.89 | 0.81 | 0.14 | 0.75 | 0.97 | 0.15 | 0.82 | 0.89 | 0.81 | 0.16 |
| d540 | 0.78 | 0.85 | 0.60 | 0.73 | 0.78 | 0.74 | 0.46 | 0.78 | 0.86 | 0.58 | 0.72 | 0.78 | 0.73 | 0.45 |
| d640 | 0.81 | 0.57 | 0.86 | 0.69 | 0.63 | 0.76 | 0.45 | 0.82 | 0.56 | 0.86 | 0.71 | 0.62 | 0.76 | 0.44 |
| d760 | 0.71 | 0.96 | 0.11 | 0.77 | 0.86 | 0.75 | 0.09 | 0.71 | 0.94 | 0.15 | 0.78 | 0.85 | 0.75 | 0.12 |
| d845 | 0.75 | 0.86 | 0.40 | 0.73 | 0.79 | 0.70 | 0.29 | 0.73 | 0.85 | 0.39 | 0.72 | 0.78 | 0.69 | 0.26 |
| d850 | 0.74 | 0.17 | 0.96 | 0.69 | 0.25 | 0.75 | 0.17 | 0.74 | 0.20 | 0.97 | 0.77 | 0.31 | 0.76 | 0.22 |
| d859 | 0.72 | 0.38 | 0.88 | 0.63 | 0.47 | 0.71 | 0.29 | 0.72 | 0.39 | 0.88 | 0.64 | 0.48 | 0.72 | 0.30 |
Disclaimer/Publisher’s Note: The statements, opinions and data contained in all publications are solely those of the individual author(s) and contributor(s) and not of MDPI and/or the editor(s). MDPI and/or the editor(s) disclaim responsibility for any injury to people or property resulting from any ideas, methods, instructions or products referred to in the content. |
© 2023 by the authors. Licensee MDPI, Basel, Switzerland. This article is an open access article distributed under the terms and conditions of the Creative Commons Attribution (CC BY) license (https://creativecommons.org/licenses/by/4.0/).
Share and Cite
Habenicht, R.; Fehrmann, E.; Blohm, P.; Ebenbichler, G.; Fischer-Grote, L.; Kollmitzer, J.; Mair, P.; Kienbacher, T. Machine Learning Based Linking of Patient Reported Outcome Measures to WHO International Classification of Functioning, Disability, and Health Activity/Participation Categories. J. Clin. Med. 2023, 12, 5609. https://doi.org/10.3390/jcm12175609
Habenicht R, Fehrmann E, Blohm P, Ebenbichler G, Fischer-Grote L, Kollmitzer J, Mair P, Kienbacher T. Machine Learning Based Linking of Patient Reported Outcome Measures to WHO International Classification of Functioning, Disability, and Health Activity/Participation Categories. Journal of Clinical Medicine. 2023; 12(17):5609. https://doi.org/10.3390/jcm12175609
Chicago/Turabian StyleHabenicht, Richard, Elisabeth Fehrmann, Peter Blohm, Gerold Ebenbichler, Linda Fischer-Grote, Josef Kollmitzer, Patrick Mair, and Thomas Kienbacher. 2023. "Machine Learning Based Linking of Patient Reported Outcome Measures to WHO International Classification of Functioning, Disability, and Health Activity/Participation Categories" Journal of Clinical Medicine 12, no. 17: 5609. https://doi.org/10.3390/jcm12175609
APA StyleHabenicht, R., Fehrmann, E., Blohm, P., Ebenbichler, G., Fischer-Grote, L., Kollmitzer, J., Mair, P., & Kienbacher, T. (2023). Machine Learning Based Linking of Patient Reported Outcome Measures to WHO International Classification of Functioning, Disability, and Health Activity/Participation Categories. Journal of Clinical Medicine, 12(17), 5609. https://doi.org/10.3390/jcm12175609