


Is Corticalization in Radiographs Related to a Higher Risk of Bone Loss around Dental Implants in Smoking Patients? A 5-Year Observation of Radiograph Bone-Texture Changes


Abstract
:1. Introduction
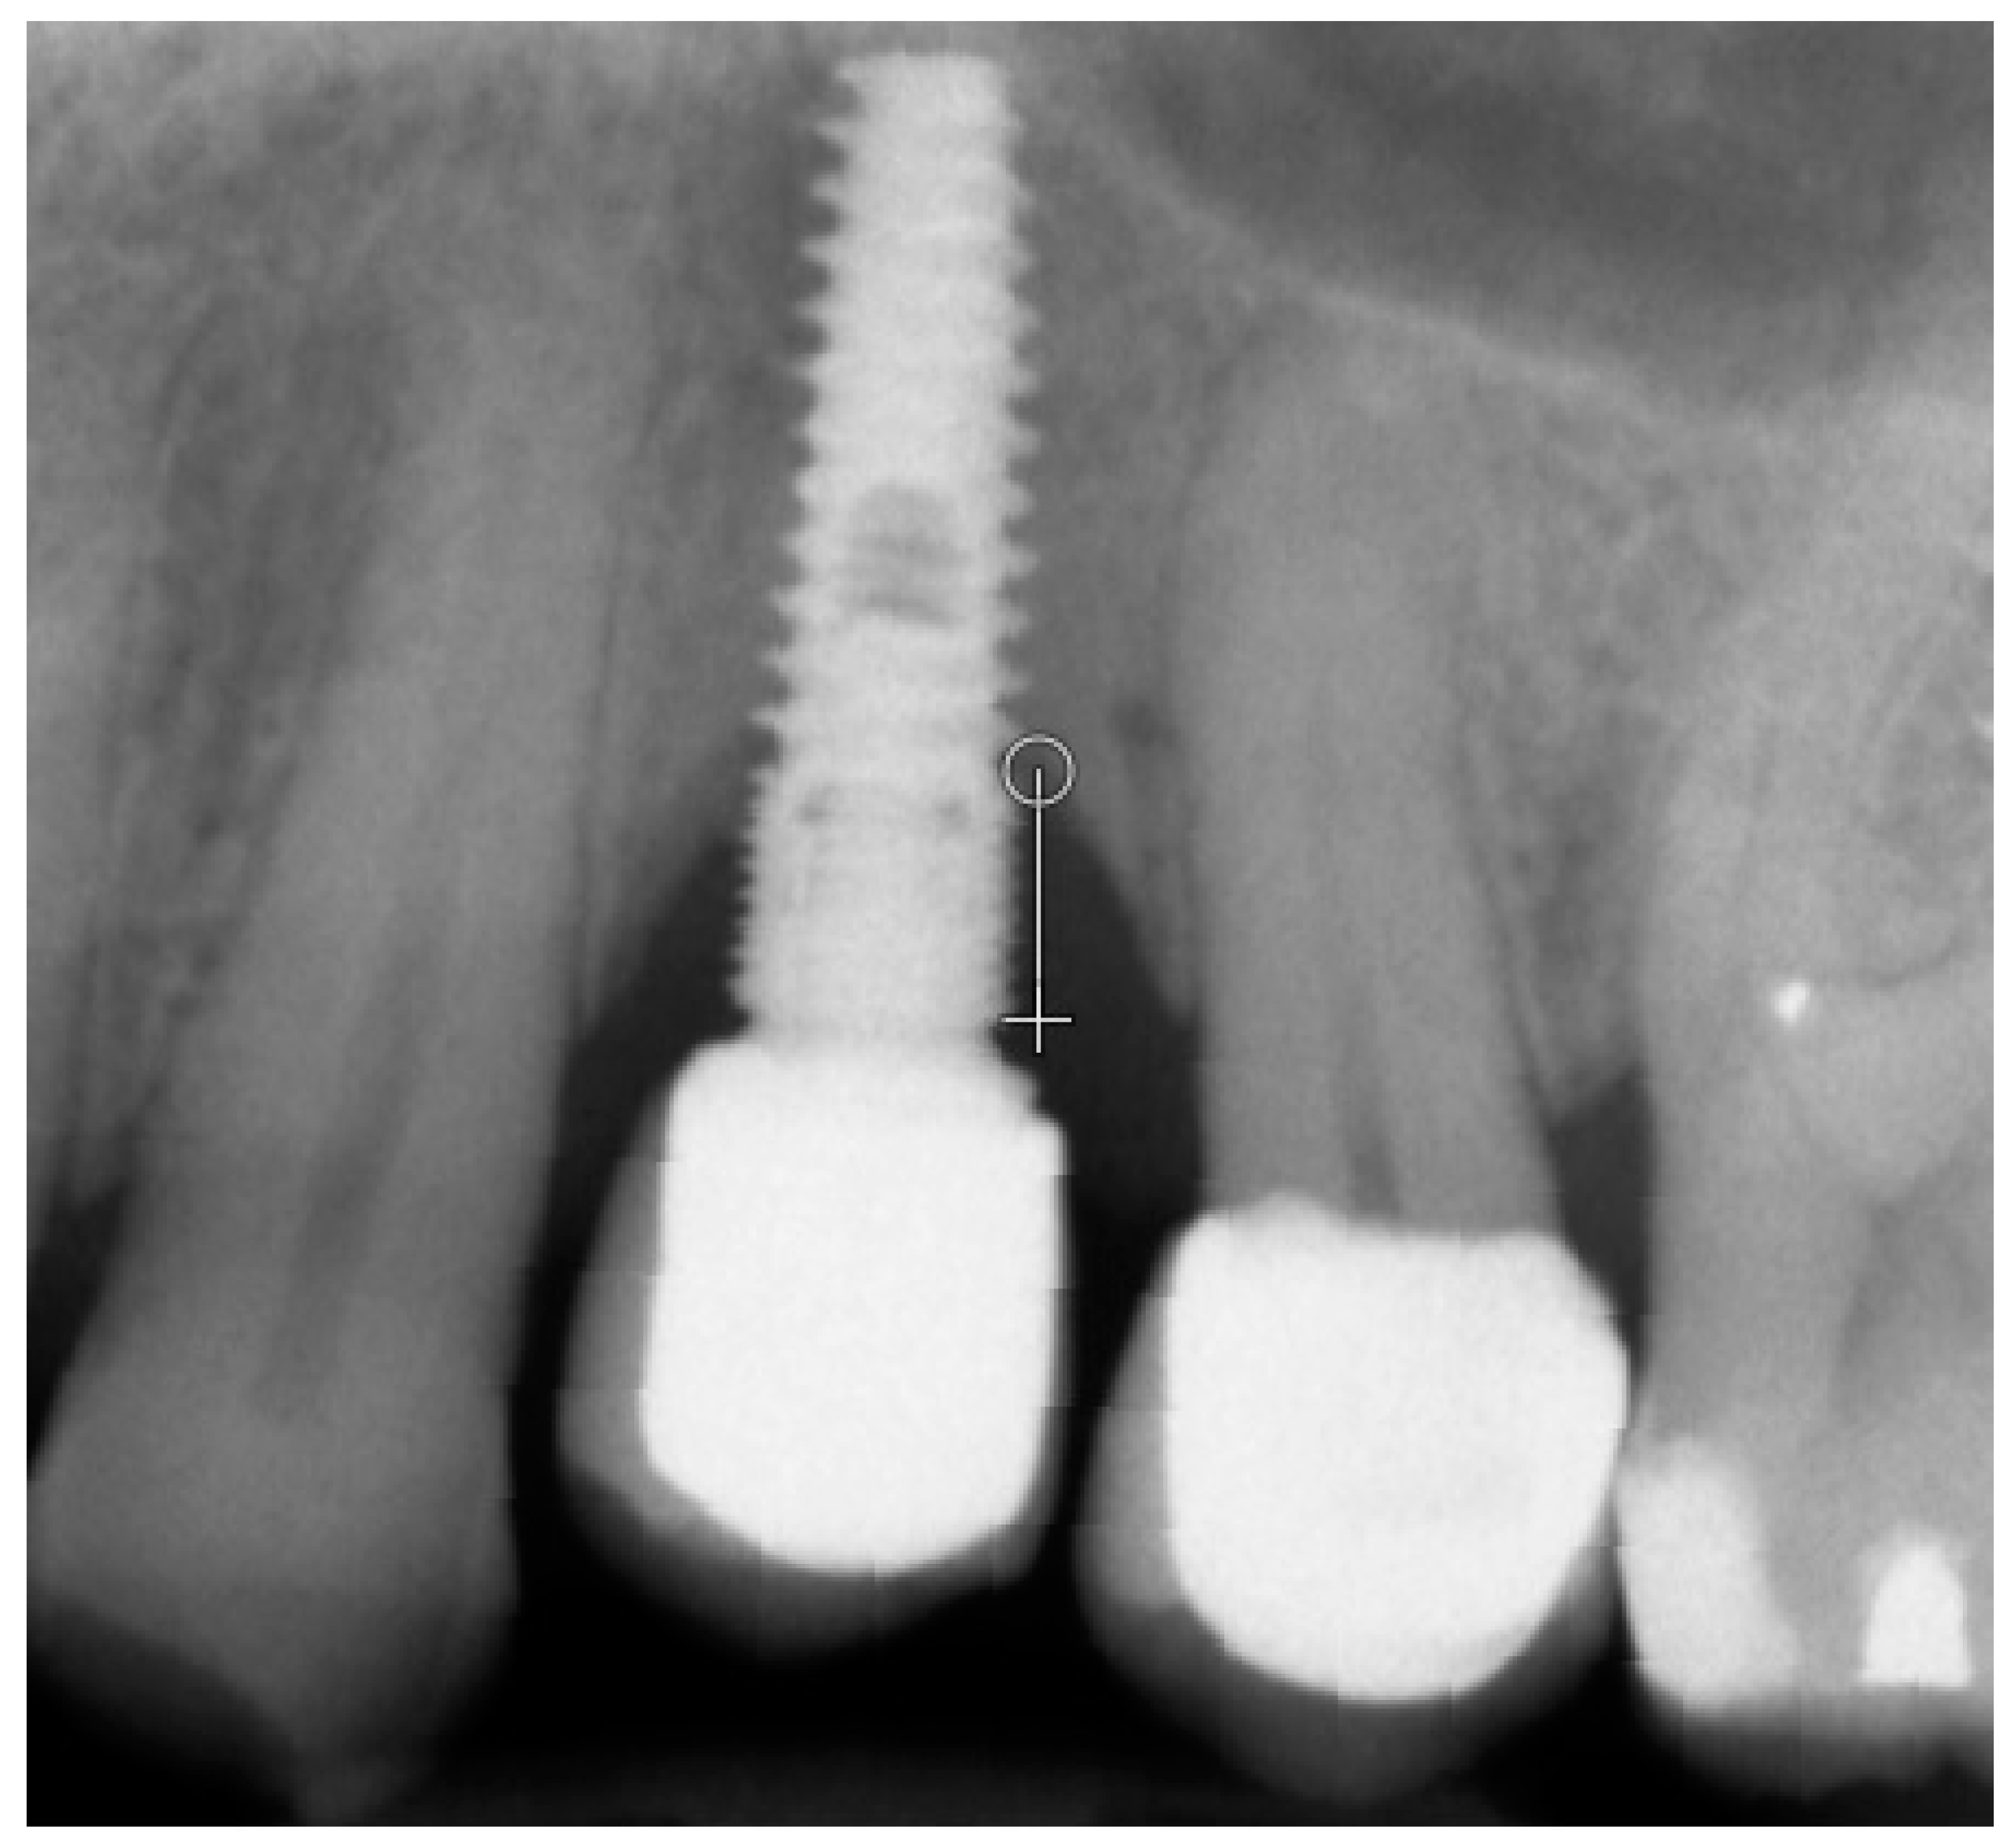
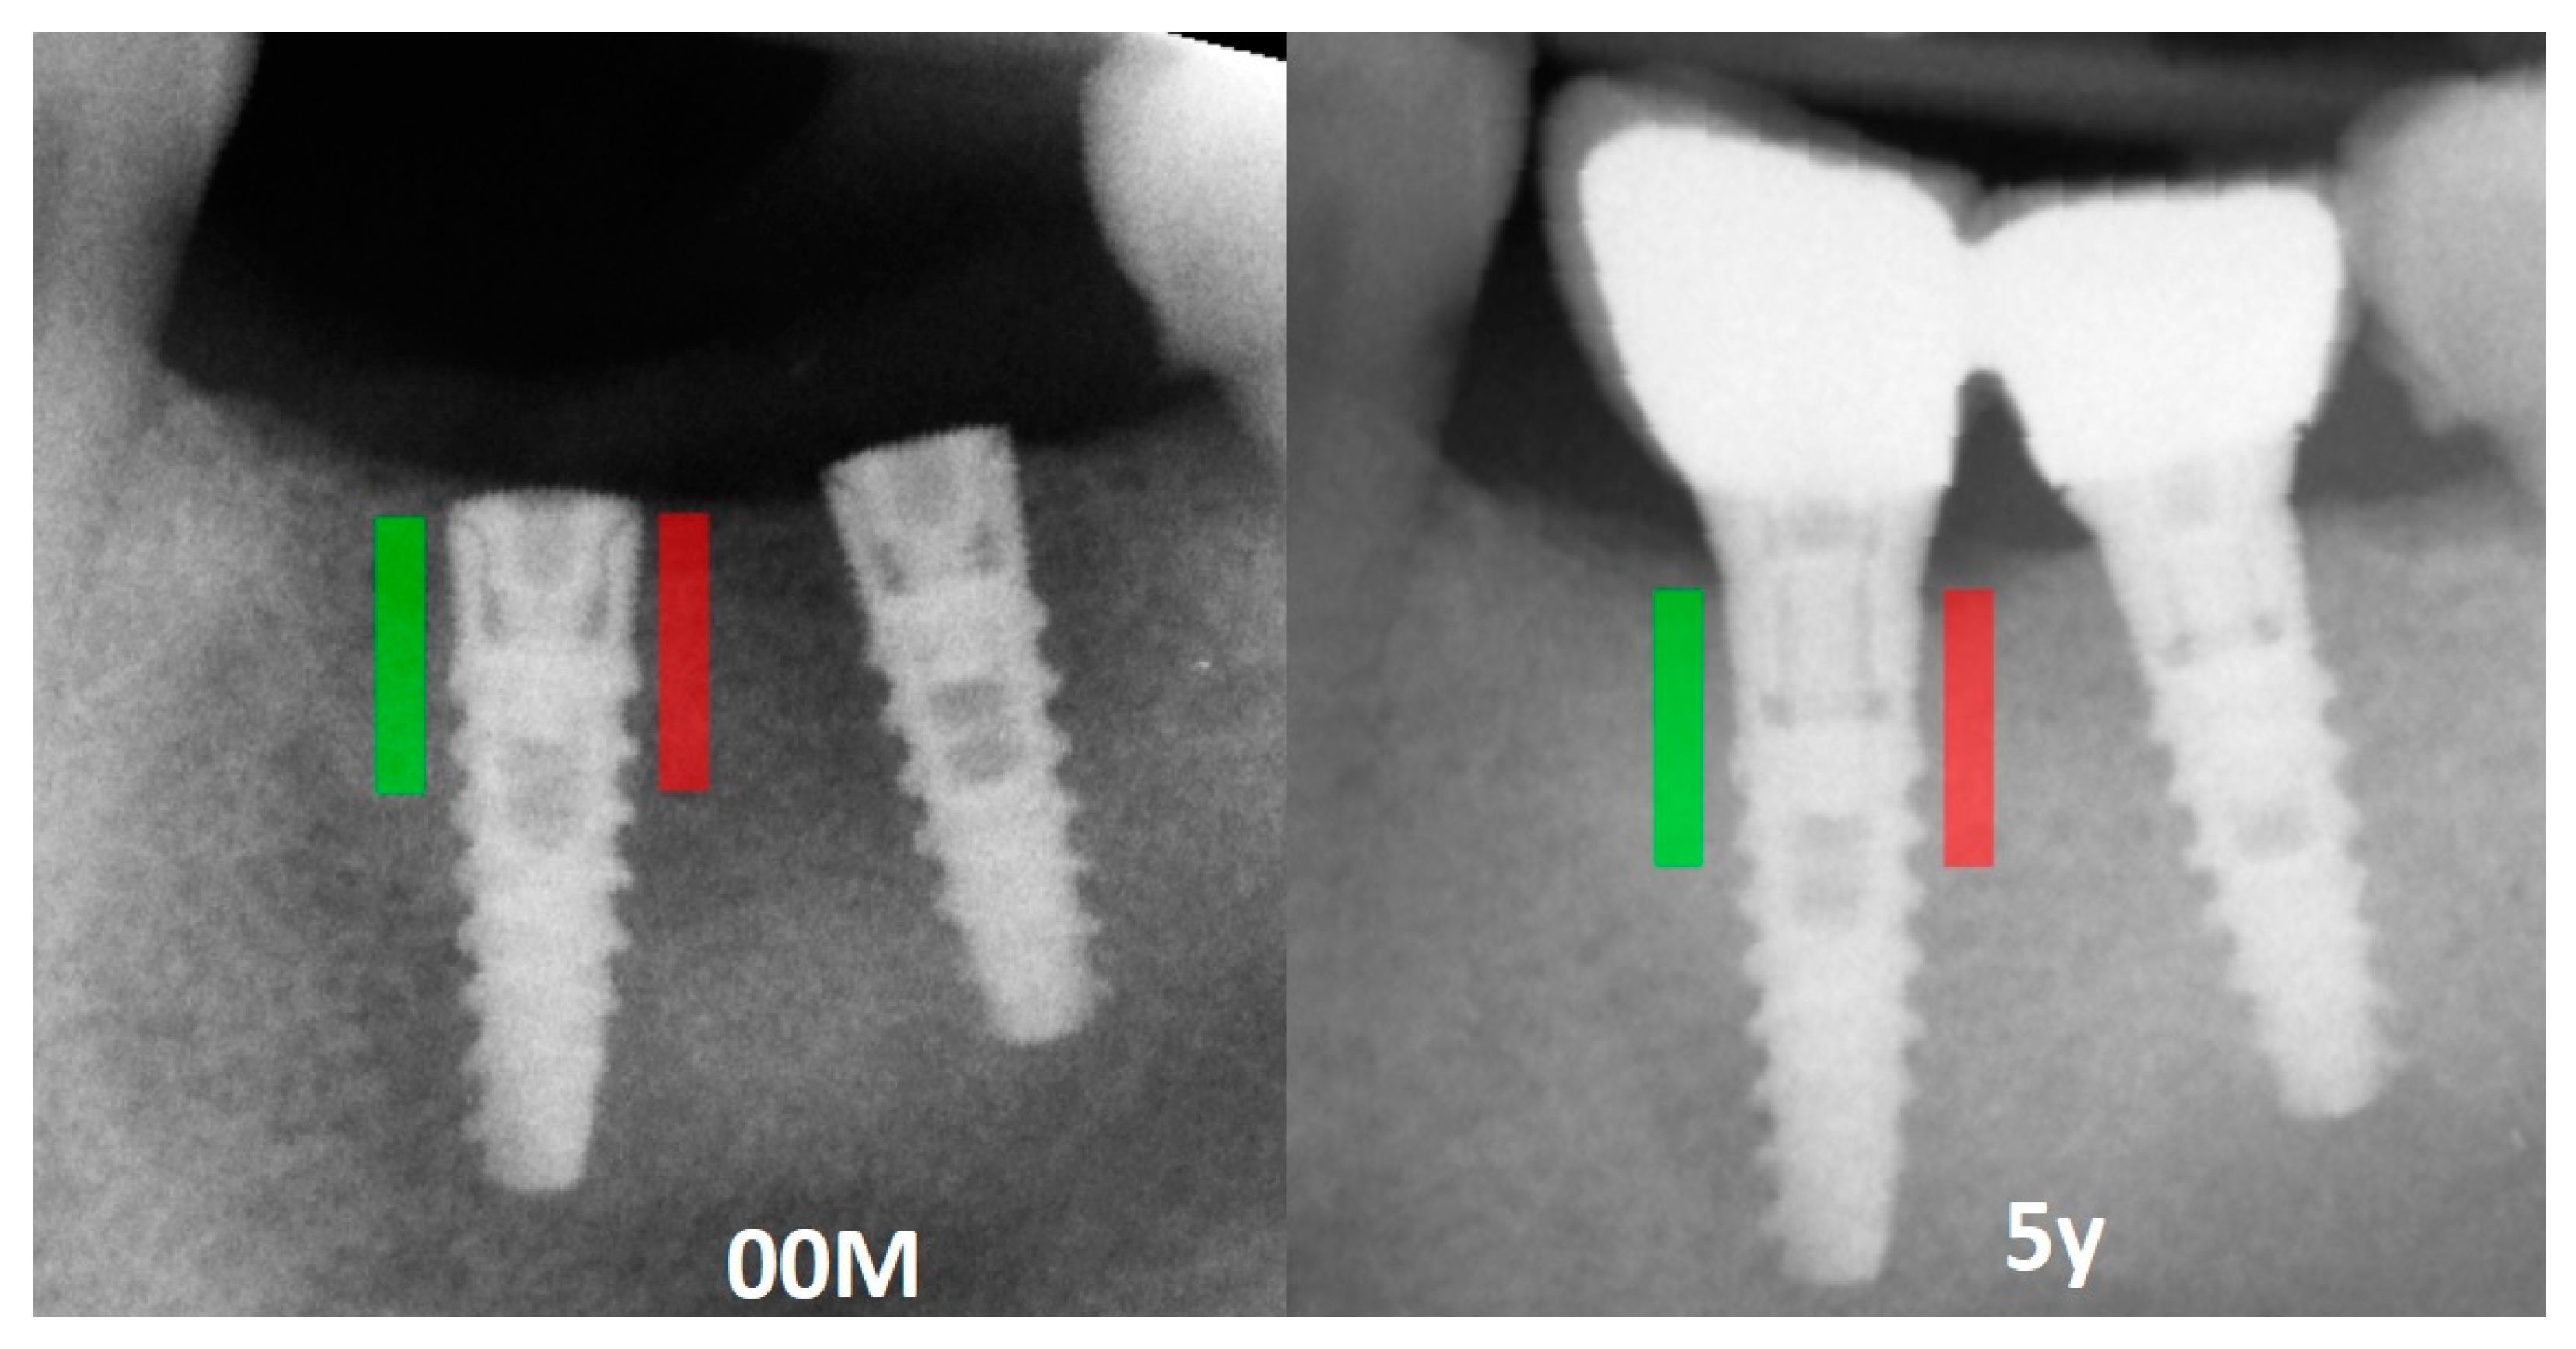
2. Materials and Methods
3. Results
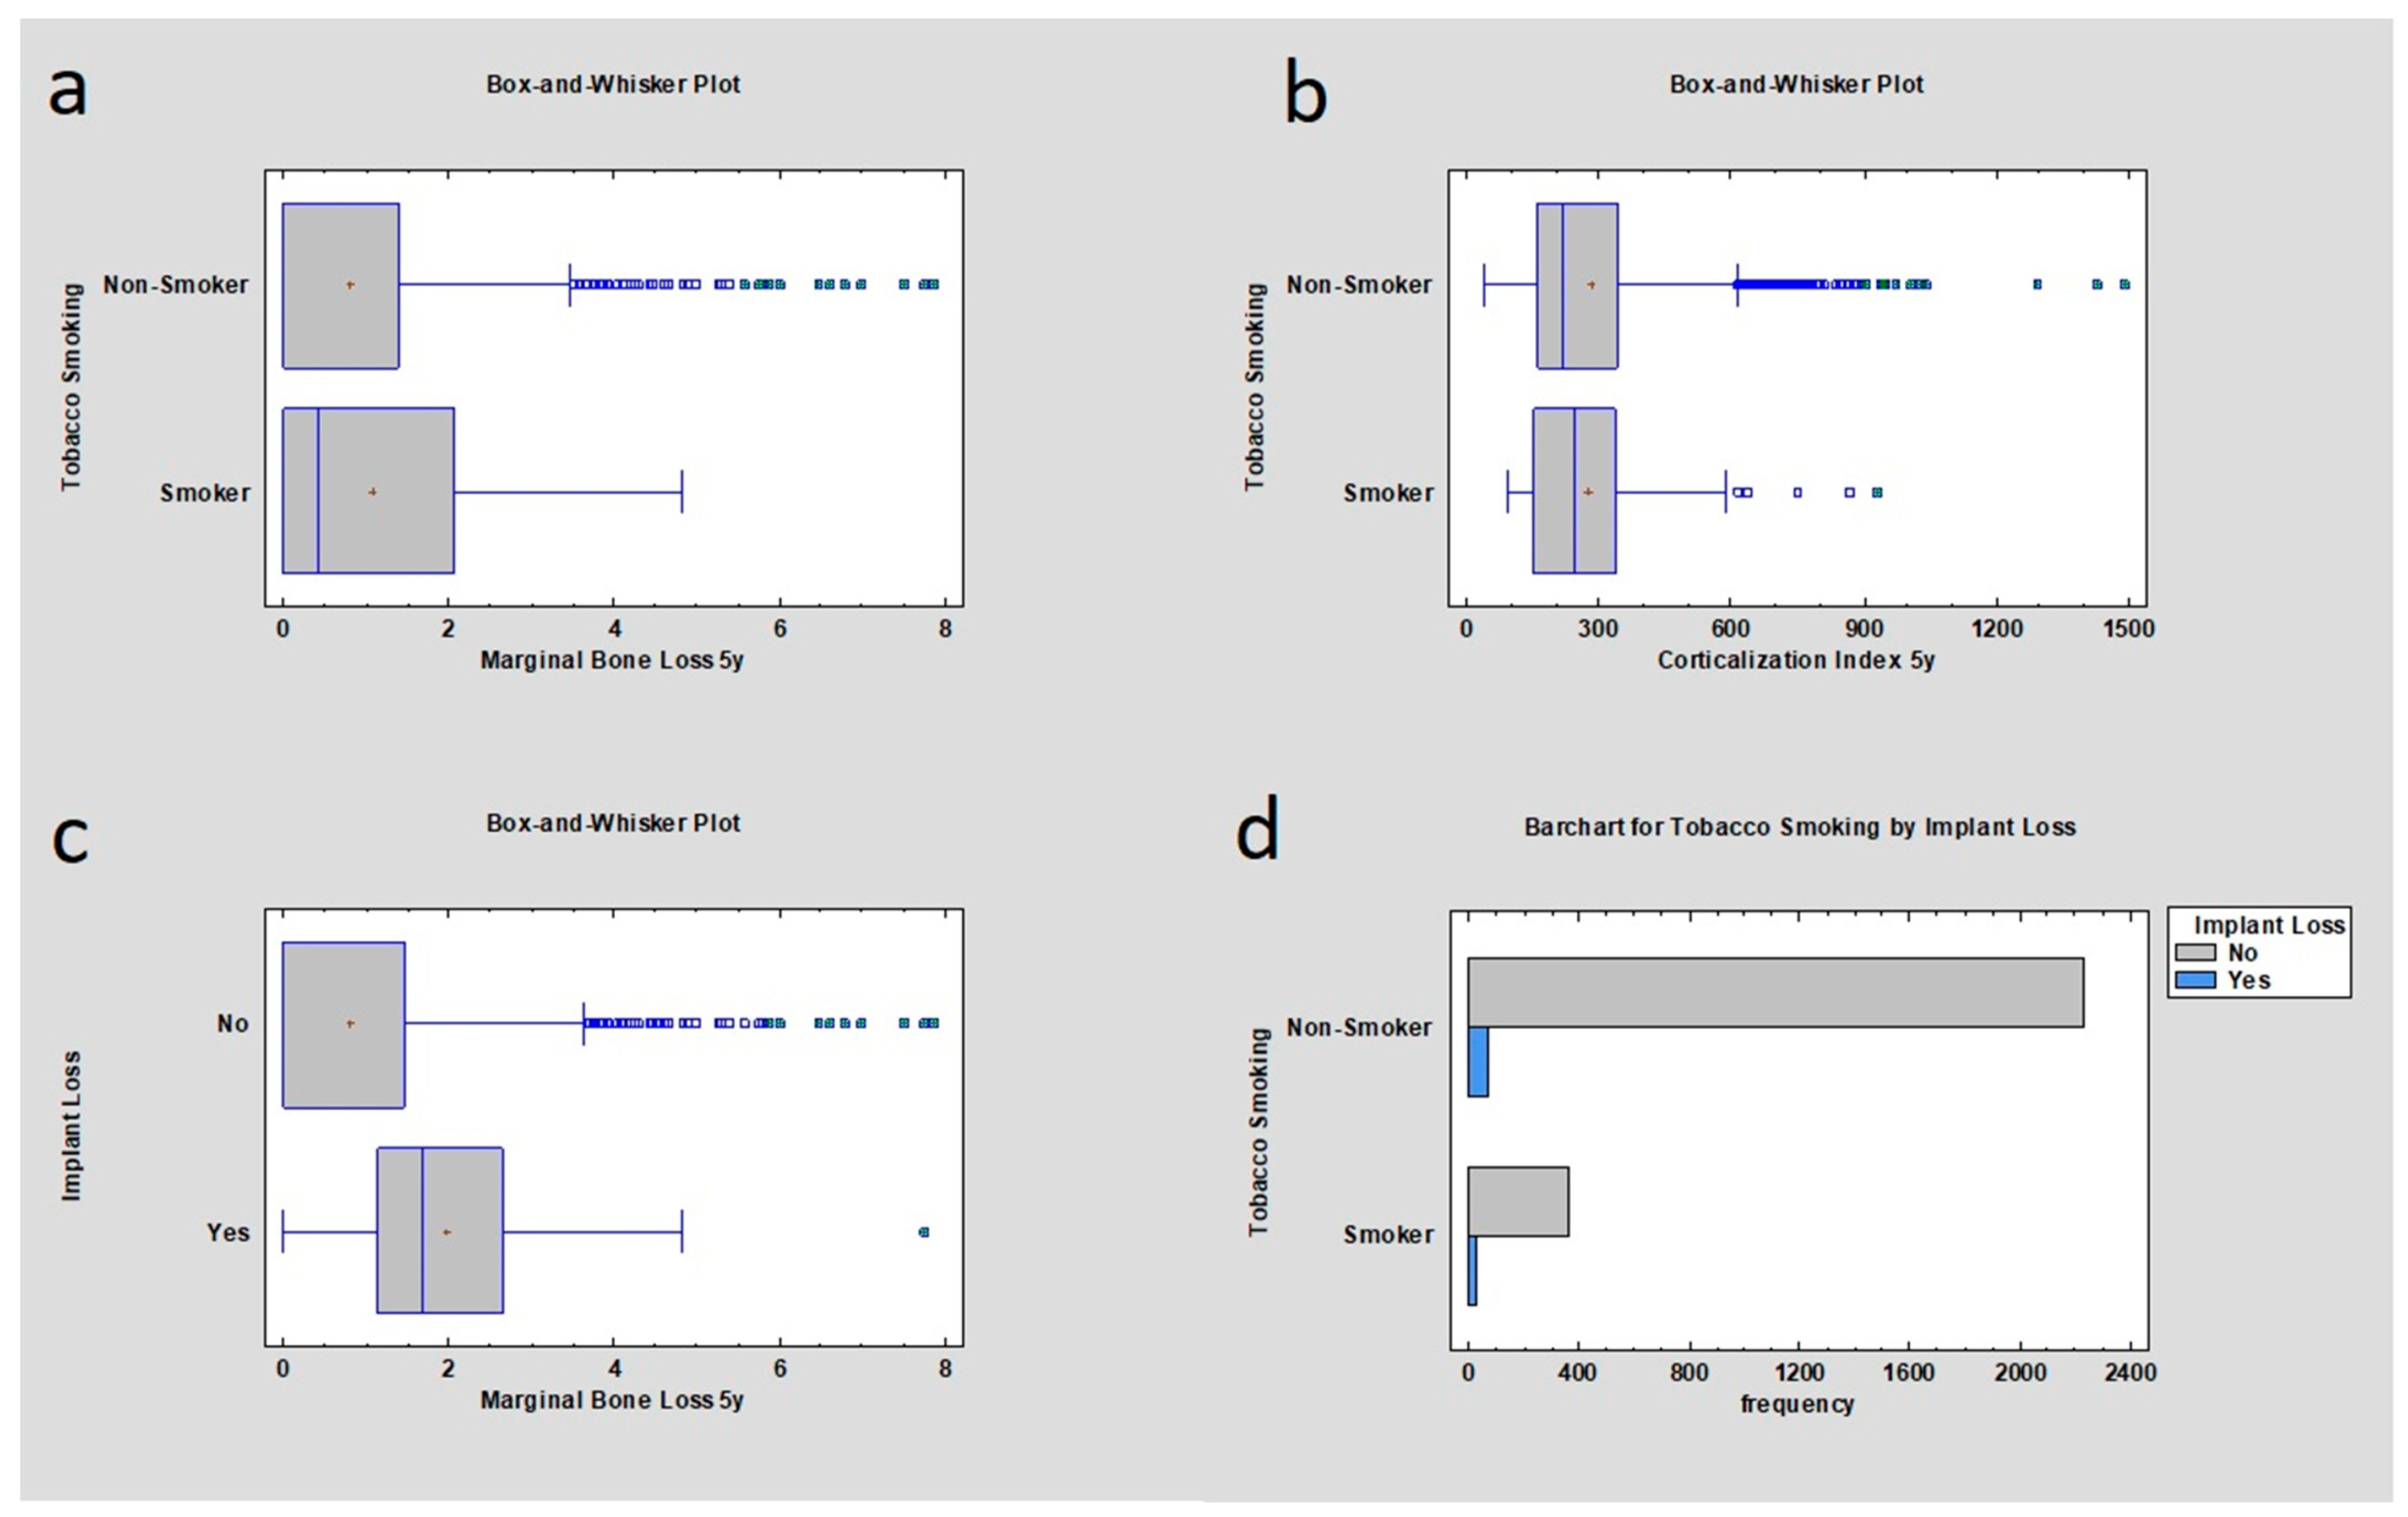
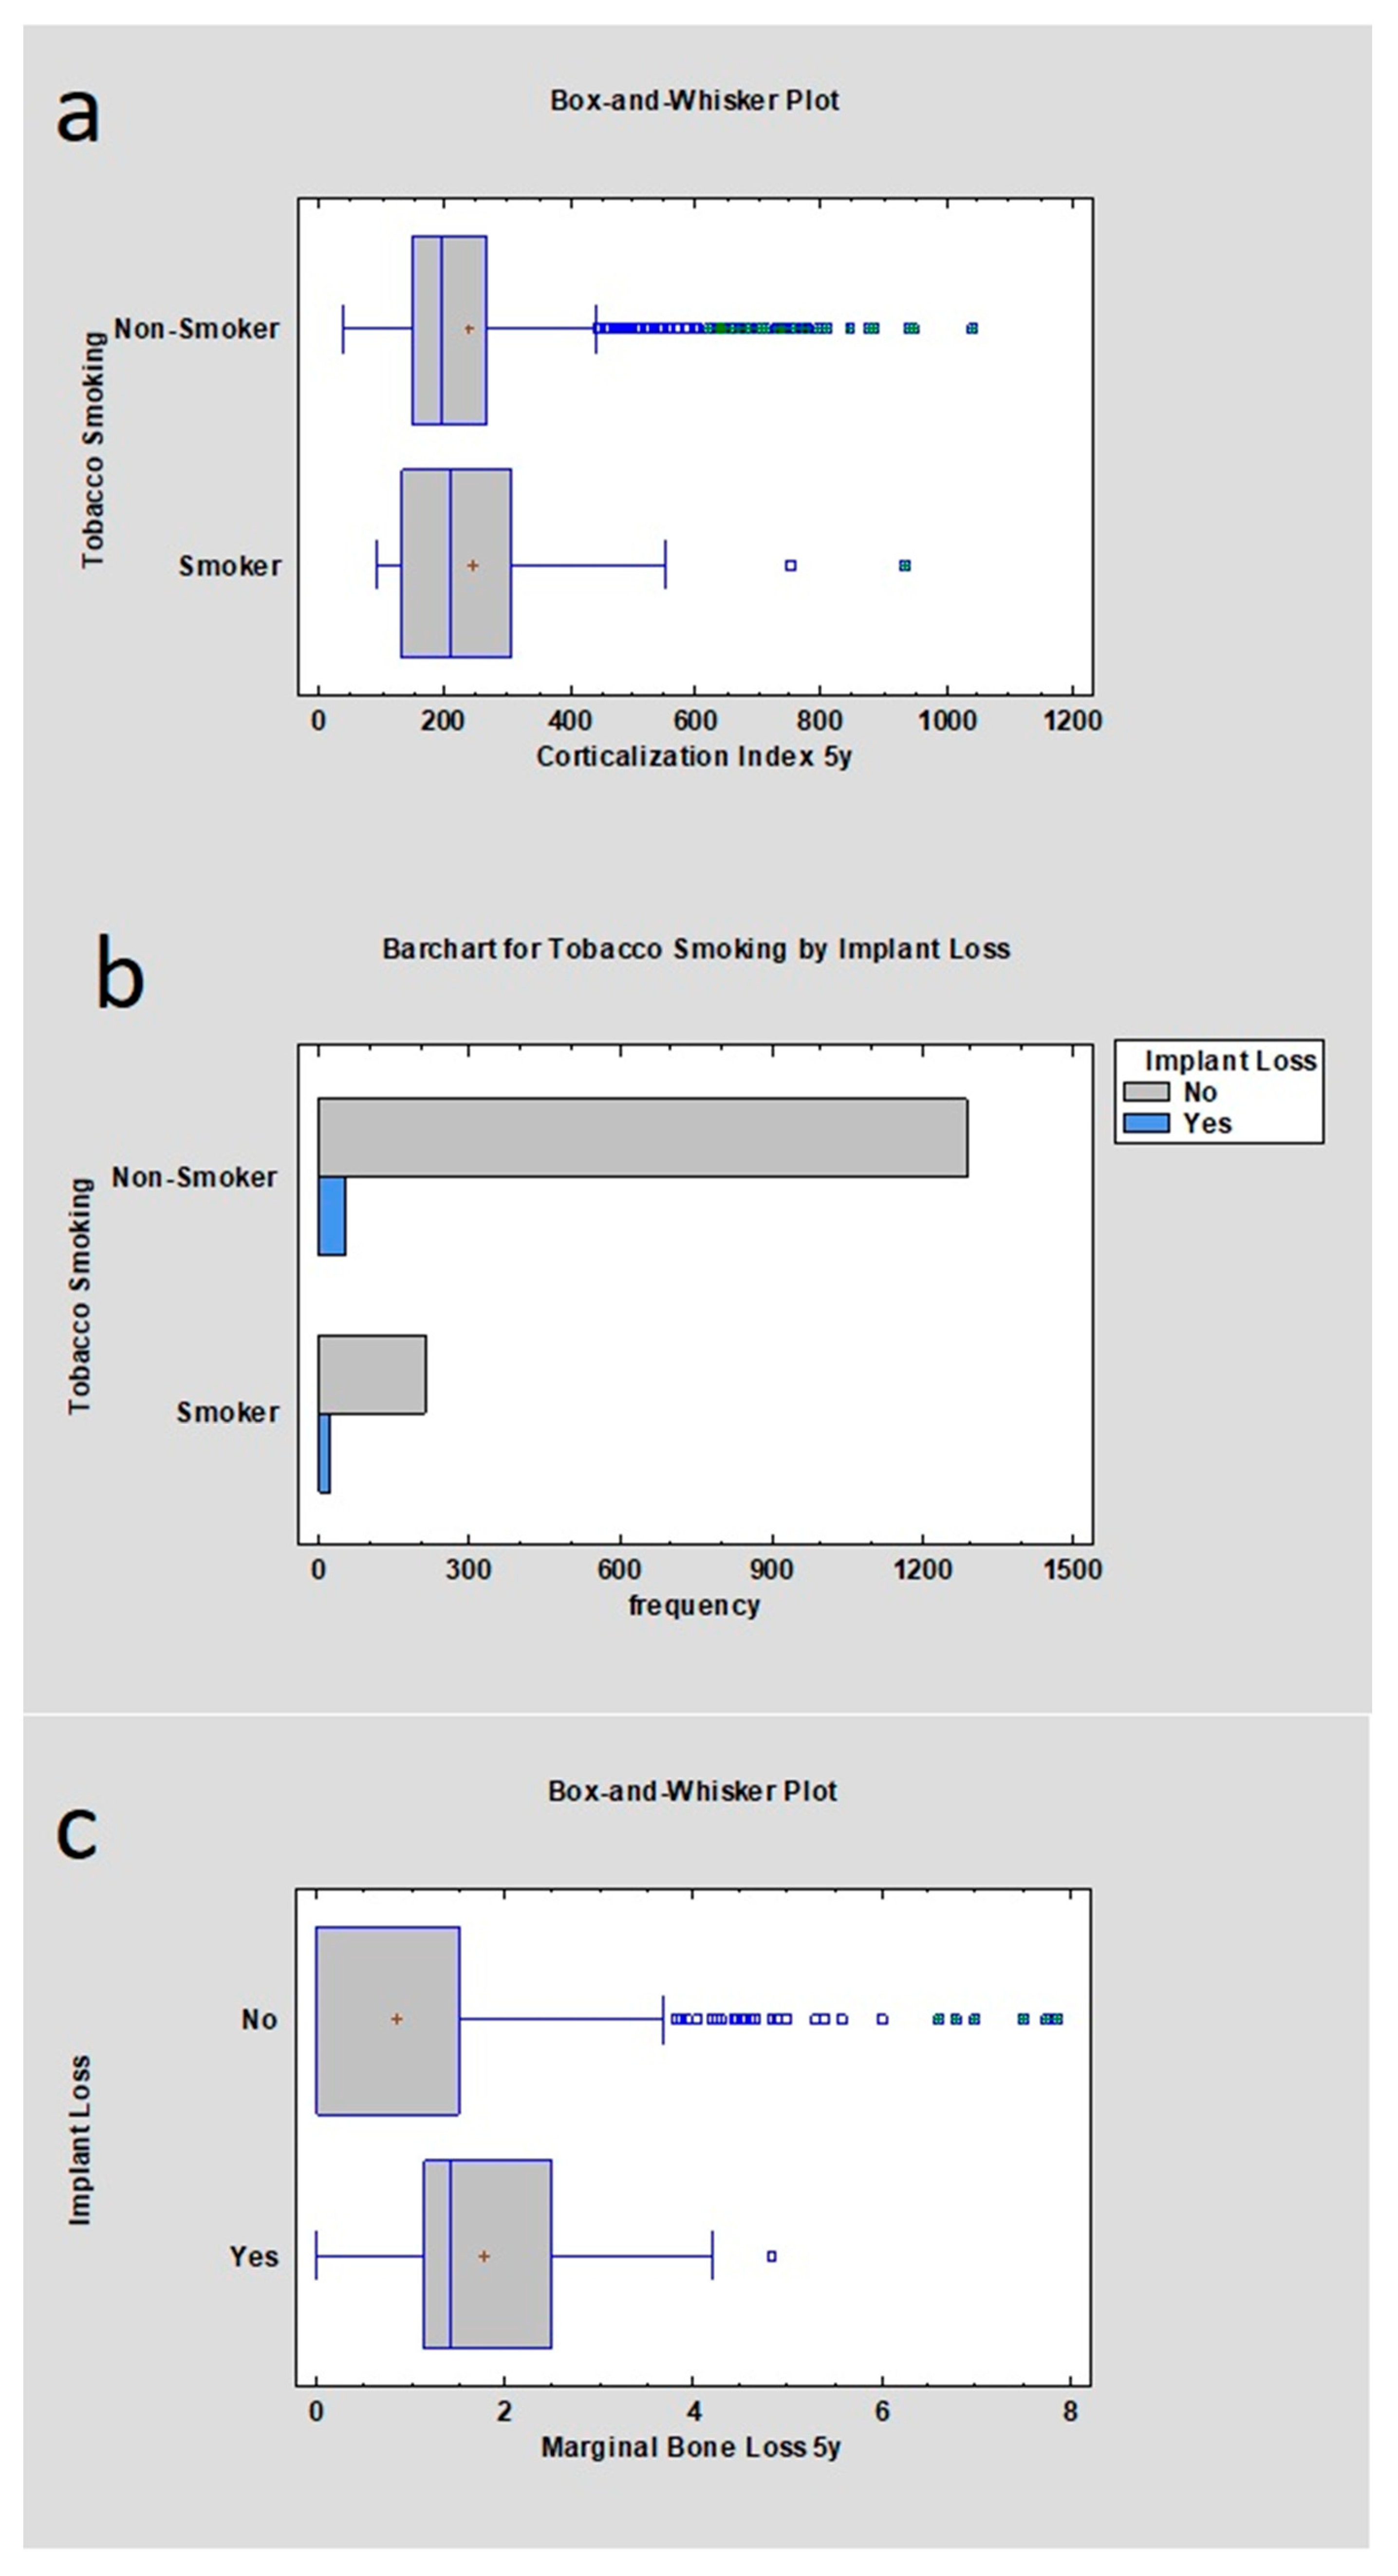
3.1. All Samples
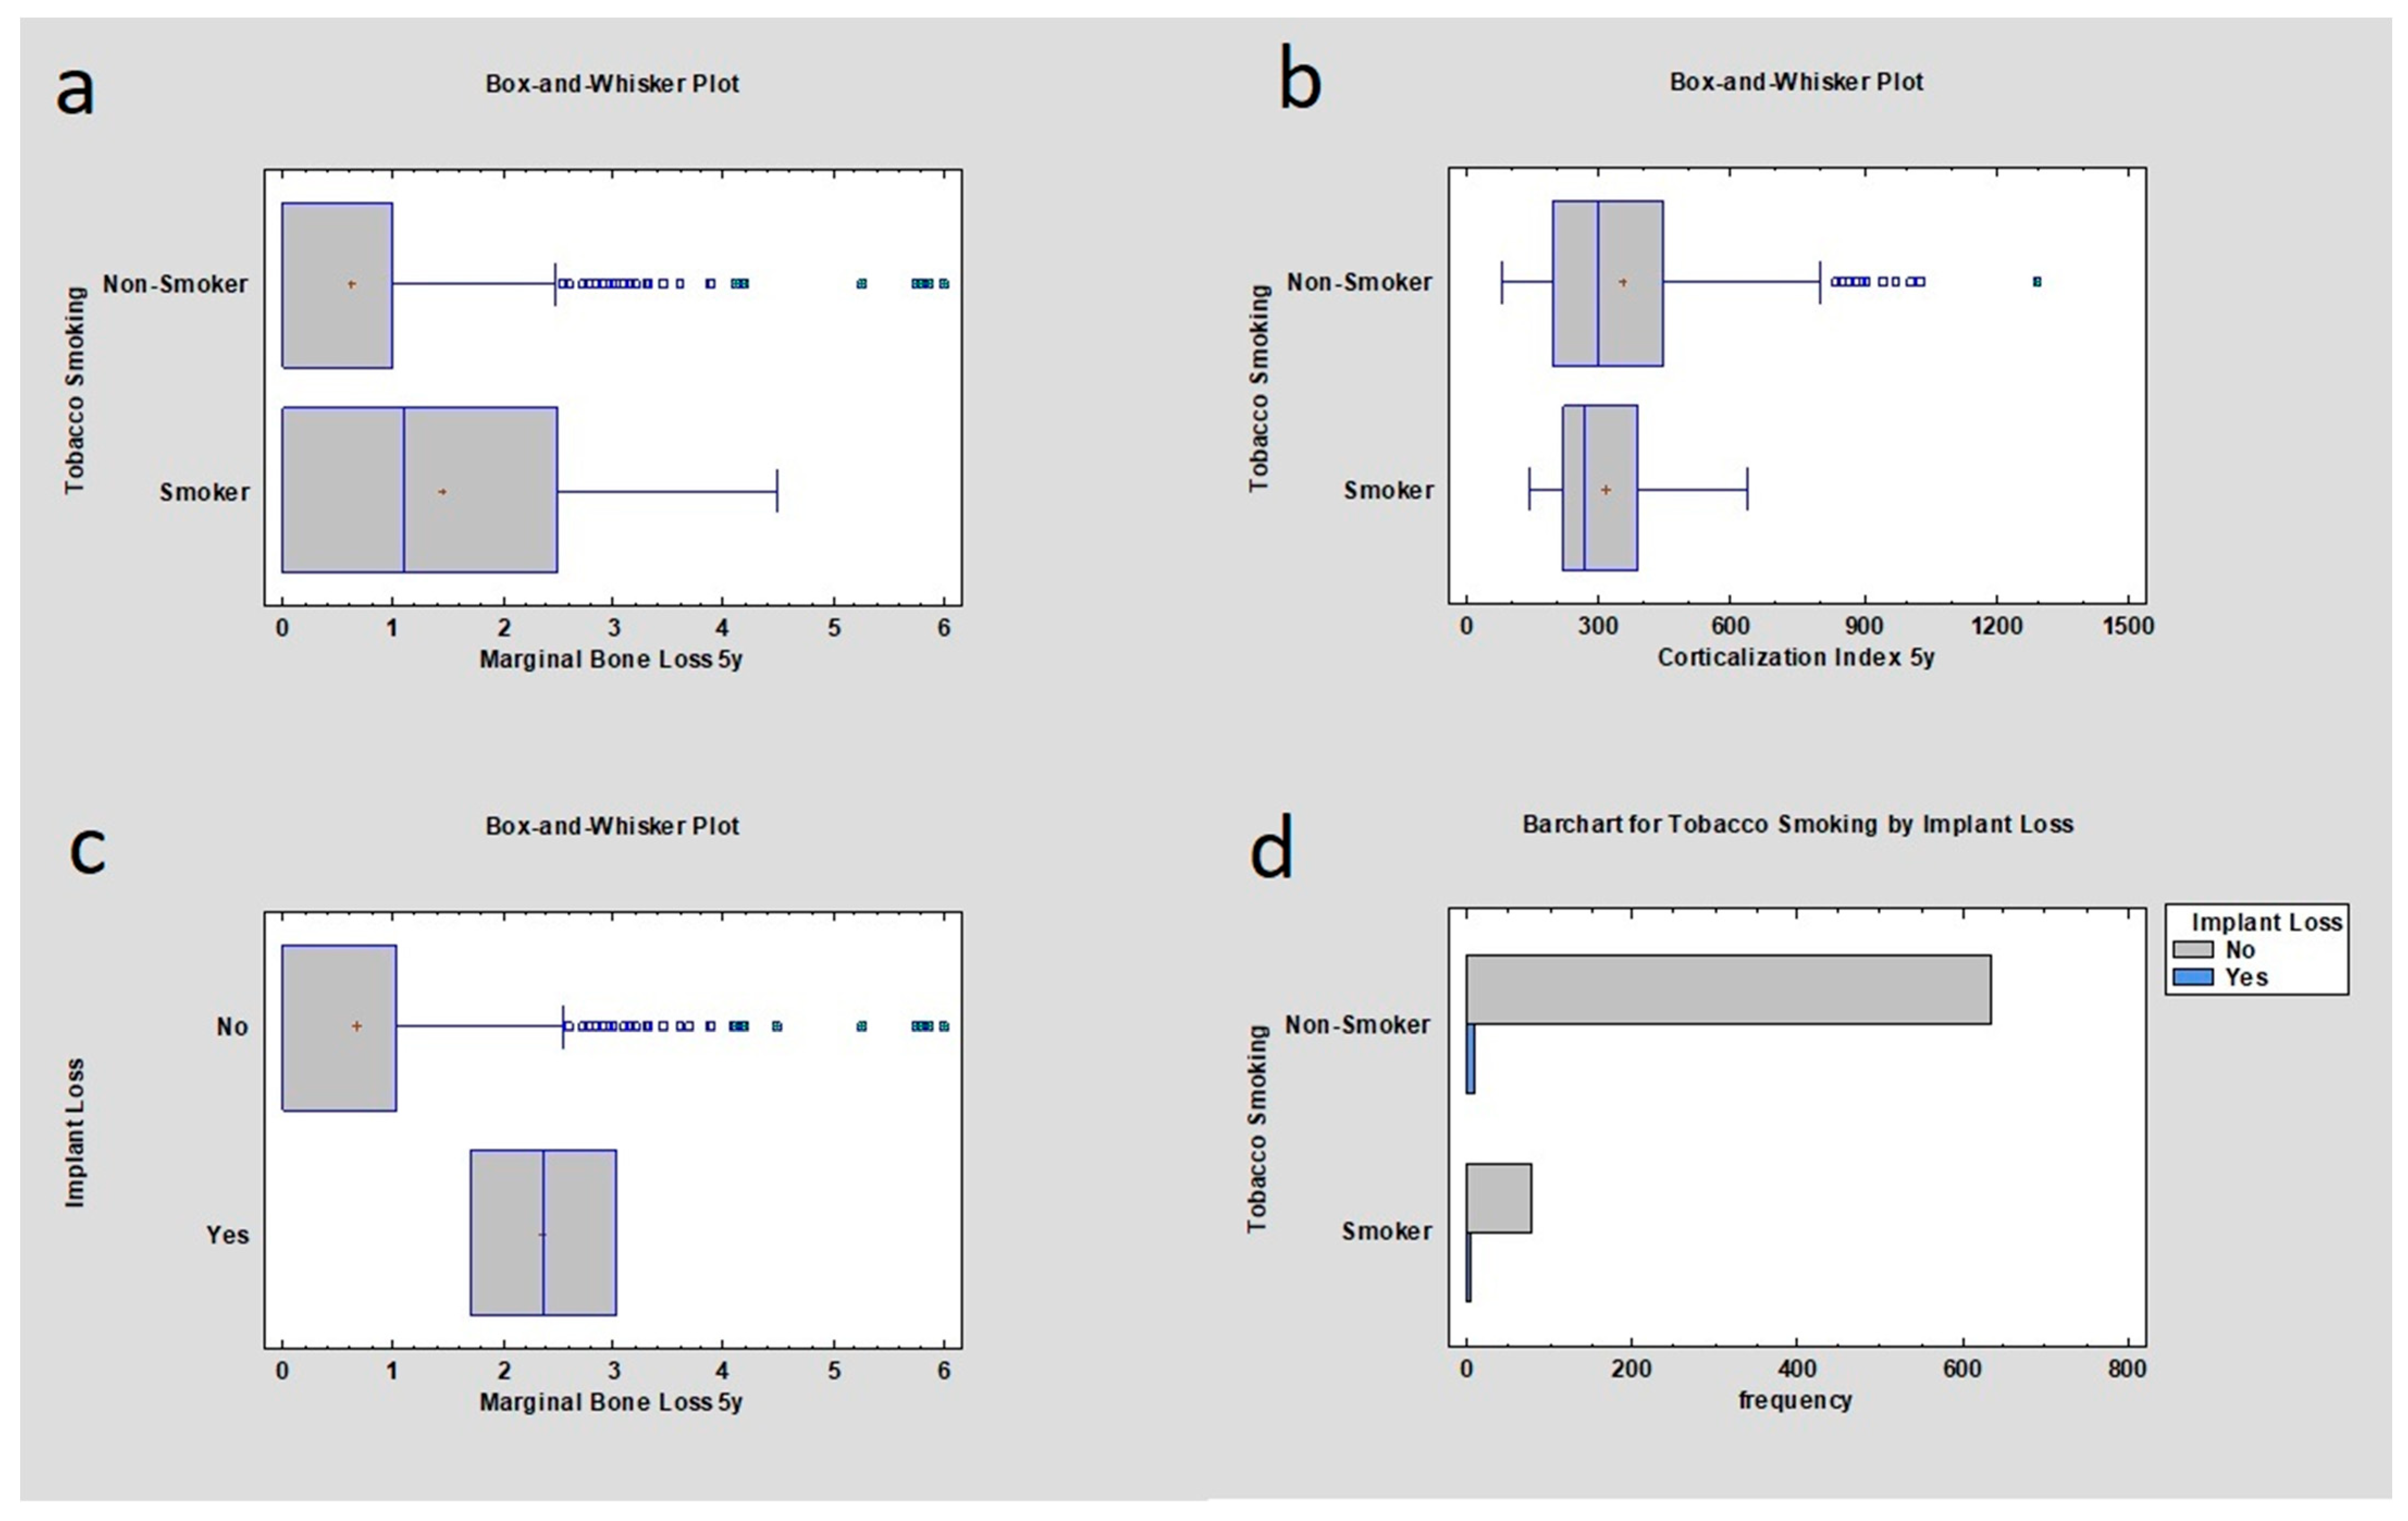
3.2. Mandible Group
3.3. Maxilla Group
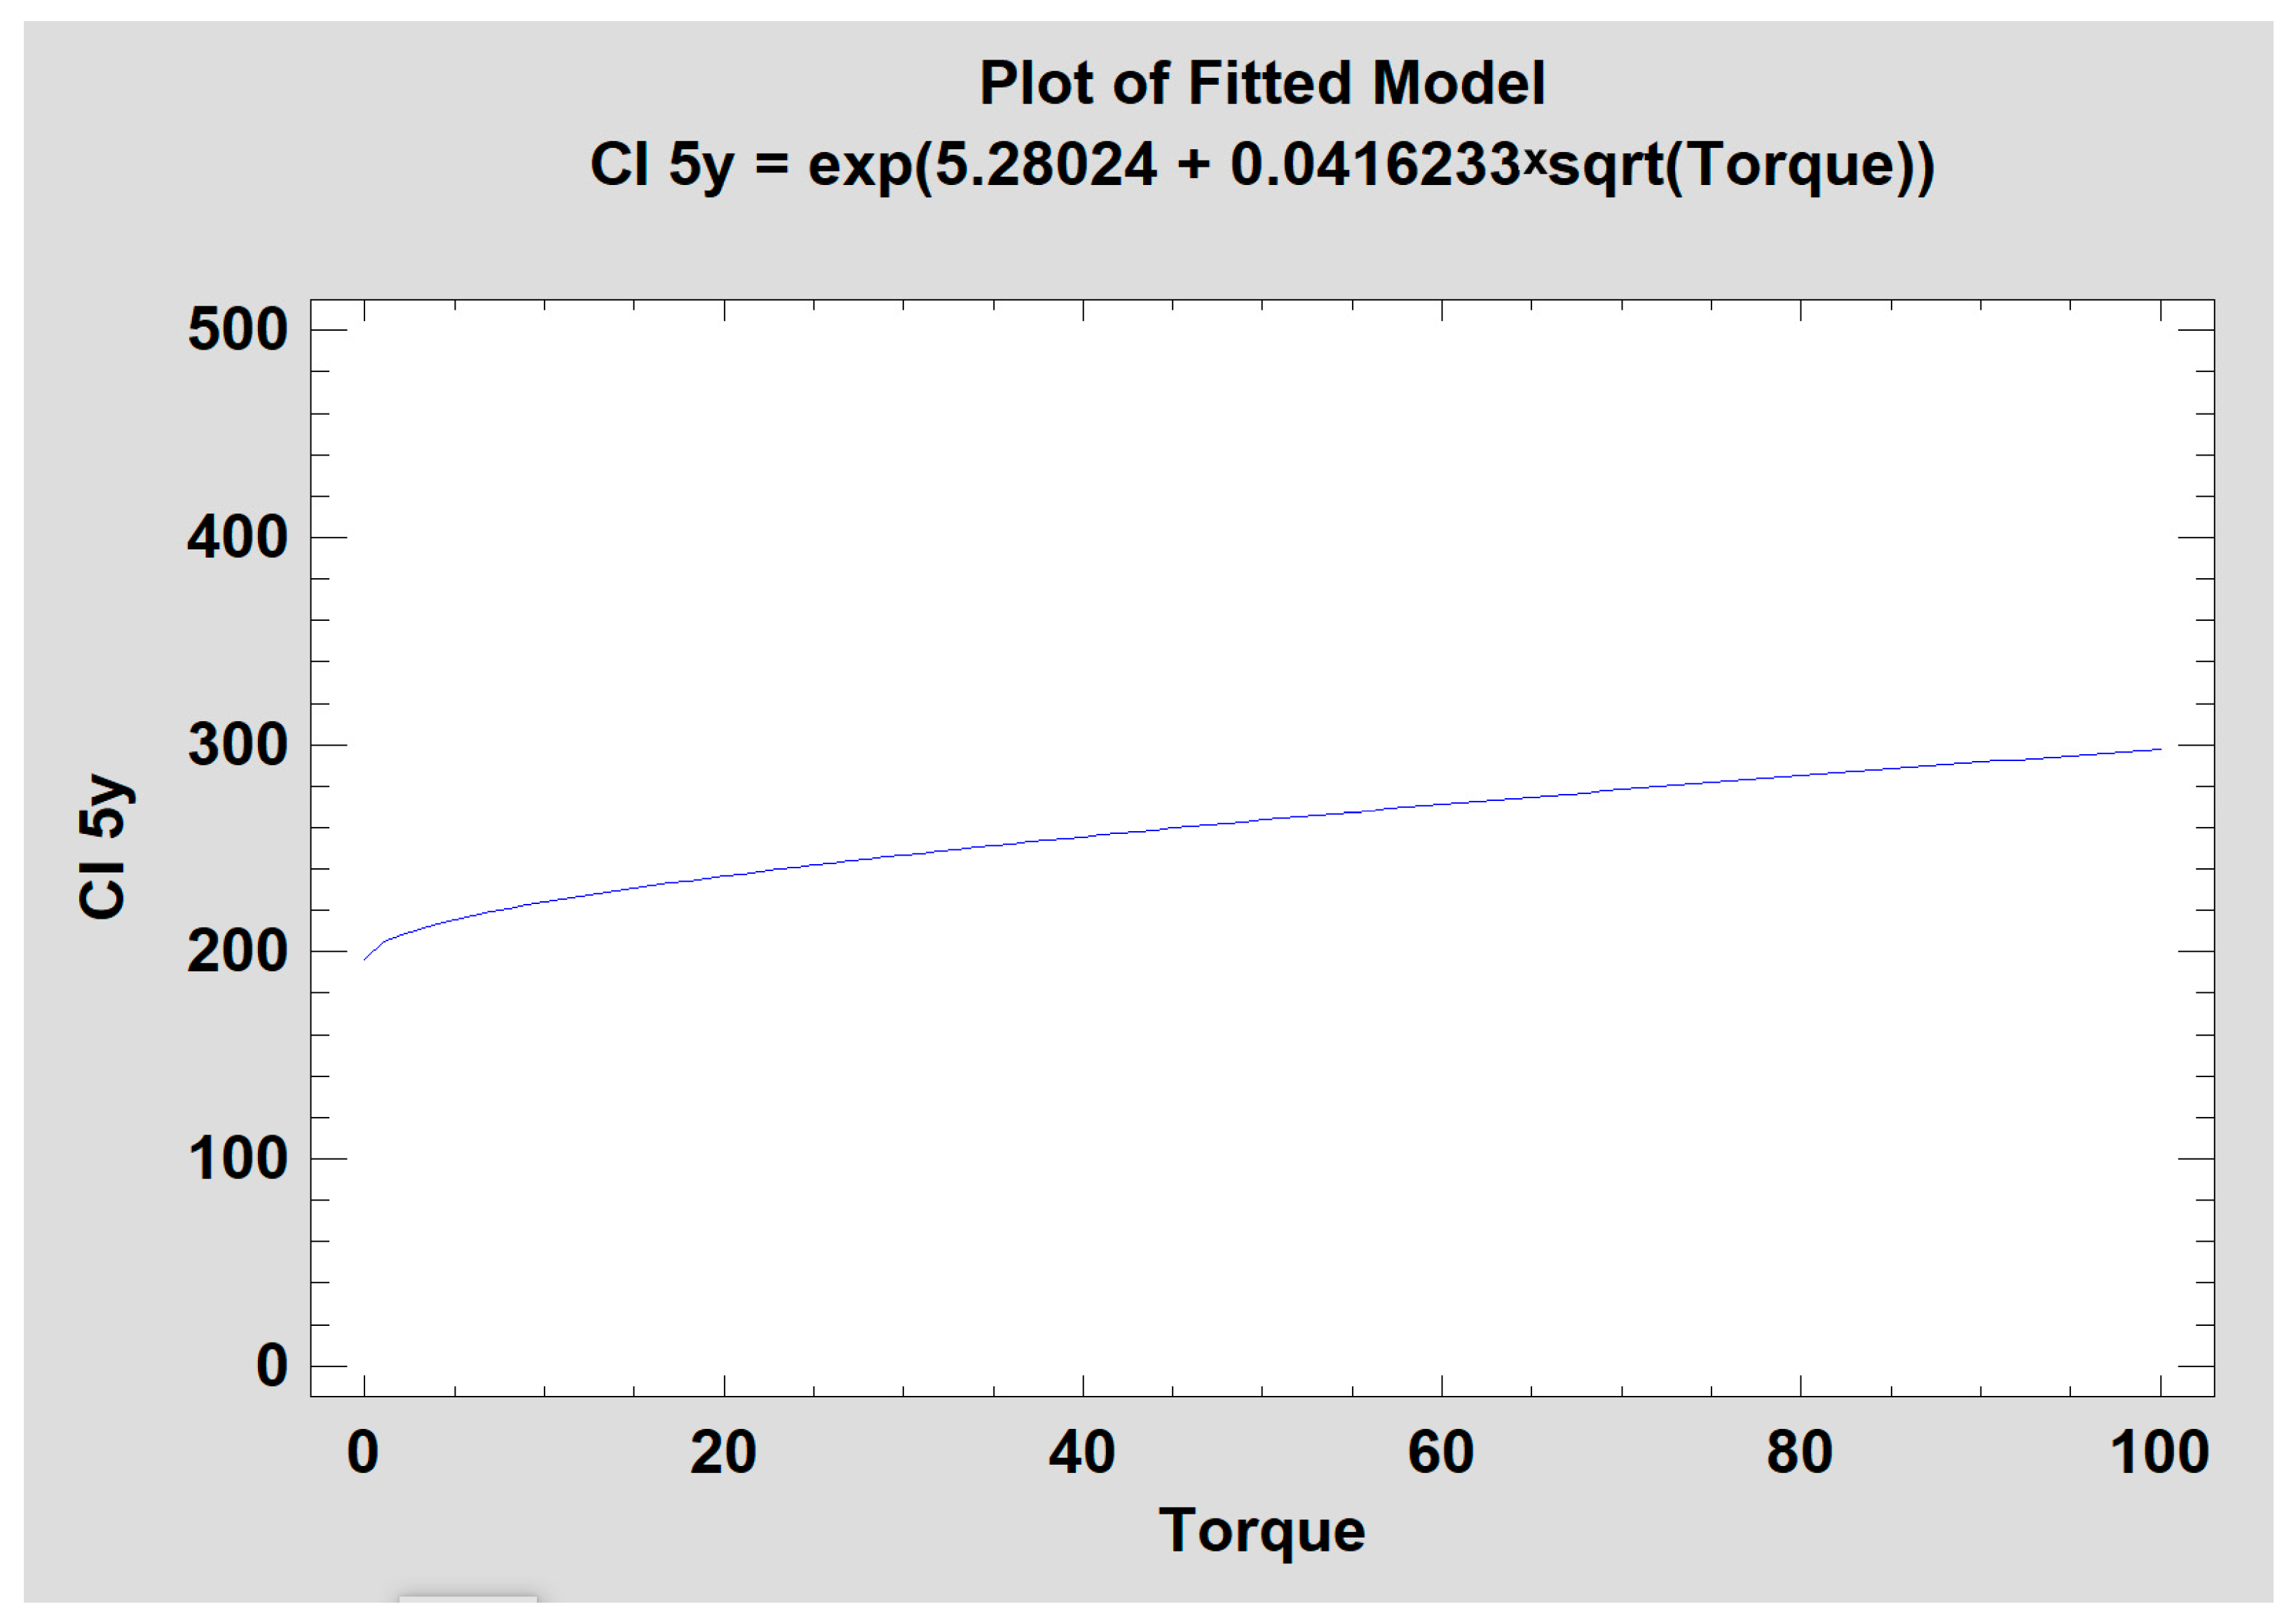
3.4. Corticalization vs. Torque
4. Discussion
5. Conclusions
Author Contributions
Funding
Institutional Review Board Statement
Informed Consent Statement
Data Availability Statement
Conflicts of Interest
References
- Reitsma, M.B.; Kendrick, P.J.; Ababneh, E.; Abbafati, C.; Abbasi-Kangevari, M.; Abdoli, A.; Abedi, A.; Abhilash, E.S.; Abila, D.B.; Aboyans, V.; et al. Spatial, temporal, and demographic patterns in prevalence of smoking tobacco use and attributable disease burden in 204 countries and territories, 1990–2019: A systematic analysis from the Global Burden of Disease Study 2019. Lancet 2021, 397, 2337–2360. [Google Scholar] [CrossRef] [PubMed]
- Yanbaeva, D.G.; Dentener, M.A.; Creutzberg, E.C.; Wesseling, G.; Wouters, E.F.M. Systemic Effects of Smoking. Chest 2007, 131, 1557–1566. [Google Scholar] [CrossRef] [PubMed]
- Onor, I.O.; Stirling, D.L.; Williams, S.R.; Bediako, D.; Borghol, A.; Harris, M.B.; Darensburg, T.B.; Clay, S.D.; Okpechi, S.C.; Sarpong, D.F. Clinical effects of cigarette smoking: Epidemiologic impact and review of pharmacotherapy options. Int. J. Environ. Res. Public Health 2017, 14, 1147. [Google Scholar] [CrossRef] [PubMed]
- Afolalu, E.F.; Spies, E.; Bacso, A.; Clerc, E.; Abetz-Webb, L.; Gallot, S.; Chrea, C. Impact of tobacco and/or nicotine products on health and functioning: A scoping review and findings from the preparatory phase of the development of a new self-report measure. Harm Reduct. J. 2021, 18, 79. [Google Scholar] [CrossRef] [PubMed]
- Wyszyńska-Pawelec, G.; Gontarz, M.; Zapała, J.; Szuta, M. Minor Salivary Gland Tumours of Upper Aerodigestive Tract: A Clinicopathological Study. Gastroenterol. Res. Pract. 2012, 2012, 780453. [Google Scholar] [CrossRef] [PubMed]
- Trybek, G.; Preuss, O.; Aniko-Wlodarczyk, M.; Kuligowski, P.; Gabrysz-Trybek, E.; Suchanecka, A. The effect of nicotine on oral health. Balt. J. Health Phys. Act. 2018, 10, 7–13. [Google Scholar] [CrossRef]
- Suchanecka, A.; Chmielowiec, K.; Chmielowiec, J.; Trybek, G.; Masiak, J.; Michałowska-Sawczyn, M.; Nowicka, R.; Grocholewicz, K.; Grzywacz, A. Vitamin D Receptor Gene Polymorphisms and Cigarette Smoking Impact on Oral Health: A Case-Control Study. Int. J. Environ. Res. Public Health 2020, 17, 3192. [Google Scholar] [CrossRef]
- Grzywacz, A.; Suchanecka, A.; Chmielowiec, J.; Chmielowiec, K.; Szumilas, K.; Masiak, J.; Balwicki, Ł.; Michałowska-Sawczyn, M.; Trybek, G. Personality Traits or Genetic Determinants—Which Strongly Influences E-Cigarette Users? Int. J. Environ. Res. Public Health 2020, 17, 365. [Google Scholar] [CrossRef]
- Aredo, J.V.; Luo, S.J.; Gardner, R.M.; Sanyal, N.; Choi, E.; Hickey, T.P.; Riley, T.L.; Huang, W.-Y.; Kurian, A.W.; Leung, A.N.; et al. Tobacco Smoking and Risk of Second Primary Lung Cancer. J. Thorac. Oncol. 2021, 16, 968–979. [Google Scholar] [CrossRef]
- Ali, A.; Al Attar, A.; Chrcanovic, B.R. Frequency of Smoking and Marginal Bone Loss around Dental Implants: A Retrospective Matched-Control Study. J. Clin. Med. 2023, 12, 1386. [Google Scholar] [CrossRef]
- Lindquist, L.; Carlsson, G.; Jemt, T. Association between Marginal Bone Loss around Osseointegrated Mandibular Implants and Smoking Habits: A 10-year Follow-up Study. J. Dent. Res. 1997, 76, 1667–1674. [Google Scholar] [CrossRef] [PubMed]
- Chrcanovic, B.R.; Albrektsson, T.; Wennerberg, A. Smoking and dental implants: A systematic review and meta-analysis. J. Dent. 2015, 43, 487–498. [Google Scholar] [CrossRef] [PubMed]
- Radi, I.A.E.; Elsayyad, A.A. Smoking Might Increase the Failure Rate and Marginal Bone Loss around Dental Implants. J. Evid.-Based Dent. Pract. 2022, 22, 101804. [Google Scholar] [CrossRef]
- Dinesh; Nazeer, J.; Singh, R.; Suri, P.; Mouneshkumar, C.; Bhardwaj, S.; Iqubal, M. Evaluation of marginal bone loss around dental implants in cigarette smokers and nonsmokers. A comparative study. J. Fam. Med. Prim. Care 2020, 9, 729–734. [Google Scholar] [CrossRef]
- Mumcu, E.; Beklen, A. The effect of smoking on the marginal bone loss around implant-supported prostheses. Tob. Induc. Dis. 2019, 17, 43. [Google Scholar] [CrossRef] [PubMed]
- Al-Bashaireh, A.M.; Haddad, L.G.; Weaver, M.; Chengguo, X.; Kelly, D.L.; Yoon, S. The Effect of Tobacco Smoking on Bone Mass: An Overview of Pathophysiologic Mechanisms. J. Osteoporos. 2018, 2018, 1206235. [Google Scholar] [CrossRef]
- Yoon, V.; Maalouf, N.M.; Sakhaee, K. The effects of smoking on bone metabolism. Osteoporos. Int. 2012, 23, 2081–2092. [Google Scholar] [CrossRef]
- Bonfiglio, R.; Tarantino, U.; Weng, W.; Li, H.; Zhu, S. An Overlooked Bone Metabolic Disorder: Cigarette Smoking-Induced Osteoporosis. Genes 2022, 13, 806. [Google Scholar] [CrossRef]
- Wiesner, A.; Szuta, M.; Galanty, A.; Paśko, P. Optimal Dosing Regimen of Osteoporosis Drugs in Relation to Food Intake as the Key for the Enhancement of the Treatment Effectiveness—A Concise Literature Review. Foods 2021, 10, 720. [Google Scholar] [CrossRef]
- Drake, M.T.; Clarke, B.L.; Khosla, S. Bisphosphonates: Mechanism of Action and Role in Clinical Practice. Mayo Clin. Proc. 2008, 83, 1032–1045. [Google Scholar] [CrossRef]
- Lomashvili, K.A.; Monier-Faugere, M.-C.; Wang, X.; Malluche, H.H.; O’Neill, W.C. Effect of bisphosphonates on vascular calcification and bone metabolism in experimental renal failure. Kidney Int. 2009, 75, 617–625. [Google Scholar] [CrossRef] [PubMed]
- Miller, P.D.; Zapalowski, C.; Kulak, C.A.M.; Bilezikian, J.P. Bone Densitometry: The Best Way to Detect Osteoporosis and to Monitor Therapy. J. Clin. Endocrinol. Metab. 1999, 84, 1867–1871. [Google Scholar] [CrossRef]
- Chun, K.J. Bone densitometry. Semin. Nucl. Med. 2011, 41, 220–228. [Google Scholar] [CrossRef] [PubMed]
- Kozakiewicz, M.; Wach, T. Exploring the Importance of Corticalization Occurring in Alveolar Bone Surrounding a Dental Implant. J. Clin. Med. 2022, 11, 7189. [Google Scholar] [CrossRef]
- Kozakiewicz, M.; Skorupska, M.; Wach, T. What Does Bone Corticalization around Dental Implants Mean in Light of Ten Years of Follow-Up? J. Clin. Med. 2022, 11, 3545. [Google Scholar] [CrossRef] [PubMed]
- Kozakiewicz, M.; Bogusiak, K.; Hanclik, M.; Denkowski, M.; Arkuszewski, P. Noise in subtraction images made from pairs of intraoral radiographs: A comparison between four methods of geometric alignment. Dentomaxillofacial Radiol. 2008, 37, 40–46. [Google Scholar] [CrossRef]
- Kozakiewicz, M. Measures of Corticalization. J. Clin. Med. 2022, 11, 5463. [Google Scholar] [CrossRef]
- Kwiatek, J.; Jaroń, A.; Trybek, G. Impact of the 25-Hydroxycholecalciferol Concentration and Vitamin D Deficiency Treatment on Changes in the Bone Level at the Implant Site during the Process of Osseointegration: A Prospective, Randomized, Controlled Clinical Trial. J. Clin. Med. 2021, 10, 526. [Google Scholar] [CrossRef]
- Szczypiński, P.M.; Strzelecki, M.; Materka, A.; Klepaczko, A. MaZda-A software package for image texture analysis. Comput. Methods Programs Biomed. 2009, 94, 66–76. [Google Scholar] [CrossRef]
- Szczypiński, P.M.; Strzelecki, M.; Materka, A.; Klepaczko, A. MaZda—The Software Package for Textural Analysis of Biomedical Images. In Computers in Medical Activity; Springer: Berlin/Heidelberg, Germany, 2009; pp. 73–84. [Google Scholar] [CrossRef]
- Linkevicius, T.; Puisys, A.; Linkevicius, R.; Alkimavicius, J.; Gineviciute, E.; Linkeviciene, L. The influence of submerged healing abutment or subcrestal implant placement on soft tissue thickness and crestal bone stability. A 2-year randomized clinical trial. Clin. Implant. Dent. Relat. Res. 2020, 22, 497–506. [Google Scholar] [CrossRef]
- Wach, T.; Kozakiewicz, M. Are recent available blended collagen-calcium phosphate better than collagen alone or crystalline calcium phosphate? Radiotextural analysis of a 1-year clinical trial. Clin. Oral Investig. 2021, 25, 3711–3718. [Google Scholar] [CrossRef] [PubMed]
- Kozakiewicz, M.; Szymor, P.; Wach, T. Influence of General Mineral Condition on Collagen-Guided Alveolar Crest Augmentation. Materials 2020, 13, 3649. [Google Scholar] [CrossRef] [PubMed]
- Kozakiewicz, M.; Wach, T. New Oral Surgery Materials for Bone Reconstruction—A Comparison of Five Bone Substitute Materials for Dentoalveolar Augmentation. Materials 2020, 13, 2935. [Google Scholar] [CrossRef] [PubMed]
- Wach, T.; Kozakiewicz, M. Fast-Versus Slow-Resorbable Calcium Phosphate Bone Substitute Materials—Texture Analysis after 12 Months of Observation. Materials 2020, 13, 3854. [Google Scholar] [CrossRef] [PubMed]
- Haralick, R.M. Statistical and structural approaches to texture. Proc. IEEE 1979, 67, 786–804. [Google Scholar] [CrossRef]
- Materka, A.S.M. Texture analysis methods—A review, COST B11 report. In MC Meeting and Workshop; Technical University of Lodz, Institute of Electronics: Belgium, Brussels, 1998. [Google Scholar]
- Bahrami, G.; Væth, M.; Kirkevang, L.; Wenzel, A.; Isidor, F. The impact of smoking on marginal bone loss in a 10-year prospective longitudinal study. Community Dent. Oral Epidemiol. 2016, 45, 59–65. [Google Scholar] [CrossRef]
- Jansson, L.; Lavstedt, S. Influence of smoking on marginal bone loss and tooth loss—A prospective study over 20 years. J. Clin. Periodontol. 2002, 29, 750–756. [Google Scholar] [CrossRef]
- Afshari, Z.; Yaghini, J.; Naseri, R. Levels of Smoking and Peri-Implant Marginal Bone Loss: A Systematic Review and Meta-Analysis. J. Évid. Based Dent. Pr. 2022, 22, 101721. [Google Scholar] [CrossRef]
- Filipowska, J.; Tomaszewski, K.A.; Niedźwiedzki, Ł.; Walocha, J.A.; Niedźwiedzki, T. The role of vasculature in bone development, regeneration and proper systemic functioning. Angiogenesis 2017, 20, 291–302. [Google Scholar] [CrossRef]
- Siddiqui, J.A.; Partridge, N.C. Physiological Bone Remodeling: Systemic Regulation and Growth Factor Involvement. Physiology 2016, 31, 233–245. [Google Scholar] [CrossRef]
- Lin, D.; Li, Q.; Li, W.; Swain, M. Dental implant induced bone remodeling and associated algorithms. J. Mech. Behav. Biomed. Mater. 2009, 2, 410–432. [Google Scholar] [CrossRef] [PubMed]
- Mustapha, A.D.; Salame, Z.; Chrcanovic, B.R. Smoking and Dental Implants: A Systematic Review and Meta-Analysis. Medicina 2021, 58, 39. [Google Scholar] [CrossRef] [PubMed]
- Monier-Faugere, M.C.; Chris Langub, M.; Malluche, H.H. Chapter 8—Bone Biopsies: A Modern Approach. In Metabolic Bone Disease and Clinically Related Disorders, 3rd ed.; Avioli, L.V., Krane, S.M., Eds.; Academic Press: San Diego, CA, USA, 1998; pp. 237–280. Available online: https://www.sciencedirect.com/science/article/pii/B9780120687008500098 (accessed on 2 September 2007).
- Tarantino, U.; Cariati, I.; Greggi, C.; Gasbarra, E.; Belluati, A.; Ciolli, L.; Maccauro, G.; Momoli, A.; Ripanti, S.; Falez, F.; et al. Skeletal System Biology and Smoke Damage: From Basic Science to Medical Clinic. Int. J. Mol. Sci. 2021, 22, 6629. [Google Scholar] [CrossRef] [PubMed]
- Robling, A.; Duijvelaar, K.; Geevers, J.; Ohashi, N.; Turner, C. Modulation of appositional and longitudinal bone growth in the rat ulna by applied static and dynamic force. Bone 2001, 29, 105–113. [Google Scholar] [CrossRef] [PubMed]
- Chang, C.-J.; Jou, I.-M.; Wu, T.-T.; Su, F.-C.; Tai, T.-W. Cigarette smoke inhalation impairs angiogenesis in early bone healing processes and delays fracture union. Bone Jt. Res. 2020, 9, 99–107. [Google Scholar] [CrossRef]
- Wach, T.; Skorupska, M.; Trybek, G. Are Torque-Induced Bone Texture Alterations Related to Early Marginal Jawbone Loss? J. Clin. Med. 2022, 11, 6158. [Google Scholar] [CrossRef]
- Aldahlawi, S.; Demeter, A.; Irinakis, T. The effect of implant placement torque on crestal bone remodeling after 1 year of loading. Clin. Cosmet. Investig. Dent. 2018, 10, 203–209. [Google Scholar] [CrossRef]
- Barone, A.; Alfonsi, F.; Derchi, G.; Tonelli, P.; Toti, P.; Marchionni, S.; Covani, U. The Effect of Insertion Torque on the Clinical Outcome of Single Implants: A Randomized Clinical Trial. Clin. Implant. Dent. Relat. Res. 2015, 18, 588–600. [Google Scholar] [CrossRef]
- Mahesh, L.; Poonia, N. Osseodensification with Densah Burs; Jaypee Digital: London, UK, 2018; p. 287. [Google Scholar] [CrossRef]
- El-Hawary, H. A Novel Osseodensification Technique for Dental Implant Placement in Osteoporotic Patients (A Clinical Prospective Study). Egypt. J. Oral Maxillofac. Surg. 2020, 11, 118–123. [Google Scholar] [CrossRef]
- Lahens, B.; Lopez, C.D.; Neiva, R.F.; Bowers, M.M.; Jimbo, R.; Bonfante, E.A.; Morcos, J.; Witek, L.; Tovar, N.; Coelho, P.G. The effect of osseodensification drilling for endosteal implants with different surface treatments: A study in sheep. J. Biomed. Mater. Res. Part B Appl. Biomater. 2018, 107, 615–623. [Google Scholar] [CrossRef]
- Van de Velde, T.; Collaert, B.; Sennerby, L.; De Bruyn, H. Effect of Implant Design on Preservation of Marginal Bone in the Mandible. Clin. Implant. Dent. Relat. Res. 2009, 12, 134–141. [Google Scholar] [CrossRef] [PubMed]
- Ormianer, Z.; Matalon, S.; Block, J.; Kohen, J. Dental Implant Thread Design and the Consequences on Long-Term Marginal Bone Loss. Implant. Dent. 2016, 25, 471–477. [Google Scholar] [CrossRef] [PubMed]
- Raikar, S.; Talukdar, P.; Kumari, S.; Panda, S.K.; Oommen, V.M.; Prasad, A. Factors affecting the survival rate of dental implants: A retrospective study. J. Int. Soc. Prev. Community Dent. 2017, 7, 351–355. [Google Scholar] [CrossRef] [PubMed]
- Yang, Y.; Hu, H.; Zeng, M.; Chu, H.; Gan, Z.; Duan, J.; Rong, M. The survival rates and risk factors of implants in the early stage: A retrospective study. BMC Oral Health 2021, 21, 293. [Google Scholar] [CrossRef]
- Tolstunov, L. Implant Zones of the Jaws: Implant Location and Related Success Rate. J. Oral Implant. 2007, 33, 211–220. [Google Scholar] [CrossRef]
- Health, B.A. Report of the Surgeon General. Available online: http://www.surgeongeneral.gov/library (accessed on 31 December 2004).

| Inclusion Criteria |
|---|
| 18 years of age |
| Bleeding upon gingival probing < 20% |
| Probing depth ≤ 3 mm |
| Good oral hygiene |
| Regular follow-ups |
| Two-dimensional radiographs taken during the regular check |
Laboratory test:
|
| Spine densitometry |
| Smoking 1 or more cigarettes per day |
| Exclusion Criteria |
|---|
| Lack of X-ray images |
| Defective X-ray images in the visual assessment |
| Lack of laboratory tests |
Uncontrolled internal co-morbidity:
|
| History of oral radiation therapy |
| Past or current use of cytostatic drugs |
| Soft and bone tissue augmentation |
| Low-quality or lack of follow-up radiographs |
| Limitations of the Study |
|---|
| Laboratory tests have not been carried out 3 months after the research. |
| Implant Name | Titanium Alloy No. | Insertion Level | Connection Type | Connection Shape | Neck Shape | Neck Microthread | Body Shape | Body Thread | Apex Shape | Apex Hole | Apex Groove |
|---|---|---|---|---|---|---|---|---|---|---|---|
| AB Dental Devices I5 | Grade 5 | Bone level | Internal | Hexagon | Straight | No | Tapered | Square | Flat | No hole | Yes |
| ADIN Dental Implants Touareg | Grade 5 | Bone level | Internal | Hexagon | Straight | Yes | Tapered | Square | Flat | No hole | Yes |
| Alpha Bio ATI | Grade 5 | Bone level | Internal | Hexagon | Straight | Yes | Straight | Square | Flat | No hole | Yes |
| Alpha Bio OCI | Grade 5 | Bone level | Internal | Hexagon | Straight | No | Straight | No Threads | Dome | Round | No |
| Alpha Bio DFI | Grade 5 | Bone level | Internal | Hexagon | Straight | Yes | Tapered | Square | Flat | No hole | Yes |
| Alpha Bio SFB | Grade 5 | Bone level | Internal | Hexagon | Straight | No | Tapered | V-shaped | Flat | No hole | Yes |
| Alpha Bio SPI | Grade 5 | Bone level | Internal | Hexagon | Straight | Yes | Tapered | Square | Flat | No hole | Yes |
| Argon Medical Prod. K3pro Rapid | Grade 4 | Subcrestal | Internal | Conical | Straight | Yes | Tapered | V-shaped | Dome | No hole | Yes |
| Bego Semados RI | Grade 4 | Bone level | Internal | Hexagon | Straight | Yes | Tapered | Reverse buttress | Cone | No hole | Yes |
| Dentium Super Line | Grade 5 | Bone level | Internal | Conical | Straight | No | Tapered | Buttress | Dome | No hole | Yes |
| Friadent Ankylos C/X | Grade 4 | Subcrestal | Internal | Conical | Straight | No | Tapered | V-shaped | Dome | No hole | Yes |
| Implant Direct InterActive | Grade 5 | Bone level | Internal | Conical | Straight | Yes | Tapered | Reverse buttress | Dome | No hole | Yes |
| Implant Direct Legacy 3 | Grade 5 | Bone level | Internal | Hexagon | Straight | Yes | Tapered | Reverse buttress | Dome | No hole | Yes |
| MIS BioCom M4 | Grade 5 | Bone level | Internal | Hexagon | Straight | No | Straight | V-shaped | Flat | No hole | Yes |
| MIS C1 | Grade 5 | Bone level | Internal | Conical | Straight | Yes | Tapered | Reverse buttress | Dome | No hole | Yes |
| MIS Seven | Grade 5 | Bone level | Internal | Hexagon | Straight | Yes | Tapered | Reverse buttress | Dome | No hole | Yes |
| Osstem Implant Company GS III | Grade 5 | Bone level | Internal | Conical | Straight | Yes | Tapered | V-shaped | Dome | No hole | Yes |
| SGS Dental P7N | Grade 5 | Bone level | Internal | Hexagon | Straight | Yes | Tapered | V-shaped | Flat | No hole | Yes |
| TBR Implanté | Grade 5 | Bone level | Internal | Octagon | Straight | No | Straight | No threads | Flat | Round | Yes |
| Wolf Dental Conical Screw-Type | Grade 4 | Bone level | Internal | Hexagon | Straight | No | Tapered | V-shaped | Cone | No Hole | Yes |
| Observation Period | Smoker | Non-Smoker | p Value | |
|---|---|---|---|---|
| Smoking/Marginal Bone Loss | 00M | 0 mm ± 1.13 mm | 0 mm ± 0.85 mm | p < 0.05 |
| 5y | 0.42 mm ± 1.32 mm | 0 mm ± 1.25 mm | p < 0.05 | |
| Smoking/Corticalization Index | 00M | 185.98 ± 90.8 | 163.97 ± 151.9 | p < 0.05 |
| 5y | 243.17 ± 155.47 | 220.32 ± 184.97 | p = 0.85 | |
| Implant Loss to Marginal Bone Loss | 5y | 1.69 mm ± 1.73 mm | 0 mm ± 1.24 mm | p < 0.05 |
| Implant Loss Frequency | 5y | 6.74% | 2.87% | p < 0.05 |
| Observation Period | Smoker | Non-Smoker | p Value | |
|---|---|---|---|---|
| Smoking/Marginal Bone Loss | 00M | 0 mm ± 1.83 mm | 0 mm ± 0.88 mm | p < 0.05 |
| 5y | 1.10 mm ± 1.46 mm | 0 mm ± 1.09 mm | p < 0.05 | |
| Smoking/Corticalization Index | 00M | 195.81 ± 68.8 | 193.27 ± 136.54 | p = 0.85 |
| 5y | 263.87 ± 130.7 | 298.02 ± 200.1 | p = 0.68 | |
| Implant Loss to Marginal Bone Loss | 5y | 2.36 mm ± 0.94 mm | 0 mm ± 1.13 mm | p < 0.05 |
| Implant Loss Frequency | 5y | 1.66% | 1.25% | p < 0.05 |
| Observation Period | Smoker | Non-Smoker | p Value | |
|---|---|---|---|---|
| Smoking/Marginal Bone Loss | 00M | 0 mm ± 2.38 mm | 0 mm ± 0.82 mm | p < 0.05 |
| 5y | 1.42 mm ± 1.34 mm | 0 mm ± 1.29 mm | p < 0.05 | |
| Smoking/Corticalization Index | 00M | 173.50 ± 92.80 | 146.56 ± 109.65 | p < 0.05 |
| 5y | 207.06 ± 153.50 | 193.68 ± 151.10 | p = 0.81 | |
| Implant Loss to Marginal Bone Loss | 5y | 1.42 mm ± 1.34 mm | 0 mm ± 1.29 mm | p < 0.05 |
| Implant Loss Frequency | 5y | 4.34% | 1.49% | p < 0.05 |
Disclaimer/Publisher’s Note: The statements, opinions and data contained in all publications are solely those of the individual author(s) and contributor(s) and not of MDPI and/or the editor(s). MDPI and/or the editor(s) disclaim responsibility for any injury to people or property resulting from any ideas, methods, instructions or products referred to in the content. |
© 2023 by the authors. Licensee MDPI, Basel, Switzerland. This article is an open access article distributed under the terms and conditions of the Creative Commons Attribution (CC BY) license (https://creativecommons.org/licenses/by/4.0/).
Share and Cite
Wach, T.; Hadrowicz, P.; Trybek, G.; Michcik, A.; Kozakiewicz, M. Is Corticalization in Radiographs Related to a Higher Risk of Bone Loss around Dental Implants in Smoking Patients? A 5-Year Observation of Radiograph Bone-Texture Changes. J. Clin. Med. 2023, 12, 5351. https://doi.org/10.3390/jcm12165351
Wach T, Hadrowicz P, Trybek G, Michcik A, Kozakiewicz M. Is Corticalization in Radiographs Related to a Higher Risk of Bone Loss around Dental Implants in Smoking Patients? A 5-Year Observation of Radiograph Bone-Texture Changes. Journal of Clinical Medicine. 2023; 12(16):5351. https://doi.org/10.3390/jcm12165351
Chicago/Turabian StyleWach, Tomasz, Piotr Hadrowicz, Grzegorz Trybek, Adam Michcik, and Marcin Kozakiewicz. 2023. "Is Corticalization in Radiographs Related to a Higher Risk of Bone Loss around Dental Implants in Smoking Patients? A 5-Year Observation of Radiograph Bone-Texture Changes" Journal of Clinical Medicine 12, no. 16: 5351. https://doi.org/10.3390/jcm12165351
APA StyleWach, T., Hadrowicz, P., Trybek, G., Michcik, A., & Kozakiewicz, M. (2023). Is Corticalization in Radiographs Related to a Higher Risk of Bone Loss around Dental Implants in Smoking Patients? A 5-Year Observation of Radiograph Bone-Texture Changes. Journal of Clinical Medicine, 12(16), 5351. https://doi.org/10.3390/jcm12165351