

Effects of Plant-Based Extract Mixture on Alcohol Metabolism and Hangover Improvement in Humans: A Randomized, Double-Blind, Paralleled, Placebo-Controlled Clinical Trial

 , ,
, , 
Abstract
1. Introduction
2. Materials and Methods
2.1. Study Participants and Inclusion/Exclusion Criteria
2.2. Study Design
2.3. Interventions
2.4. Outcome Measures
2.4.1. Primary Outcome Measure: Acute Hangover Scale
2.4.2. Secondary Outcome Measure: Alcohol and Acetaldehyde Analysis in the Blood
Sample Handling and Collection
Alcohol and Acetaldehyde Analysis in Blood
2.5. Safety
2.6. ADH and ALDH Enzyme Activity Analysis
2.7. Statistical Analysis
3. Results
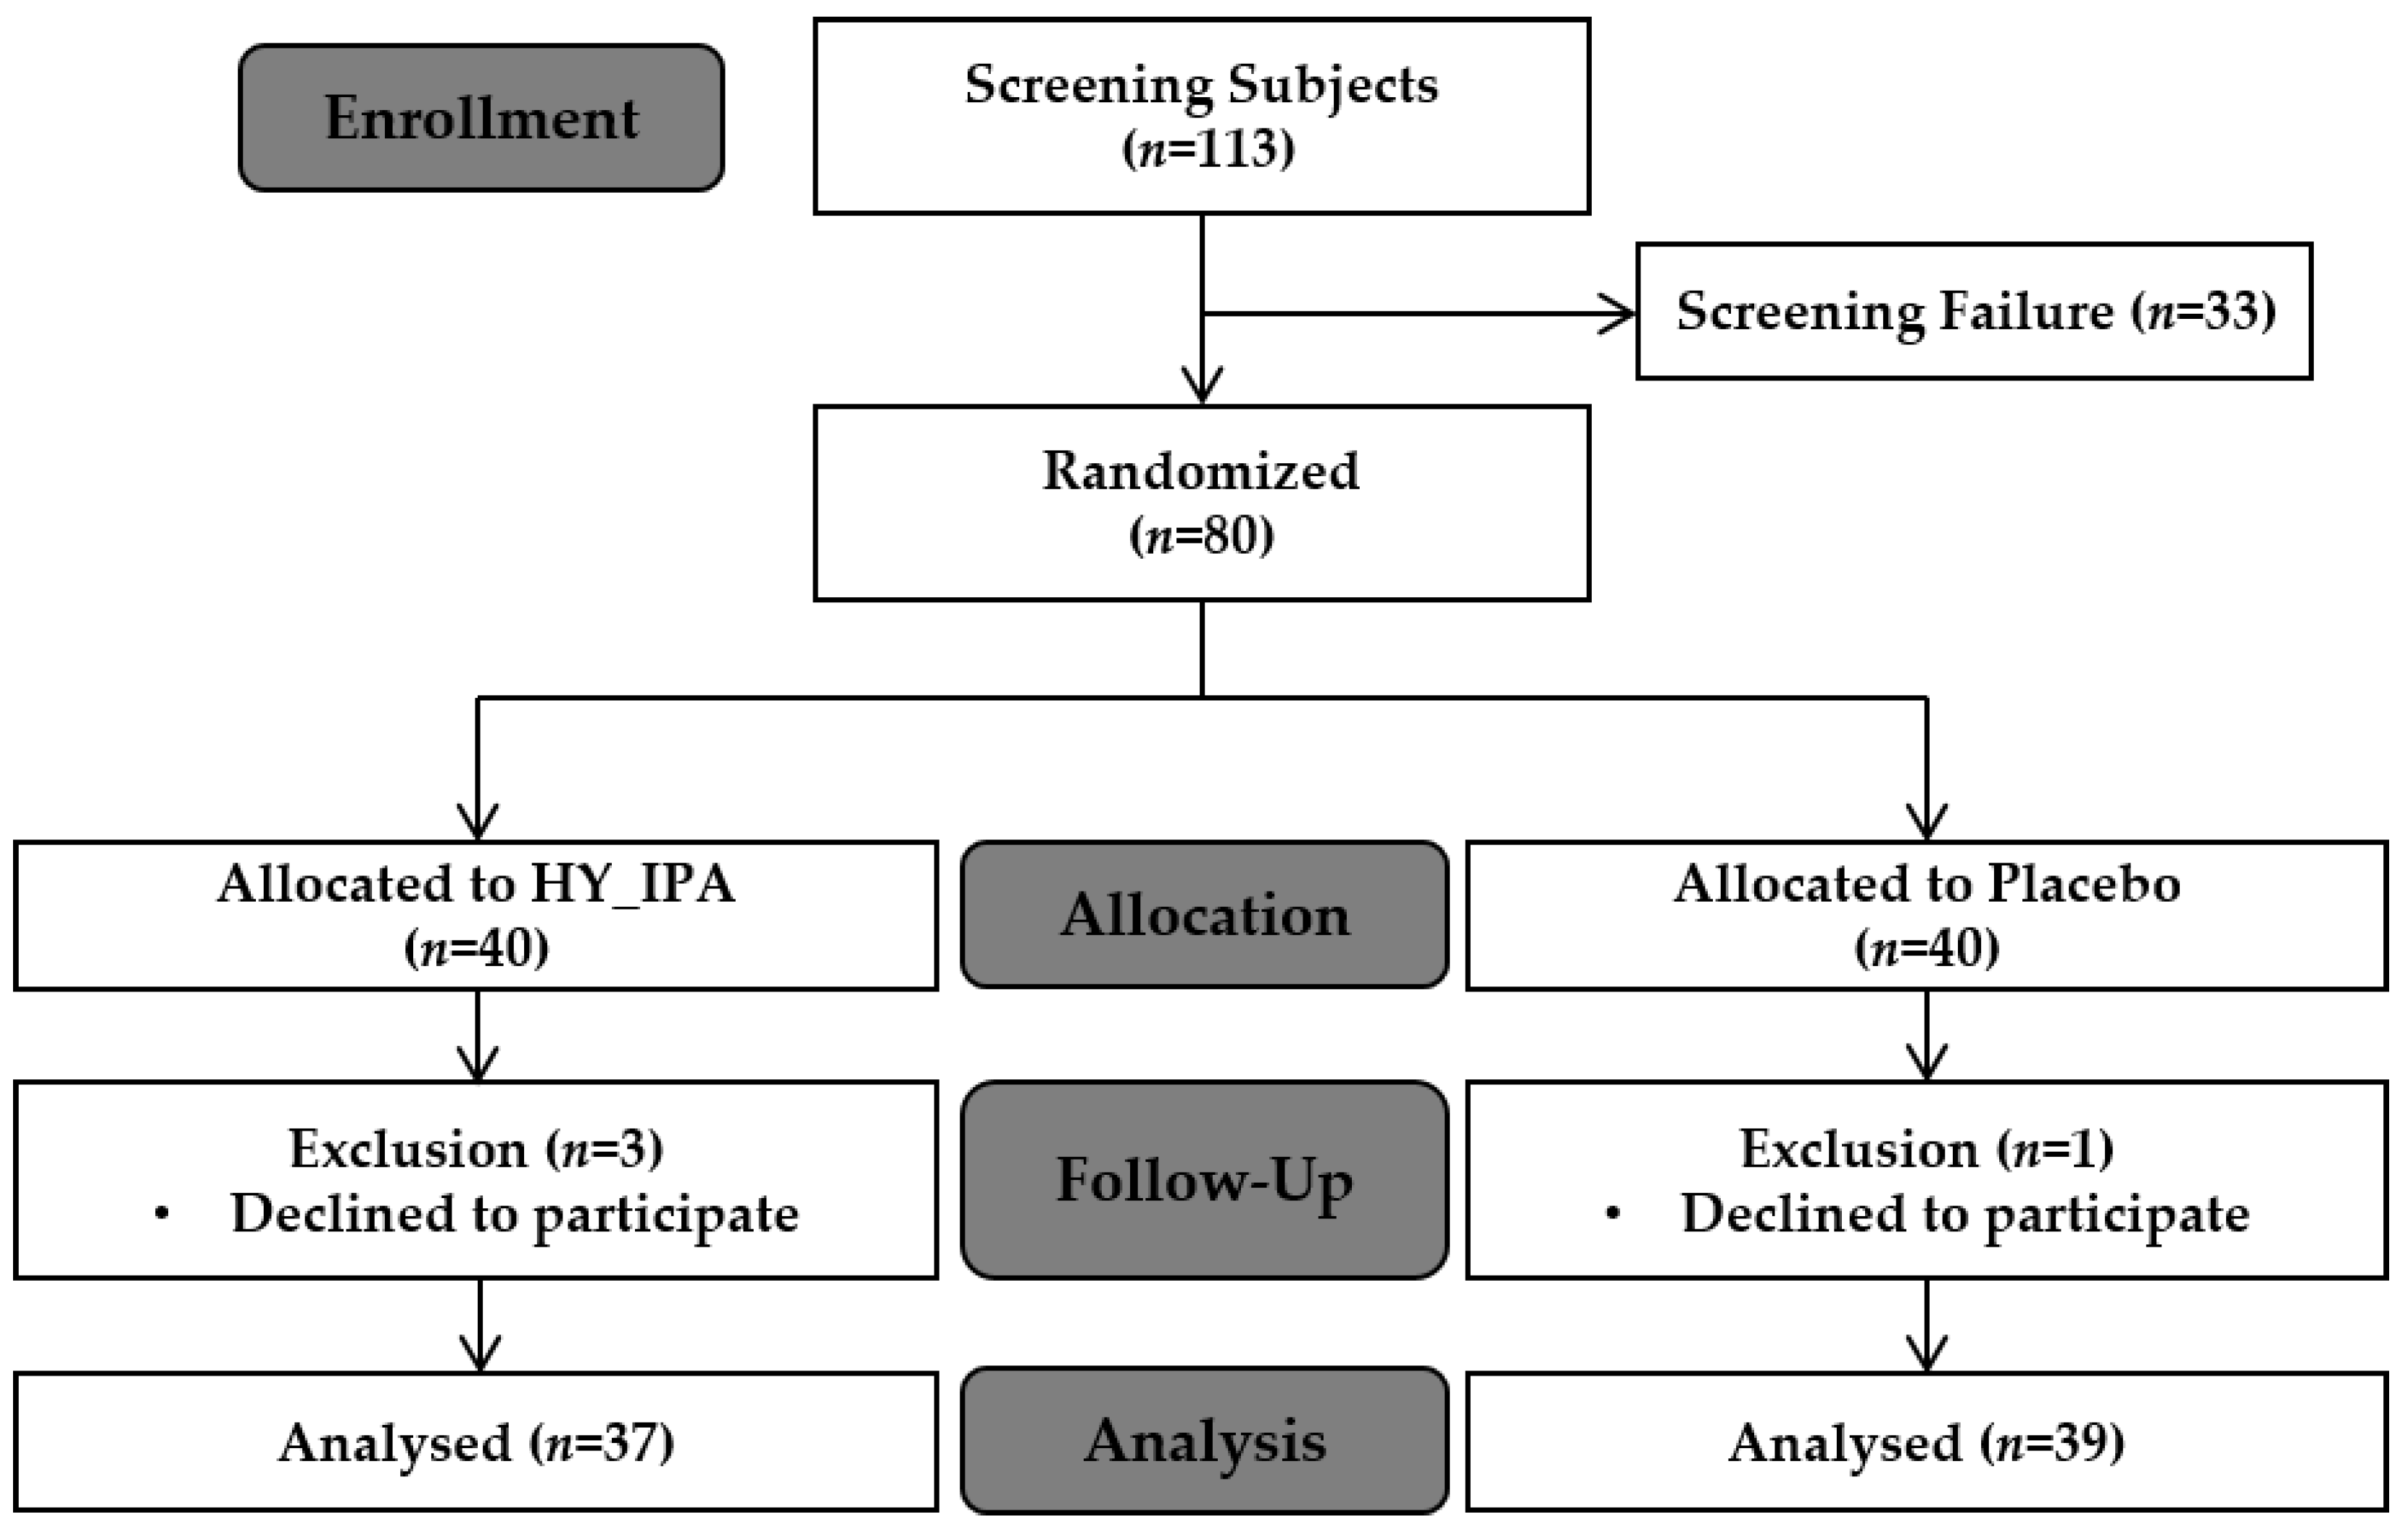
3.1. Enrollment
3.2. General Participant Characteristics
3.3. Biochemical Parameters
3.4. Survey of Hangover Symptoms
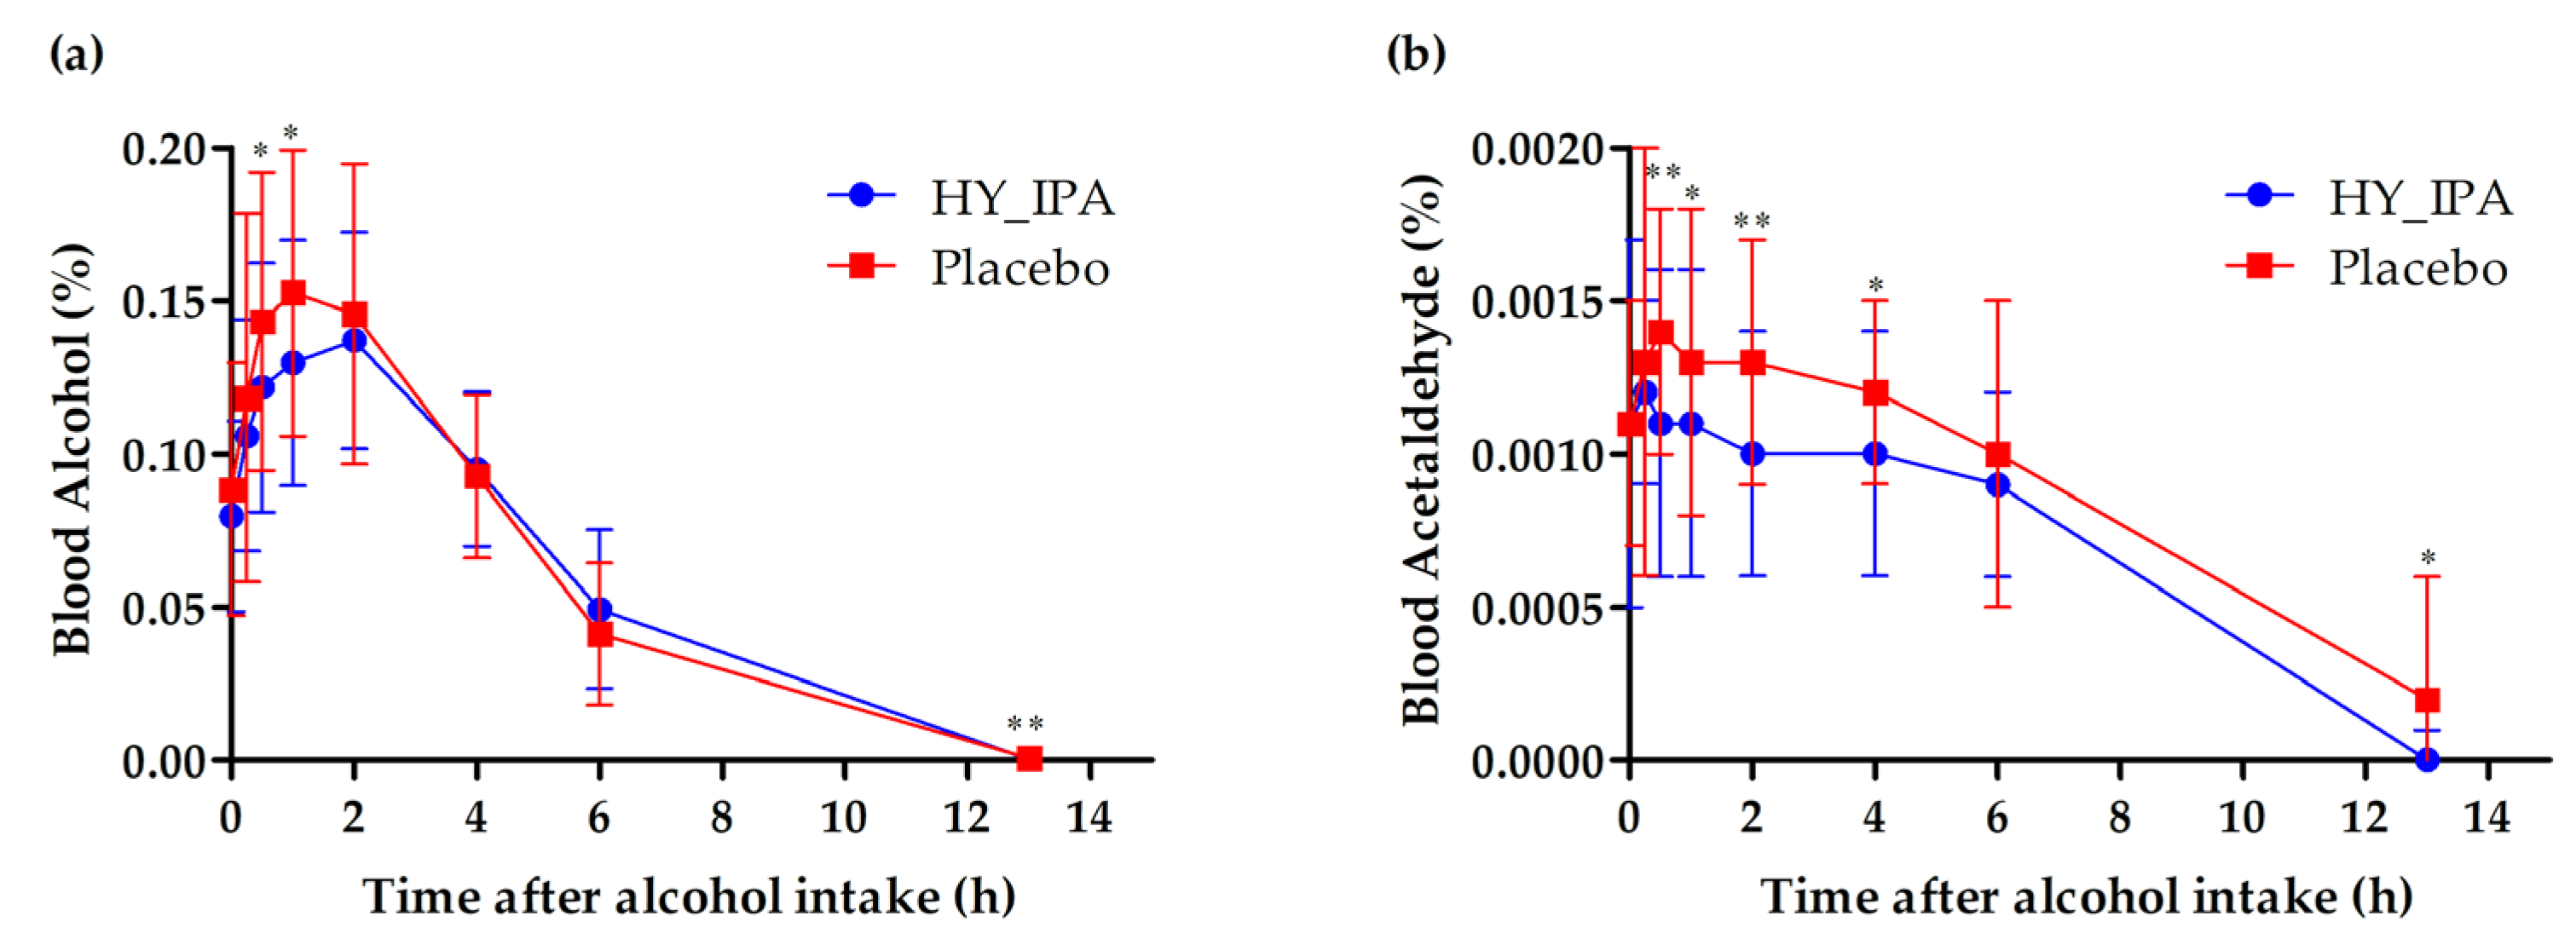
3.5. Change in Blood Alcohol and Acetaldehyde Levels
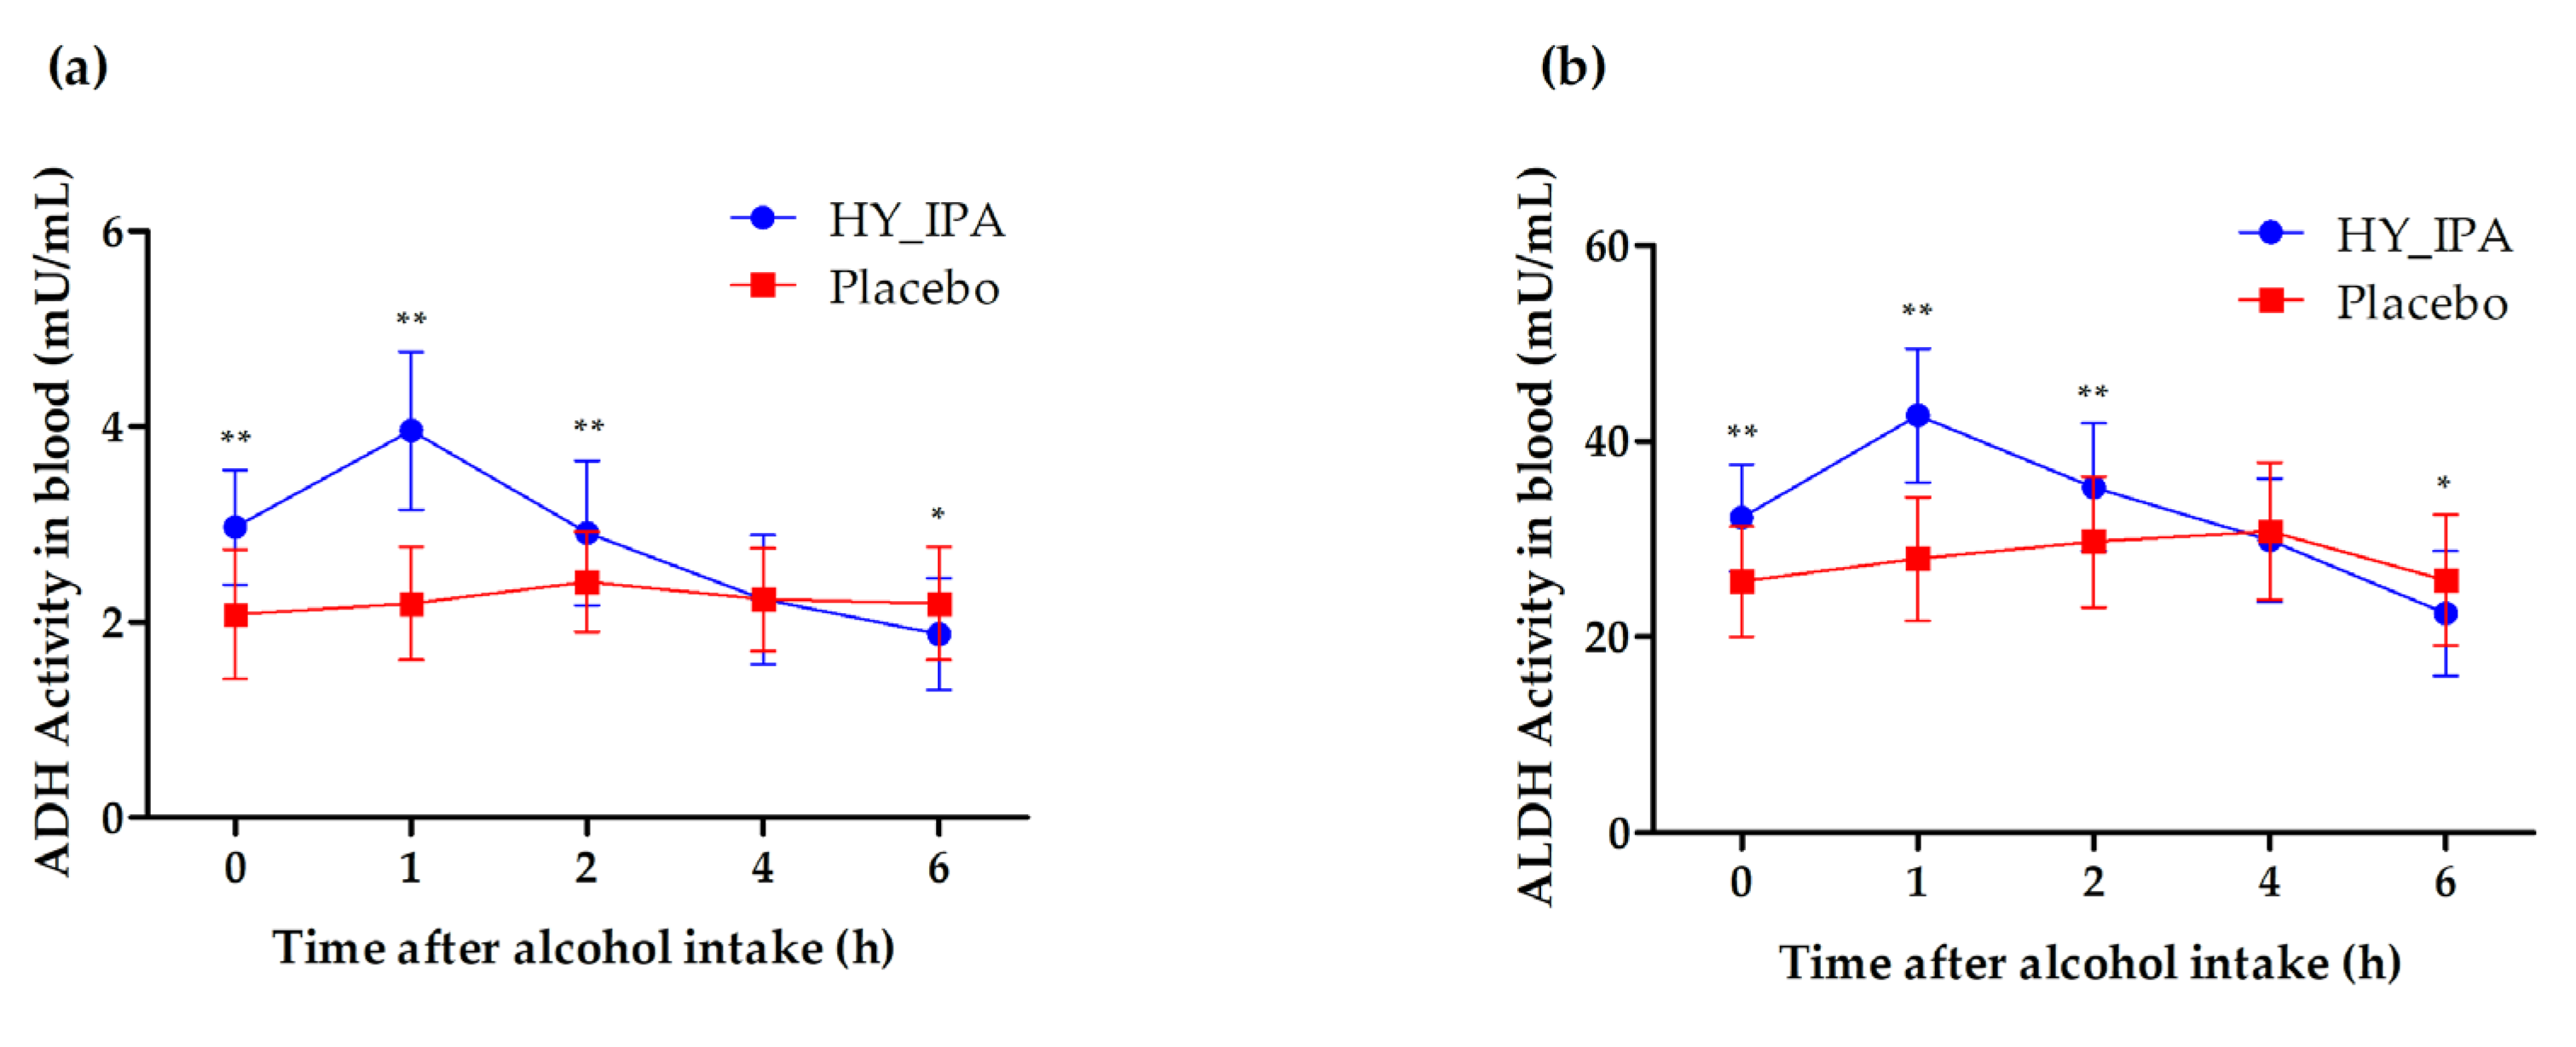
3.6. ADH and ALDH Activity in the Blood
3.7. The Association of Hangover Score and Secondary Outcomes after Alcohol Consumption
4. Discussion
5. Conclusions
Author Contributions
Funding
Institutional Review Board Statement
Informed Consent Statement
Data Availability Statement
Conflicts of Interest
References
- Van Schrojenstein Lantman, M.; van de Loo, A.J.; Mackus, M.; Verster, J.C. Development of a definition for the alcohol hangover: Consumer descriptions and expert consensus. Curr. Drug Abus. Rev. 2016, 9, 148–154. [Google Scholar] [CrossRef]
- Lieber, C.S. Alcohol and the liver: 1994 update. Gastroenterology 1994, 106, 1085–1105. [Google Scholar] [CrossRef]
- Swift, R.; Davidson, D. Alcohol Hangover: Mechanisms and mediators. Alcohol Health Res. World 1998, 22, 54–60. [Google Scholar] [PubMed]
- Cederbaum, A.I. Alcohol metabolism. Clin. Liver Dis. 2012, 16, 667–685. [Google Scholar] [CrossRef] [PubMed]
- Lieber, C.S. Relationships between nutrition, alcohol use, and liver disease. Alcohol Res. Health 2003, 27, 220–231. [Google Scholar] [PubMed]
- Rohsenow, D.J.; Howland, J.; Minsky, S.J.; Greece, J.; Almeida, A.; Roehrs, T.A. The Acute Hangover Scale: A new measure of immediate hangover symptoms. Addict. Behav. 2007, 32, 1314–1320. [Google Scholar] [CrossRef] [PubMed]
- Xu, B.J.; Zheng, Y.N.; Sung, C.K. Natural medicines for alcoholism treatment: A review. Drug Alcohol Rev. 2005, 24, 525–536. [Google Scholar] [CrossRef]
- van Wyk, A.; Baker, L. The ultimate cure for a hangover. J. Mod. Pharm. 2001, 8, 9–10. [Google Scholar]
- Roberts, E.; Smith, R.; Hotopf, M.; Drummond, C. The efficacy and tolerability of pharmacologically active interventions for alcohol-induced hangover symptomatology: A systematic review of the evidence from randomised placebo-controlled trials. Addiction 2022, 117, 2157–2167. [Google Scholar] [CrossRef] [PubMed]
- Piasecki, T.M.; Sher, K.J.; Slutske, W.S.; Jackson, K.M. Hangover Frequency and Risk for Alcohol Use Disorders. J. Abnorm. Psychol. 2005, 114, 223–234. [Google Scholar] [CrossRef]
- Arias, A.J.; Gelernter, J.; Gueorguieva, R.; Ralevski, E.; Petrakis, I.L. Pharmacogenetics of naltrexone and disulfiram in alcohol dependent, dually diagnosed veterans. Am. J. Addict. 2014, 23, 288–293. [Google Scholar] [CrossRef] [PubMed]
- Stromberg, M.F.; Mackler, S.A.; Volpicelli, J.R.; O’Brien, C.P. Effect of acamprosate and naltrexone, alone or in combination, on ethanol consumption. Alcohol 2001, 23, 109–116. [Google Scholar] [CrossRef] [PubMed]
- Johnson, B.A.; Ait-Daoud, N.; Akhtar, F.Z.; Ma, J.Z. Oral topiramate reduces the consequences of drinking and improves the quality of life of alcohol-dependent individuals: A randomized controlled trial. Arch. Gen. Psychiatry 2004, 61, 905–912. [Google Scholar] [CrossRef] [PubMed]
- Wang, F.; Li, Y.; Zhang, Y.J.; Zhou, Y.; Li, S.; Li, H.B. Natural products for the prevention and treatment of hangover and alcohol use disorder. Molecules 2016, 21, 64. [Google Scholar] [CrossRef]
- Lee, S.Y.; Choi, H.D.; Yu, S.N.; Kim, S.H.; Park, S.K.; Ahn, S.C. Biological activities of Mesembryanthemum crystallinum (ice plant) extract. J. Life Sci. 2015, 25, 638–645. [Google Scholar] [CrossRef]
- Jin, Y.H.; Hong, J.H.; Lee, J.-H.; Yoon, H.; Pawluk, A.M.; Yun, S.J.; Mah, J.-H. Lactic acid fermented green tea with Levilactobacillus brevis capable of producing γ-aminobutyric acid. Fermentation 2021, 7, 110. [Google Scholar] [CrossRef]
- Lim, S.-D.; Kim, K.-S. Effects and utilization of GABA. J. Dairy. Sci. Biotechnol. 2009, 27, 45–51. [Google Scholar]
- McGregor, N.R. Pueraria lobata (Kudzu root) hangover remedies and acetaldehyde-associated neoplasm risk. Alcohol 2007, 41, 469–478. [Google Scholar] [CrossRef]
- Yamazaki, T.; Hosono, T.; Matsushita, Y.; Kawashima, K.; Someya, M.; Nakajima, Y.; Narui, K.; Hibi, Y.; Ishizaki, M.; Kinjo, J.; et al. Pharmacological studies on Puerariae Flos. IV: Effects of Pueraria thomsonii dried flower extracts on blood ethanol and acetaldehyde levels in humans. Int. J. Clin. Pharmacol. Res. 2002, 22, 23–28. [Google Scholar]
- Kordali, S.; Cakir, A.; Mavi, A.; Kilic, H.; Yildirim, A. Screening of chemical composition and antifungal and antioxidant activities of the essential oils from three Turkish Artemisia species. J. Agric. Food Chem. 2005, 53, 1408–1416. [Google Scholar] [CrossRef]
- Lee, H.I.; Seo, K.O.; Yun, K.W.; Kim, M.J.; Lee, M.K. Comparative Study of the hepatoprotective Efficacy of Artemisia iwayomogi and Artemisia capillaris on Ethanol-Administered Mice. J. Food Sci. 2011, 76, T207–T211. [Google Scholar] [CrossRef] [PubMed]
- Verster, J.C.; Penning, R. Treatment and prevention of alcohol hangover. Curr. Drug Abus. Rev. 2010, 3, 103–109. [Google Scholar] [CrossRef] [PubMed]
- Carai, M.A.M.; Agabio, R.; Bombardelli, E.; Bourov, I.; Gessa, G.L.; Lobina, C.; Morazzoni, P.; Pani, M.; Reali, R.; Vacca, G.; et al. Potential use of medicinal plants in the treatment of alcoholism. Fitoterapia 2000, 71 (Suppl. S1), S38–S42. [Google Scholar] [CrossRef] [PubMed]
- Verster, J.C.; Dahl, T.; Scholey, A.; Iversen, J. The Effects of SJP-001 on Alcohol Hangover Severity: A Pilot Study. J. Clin. Med. 2020, 9, 932. [Google Scholar] [CrossRef]
- Verster, J.C.; Stephens, R.; Penning, R.; Rohsenow, D.; McGeary, J.; Levy, D.; McKinney, A.; Finnigan, F.; Piasecki, T.M.; Adan, A.; et al. The Alcohol Hangover Research Group consensus statement on best practice in alcohol hangover research. Curr. Drug Abus. Rev. 2010, 3, 116–127. [Google Scholar] [CrossRef]
- Penning, R.; McKinney, A.; Bus, L.D.; Olivier, B.; Slot, K.; Verster, J.C. Measurement of alcohol hangover severity: Development of the Alcohol Hangover Severity Scale (AHSS). Psychopharmacology 2013, 225, 803–810. [Google Scholar] [CrossRef] [PubMed]
- Ylikahri, R.; Huttunen, M.; Harkonen, M. Effect of alcohol on anterior-pituitary secretion of trophic hormones. Lancet 1976, 307, 1353. [Google Scholar] [CrossRef] [PubMed]
- Ylikahri, R.H.; Huttunen, M.O.; Härkönen, M.; Leino, T.; Helenius, T.; Liewendahl, K.; Karonen, S.L. Acute effects of alcohol on anterior pituitary secretion of the tropic hormones. J. Clin. Endocrinol. Metab. 1978, 46, 715–720. [Google Scholar] [CrossRef]
- Linkola, J.; Fyhrquist, F.; Nieminen, M.M.; Weber, T.H.; Tontti, K. Renin-aldosterone axis in ethanol intoxication and hangover. Eur. J. Clin. Investig. 1976, 6, 191–194. [Google Scholar] [CrossRef]
- Linkola, J.; Ylikahri, R.; Fyhquist, F.; Wallenius, M. Plasma vasopressin in ethanol intoxication and hangover. Acta Physiol. Scand. 1978, 104, 180–187. [Google Scholar] [CrossRef]
- Heikkonen, E.; Ylikahri, R.; Roine, R.; Välimäki, M.; Härkönen, M.; Salaspuro, M. The combined effect of alcohol and physical exercise on serum testosterone, luteinizing hormone, and cortisol in males. Alcohol. Clin. Exp. Res. 1996, 20, 711–716. [Google Scholar] [CrossRef] [PubMed]
- Heikkonen, E.; Ylikahri, R.; Roine, R.; Välimäki, M.; Härkönen, M.; Salaspuro, M. Effect of alcohol on exercise-induced changes in serum glucose and serum free fatty acids. Alcohol. Clin. Exp. Res. 1998, 22, 437–443. [Google Scholar] [CrossRef] [PubMed]
- Mäki, T.; Toivonen, L.; Koskinen, P.; Näveri, H.; Härkönen, M.; Leinonen, H. Effect of ethanol drinking, hangover, and exercise on adrenergic activity and heart rate variability in patients with a history of alcohol-induced atrial fibrillation. Am. J. Cardiol. 1998, 82, 317–322. [Google Scholar] [CrossRef]
- van Lawick van Pabst, A.E.; Devenney, L.E.; Verster, J.C. Sex differences in the presence and severity of alcohol hangover symptoms. J. Clin. Med. 2019, 8, 867. [Google Scholar] [CrossRef]
- Slutske, W.S.; Piasecki, T.M.; Hunt-Carter, E.E. Development and initial validation of the Hangover Symptoms Scale: Prevalence and correlates of hangover symptoms in college students. Alcohol. Clin. Exp. Res. 2003, 27, 1442–1450. [Google Scholar] [CrossRef]
- Mumenthaler, M.S.; Taylor, J.L.; O’Hara, R.; Yesavage, J.A. Gender differences in moderate drinking effects. Alcohol Res. Health 1999, 23, 55–64. [Google Scholar]
- Ely, M.; Hardy, R.; Longford, N.T.; Wadsworth, M.E. Gender differences in the relationship between alcohol consumption and drink problems are largely accounted for by body water. Alcohol Alcohol. 1999, 34, 894–902. [Google Scholar] [CrossRef] [PubMed]
- Zimatkin, S.M. Histochemical study of aldehyde dehydrogenase in the rat CNS. J. Neurochem. 1991, 56, 1–11. [Google Scholar] [CrossRef] [PubMed]
- Van De Loo, A.J.; Mackus, M.; Kwon, O.; Krishnakumar, I.M.; Garssen, J.; Kraneveld, A.D.; Scholey, A.; Verster, J.C. The Inflammatory Response to Alcohol Consumption and Its Role in the Pathology of Alcohol Hangover. J. Clin. Med. 2020, 9, 2081. [Google Scholar] [CrossRef]
- Mackus, M.; Van de Loo, A.J.A.E.; Garssen, J.; Kraneveld, A.D.; Verster, J.C. The association between ethanol elimination rate and hangover severity. Int. J. Environ. Res. Public Health 2020, 17, 4324. [Google Scholar] [CrossRef]
- Jamal, M.; Ameno, K.; Tanaka, N.; Ito, A.; Takakura, A.; Kumihashi, M.; Kinoshita, H. Ethanol and Acetaldehyde After Intraperitoneal Administration to Aldh2-Knockout Mice-Reflection in Blood and Brain Levels. Neurochem. Res. 2016, 41, 1029–1034. [Google Scholar] [CrossRef] [PubMed]
- Kim, K.J.; Park, S.-Y.; Park, T.G.; Park, H.-J.; Kim, Y.-J.; Kim, E.J.; Shin, W.; Kim, A.; Yoo, H.; Kweon, M.; et al. Noni fruit extract ameliorates alcohol-induced hangover symptoms by reducing the concentrations of alcohol and acetaldehyde in a Sprague Dawley rat model and a human intervention study. Food Funct. 2023, 14, 1750–1760. [Google Scholar] [CrossRef] [PubMed]
- Kim, W.-H.; Lee, H.-J.; Lee, D.-Y.; Lee, C.-Y.; Oh, J.-H.; Kim, J.-E.; Tan, K.V.; Kang, S.-K.; Kim, B.; Hong, S.-B.; et al. Preventive effects of standardized krill oil on alcohol hangovers in a clinical trial. J. Funct. Foods 2022, 94, 105142. [Google Scholar] [CrossRef]
- Woo, M.; Cha, J.H.; Kim, Y.; Kang, H.-T.; Kim, H.; Cho, K.; Park, S.; Lee, J.H. Evaluation of the effects of Hangover-releasing agent containing freeze-dried mature silkworm larval powder (SMSP) on alcohol metabolism and hangover improvement. Korean J. Food Sci. Technol. 2021, 53, 72–77. [Google Scholar] [CrossRef]
- Mammen, R.R.; Natinga Mulakal, J.; Mohanan, R.; Maliakel, B.; Krishnakumar, I.M. Clove bud polyphenols alleviate alterations in inflammation and oxidative stress markers associated with binge drinking: A randomized double-blinded placebo-controlled crossover study. J. Med. Food 2018, 21, 1188–1196. [Google Scholar] [CrossRef]
- Lee, H.S.; Isse, T.; Kawamoto, T.; Baik, H.W.; Park, J.Y.; Yang, M. Effect of Korean pear (Pyruspyrifolia cv. Shingo) juice on hangover severity following alcohol consumption. Food Chem. Toxicol. 2013, 58, 101–106. [Google Scholar] [CrossRef]
- Kim, H.; Kim, Y.J.; Jeong, H.Y.; Kim, J.Y.; Choi, E.K.; Chae, S.W.; Kwon, O. A standardized extract of the fruit of Hovenia dulcis alleviated alcohol-induced hangover in healthy subjects with heterozygous ALDH2: A randomized, controlled, crossover trial. J. Ethnopharmacol. 2017, 209, 167–174. [Google Scholar] [CrossRef]
- Heit, C.; Eriksson, P.; Thompson, D.C.; Charkoftaki, G.; Fritz, K.S.; Vasiliou, V. Quantification of Neural Ethanol and Acetaldehyde Using Headspace GC-MS. Alcohol. Clin. Exp. Res. 2016, 40, 1825–1831. [Google Scholar] [CrossRef]
- Yokoyama, M.; Yokoyama, A.; Yokoyama, T.; Funazu, K.; Hamana, G.; Kondo, S.; Yamashita, T.; Nakamura, H. Hangover susceptibility in relation to aldehyde dehydrogenase-2 genotype, alcohol flushing, and mean corpuscular volume in Japanese workers. Alcohol. Clin. Exp. Res. 2005, 29, 1165–1171. [Google Scholar] [CrossRef]
- Dong-Sik Yang, S.-G.I.; Sun-Mi Choi, B.-N.K.; Sung, H.-J.; Yoon, Y. Effect of an oriental herbal composition, Jang Baek union (JBU), on alcohol–induced hangover and CCl4–induced liver injury in rats. J. Korean Soc. Food Sci. Nutr. 2004, 33, 78–82. [Google Scholar] [CrossRef]
- Park, S.-M.; Kang, B.-K.; Chung, T.-H. The effect of mildronate on serum alcohol concentration and hangover syndrome. J. Korean Soc. Food Sci. Nutr. 1998, 27, 168–174. [Google Scholar]
- Theorell, H.; Bonnichsen, R.; Holtermann, H.; Sörensen, J.S.; Sörensen, N.A. Studies on liver alcohol dehydrogenase. Acta Chem. Scand. 1951, 5, 1105–1126. [Google Scholar] [CrossRef]
- Lieber, C.S. Liver adaptation and injury in alcoholism. N. Engl. J. Med. 1973, 288, 356–362. [Google Scholar] [CrossRef] [PubMed]
- Mackus, M.; van de Loo, A.J.V.; Garssen, J.; Kraneveld, A.D.; Scholey, A.; Verster, J.C. The role of alcohol metabolism in the pathology of alcohol hangover. J. Clin. Med. 2020, 9, 3421. [Google Scholar] [CrossRef] [PubMed]
- Boby, N.; Lee, E.B.; Abbas, M.A.; Park, N.H.; Lee, S.P.; Ali, M.S.; Lee, S.J.; Park, S.C. Ethanol-induced hepatotoxicity and alcohol metabolism regulation by GABA-enriched fermented smilax China root extract in rats. Foods. 2021, 10, 238. [Google Scholar] [CrossRef]
- Keung, W.M.; Vallee, B.L. Kudzu root: An ancient Chinese source of modern antidipsotropic agents. Phytochemistry 1998, 47, 499–506. [Google Scholar] [CrossRef]
- Shin, J.E.; Bae, E.A.; Lee, Y.C.; Ma, J.Y.; Kim, D.H. Estrogenic effect of main components kakkalide and tectoridin of Puerariae Flos and their metabolites. Biol. Pharm. Bull. 2006, 29, 1202–1206. [Google Scholar] [CrossRef]
- Kim, C.; Shin, S.; Ha, H.; Kim, J.M. Study of substance changes in flowers of Pueraria thunbergiana Benth. during storage. Arch. Pharm. Res. 2003, 26, 210–213. [Google Scholar] [CrossRef]
- Niiho, Y.; Yamazaki, T.; Nakajima, Y.; Itoh, H.; Takeshita, T.; Kinjo, J.; Nohara, T. Pharmacological studies on Puerariae Flos. I. The effects of Puerariae Flos on alcoholic metabolism and spontaneous movement in mice. Yakugaku Zasshi J. Pharm. Soc. Jpn. 1989, 109, 424–431. [Google Scholar] [CrossRef]
- Yamazaki, T.; Nakajima, Y.; Niho, Y.; Hosono, T.; Kurashige, T.; Kinjo, J.; Nohara, T. Pharmacological studies on Puerariae flos III: Protective effects of kakkalide on ethanol-induced lethality and acute hepatic injury in mice. J. Pharm. Pharmacol. 1997, 49, 831–833. [Google Scholar] [CrossRef]
- Zhang, Z.; Li, S.; Jiang, J.; Yu, P.; Liang, J.; Wang, Y. Preventive effects of Flos Perariae (Gehua) water extract and its active ingredient puerarin in rodent alcoholism models. Chin. Med. 2010, 5, 36. [Google Scholar] [CrossRef] [PubMed]
- Chen, X.; Cai, F.; Guo, S.; Ding, F.; He, Y.; Wu, J.; Liu, C. Protective effect of Flos puerariae extract following acute alcohol intoxication in mice. Alcohol. Clin. Exp. Res. 2014, 38, 1839–1846. [Google Scholar] [CrossRef] [PubMed]
- Xiong, Y.; Yang, Y.; Yang, J.; Chai, H.; Li, Y.; Yang, J.; Jia, Z.; Wang, Z. Tectoridin, an isoflavone glycoside from the flower of Pueraria lobata, prevents acute alcohol-induced liver steatosis in mice. Toxicology 2010, 276, 64–72. [Google Scholar] [CrossRef]
- Park, S.; Noh, J.; Ko, Y.; Han, D.; Ly, S. Improve effects of Artemisia capillaris water extract on patient with fatty Liver disease. Korean Living Sci. Assoc. 2007, 2, 169–170. [Google Scholar]
- Nam, S.-M.; Ham, S.-S.; Oh, D.-H.; Kang, I.-J.; Lee, S.-Y.; Chung, C.-K. Effects of Artemisia iwayomogi Kitamura ethanol extract on lowering serum and liver lipids in rats. J. Korean Soc. Food Sci. Nutr. 1998, 27, 338–343. [Google Scholar]
- Kim, M.J.; Lee, C.H. The effects of extracts from mugwort on the blood ethanol concentration and liver function. Korean J. Food Sci. Anim. Resour. 1998, 18, 348–357. [Google Scholar]


| HY_IPA N = 37 | Placebo N = 39 | Total N = 76 | p-Value | ||
|---|---|---|---|---|---|
| Sex n (%) | Male Female | 23 (62.16) 14 (37.84) | 22 (56.41) 17 (43.59) | 45 (59.21) 31 (40.79) | 0.6101 (C) |
| Fertility n (%) | Yes No | 14 (100.00) 0 (0.00) | 17 (100.00) 0 (0.00) | 31 (100.00) 0 (0.00) | |
| Age (Years) | Mean ± SD Min, Max | 29.00 ± 5.70 21.00, 40.00 | 28.69 ± 4.59 20.00, 39.00 | 28.84 ± 5.13 20.00, 40.00 | 0.7958 (T) |
| Exercise n (%) | No 1~2 per week 3~4 per week 5~6 per week Every day | 7 (18.92) 12 (32.43) 17 (45.95) 1 (2.70) 0 (0.00) | 10 (25.64) 15 (38.46) 13 (33.33) 0 (0.00) 1 (2.56) | 17 (22.37) 27 (35.53) 30 (39.47) 1 (1.32) 1 (1.32) | 0.5576 (F) |
| Smoking n (%) | No Over 1 year Less than 1 year Smoking | 18 (48.65) 2 (5.41) 3 (8.11) 14 (37.84) | 22 (56.41) 3 (7.69) 1 (2.56) 13 (33.33) | 40 (52.63) 5 (6.58) 4 (5.26) 27 (35.53) | 0.6844 (F) |
| Quantity of Alcohol consumption (g/week) | Mean ± SD Min, Max | 68.42 ± 34.08 22.61, 144.13 | 69.59 ± 43.29 8.83, 192.17 | 69.02 ± 38.81 8.83, 192.17 | 0.9386 (W) |
| Frequency of Alcohol consumption (times/week) | Mean ± SD Min, Max | 1.54 ± 0.69 1, 4 | 1.62 ± 0.75 1, 4 | 1.58 ± 0.72 1, 4 | 0.6958 (W) |
| Height (cm) | Mean ± SD Min, Max | 170.65 ± 8.89 151.80, 188.00 | 169.06 ± 8.85 153.30, 183.10 | 169.83 ± 8.85 151.80, 188.00 | 0.4349 (T) |
| BMI (kg/m2) | Mean ± SD Min, Max | 22.66 ± 2.01 19.10, 24.90 | 22.50 ± 1.76 18.90, 24.70 | 22.58 ± 1.88 18.90, 24.90 | 0.3968 (W) |
| Variable | HY_IPA (N = 37) | Placebo (N = 39) | p-Value | ||||
|---|---|---|---|---|---|---|---|
| Baseline | Visit 2 (Day 1) | Change | Baseline | Visit 2 (Day 1) | Change | ||
| Systolic pressure (mmHg) | 122.03 ± 11.12 | 110.57 ± 10.82 | −11.27 ± 13.18 | 123.10 ± 10.90 | 110.92 ± 9.96 | −12.03 ± 9.60 | 0.7752 (T) |
| Diastolic pressure (mmHg) | 74.59 ± 7.04 | 70.41 ± 7.76 | −3.76 ± 8.72 | 74.40 ± 7.93 | 69.67 ± 7.25 | −4.69 ± 8.43 | 0.6358 (T) |
| Pulse (bmp) | 79.05 ± 10.06 | 74.41 ± 10.21 | −4.59 ± 12.02 | 79.93 ± 10.69 | 75.79 ± 9.14 | −3.87 ± 10.30 | 0.7788 (T) |
| Weight (kg) | 66.01 ± 11.27 | 66.19 ± 11.98 | −0.37 ± 1.28 | 64.65 ± 9.84 | 64.15 ± 10.19 | −0.56 ± 1.09 | 0.6361 (W) |
| AST (GOT) (U/L) | 20.82 ± 5.54 | 21.84 ± 7.10 | 0.84 ± 6.06 | 21.98 ± 6.07 | 22.10 ± 5.96 | −0.03 ± 6.01 | 0.5139 (W) |
| ALT (GPT) (U/L) | 15.44 ± 8.49 | 17.57 ± 8.39 | 1.73 ± 3.65 | 18.00 ± 7.93 | 18.21 ± 7.55 | 0.28 ± 6.75 | 0.0323 (W) |
| γ-GPT (U/L) | 23.44 ± 12.15 | 22.11 ± 12.12 | −1.76 ± 3.88 | 24.93 ± 12.89 | 23.64 ± 12.54 | −1.46 ± 3.87 | 0.3194 (W) |
| Total cholesterol (mg/dL) | 193.13 ± 24.33 | 182.54 ± 25.92 | −11.51 ± 15.74 | 193.13 ± 29.88 | 187.74 ± 32.08 | −5.72 ± 18.07 | 0.1411 (T) |
| Glucose (mg/dL) | 91.08 ± 4.57 | 89.16 ± 5.54 | −1.89 ± 7.28 | 90.03 ± 6.20 | 88.56 ± 7.42 | −1.49 ± 7.67 | 0.8143 (T) |
| Total protein (g/dL) | 7.33 ± 0.29 | 6.92 ± 0.36 | −0.41 ± 0.35 | 7.29 ± 0.30 | 6.98 ± 0.29 | −0.32 ± 0.33 | 0.2488 (T) |
| BUN (mg/dL) | 12.34 ± 2.92 | 13.11 ± 1.57 | 0.61 ± 3.12 | 11.58 ± 3.28 | 12.68 ± 2.86 | 1.08 ± 2.66 | 0.4831 (T) |
| Creatinine (mg/dL) | 0.79 ± 0.19 | 0.76 ± 0.15 | −0.03 ± 0.10 | 0.77 ± 0.20 | 0.76 ± 0.17 | −0.01 ± 0.09 | 0.3623 (T) |
| Uric acid (mg/dL) | 5.38 ± 1.22 | 5.50 ± 1.13 | 0.11 ± 0.61 | 5.36 ± 1.23 | 5.45 ± 1.14 | 0.07 ± 0.56 | 0.7440 (T) |
| Ca (mg/dL) | 9.23 ± 0.27 | 8.95 ± 0.29 | −0.29 ± 0.30 | 9.19 ± 0.30 | 9.00 ± 0.28 | −0.20 ± 0.29 | 0.1564 (T) |
| HY_IPA N = 37 Mean ± SD | Placebo N = 39 Mean ± SD | p-Value | |
|---|---|---|---|
| Total score | 5.24 ± 5.78 | 18.54 ± 18.50 | <0.0001 (W) |
| Hangover | 0.57 ± 0.96 | 2.41 ± 2.45 | 0.0002 (W) |
| Thirst | 1.86 ± 2.00 | 4.26 ± 2.22 | <0.0001 (W) |
| Tired | 1.32 ± 1.51 | 3.56 ± 2.19 | <0.0001 (W) |
| Headache | 0.65 ± 1.18 | 1.90 ± 2.50 | 0.0177 (W) |
| Dizziness/faintness | 0.11 ± 0.46 | 1.05 ± 2.01 | 0.0043 (W) |
| Loss of appetite | 0.35 ± 0.89 | 1.56 ± 2.39 | 0.0106 (W) |
| Stomachache | 1.56 ± 2.39 | 1.36 ± 2.35 | 0.0007 (W) |
| Nausea | 0.16 ± 0.69 | 1.23 ± 2.30 | 0.0032 (W) |
| Heart racing | 0.08 ± 0.36 | 1.21 ± 2.41 | 0.0074 (W) |
| Indicators | Male (N = 45) | Female (N = 31) | ||||
|---|---|---|---|---|---|---|
| HY_IPA (N = 23) | Placebo (N = 22) | p-Value | HY_IPA (N = 14) | Placebo (N = 17) | p-Value | |
| Total score | 5.30 ± 6.64 | 17.32 ± 19.26 | 0.0102 (W) | 5.07 ± 4.18 | 20.06 ± 17.95 | <0.001 (W) |
| Hangover | 0.52 ± 1.04 | 1.73 ± 2.27 | 0.0306 (W) | 0.64 ± 0.84 | 3.29 ± 2.44 | <0.001 (W) |
| Thirst | 2.13 ± 2.34 | 4.18 ± 2.36 | 0.0055 (W) | 1.43 ± 1.22 | 4.35 ± 2.09 | <0.001 (W) |
| Tired | 1.22 ± 1.68 | 3.09 ± 2.33 | 0.0038 (W) | 1.5 ± 1.22 | 4.18 ± 1.88 | <0.001 (W) |
| Headache | 0.48 ± 0.99 | 1.59 ± 2.56 | 0.0671 (W) | 0.86 ± 1.46 | 2.29 ± 2.44 | 0.053 (W) |
| Dizziness/faintness | 0.09 ± 0.42 | 1.18 ± 2.28 | 0.0372 (W) | 0.14 ± 0.53 | 0.88 ± 1.65 | 0.0979 (W) |
| Loos of appetite | 0.48 ± 1.04 | 1.73 ± 2.37 | 0.0311 (W) | 0.14 ± 0.53 | 1.35 ± 2.47 | 0.0656 (W) |
| Stomachache | 0.13 ± 0.63 | 1.41 ± 2.20 | 0.0146 (W) | 0.14 ± 0.53 | 1.24 ± 2.61 | 0.1100 (W) |
| Nausea | 0.22 ± 0.85 | 1.18 ± 2.44 | 0.0914 (W) | 0.07 ± 0.27 | 1.29 ± 2.17 | 0.0348 (W) |
| Heart racing | 0.04 ± 0.21 | 1.23 ± 2.39 | 0.0306 (W) | 0.14 ± 0.53 | 1.18 ± 2.51 | 0.1154 (W) |
| HY_IPA N = 37 Mean ± SD | Placebo N = 39 Mean ± SD | p-Value | ||
|---|---|---|---|---|
| AUC | 0.7977 ± 0.2297 | 0.8011 ± 0.2049 | 0.9454 (T) | |
| Alcohol level (%) | Tmax | 1.3649 ± 0.8283 | 0.9872 ± 0.6588 | 0.0497 (W) |
| Cmax | 0.1496 ± 0.0346 | 0.1805 ± 0.0635 | 0.0586 (W) | |
| AUC | 0.0094 ± 0.0028 | 0.0116 ± 0.0041 | 0.0283 (W) | |
| Acetaldehyde level (%) | Tmax | 0.9122 ± 1.2194 | 1.0577 ± 2.1116 | 0.5494 (W) |
| Cmax | 0.0015 ± 0.0005 | 0.0017 ± 0.0006 | 0.0180 (W) |
| Total N = 76 Mean ± SD | HY_IPA N = 37 Mean ± SD | Placebo N = 39 Mean ± SD | p-Value | ||
|---|---|---|---|---|---|
| 0 h | 2.5 ± 0.77 | 2.97 ± 0.59 | 2.11 ± 0.64 | <0.0001 | |
| 1 h | 3.03 ± 1.13 | 3.96 ± 0.81 | 2.24 ± 0.53 | <0.0001 | |
| ADH (mU/mL) | 2 h | 2.65 ± 0.67 | 2.91 ± 0.74 | 2.47 ± 0.40 | 0.0012 |
| 4 h | 2.23 ± 0.59 | 2.23 ± 0.66 | 2.27 ± 0.46 | 0.9755 | |
| 6 h | 2.04 ± 0.59 | 1.88 ± 0.57 | 2.23 ± 0.53 | 0.0199 |
| Total N = 76 Mean ± SD | HY_IPA N = 37 Mean ± SD | Placebo N = 39 Mean ± SD | p-Value | ||
|---|---|---|---|---|---|
| 0 h | 28.82 ± 0.6.4 | 32.15 ± 5.47 | 25.67 ± 5.62 | <0.0001 | |
| 1 h | 35.1 ± 9.88 | 42.65 ± 6.84 | 27.95 ± 6.35 | <0.0001 | |
| ALDH (mU/mL) | 2 h | 32.44 ± 7.14 | 35.30 ± 6.54 | 29.72 ± 6.68 | <0.0001 |
| 4 h | 30.33 ± 6.66 | 29.86 ± 6.32 | 30.78 ± 7.03 | 0.5484 | |
| 6 h | 24.14 ± 6.7 | 22.40 ± 6.36 | 25.79 ± 6.67 | 0.026 |
| Subject | Alcohol | Acetaldehyde | ADH | ALDH |
|---|---|---|---|---|
| HY_IPA | 0.3570 p = 0.0301 * | 0.4335 p = 0.0074 ** | −0.1529 p = 0.3662 | 0.489 p = 0.0021 ** |
| Placebo | 0.4629 p = 0.0030 ** | 0.0233 p = 0.8879 | −0.0093 p = 0.9554 | −0.0015 p = 0.9928 |
Disclaimer/Publisher’s Note: The statements, opinions and data contained in all publications are solely those of the individual author(s) and contributor(s) and not of MDPI and/or the editor(s). MDPI and/or the editor(s) disclaim responsibility for any injury to people or property resulting from any ideas, methods, instructions or products referred to in the content. |
© 2023 by the authors. Licensee MDPI, Basel, Switzerland. This article is an open access article distributed under the terms and conditions of the Creative Commons Attribution (CC BY) license (https://creativecommons.org/licenses/by/4.0/).
Share and Cite
Jung, S.H.; Lee, Y.H.; Lee, E.K.; Park, S.-D.; Shim, J.-J.; Lee, J.-L.; Yoo, H.H. Effects of Plant-Based Extract Mixture on Alcohol Metabolism and Hangover Improvement in Humans: A Randomized, Double-Blind, Paralleled, Placebo-Controlled Clinical Trial. J. Clin. Med. 2023, 12, 5244. https://doi.org/10.3390/jcm12165244
Jung SH, Lee YH, Lee EK, Park S-D, Shim J-J, Lee J-L, Yoo HH. Effects of Plant-Based Extract Mixture on Alcohol Metabolism and Hangover Improvement in Humans: A Randomized, Double-Blind, Paralleled, Placebo-Controlled Clinical Trial. Journal of Clinical Medicine. 2023; 12(16):5244. https://doi.org/10.3390/jcm12165244
Chicago/Turabian StyleJung, Seung Hee, Yun Ha Lee, Eun Kyu Lee, Soo-Dong Park, Jae-Jung Shim, Jung-Lyoul Lee, and Hye Hyun Yoo. 2023. "Effects of Plant-Based Extract Mixture on Alcohol Metabolism and Hangover Improvement in Humans: A Randomized, Double-Blind, Paralleled, Placebo-Controlled Clinical Trial" Journal of Clinical Medicine 12, no. 16: 5244. https://doi.org/10.3390/jcm12165244
APA StyleJung, S. H., Lee, Y. H., Lee, E. K., Park, S.-D., Shim, J.-J., Lee, J.-L., & Yoo, H. H. (2023). Effects of Plant-Based Extract Mixture on Alcohol Metabolism and Hangover Improvement in Humans: A Randomized, Double-Blind, Paralleled, Placebo-Controlled Clinical Trial. Journal of Clinical Medicine, 12(16), 5244. https://doi.org/10.3390/jcm12165244