

Pre-Endoscopic Scores Predicting Low-Risk Patients with Upper Gastrointestinal Bleeding: A Systematic Review and Meta-Analysis


Abstract
1. Introduction
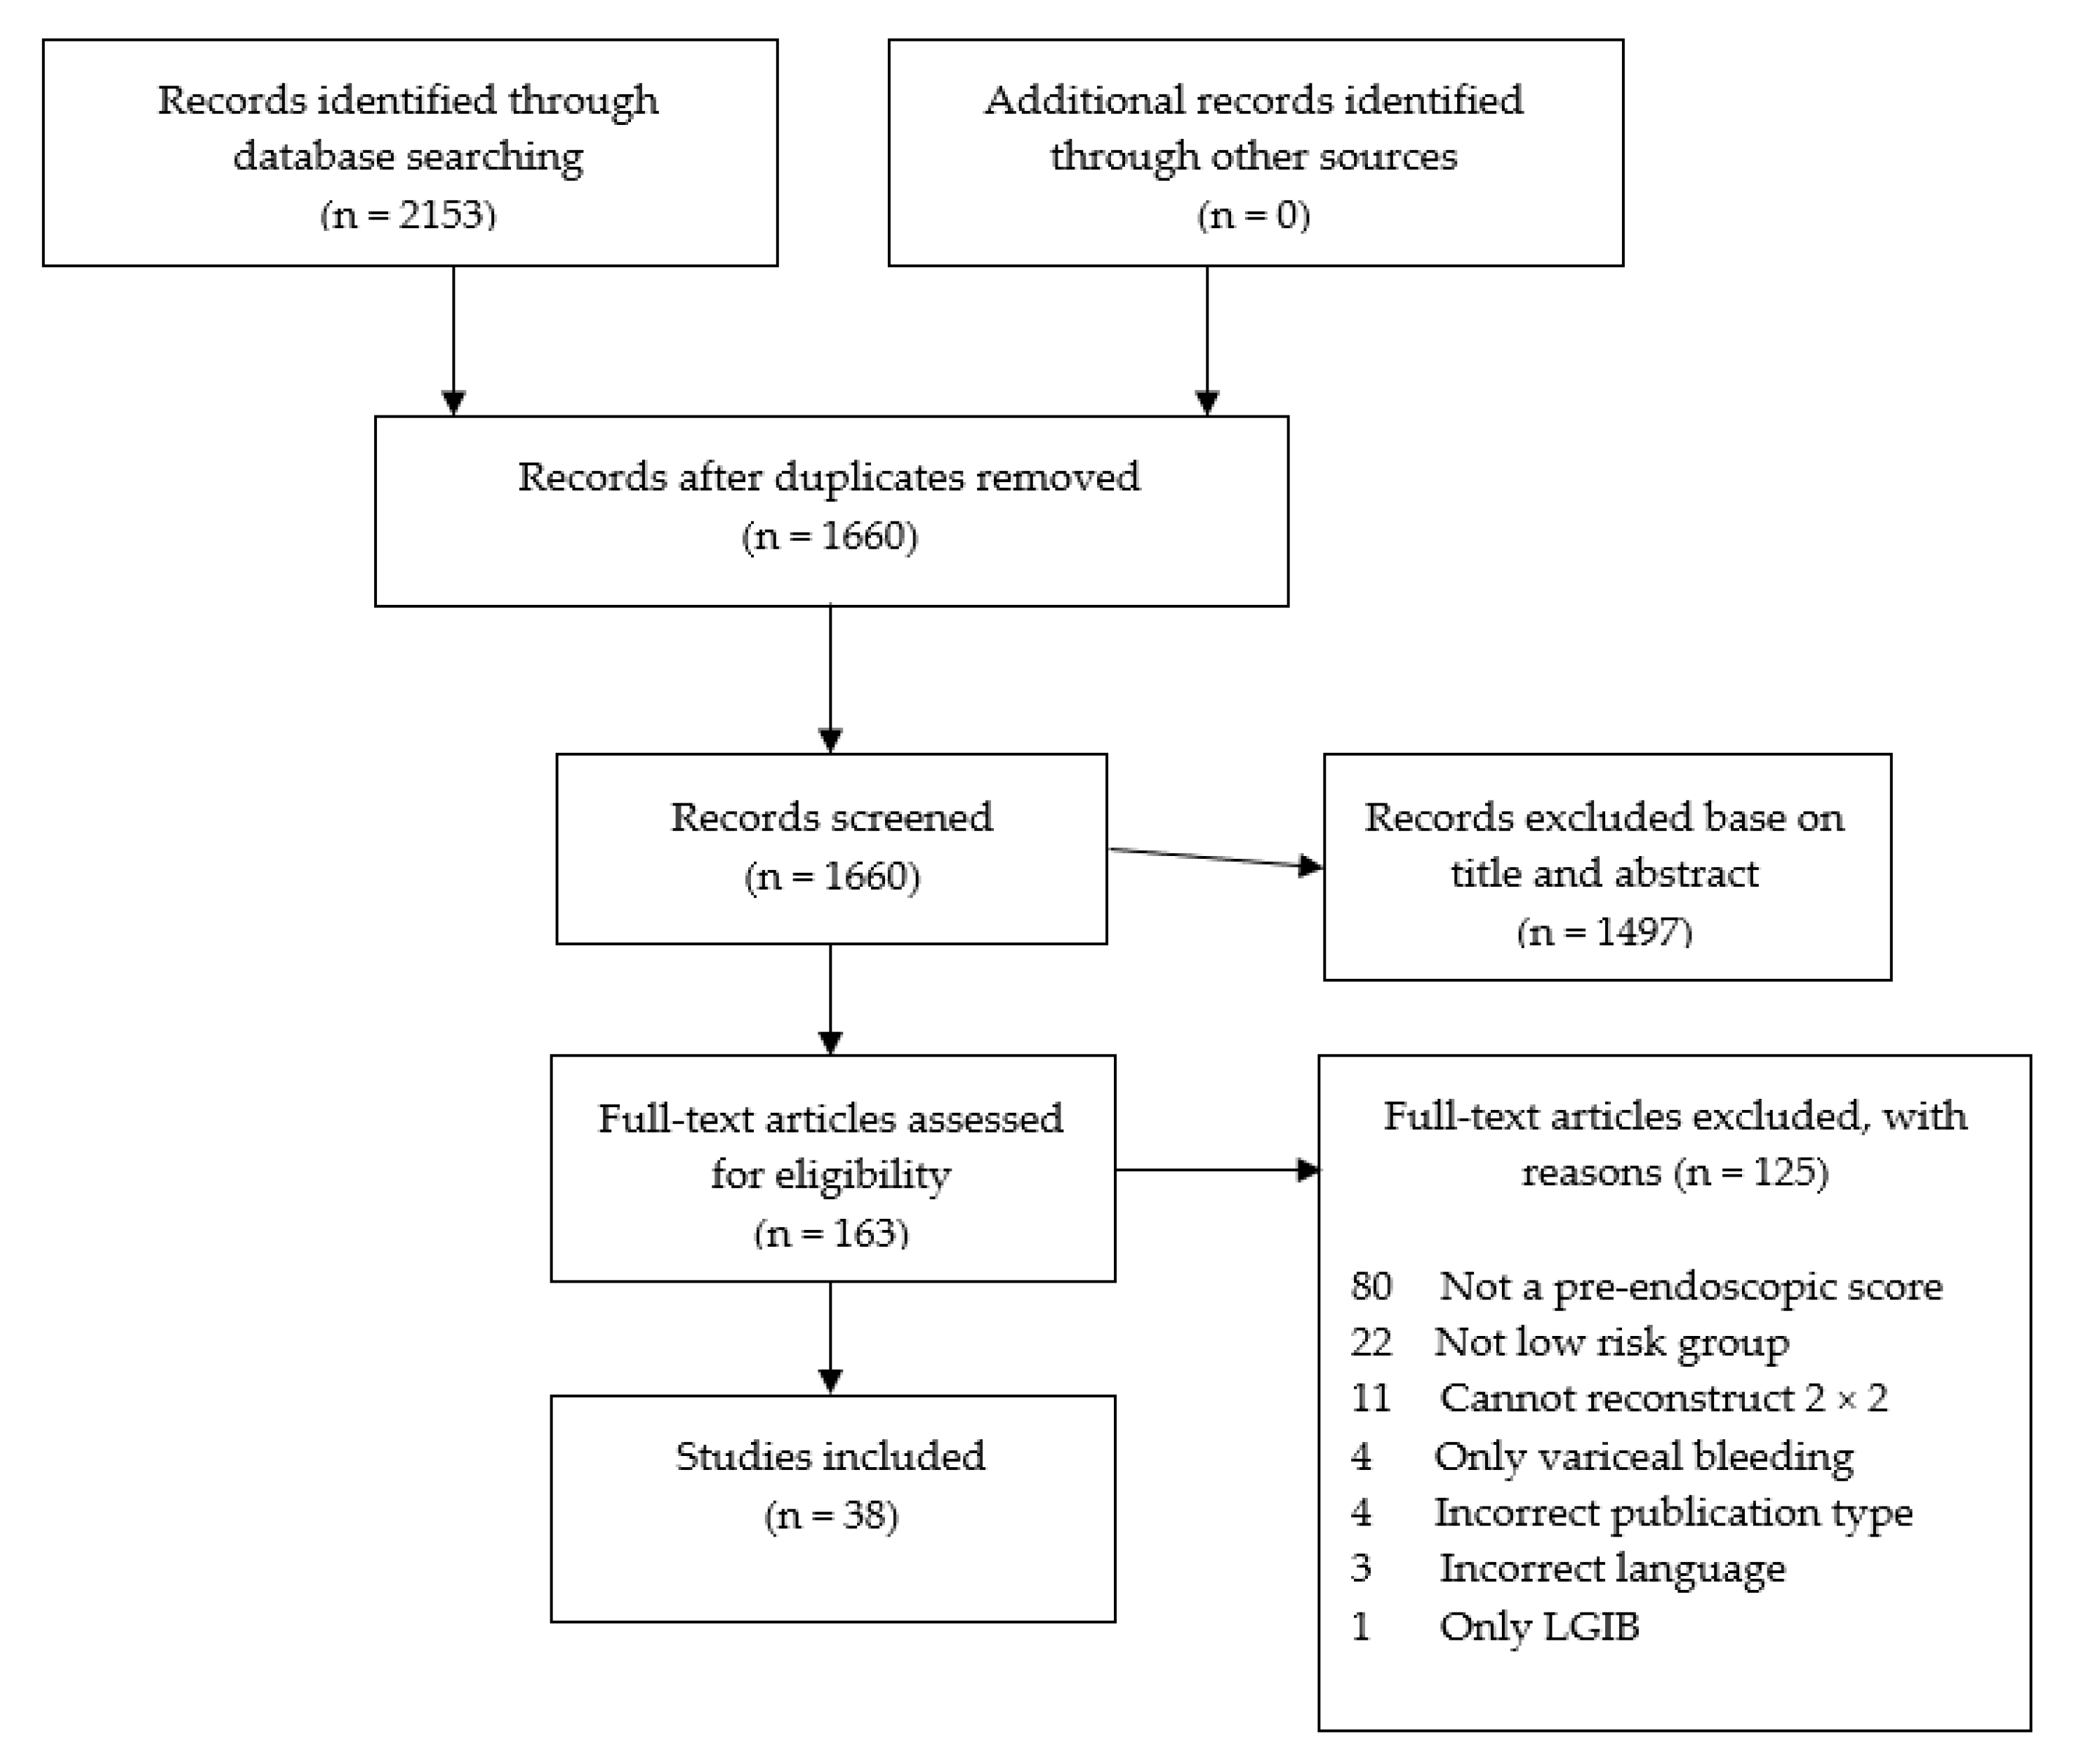
2. Materials and Methods
- Population—patients presenting to the ER with suspected upper GI bleeding
- Intervention—evaluation of low-risk patient using a pre-endoscopic risk score to predict outcomes
- Control—non-low risk patients according to varying thresholds
- Outcomes—The primary outcome was a composite score for the need of a hospital-based intervention (endoscopic therapy, surgery, angiography, or blood transfusion). Secondary outcomes included: mortality, rebleeding or the individual endpoints of the composite outcome
- Time—follow-up up to 30 days from the index bleeding episode
2.1. Search Strategy
2.2. Study Selection and Patient Population
2.3. Validity Assessment
2.4. Choice of Outcome
2.5. Sensitivity and Subgroup Analyses
2.6. Statistical Analysis and Possible Sources of Statistical Heterogeneity
3. Results
3.1. Included Studies
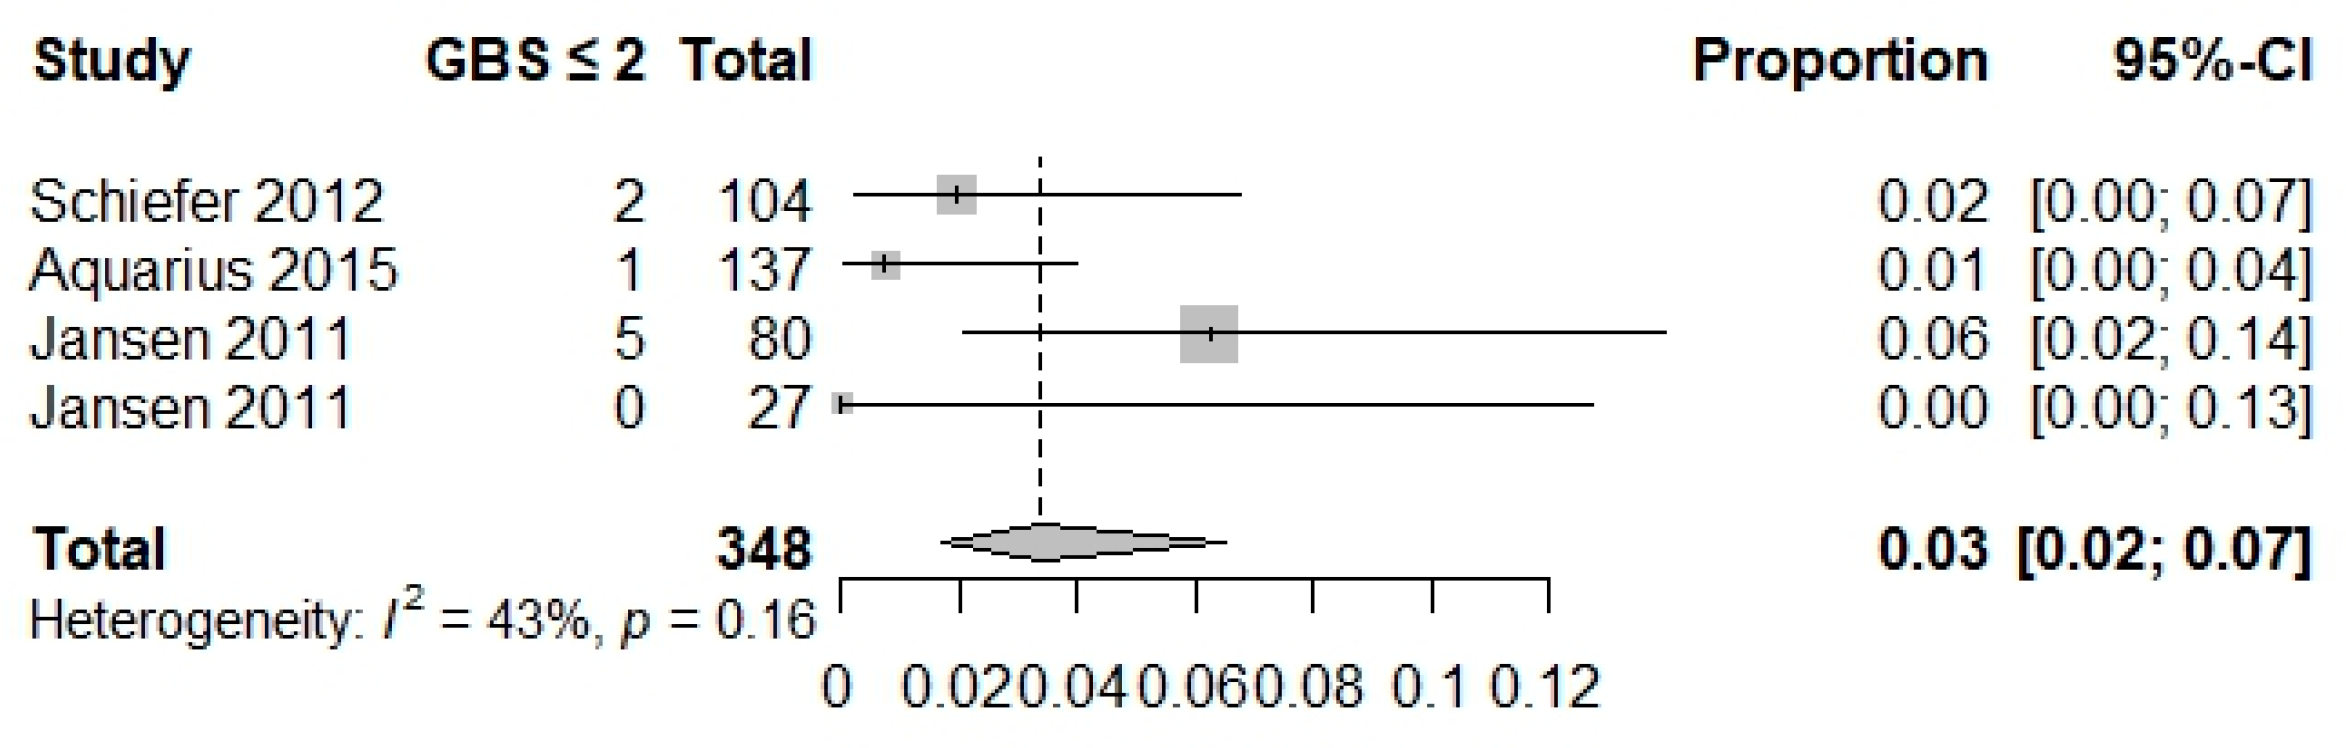
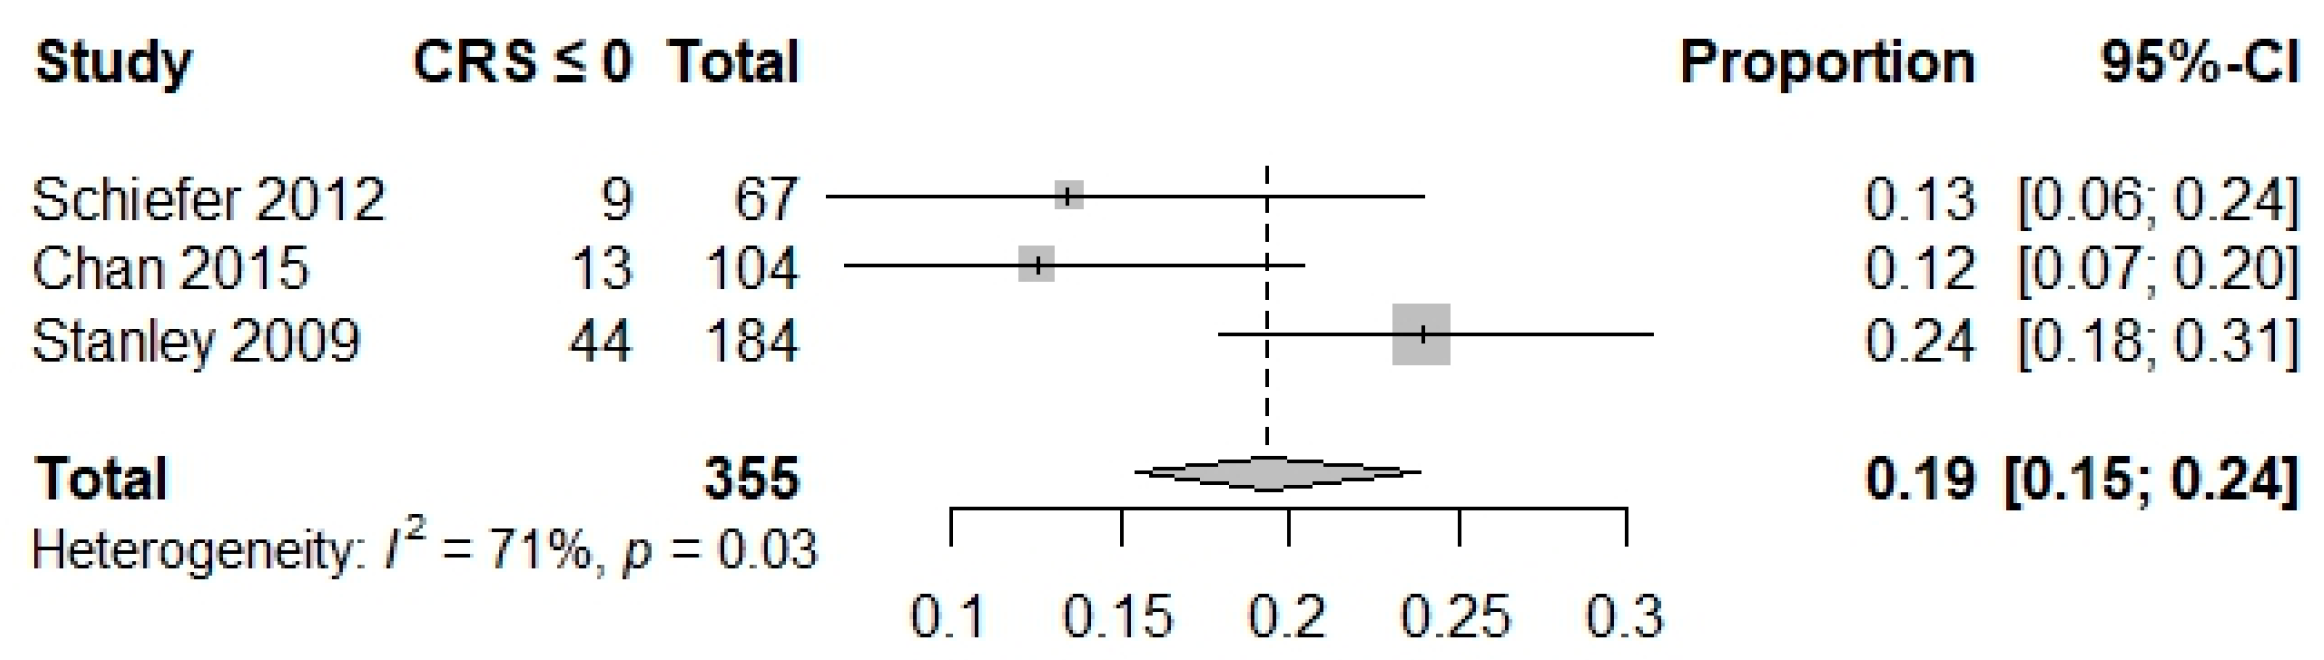
3.2. Primary Outcome
3.3. Secondary Outcomes
3.4. Sensitivity and Subgroup Analyses
4. Discussion
Supplementary Materials
Author Contributions
Funding
Institutional Review Board Statement
Informed Consent Statement
Data Availability Statement
Conflicts of Interest
Abbreviations
| ABC | Age, blood tests and comorbidities |
| AIMS65 | Albumin, INR, Mental status, systolic blood pressure, age > 65 |
| CANUKA | Canada—United Kingdom—Adelaide |
| CRS | Clinical Rockall score |
| ED | Emergency department |
| GBS | Glasgow Blatchford Score |
| HUPS | Hemoglobin–Urea–Pulse–Systolic blood pressure score |
| ICU | Intensive care unit |
| LOS | Length of stay |
| NA | Not available |
| NOS | Newcastle Ottawa Score |
| pBBS | Pre-endoscopic Baylor Bleeding Score |
| pCSMCP | Pre-endoscopic Cedars-Sinai Medical Center Predictive Index |
| UGIB | Upper gastrointestinal bleed |
References
- Abougergi, M.S.; Travis, A.C.; Saltzman, J.R. The in-hospital mortality rate for upper GI hemorrhage has decreased over 2 decades in the United States: A nationwide analysis. Gastrointest. Endosc. 2015, 81, 882–888.e1. [Google Scholar] [CrossRef]
- Hearnshaw, S.A.; Logan, R.F.; Lowe, D.; Travis, S.P.; Murphy, M.F.; Palmer, K.R. Acute upper gastrointestinal bleeding in the UK: Patient characteristics, diagnoses and outcomes in the 2007 UK audit. Gut 2011, 60, 1327–1335. [Google Scholar] [CrossRef]
- Stanley, A.J.; Ashley, D.; Dalton, H.R.; Mowat, C.; Gaya, D.R.; Thompson, E.; Warshow, U.; Groome, M.; Cahill, A.; Benson, G.; et al. Outpatient management of patients with low-risk upper-gastrointestinal haemorrhage: Multicentre validation and prospective evaluation. Lancet 2009, 373, 42–47. [Google Scholar] [CrossRef] [PubMed]
- Blatchford, O.; Murray, W.R.; Blatchford, M. A risk score to predict need for treatment for upper-gastrointestinal haemorrhage. Lancet 2000, 356, 1318–1321. [Google Scholar] [CrossRef] [PubMed]
- Rockall, T.A.; Logan, R.F.; Devlin, H.B.; Northfield, T.C. Risk assessment after acute upper gastrointestinal haemorrhage. Gut 1996, 38, 316–321. [Google Scholar] [CrossRef] [PubMed]
- Saltzman, J.R.; Tabak, Y.P.; Hyett, B.H.; Sun, X.; Travis, A.C.; Johannes, R.S. A simple risk score accurately predicts in-hospital mortality, length of stay, and cost in acute upper GI bleeding. Gastrointest. Endosc. 2011, 74, 1215–1224. [Google Scholar] [CrossRef]
- Laursen, S.B.; Oakland, K.; Laine, L.; Bieber, V.; Marmo, R.; Redondo-Cerezo, E.; Dalton, H.R.; Ngu, J.; Schultz, M.; Soncini, M.; et al. ABC score: A new risk score that accurately predicts mortality in acute upper and lower gastrointestinal bleeding: An international multicentre study. Gut 2021, 70, 707–716. [Google Scholar] [CrossRef] [PubMed]
- Oakland, K.; Kahan, B.C.; Guizzetti, L.; Martel, M.; Bryant, R.V.; Brahmania, M.; Singh, S.; Nguyen, N.Q.; Sey, M.S.L.; Barkun, A.; et al. Development, Validation, and Comparative Assessment of an International Scoring System to Determine Risk of Upper Gastrointestinal Bleeding. Clin. Gastroenterol. Hepatol. Off. Clin. Pract. J. Am. Gastroenterol. Assoc. 2019, 17, 1121–1129.e2. [Google Scholar] [CrossRef]
- Lu, Y.; Barkun, A.N.; Martel, M. Adherence to guidelines: A national audit of the management of acute upper gastrointestinal bleeding. The REASON registry. Can. J. Gastroenterol. Hepatol. 2014, 28, 495–501. [Google Scholar] [CrossRef] [PubMed]
- Barkun, A.N.; Almadi, M.; Kuipers, E.J.; Laine, L.; Sung, J.; Tse, F.; Leontiadis, G.I.; Abraham, N.S.; Calvet, X.; Chan, F.K.L.; et al. Management of Nonvariceal Upper Gastrointestinal Bleeding: Guideline Recommendations From the International Consensus Group. Ann. Intern. Med. 2019, 171, 805–822. [Google Scholar] [CrossRef] [PubMed]
- Laine, L.; Barkun, A.N.; Saltzman, J.R.; Martel, M.; Leontiadis, G.I. ACG Clinical Guideline: Upper Gastrointestinal and Ulcer Bleeding. Am. J. Gastroenterol. 2021, 116, 899–917. [Google Scholar] [CrossRef]
- Ramaekers, R.; Mukarram, M.; Smith, C.A.; Thiruganasambandamoorthy, V. The Predictive Value of Preendoscopic Risk Scores to Predict Adverse Outcomes in Emergency Department Patients with Upper Gastrointestinal Bleeding: A Systematic Review. Acad. Emerg. Med. Off. J. Soc. Acad. Emerg. Med. 2016, 23, 1218–1227. [Google Scholar] [CrossRef]
- Wells, D.R.; Burroughs-Ray, D.C.; Hardy, A.V.; Jackson, C.D. Know Your Guidelines Series: The ACG Clinical Practice Guideline on Upper Gastrointestinal and Ulcer Bleeding Review. South. Med. J. 2022, 115, 358–359. [Google Scholar] [CrossRef]
- Stanley, A.J.; Laine, L.; Dalton, H.R.; Ngu, J.H.; Schultz, M.; Abazi, R.; Zakko, L.; Thornton, S.; Wilkinson, K.; Khor, C.J.; et al. Comparison of risk scoring systems for patients presenting with upper gastrointestinal bleeding: International multicentre prospective study. BMJ 2017, 356, i6432. [Google Scholar] [CrossRef]
- Hardy, R.J.; Thompson, S.G. Detecting and describing heterogeneity in meta-analysis. Stat. Med. 1998, 17, 841–856. [Google Scholar] [CrossRef]
- DerSimonian, R.; Laird, N. Meta-analysis in clinical trials. Control. Clin. Trials 1986, 7, 177–188. [Google Scholar] [CrossRef]
- Higgins, J.P.; Thompson, S.G. Quantifying heterogeneity in a meta-analysis. Stat. Med. 2002, 21, 1539–1558. [Google Scholar] [CrossRef] [PubMed]
- Sweeting, M.J.; Sutton, A.J.; Lambert, P.C. What to add to nothing? Use and avoidance of continuity corrections in meta-analysis of sparse data. Stat. Med. 2004, 23, 1351–1375. [Google Scholar] [CrossRef] [PubMed]
- Aquarius, M.; Smeets, F.G.M.; Konijn, H.W.; Stassen, P.M.; Keulen, E.T.; Van Deursen, C.T.; Masclee, A.A.M.; Keulemans, Y.C. Prospective multicenter validation of the Glasgow Blatchford bleeding score in the management of patients with upper gastrointestinal hemorrhage presenting at an emergency department. Eur. J. Gastroenterol. Hepatol. 2015, 27, 1011–1016. [Google Scholar] [CrossRef]
- Banister, T.; Spiking, J.; Ayaru, L. Discharge of patients with an acute upper gastrointestinal bleed from the emergency department using an extended Glasgow-Blatchford Score. BMJ Open Gastroenterol. 2018, 5, e000225. [Google Scholar] [CrossRef]
- Chatten, K.; Purssell, H.; Banerjee, A.K.; Soteriadou, S.; Ang, Y. Glasgow Blatchford Score and risk stratifications in acute upper gastrointestinal bleed: Can we extend this to 2 for urgent outpatient management? Clin. Med. J. R. Coll. Physicians Lond. 2018, 18, 118–122. [Google Scholar] [CrossRef]
- Girardin, M.; Bertolini, D.; Ditisheim, S.; Frossard, J.L.; Giostra, E.; Goossens, N.; Morard, I.; Nguyen-Tang, T.; Spahr, L.; Vonlaufen, A.; et al. Use of glasgow-blatchford bleeding score reduces hospital stay duration and costs for patients with low-risk upper GI bleeding. Endosc. Int. Open 2014, 2, E74–E79. [Google Scholar] [CrossRef]
- Kayali, A.; Akyol, P.Y.; Topal, F.E.; Payza, U.; Topal, F.; Bilgin, S.; Karakaya, Z. Evaluation of the effectiveness of clinical classifications in patients who apply to the emergency department with upper gastrointestinal system bleeding. Biomed. Res. 2017, 28, 4618–4624. [Google Scholar]
- Laursen, S.B.; Dalton, H.R.; Murray, I.A.; Michell, N.; Johnston, M.R.; Schultz, M.; Hansen, J.M.; Schaffalitzky de Muckadell, O.B.; Blatchford, O.; Stanley, A.J.; et al. Performance of new thresholds of the glasgow blatchford score in managing patients with upper gastrointestinal bleeding. Clin. Gastroenterol. Hepatol. 2015, 13, 115–121.e2. [Google Scholar] [CrossRef] [PubMed]
- Leiman, D.A.; Mills, A.M.; Shofer, F.S.; Weber, A.T.; Leiman, E.R.; Riff, B.P.; Lewis, J.D.; Mehta, S.J. Glasgow Blatchford Score of limited benefit for low-risk urban patients: A mixed methods study. Endosc. Int. Open 2017, 5, E950–E958. [Google Scholar] [CrossRef] [PubMed]
- Mustafa, Z.; Cameron, A.; Clark, E.; Stanley, A.J. Outpatient management of low-risk patients with upper gastrointestinal bleeding: Can we safely extend the Glasgow Blatchford Score in clinical practice? Eur. J. Gastroenterol. Hepatol. 2015, 27, 512–515. [Google Scholar] [CrossRef] [PubMed]
- Pang, S.H.; Ching, J.Y.L.; Lau, J.Y.W.; Sung, J.J.Y.; Graham, D.Y.; Chan, F.K.L. Comparing the Blatchford and pre-endoscopic Rockall score in predicting the need for endoscopic therapy in patients with upper GI hemorrhage. Gastrointest. Endosc. 2010, 71, 1134–1140. [Google Scholar] [CrossRef]
- Robins, G.G.; Sarwar, M.S.; Armstrong, M.J. Evaluation of the need for endoscopy to identify low-risk patients presenting with an acute upper gastrointestinal bleed suitable for early discharge. Postgrad. Med. J. 2011, 87, 161. [Google Scholar] [CrossRef][Green Version]
- Samreen, S.; Khurram, M. Diagnostic accuracy of high risk Glasgow Blatchford score and need for endoscopic intervention in upper gastrointestinal bleeding. Rawal Med. J. 2016, 41, 394–397. [Google Scholar]
- Stephens, J.R.; Hare, N.C.; Warshow, U.; Hamad, N.; Fellows, H.J.; Pritchard, C.; Thatcher, P.; Jackson, L.; Michell, N.; Murray, I.A.; et al. Management of minor upper gastrointestinal haemorrhage in the community using the Glasgow Blatchford Score. Eur. J. Gastroenterol. Hepatol. 2009, 21, 1340–1346. [Google Scholar] [CrossRef]
- Ryan, K.; Malacova, E.; Appleyard, M.; Brown, A.F.; Song, L.; Grimpen, F. Clinical utility of the Glasgow Blatchford Score in patients presenting to the emergency department with upper gastrointestinal bleeding: A retrospective cohort study. Emerg. Med. Australas. EMA 2021, 33, 817–825. [Google Scholar] [CrossRef] [PubMed]
- Bryant, R.V.; Kuo, P.; Williamson, K.; Yam, C.; Schoeman, M.N.; Holloway, R.H.; Nguyen, N.Q. Performance of the Glasgow-Blatchford score in predicting clinical outcomes and intervention in hospitalized patients with upper GI bleeding. Gastrointest. Endosc. 2013, 78, 576–583. [Google Scholar] [CrossRef]
- Johnston, M.R.; Murray, I.A.; Schultz, M.; McLeod, P.; O’Donnell, N.; Norton, H.; Baines, C.; Fawcett, E.; Fesaitu, T.; Leung, H.; et al. Does preendoscopy rockall score safely identify low risk patients following upper gastrointestinal haemorrhage? Gastroenterol. Res. Pract. 2015, 2015, 410702. [Google Scholar] [CrossRef]
- Lima, J.C.; Montes, C.G.; Nagasako, C.K.; Reis, G.; dos Santos, J.O.M.; Guerrazzi, F.; Mesquita, M.A. Performance of the Rockall Scoring System in Predicting the Need for Intervention and Outcomes in Patients with Nonvariceal Upper Gastrointestinal Bleeding in a Brazilian Setting: A Prospective Study. Digestion 2013, 88, 252–257. [Google Scholar] [CrossRef] [PubMed]
- Tham, T.C.; James, C.; Kelly, M. Predicting outcome of acute non-variceal upper gastrointestinal haemorrhage without endoscopy using the clinical Rockall Score. Postgrad. Med. J. 2006, 82, 757–759. [Google Scholar] [CrossRef] [PubMed]
- Ak, R.; Hokenek, N.M. Comparison of AIMS65 and Glasgow Blatchford scores in predicting mortality in patients with upper gastrointestinal bleeding. Rev. Assoc. Med. Bras. 2021, 67, 766–770. [Google Scholar] [CrossRef]
- Lu, X.; Zhang, X.; Chen, H. Comparison of the AIMS65 score with the Glasgow-Blatchford and Rockall scoring systems for the prediction of the risk of in-hospital death among patients with upper gastrointestinal bleeding. Rev. Esp. Enfermedades Dig. 2020, 112, 467–473. [Google Scholar] [CrossRef]
- Park, S.W.; Song, Y.W.; Tak, D.H.; Ahn, B.M.; Kang, S.H.; Moon, H.S.; Sung, J.K.; Jeong, H.Y. The AIMS65 Score Is a Useful Predictor of Mortality in Patients with Nonvariceal Upper Gastrointestinal Bleeding: Urgent Endoscopy in Patients with High AIMS65 Scores. Clin. Endosc. 2015, 48, 522–527. [Google Scholar] [CrossRef]
- Kherad, O.; Restellini, S.; Almadi, M.; Martel, M.; Barkun, A.N. Comparative Evaluation of the ABC Score to Other Risk Stratification Scales in Managing High-risk Patients Presenting with Acute Upper Gastrointestinal Bleeding. J. Clin. Gastroenterol. 2023, 57, 479–485. [Google Scholar] [CrossRef]
- Chan, J.C.H.; Ayaru, L. Analysis of risk scoring for the outpatient management of acute upper gastrointestinal bleeding. Frontline Gastroenterol. 2011, 2, 19–25. [Google Scholar] [CrossRef]
- Gralnek, I.M.; Dulai, G.S. Incremental value of upper endoscopy for triage of patients with acute non-variceal upper-GI hemorrhage. Gastrointest. Endosc. 2004, 60, 9–14. [Google Scholar] [CrossRef] [PubMed]
- Lahiff, C.; Shields, W.; Cretu, I.; Mahmud, N.; McKiernan, S.; Norris, S.; Silke, B.; Reynolds, J.V.; O’Toole, D. Upper gastrointestinal bleeding: Predictors of risk in a mixed patient group including variceal and nonvariceal haemorrhage. Eur. J. Gastroenterol. Hepatol. 2012, 24, 149–154. [Google Scholar] [CrossRef]
- Meltzer, A.C.; Burnett, S.; Pinchbeck, C.; Brown, A.L.; Choudhri, T.; Yadav, K.; Fleischer, D.E.; Pines, J.M. Pre-endoscopic Rockall and Blatchford scores to identify which emergency department patients with suspected gastrointestinal bleed do not need endoscopic hemostasis. J. Emerg. Med. 2013, 44, 1083–1087. [Google Scholar] [CrossRef]
- Shrestha, U.K.; Sapkota, S. Etiology and adverse outcome predictors of upper gastrointestinal bleeding in 589 patients in Nepal. Dig. Dis. Sci. 2014, 59, 814–822. [Google Scholar] [CrossRef]
- Sasaki, Y.; Abe, T.; Kawamura, N.; Keitoku, T.; Shibata, I.; Ohno, S.; Ono, K.; Makishima, M. Prediction of the need for emergency endoscopic treatment for upper gastrointestinal bleeding and new score model: A retrospective study. BMC Gastroenterol. 2022, 22, 337. [Google Scholar] [CrossRef] [PubMed]
- Yaka, E.; Yılmaz, S.; Doğan, N.; Pekdemir, M. Comparison of the Glasgow-Blatchford and AIMS65 scoring systems for risk stratification in upper gastrointestinal bleeding in the emergency department. Acad. Emerg. Med. Off. J. Soc. Acad. Emerg. Med. 2015, 22, 22–30. [Google Scholar] [CrossRef] [PubMed]
- Zhong, M.; Chen, W.J.; Lu, X.Y.; Qian, J.; Zhu, C.Q. Comparison of three scoring systems in predicting clinical outcomes in patients with acute upper gastrointestinal bleeding: A prospective observational study. J. Dig. Dis. 2016, 17, 820–828. [Google Scholar] [CrossRef]
- Jansen, L.; Leffers, P.; Hermans, M.; Stassen, P.; Masclee, A.; Keulemans, Y. Identification of patients with upper gastrointestinal bleeding who do not need immediate treatment. Neth. J. Med. 2011, 69, 384–388. [Google Scholar]
- Jimenez-Rosales, R.; Lopez-Tobaruela, J.M.; Lopez-Vico, M.; Ortega-Suazo, E.J.; Martinez-Cara, J.G.; Redondo-Cerezo, E. Performance of the New ABC and MAP(ASH) Scores in the Prediction of Relevant Outcomes in Upper Gastrointestinal Bleeding. J. Clin. Med. 2023, 12, 1085. [Google Scholar] [CrossRef]
- Laursen, S.B.; Hansen, J.M.; Schaffalitzky de Muckadell, O.B. The Glasgow Blatchford score is the most accurate assessment of patients with upper gastrointestinal hemorrhage. Clin. Gastroenterol. Hepatol. Off. Clin. Pract. J. Am. Gastroenterol. Assoc. 2012, 10, 1130–1135.e1131. [Google Scholar] [CrossRef] [PubMed]
- Matsuhashi, T.; Hatta, W.; Hikichi, T.; Fukuda, S.; Mikami, T.; Tatsuta, T.; Nakamura, J.; Abe, Y.; Onozato, Y.; Ogata, Y.; et al. A simple prediction score for in-hospital mortality in patients with nonvariceal upper gastrointestinal bleeding. J. Gastroenterol. 2021, 56, 758–768. [Google Scholar] [CrossRef] [PubMed]
- Schiefer, M.; Aquarius, M.; Leffers, P.; Stassen, P.; van Deursen, C.; Oostenbrug, L.; Jansen, L.; Masclee, A.; Keulemans, Y.C. Predictive validity of the Glasgow Blatchford Bleeding Score in an unselected emergency department population in continental Europe. Eur. J. Gastroenterol. Hepatol. 2012, 24, 382–387. [Google Scholar] [CrossRef] [PubMed]
- Thanapirom, K.; Ridtiti, W.; Rerknimitr, R.; Thungsuk, R.; Noophun, P.; Wongjitrat, C.; Luangjaru, S.; Vedkijkul, P.; Lertkupinit, C.; Poonsab, S.; et al. Prospective comparaison of three risk scoring systems in non-variceal and variceal upper gastrointestinal bleeding. J. Hepatiol. 2012, 31, 761–767. [Google Scholar] [CrossRef]
- Peery, A.F.; Crockett, S.D.; Murphy, C.C.; Lund, J.L.; Dellon, E.S.; Williams, J.L.; Jensen, E.T.; Shaheen, N.J.; Barritt, A.S.; Lieber, S.R.; et al. Burden and Cost of Gastrointestinal, Liver, and Pancreatic Diseases in the United States: Update 2018. Gastroenterology 2019, 156, 254–272.e211. [Google Scholar] [CrossRef] [PubMed]
- McLaughlin, C.; Vine, L.; Chapman, L.; Deering, P.; Whittaker, S.; Beckly, J.; Fortun, P.; Murray, I.A.; Hussaini, S.H.; Michell, N.P.; et al. The management of low-risk primary upper gastrointestinal haemorrhage in the community: A 5-year observational study. Eur. J. Gastroenterol. Hepatol. 2012, 24, 288–293. [Google Scholar] [CrossRef] [PubMed]
- Bethea, E.D.; Travis, A.C.; Saltzman, J.R. Initial assessment and management of patients with nonvariceal upper gastrointestinal bleeding. J. Clin. Gastroenterol. 2014, 48, 823–829. [Google Scholar] [CrossRef]
- Tham, J.; Stanley, A. Clinical utility of pre-endoscopy risk scores in upper gastrointestinal bleeding. Expert Rev. Gastroenterol. Hepatol. 2019, 13, 1161–1167. [Google Scholar] [CrossRef]
- Marmo, R.; Soncini, M.; Bucci, C.; Zullo, A. Comparaison of assessment tools in acute upper gastrointestinal bleeding: Which one at which time point? Dig. Liver Dis. 2023, 55, 262–267. [Google Scholar] [CrossRef]
- Horibe, M.; Iwasaki, E.; Bazerbachi, F.; Kaneko, T.; Matsuzaki, J.; Minami, K.; Masaoka, T.; Hosoe, N.; Ogura, Y.; Namiki, S.; et al. Horibe GI bleeding prediction score: A simple score for triage decision-making in patients with suspected upper GI bleeding. Gastrointest. Endosc. 2020, 92, 578–588.e4. [Google Scholar] [CrossRef]
- Gralnek, I.M.; Stanley, A.J.; Morris, A.J.; Camus, M.; Lau, J.; Lanas, A.; Laursen, S.B.; Radaelli, F.; Papanikolaou, I.S.; Gonçalves, T.C.; et al. Endoscopic diagnosis and management of nonvariceal upper gastrointestinal hemorrhage (NVUGIH): European Society of Gastrointestinal Endoscopy (ESGE) Guideline–Update 2021. Endoscopy 2021, 53, 300–332. [Google Scholar] [CrossRef]
- Kim, J.S.; Kim, B.-W.; Kim, D.H.; Park, C.H.; Lee, H.; Joo, M.K.; Jung, D.H.; Chung, J.W.; Choi, H.S.; Baik, G.H.; et al. Guidelines for Nonvariceal Upper Gastrointestinal Bleeding. Gut Liver 2020, 14, 560–570. [Google Scholar] [CrossRef] [PubMed]
- Jung, D.H.; Ko, B.S.; Kim, Y.-J.; Kim, W.Y. Comparison of risk scores and shock index in hemodynamically stable patients presenting to the emergency department with nonvariceal upper gastrointestinal bleeding. Eur. J. Gastroenterol. Hepatol. 2019, 31, 781–785. [Google Scholar] [CrossRef] [PubMed]
- Contreras-Omaña, R.; Alfaro-Reynoso, J.; Cruz-Chávez, C.; Velasco, A.V.-R.; Flores-Ramírez, D.; Romero-Hernández, I.; Donato-Olguín, I.; García-Samper, X.; Bautista-Santos, A.; Reyes-Bastidas, M.; et al. The Progetto Nazionale Emorragia Digestiva (PNED) system vs. the Rockall score as mortality predictors in patients with nonvariceal upper gastrointestinal bleeding: A multicenter prospective study. Rev. Gastroenterol. Mex. 2017, 82, 123–128. [Google Scholar] [CrossRef] [PubMed]
- Shung, D.L.; Au, B.; Taylor, R.A.; Tay, J.K.; Laursen, S.B.; Stanley, A.J.; Dalton, H.R.; Ngu, J.; Schultz, M.; Laine, L. Validation of a Machine Learning Model That Outperforms Clinical Risk Scoring Systems for Upper Gastrointestinal Bleeding. Gastroenterology 2020, 158, 160–167. [Google Scholar] [CrossRef]
- Taslidere, B.; Sonmez, E.; Özcan, A.B.; Mehmetaj, L.; Keskin, E.B.; Gulen, B. Comparison of the quick SOFA score with Glasgow-Blatchford and Rockall scores in predicting severity in patients with upper gastrointestinal bleeding. Am. J. Emerg. Med. 2021, 45, 29–36. [Google Scholar] [CrossRef]


| Variables | GBS | CRS | AIMS65 | HUPS | ABC | pBBS | pCSMCPI | CANUKA | |
|---|---|---|---|---|---|---|---|---|---|
| Urea (mmol/L) | ≥6.5<8 | 2 | 1 | 1 (5–9.9) | |||||
| ≥8<10 | 3 | 1 | |||||||
| ≥10<25 | 4 | 1 | 2 (10–14.9) 3 (≥15) | ||||||
| ≥25 | 6 | 1 | |||||||
| >10 | 1 | ||||||||
| Hemoglobin (g/L) for men | <10 | 6 | 1 | ||||||
| ≥10<12 | 3 | 1 | |||||||
| ≥12<13 | 1 | 1 | |||||||
| Hemoglobin (g/L) for women | <100 | 6 | 1 | ||||||
| ≥100<120 | 1 | 1 | |||||||
| Systolic blood pressure (SPB) (mmHg) | <90 | 3 | 1 | 3 (<80) | |||||
| ≥90<100 | 2 | 1 | 2 (80–99) | ||||||
| <100 | 2 | ||||||||
| ≥100<110 | |||||||||
| ≥100<120 | 1 | 1 | |||||||
| Shock | SBP ≥ 100 and HR < 100/min | ||||||||
| SBP ≥ 100 and HR ≥ 100/min | |||||||||
| Pulse | ≥100/min | 1 | 1 | 1 2 (≥125) | |||||
| Hemodynamics | Intermediate | 1 | |||||||
| Unstable | 2 | ||||||||
| ASA class | 3 | 1 | |||||||
| ≥4 | 3 | ||||||||
| Age (years) | ≥30<50 | 1 | 0 | ||||||
| ≥50<60 | 2 | 1 (50–64) | |||||||
| 60–69 | 3 | 2 (≥65) | |||||||
| ≥60<75 | 1 | ||||||||
| ≥60<80 | 1 | ||||||||
| ≥70 | 5 | ||||||||
| ≥75 | 2 | ||||||||
| ≥80 | 2 | ||||||||
| Albumin (g/dL) | <3 | 2 | |||||||
| Creatinine (mg/dL) | ≥1≤1.5 | 1 | |||||||
| >1.5 | 2 | ||||||||
| Time (hours) | <48 | 1 | |||||||
| In hospital | 2 | ||||||||
| Comorbidities | Melena | 1 | 1 | ||||||
| Hematemesis | 1 | ||||||||
| Syncope | 2 | 1 | |||||||
| Liver disease | 2 | 2 | |||||||
| Liver cirrhosis | 2 | ||||||||
| Cardiac failure | 2 | 2 | |||||||
| Cardiac failure, ischemic heart disease, any major comorbidity | 2 | ||||||||
| Renal failure, liver failure, disseminated malignancy | 3 | ||||||||
| Altered mental status | 2 | ||||||||
| Disseminated malignancy | 4 | 2 | |||||||
| 2 comorbidities | 1 | ||||||||
| 3 comorbidities | 2 | ||||||||
| ≥4 comorbidities | 3 | ||||||||
| Illnesses | ≥1≤2 | 1 | |||||||
| ≥3≤4 | 4 | ||||||||
| ≥5 | 5 | ||||||||
| Acute illness | 5 | ||||||||
| Chronic illness | 4 |
| Study (Country), Type of Study, Quality Score Cohorts Size | Cohorts Size | Reported Low Risk Cut-Offs of Pre-Endoscopic Scores Used in the Analysis (Number of Patient with a Score above or below the Threshold) | Definition of Patient Population | Outcome(s) with Extractable Data Used in this Meta-Analysis Definition (When Available) | Definition of UGIB | Definition of Low-Risk Patients |
|---|---|---|---|---|---|---|
| Ak et al., 2021 [36] (Turkey), Retrospective, Score: 7 | n = 422 | AIMS65 ≤ 0: N = 147 AIMS65 > 0: N = 275 | Inclusion: patients above the age of 18, who were diagnosed with UGIB and hospitalized after visiting the ED, according to the codes of the International Classification of Diseases (ICD) 10th revision, were included in this study; Exclusion: patients with missing records, patients transferred from other hospitals, patients with variceal bleeding, patients with records of less than 30 days, and patients with a diagnosis other than UGIB after hospitalization were excluded from this study | Mortality 30 days follow-up | Hematemesis, melena, or solid clinical evidence and laboratory support for acute blood loss from the upper GI tract | Defined as the low-risk cut-offs of pre-endoscopic scores reported |
| Aquarius et al., 2015 [19] (Netherlands), Prospective, Score: 7 | n = 520 | GBS ≤ 2: N = 137 GBS > 2: N = 383 | Inclusion: all patients of 18 years or older presenting at the ED for suspected UGIB; Exclusion: NA | Composite outcome: any endoscopic intervention, surgical, or radiological intervention, or need for blood transfusion. Rebleeding Mortality 30 days follow-up | Hematemesis, coffee-ground emesis, and/or melena | Defined as the as low risk cut-offs of pre-endoscopic scores reported |
| Banister et al., 2018 [20] (UK), Retrospective, Score: 7 | n = 569 | GBS ≤ 1: N = 146 GBS > 1: N = 423 | Inclusion: patients aged 18 years or over presenting to the ED or ambulatory care centers with a primary suspected diagnosis of acute UGIB; Exclusion: patients with an inpatient bleed, patients missing information, patients who self-discharged or whether the patient died prior to an assessment being made, if on review of their electronic record they did not have either hematemesis or melaena or if they presented with a chronic GI bleed | Composite outcome: any endoscopic intervention, surgical, or radiological intervention, or need for blood transfusion. Endoscopic therapy Surgery Radiological intervention Blood transfusion Rebleeding Mortality 30 days follow-up | NA | Defined as the as low risk cut-offs of pre-endoscopic scores reported |
| Bryant et al., 2013 [32] (Australia), Prospective, Score: 6 | n = 708 | cRS ≤ 0: N = 50 cRS > 0: N = NA * | Inclusion: variceal and non-variceal causes of UGIB | Endoscopic therapy 30 days follow-up | Hematemesis (including coffee-ground vomiting) and/ or melena | Defined as the low risk cut-offs of pre-endoscopic scores reported |
| cRS ≤ 1: N = 61 cRS > 1: N = NA * | ||||||
| Chan et al., 2011 [40] (UK), Retrospective, Score: 7 | n = 432 | GBS ≤ 0: N: 40 GBS > 0: N: 392 | Inclusion: patients aged 18 years or over presenting to the ED with a primary diagnosis of acute UGIB; Exclusion: patients with an inpatient bleed, lower GI bleeding and who were transferred from another hospital | Composite outcome Endoscopic therapy Radiologic intervention Surgery Rebleeding Mortality 30 days follow-up | Hematemesis including coffee-ground vomiting and/ or melena | Defined as the low risk cut-offs of pre-endoscopic scores reported |
| cRS ≤ 0: N: 104 cRS > 0: N: 328 | ||||||
| Chatten et al., 2018 [21] (UK), Retrospective, Score: 7 | n = 399 | GBS ≤ 0: N = 62 GBS > 0: N = 337 | Inclusion: patients over the age of 16 who attended the ED or were inpatients with symptoms of an UGIB; Exclusion: patients who did not have an endoscopy | Endoscopic therapy Radiologic intervention Surgery Rebleeding Mortality 30 days follow-up | Hematemesis or melaena | Defined as the as low risk cut-offs of pre-endoscopic scores reported |
| GBS ≤ 1: N = 103 GBS > 1: N = 296 | ||||||
| GBS ≤ 2: N = 136 GBS > 2: N = 263 | ||||||
| Girardin et al., 2014 [22] (Switzerland), Prospectove, Score: 7 | n = 104 | GBS ≤ 0: N: 15 GBS > 0: N: 89 | Inclusion: patients over 18 years of age with UGIB; Exclusion: pregnancy and hematochezia | Transfusion Endoscopic therapy Surgery Rebleeding Mortality 30 days follow-up | Hematemesis or coffee ground emesis or with melena | Defined as the as low risk cut-offs of pre-endoscopic scores reported |
| Gralnek et al., 2004 [41] (USA), Retrospective, Score: 7 | n = 175 | GBS ≤ 0: N: 14 GBS > 0: N: 161 | Inclusion: patients over 18 years of age with UGIB according to ICD-9 codes Exclusion: patient who did not undergo endoscopy, developed bleeding while in the hospital, were transferred from another hospital, or bled from a lower-GI source | Rebleeding Mortality | NA | Defined as the as low risk cut-offs of pre-endoscopic scores reported |
| cRS ≤ 0: N: 21 cRS > 0: N: 154 | ||||||
| Jansen et al., 2011 [48] (Netherlands), Retrospective, Score: 5 | Cohort 1 (n = 103) | GBS ≤ 0: N:36 GBS < 0: N:161 | Patients had to fulfil all of the following inclusion criteria: (1) presentation at ED with hematemesis, melena, tarry stool or syncope with anemia; (2) diagnosis of acute UGIB was included in the working differential diagnosis formulated by the internist or gastroenterologist; and (3) age over 18 years; Exclusion: patients with signs of chronic bleeding (microcytic anemia) | Need for treatment during the period of 28 days following presentation (blood transfusion, surgical, radiological or endoscopic intervention), rebleeding requiring readmission, or when the patient died | Hematemesis or melena | Defined as the as low risk cut-offs of pre-endoscopic scores reported |
| GBS ≤ 1 | ||||||
| GBS ≤ 2 | ||||||
| Cohort 2 (n = 831) | HUPS ≤ 0: N:14 HUPS > 0: N:817 | Composite outcome: any endoscopic intervention, surgical, or radiological intervention, or need for blood transfusion. Surgery Radiological intervention Blood transfusion Rebleeding Mortality 28 days follow-up | ||||
| Johnston et al., 2015 [33] (New Zealand), Retrospective, Score: 5 | n = 388 | cRS ≤ 0: N: 42 cRS > 0: N: 346 | Inclusion: patients who had a gastroscopy with indication of hematemesis or melena; Exclusion: Outpatients, bleeding during hospitalization, and under 16 years of age | Endoscopic therapy Blood transfusion Surgery Rebleeding Mortality 30 days follow-up for mortality and 14 days follow-up for rebleeding | Hematemesis or melena | Patients were considered low risk if they did not fulfilled any primary or secondary outcomes |
| Jimenez-Rosales et al., 2023 [49] (Spain), Retrospective, Score: 7 | n = 795 | GBS ≤ 1: N: 27 GBS > 1: N:768 | Inclusion: variceal and non-variceal bleed (including inpatient bleed); Exclusion: refusal to sign the informed consent | Mortality 30 days follow-up | Melena and/or hematemesis (including coffee ground vomiting) | Defined as the low risk cut-offs of pre-endoscopic scores reported |
| AIMS65 ≤ 1: N: 477 AIMS65 > 1: N: 318 | ||||||
| ABC ≤ 1: N: 334 ABC > 1: N: 461 | ||||||
| Kayali et al., 2017 [23] (Turkey), Retrospective, Score: 6 | n = 188 | GBS ≤ 2: N: 9 GBS > 2: N: 179 | Inclusion: patients aged above 18 with UGIB complaints; Exclusion: NA | Mortality Follow-up: NA | NA | Defined as the as low risk cut-offs of pre-endoscopic scores reported |
| Kherad et al., 2022 [39] (Canada), Retrospective, Score: 7 | n = 645 | ABC ≤ 3: N: 228 ABC > 3: N: 417 | Inclusion: all hospitalized patients of at least 18 years of age with a primary or secondary discharge diagnosis of nonvariceal and variceal UGIB using ICD-9 and ICD-10 codes Exclusion: Outpatients and transfers from other hospitals | Composite outcome: any endoscopic intervention, surgical, or angiography, or need for blood transfusion. Blood transfusion Rebleeding Mortality 30 days follow-up | Melena and/or hematemesis | Defined as the low-risk cut-offs of pre-endoscopic scores reported |
| Lahiff et al., 2012 [42] (Ireland), Retrospective, Score: 7 | n = 200 | GBS ≤ 0: N: 21 GBS > 0: N: 179 | Inclusion: NA; Exclusion: patients with chronic anaemia, those with a lower GI source for bleeding and endoscopies performed for suspected UGIB for in-patients | Endoscopic intervention Rebleeding Mortality 30 days follow-up | Hematemesis (fresh blood or coffee-ground emesis), melena and hematochezia | Defined as the as low risk cut-offs of pre-endoscopic scores reported |
| GBS ≤ 2: N: 57 GBS > 2: N: 143 | ||||||
| cRS ≤ 0: N: 42 cRS > 0: N: 158 | ||||||
| Laursen et al., 2012 [50] (Denmark), Prospective, Score: 7 | n = 831 | GBS ≤ 0: N: 96 GBS > 0: N: 735 | Inclusion: patients presenting with UGIB while already admitted for other reasons. Exclusion: Patients with UGIB transferred from other hospitals | Endoscopic intervention Mortality 30 days follow-up | Hematemesis, coffee-ground vomit, or melena | Defined as patients who did not need hospital-based intervention and survived more than 30 days from day of admission |
| GBS ≤ 2: N: 173 GBS > 2: N: 658 | ||||||
| cRS ≤ 0: N: 130 cRS > 0: N: 701 | ||||||
| pBBS ≤ 0: N: 26 pBBS > 0: N:805 | ||||||
| pBBS ≤ 1: N:86 pBBS > 1: N: 745 | ||||||
| pBBS ≤ 2: N: 140 pBBS > 2: N:691 | ||||||
| pCSMCPI ≤ 0: N: 26 pCSMCPI > 0: N: 805 | ||||||
| Laursen et al., 2015 [24] (Denmark), Prospective, Score: 7 | n = 2305 | GBS ≤ 0: N: 313 GBS > 0: NA * | Inclusion: Patients with UGIB; Exclusion: patients experiencing UGIB while already inpatients for another reason | Transfusion Mortality 30 days follow-up | Hematemesis, coffee-ground vomit, or melena | Defined as patients who did not need a blood transfusion or hemostatic intervention, and did not die during the index admission |
| GBS ≤ 1: N: 562 GBS > 1: NA * | ||||||
| GBS ≤ 2: N: 704 GBS > 2: NA * | ||||||
| Leiman et al., 2017 [25] (USA), Retrospective, Score: 5 | N = 66 | GBS ≤ 0: N: 66 GBS > 0: NA * | Inclusion: Diagnosis of UGIB; Exclusion: under age 18, did not report symptoms of UGIB or had a GBS of 1 or more, and those with vital sign or laboratory abnormalities that would preclude them from being low risk | Endoscopic therapy Surgery Blood transfusion Mortality Follow-up: NA | Hematemesis or coffee ground emesis | Defined as the as low risk cut-offs of pre-endoscopic scores reported |
| Lima et al., 2013 [34] (Brazil), Prospective, Score: 7 | n = 656 | cRS ≤ 0: N: 94 cRS > 0: N: 562 | Inclusion: clinical evidence of UGIB or a history of hematemesis, coffee ground vomiting or melena within 24 h preceding the admission; Exclusion: Bleeding from varices or portal hypertensive gastropathy | Rebleeding Mortality 30 days follow-up | Hematemesis, coffee ground vomiting or melena | Defined as the low risk cut-offs of pre-endoscopic scores reported |
| cRS ≤ 1: N: 227 cRS > 1: N: 429 | ||||||
| cRS ≤ 2: N: 360 cRS > 2: N: 296 | ||||||
| Lu et al., 2020 [37] (China), Retrospective, Score: 6 | n = 284 | AIMS65 ≤ 1: N: 200 AIMS65 > 1: N: 84 | Inclusion: patients hospitalized within 48 hours of endoscopy and diagnosed with UGIB; Exclusion: (1) insufficient laboratory data for calculating the risk scores; (2) endoscopic examination not performed; (3) hemorrhage other than UGIB; (4) unacceptable specification system treatment, including automatic discharge and transfer of patients; and (5) non-acute UGIB cause death | Mortality Follow-up: NA | NA | Defined as the low risk cut-offs of pre-endoscopic scores reported |
| Matsuhashi et al., 2021 [51] (Japan), Retrospective, Score: 6 | Cohort 1 (n = 1,380) | GBS ≤ 1: N: 10 GBS < 1: N: 1370 | Inclusion: patients with non-variceal UGIB; Exclusion: (1) bleeding from malignancy and (2) bleeding after endoscopic resection | Mortality Follow-up: NA | Hematemesis, coffee ground vomiting or melena | Defined as the low risk cut-offs of pre-endoscopic scores reported |
| cRS ≤ 0: N: 129 cRS > 1: N: 1251 | ||||||
| AIMS65 ≤ 1: N: 620 AIMS65 > 1: N: 760 | ||||||
| ABC ≤ 3: N: 619 ABC > 3: N: 761 | ||||||
| Cohort 2 (n = 825) | GBS ≤ 1: N: 15 GBS < 1: N: 810 | |||||
| cRS ≤ 0: N: 67 cRS > 1: N: 758 | ||||||
| AIMS65 ≤ 1: N: 342 AIMS65 > 1: N: 483 | ||||||
| ABC ≤ 3: N: 326 ABC > 3: N: 499 | ||||||
| Meltzer et al., 2013 [43] (USA), Retrospective, Score: 6 | n = 690 | GBS ≤ 0: N: 63 GBS > 0: N: 627 | Inclusion: Patients aged 18 years or older and ED final diagnoses of GI bleed (unspecified) or UGIB (any cause); Exclusion: NA | Endoscopic therapy Follow-up: NA | Hematemesis, coffee ground vomiting or melena | Defined as the as low risk cut-offs of pre-endoscopic scores reported |
| cRS ≤ 0: N: 122 cRS > 0: N: 568 | ||||||
| Mustafa et al., 2015 [26] (UK), Prospective, Score: 7 | n = 514 | GBS ≤ 1: N: 183 GBS > 1: N: 331 | NA | Composite outcome: blood transfusion, endoscopic treatment, radiological intervention or surgery Endoscopic therapy Radiologic intervention Blood transfusion Surgery Mortality Follow-up: 30 days | Hematemesis, coffee-ground vomit or melena | Defined as the as low risk cut-offs of pre-endoscopic scores reported |
| Oakland et al., 2019 [8] (UK), Retrospective, Score: 6 | n = 1606 | GBS ≤ 0: N: 187 GBS > 0: N: 1419 | Inclusion: only patients for whom all 3 risk scores (GBS, cRS, CANUKA) could be calculated were included; Exclusion: patients with missing data on any of the variables used to derive the 3 risk scores were excluded | Endoscopic therapy Blood transfusion Rebleeding Mortality Follow-up: 30 days | NA | Defined clinically as patients who did not require (or experience) any of the following: RBC transfusion, rebleeding, therapeutic endoscopy, interventional radiology or surgery, or mortality. |
| GBS ≤ 1: N: 381 GBS > 1: N: 1225 | ||||||
| cRS ≤ 0: N: 329 cRS > 0: N: 1277 | ||||||
| cRS ≤ 1: N: 605 cRS > 1: N: 1001 | ||||||
| CANUKA ≤ 0: N: 9 CANUKA > 0: N: 1597 | ||||||
| CANUKA ≤ 1: N: 109 CANUKA > 1: N: 1497 | ||||||
| Pang et al., 2010 [27] (USA), Prospective, Score: 7 | n = 1087 | GBS ≤ 0: N: 50 GBS > 0: N: 1037 | Inclusion: Patients with UGIB; Exclusion: patients younger than the age of 18 years and those with primary diagnoses other than UGIB were excluded from the study | Endoscopic therapy Rebleeding Mortality Follow-up: 30 days | Hematemesis, coffee grounds vomiting, melena, or hematochezia | Defined as the as low risk cut-offs of pre-endoscopic scores reported |
| Park et al., 2015 [38] (South Korea), Retrospective, Score: 7 | n = 634 | AIMS65 ≤ 1: N: 434 AIMS65 > 1: N: 200 | Inclusion: Any adult (age 18 or older) with any UGIB Exclusion: upper endoscopy not performed, lower or small bowel bleed, variceal bleed, cancer- or post-procedure bleed | Mortality Follow-up: NA | Melena, hematemesis and/or hematochezia | Defined as the low-risk cut-offs of pre-endoscopic scores reported |
| Robins et al., 2007 [28] (UK), Retrospective, Score: 7 | n = 194 | GBS ≤ 1: N: 194 GBS > 1: N: NA | Inclusion: Patients with UGIB Exclusion: age greater than 60 years, postural fall in systolic blood pressure greater than 20 mmHg, known esophageal varices, receiving anticoagulation, and social circumstances that prevent discharge within 24 h | Endoscopic therapy Blood transfusion Follow-up: 30 days | NA | Defined as the as low risk cut-offs of pre-endoscopic scores reported |
| Ryan et al., 2021 [31] (Australia), Retrospective, Score: 7 | n = 181 | GBS ≤2: N: 49 GBS > 2: N: 132 | Inclusion: Patients with UGIB and a GBS was able to be calculated; Exclusion: patients presenting with iron deficiency anemia without evidence of UGIB, confirmation that the source of bleeding was not from the upper GI tract (e.g., oropharynx or lower GI tract) and patients with incomplete data to calculate a GBS | Endoscopic therapy Radiologic intervention Surgery Rebleeding Mortality Follow-up: 30 days | Hematemesis, coffee grounds vomiting, or melena, | Defined as the low-risk cut-offs of pre-endoscopic scores reported |
| Samreen et al., 2016 [29] (Pakistan), Retrospective, Score: 6 | n = 280 | GBS ≤2: N: 51 GBS > 2: N: 229 | Inclusion: patients age > 18 year old presenting to the ED with UGIB of any cause (variceal or non-variceal); Exclusion: patients with age < 18 years and those not admitted through emergency were excluded | Endoscopic therapy Follow-up: NA | Hematemesis, melena or bloody nasogastric tube aspirate | Defined as the as low risk cut-offs of pre-endoscopic scores reported |
| Sasaki et al., 2022 [45] (Japan), Retrospective, Score: 7 | n = 675 | GBS ≤ 1: N: 39 GBS > 1: N: 636 | Inclusion: patients with suspected non-variceal UGIB | Endoscopic therapy | Hematemesis, black stool, syncope, and anemia | Defined as the low-risk cut-offs of pre-endoscopic scores reported |
| AIMS65 ≤ 1: N: 312 AIMS65 > 1: N: 363 | ||||||
| Schiefer et al., 2012 [52] (Netherlands), Retrospective, Score: 7 | n = 478 | GBS ≤ 0: N: 39 GBS > 0: N: 439 | Inclusion: all patients presenting to the ED with suspected UGIB; Exclusion: symptomatic anemia from chronic GI bleeding, and under 18 years of age | Composite outcome: endoscopic therapy, surgical or radiological treatment, receiving blood transfusion. Endoscopic therapy Follow-up: 28 days | Hematemesis or melena, or unexplained acute drop in hemoglobin level | Defined as the low-risk cut-offs of pre-endoscopic scores reported |
| GBS ≤ 2: N: 104 GBS > 2: N: 374 | ||||||
| cRS ≤ 0: N: 67 cRS > 0: N: 411 | ||||||
| HUPS ≤ 0: N: 56 HUPS > 0: N: 422 | ||||||
| Shrestha et al., 2014 [44] (Nepal), Prospective, Score: 7 | n = 589 | GBS ≤ 0: N: 12 GBS > 0: N: 577 | Inclusion: all UGIB patients from both inpatients and outpatients; Exclusion: patients presenting with chronic anemia and those with a lower GI source for bleeding | Blood transfusion Surgery Rebleeding Mortality Follow-up: 30 days | Hematemesis, melena, nasogastric aspirate containing blood and hematochezia caused by the blood loss from the upper GI tract. | Defined as the low-risk cut-offs of pre-endoscopic scores reported |
| GBS ≤ 1: N: 42 GBS > 1: N: 547 | ||||||
| GBS ≤ 2: N: 76 GBS > 2: N: 513 | ||||||
| cRS ≤ 0: N: 122 cRS > 0: N: 467 | ||||||
| cRS ≤ 1: N: 203 cRS > 1: N: 386 | ||||||
| cRS ≤ 2: N: 320 cRS >2: N: 269 | ||||||
| Stanley et al., 2009 [3] (UK), Prospective, Score: 7 | Cohort 1 (n = 676) | GBS ≤ 0: N: 105 GBS > 0: N: 551 | Inclusion: patients with UGIB; Exclusion: inpatients with UGIB Exclusion: NA | Composite outcome: blood transfusion, endoscopic treatment, or surgery Endoscopic therapy Blood transfusion Surgery Mortality Follow-up: 6 months | Defined as hematemesis coffee-ground vomit, or melena | Defined as the as low risk cut-offs of pre-endoscopic scores reported |
| cRS ≤ 0: N: 184 cRS > 0: N: 492 | ||||||
| Cohort 2 (n = 572) | GBS ≤ 0: N: 123 GBS > 0: N: 449 | |||||
| Stanley et al., 2017 [14] (UK), Prospective, Score: 7 | n = 2868 | GBS ≤ 1: N: 564 GBS > 1: N: 2304 | Inclusion: patients with UGIB; Exclusion: patients who developed UGIB while an inpatient for another reason | Endoscopic therapy Blood transfusion Mortality Follow-up: 30 days | Hematemesis, coffee-ground vomiting, or melena | Defined as the low-risk cut-offs of pre-endoscopic scores reported |
| cRS ≤ 0: N: 436 cRS > 0: N: 2432 | ||||||
| AIMS65 ≤ 0: N: 865 AIMS65 > 0: N: 2003 | ||||||
| Stephens et al., 2009 [30] (UK), Prospective, Score: 7 | Cohort 1 (n = 232) | GBS ≤ 0: N: 29 GBS > 0: N: 203 | Inclusion: patients with UGIB; Exclusion: patients who have UGIB while an inpatient in hospital for another cause and those home alone whatever their GBS was | Endoscopic therapy Blood transfusion Surgery Mortality Follow-up: 4 -6 weeks | Hematemesis (including coffee ground vomiting) and/or melena | Patients with ‘low-risk’ UGIB fulfilling the above criteria were considered for management in the community |
| GBS ≤ 1: N: 53 GBS > 1: N: 179 | ||||||
| GBS ≤ 2: N: 66 GBS > 2: N: 166 | ||||||
| Cohort 2 (n = 304) | GBS ≤ 0: N: 46 GBS > 0: N: 258 | Inclusion: patients with UGIB and GBS ≤2 and age <70 years, were accompanied at home; had a telephone and transport; had no active significant comorbidities; were not taking warfarin and did not have suspected variceal bleeding; Exclusion: NA | ||||
| GBS ≤ 1: N: 93 GBS > 1: N: 211 | ||||||
| GBS ≤ 2: N: 123 GBS > 2: N: 181 | ||||||
| Tham et al., 2006 [35] (UK), Retrospective, Score: 6 | n = 102 | cRS ≤ 0: N: 38 cRS > 0: N: 64 | Inclusion: acute non-variceal UGIB were identified using ICD-9 codes; Exclusion: NA | Blood transfusion Surgery Rebleeding Mortality Follow-up: NA | NA | A clinical Rockall Score of 0 was considered ‘‘low risk’’ for adverse outcomes (recurrent bleeding and mortality) related to acute upper gastrointestinal hemorrhage |
| cRS ≤ 1: N: 51 cRS > 1: N: 51 | ||||||
| cRS ≤ 2: N: 67 cRS > 2: N: 35 | ||||||
| Thanapirom et al., 2012 [53] (Thailand), Prospective, Score: 6 | n = 756 | GBS ≤ 2: N: 99 GBS > 2: N: 657 | Inclusion: Patients with UGIB; Exclusion: patients who refused endoscopic examination | Rebleeding Mortality Follow-up: 30 days | Hematemesis (including coffee-ground vomiting), melena, and hematochezia | Defined as the low-risk cut-offs of pre-endoscopic scores reported |
| Yaka et al., 2015 [46] (Turkey), Prospective, Score: 7 | n = 254 | GBS ≤ 0: N: 16 GBS > 0: N: 238 | Inclusion: Adult patients with UGIB (variceal and non-variceal) Adult; Exclusion: Patients who received any treatment at another institution, visited the ED due to a rebleeding episode from a prior upper GI bleeding, had incomplete data for score calculation or outcome determination, or whose source of bleeding was the lower GI tract | Endoscopic therapy Blood transfusion Surgery Follow-up: 30 days | Hematemesis, “coffee-ground” vomit, melena, hematochezia | Patients who did not require blood transfusions or suffer the composite clinical outcomes were considered low-risk patients. |
| GBS ≤ 2: N: 48 GBS > 2: N: 206 | ||||||
| AIMS65 ≤ 0: N: 101 AIMS65 > 0: N: 153 | ||||||
| Zhong et al., 2016 [47] (China), Prospective, Score: 6 | Cohort 1 (n = 320) | GBS ≤ 2: N: 101 GBS > 2: N: 219 | Inclusion: patients aged >18 years who were admitted with acute UGIB; Exclusion: (i) recurrent episode of acute UGIB during the study period; (ii) patients diagnosed as non-acute UGIB (iii) patients with incomplete emergency medical data for the calculation of GBS, and AIMS65 score; (iv) patients who had received treatments at other institutions; (v) patients in whom the bleeding source was confirmed to be the lower GI tract | Rebleeding Mortality Follow-up: NA | Hematemesis, coffee- ground vomitus, melena, and/or hematochezia | Defined as the low-risk cut-offs of pre-endoscopic scores reported |
| AIMS65 ≤ 1: N: 134 AIMS65 > 1: N: 136 |
| GBS Proportion (95% CI) | CRS Proportions (95% CI) | AIMS65 Proportions (95% CI) | ABC Proportions (95% CI) | |||||||
|---|---|---|---|---|---|---|---|---|---|---|
| 0 | ≤1 | ≤2 | 0 | ≤1 | ≤2 | 0 | ≤1 | ≤1 | ≤3 | |
| Composite outcome | 0.02 (0.01–0.05) I2 = 0% Studies = 4 N = 347 | 0.04 (0.02–0.09) I2 = 49% Studies = 2 N = 237 | 0.03 (0.02–0.07) I2 = 43% Studies = 3 N = 348 | 0.19 (0.15–0.24) I2 = 71% Studies = 3 N = 355 | NA | NA | NA | NA | NA | 0.69 (0.62; 0.75) I2 = NA Studies = 1 N = 228 |
| Mortality | (0.01–0.03) I2 = 0% Studies = 14 N = 1200 | (0.00–0.01) I2 = 0% Studies = 10 N = 2179 | NA | (0.00–0.02) I2 = 0% Studies = 11 N = 1634 | (0.00–0.01) I2 = 0% Studies = 4 N = 1086 | 0.02 (0.01–0.04) I2 = 0% Studies = 3 N = 747 | (0.01–0.02) I2 = 78% Studies = 2 N = 1012 | 0.04 (0.03–0.05) I2 = 89% Studies = 7 N = 2788 | 0.30 (0.25; 0.36) I2 = NA Studies = 1 N = 312 | 0.02 (0.01; 0.03) I2 = 73% Studies = 2 N = 1173 |
| Rebleeding | 0.02 (0.01–0.04) I2 = 0% Studies = 9 N = 428 | (0.01–0.03) I2 = 0% Studies = 4 N = 672 | 0.03 (0.02–0.06) I2 = 52% Studies = 8 N = 703 | 0.04 (0.03–0.06) I2 = 46% Studies = 7 N = 688 | 0.05 (0.04–0.06) I2 = 67% Studies = 4 N = 1086 | 0.07 (0.05–0.09) I2 = 67% Studies = 3 N = 747 | NA | 0.31 (0.24–0.39) I2 = 98% Studies = 2 N = 281 | NA | 0.11 (0.07; 0.15) I2 = NA Studies = 1 N = 228 |
| Blood transfusion | (0.01–0.03) I2 = 0% Studies = 8 N = 923 | NA | 0.04 (0.03–0.06) I2 = 88% Studies = 4 N = 1037 | 0.14 (0.12–0.16) I2 = 86% Studies = 7 N = 1255 | 0.22 (0.20–0.25) I2 = 95% Studies = 3 N = 859 | 0.48 (0.43–0.54) I2 = 97% Studies = 2 N = 387 | 0.20 (0.18–0.23) I2 = 70% Studies = 2 N = 966 | NA | NA | 0.60 (0.53; 0.66) I2 = NA Studies = 1 N = 228 |
| Endoscopic intervention | 0.02 (0.01–0.03) I2 = 0% Studies = 13 N = 969 | 0.02 (0.01–0.02) I2 = 0% Studies = 8 N = 1756 | 0.06 (0.04–0.09) I2 = 76% Studies = 8 N = 807 | 0.08 (0.07–0.10) I2 = 0% Studies = 8 N = 1255 | 0.15 (0.12–0.18) I2 = 94% Studies = 2 N = 666 | NA | 0.12 (0.10–0.15) I2 = 0% Studies = 2 N = 966 | 0.30 (0.25–0.36) I2 = NA (1 study) Study = 1 N = 312 | NA | NA |
| Surgical intervention | (0.01–0.03) I2 = 0% Studies = 8 N = 525 | (0.00–0.02) I2 = 0% Studies = 5 N = 620 | (0.00–0.02) I2 = 0% Studies = 5 N = 498 | (0.00–0.03) I2 = 0% Studies = 4 N = 306 | (0.00–0.03) I2 = 0% Studies = 2 N = 254 | (0.00–0.02) I2 = 0% Studies = 2 N = 387 | (0.00–0.04) I2 = NA (1 study) Study = 1 N = 101 | NA | NA | NA |
| Radiological intervention | 0.01 (0.00–0.07) I2 = 0% Studies = 2 N = 102 | 0.00(0.00–0.02) I2 = 0% Studies = 3 N = 432 | 0.01 (0.00–0.04) I2 = 0% Studies = 2 N = 185 | NA | NA | NA | NA | NA | NA | NA |
| GBS OR (95% CI) | CRS OR (95% CI) | AIMS65 OR (95% CI) | ABC OR (95% CI) | ||||||
|---|---|---|---|---|---|---|---|---|---|
| Outcomes | 0 | ≤1 | ≤2 | 0 | ≤1 | ≤2 | 0 | ≤1 | ≤3 |
| Composite outcome | 0.02 (0.00–0.16) Studies = 1 (n = 478) | 0.00 (0.00–0.02) Studies = 1 (n = 569) | 0.01 (0.00–0.04) Studies = 2 (n = 1102) | 0.17 (0.08–0.34) Studies = 1 (n = 545) | NR | NR | NR | NR | 0.42 (0.29, 0.62) Studies = 1 (n = 645) |
| Mortality | 0.27 (0.09–0.97) Studies = 7 (n = 1880) | 0.06 (0.02–0.20) Studies = 9 (n = 5607) | 0.11 (0.04–0.27) Studies = 8 (n = 2467) | 0.18 (0.08–0.43) Studies = 6 (n = 3940) | 0.13 (0.05–0.34) Studies = 3 (n = 1347) | 0.28 (0.16–0.50) Studies = 3 (n = 1347) | 0.27 (0.09–0.78) Studies = 1 (n = 422) | 0.13 (0.09–0.18) Studies = 7 (n = 4430) | 0.10 (0.06; 0.17) Studies = 2 (n = 2750) |
| Rebleeding | 0.26 (0.07–0.91) Studies = 5 (n = 1450) | 0.09 (0.01–0.68) Studies = 2 (n = 988) | 0.24 (0.05–1.01) Studies = 4 (n = 1189) | 0.41 (0.10–1.63) Studies = 4 (n = 1735) | 0.71 (0.45–1.11) Studies = 3 (n = 1347) | 0.50 (0.15–1.67) Studies = 3 (n = 1347) | NR | 0.30 (0.04–2.37) Studies = 2 (n = 512) | 0.47 (0.29; 0.79) Studies = 1 (n = 645) |
| Blood transfusion | 0.03 (0.01–0.08) Studies = 6 (n = 1587) | 0.01 (0.00–0.03) Studies = 5 (n = 2208) | 0.01 (0.01–0.04) Studies = 3 (n = 810) | 0.28 (0.19–0.40) Studies = 3 (n = 1079) | 0.16 (0.03–0.80) Studies = 2 (n = 691) | 0.30 (0.04–2.13) Studies = 2 (n = 691) | 0.12 (0.07–0.21) Studies = 1 (n = 254) | NR | 0.47 (0.33; 0.66) Studies = 1 (n = 645) |
| Endoscopic intervention | 0.04 (0.02–0.11) Studies = 7 (n = 2484) | 0.02 (0.01–0.05) Studies = 6 (n = 2693) | 0.07 (0.04–0.13) Studies = 6 (n = 1650) | 0.53 (0.20–1.41) Studies = 1 (n = 388) | NR | NR | 0.48 (0.24–0.96) Studies = 1 (n = 254) | 0.78 (0.57–1.08) Studies = 1 (n = 675) | NR |
| Surgical intervention | 0.93 (0.30–2.86) Studies = 7 (n = 1986) | 0.19 (0.06–0.60) Studies = 6 (n = 2607) | 0.27 (0.07–0.97) Studies = 5 (n = 1778) | 0.37 (0.07–2.05) Studies = 3 (n = 1079) | 0.17 (0.02–1.42) Studies = 2 (n = 691) | 0.29 (0.07–1.25) Studies = 2 (n = 691) | 0.13 (0.01–2.43) Studies = 1 (n = 254) | NR | NR |
| Radiological intervention | 1.07 (0.05–22.6) Studies = 1 (n = 399) | 0.20 (0.04–1.10) Studies = 3 (n = 1482) | 0.38 (0.02–8.04) Studies = 1 (n = 399) | NR | NR | NR | NR | NR | NR |
Disclaimer/Publisher’s Note: The statements, opinions and data contained in all publications are solely those of the individual author(s) and contributor(s) and not of MDPI and/or the editor(s). MDPI and/or the editor(s) disclaim responsibility for any injury to people or property resulting from any ideas, methods, instructions or products referred to in the content. |
© 2023 by the authors. Licensee MDPI, Basel, Switzerland. This article is an open access article distributed under the terms and conditions of the Creative Commons Attribution (CC BY) license (https://creativecommons.org/licenses/by/4.0/).
Share and Cite
Boustany, A.; Alali, A.A.; Almadi, M.; Martel, M.; Barkun, A.N. Pre-Endoscopic Scores Predicting Low-Risk Patients with Upper Gastrointestinal Bleeding: A Systematic Review and Meta-Analysis. J. Clin. Med. 2023, 12, 5194. https://doi.org/10.3390/jcm12165194
Boustany A, Alali AA, Almadi M, Martel M, Barkun AN. Pre-Endoscopic Scores Predicting Low-Risk Patients with Upper Gastrointestinal Bleeding: A Systematic Review and Meta-Analysis. Journal of Clinical Medicine. 2023; 12(16):5194. https://doi.org/10.3390/jcm12165194
Chicago/Turabian StyleBoustany, Antoine, Ali A. Alali, Majid Almadi, Myriam Martel, and Alan N. Barkun. 2023. "Pre-Endoscopic Scores Predicting Low-Risk Patients with Upper Gastrointestinal Bleeding: A Systematic Review and Meta-Analysis" Journal of Clinical Medicine 12, no. 16: 5194. https://doi.org/10.3390/jcm12165194
APA StyleBoustany, A., Alali, A. A., Almadi, M., Martel, M., & Barkun, A. N. (2023). Pre-Endoscopic Scores Predicting Low-Risk Patients with Upper Gastrointestinal Bleeding: A Systematic Review and Meta-Analysis. Journal of Clinical Medicine, 12(16), 5194. https://doi.org/10.3390/jcm12165194