
Method for Classifying Schizophrenia Patients Based on Machine Learning

 ,
, 
 ,
, 
Abstract
1. Introduction
2. Material
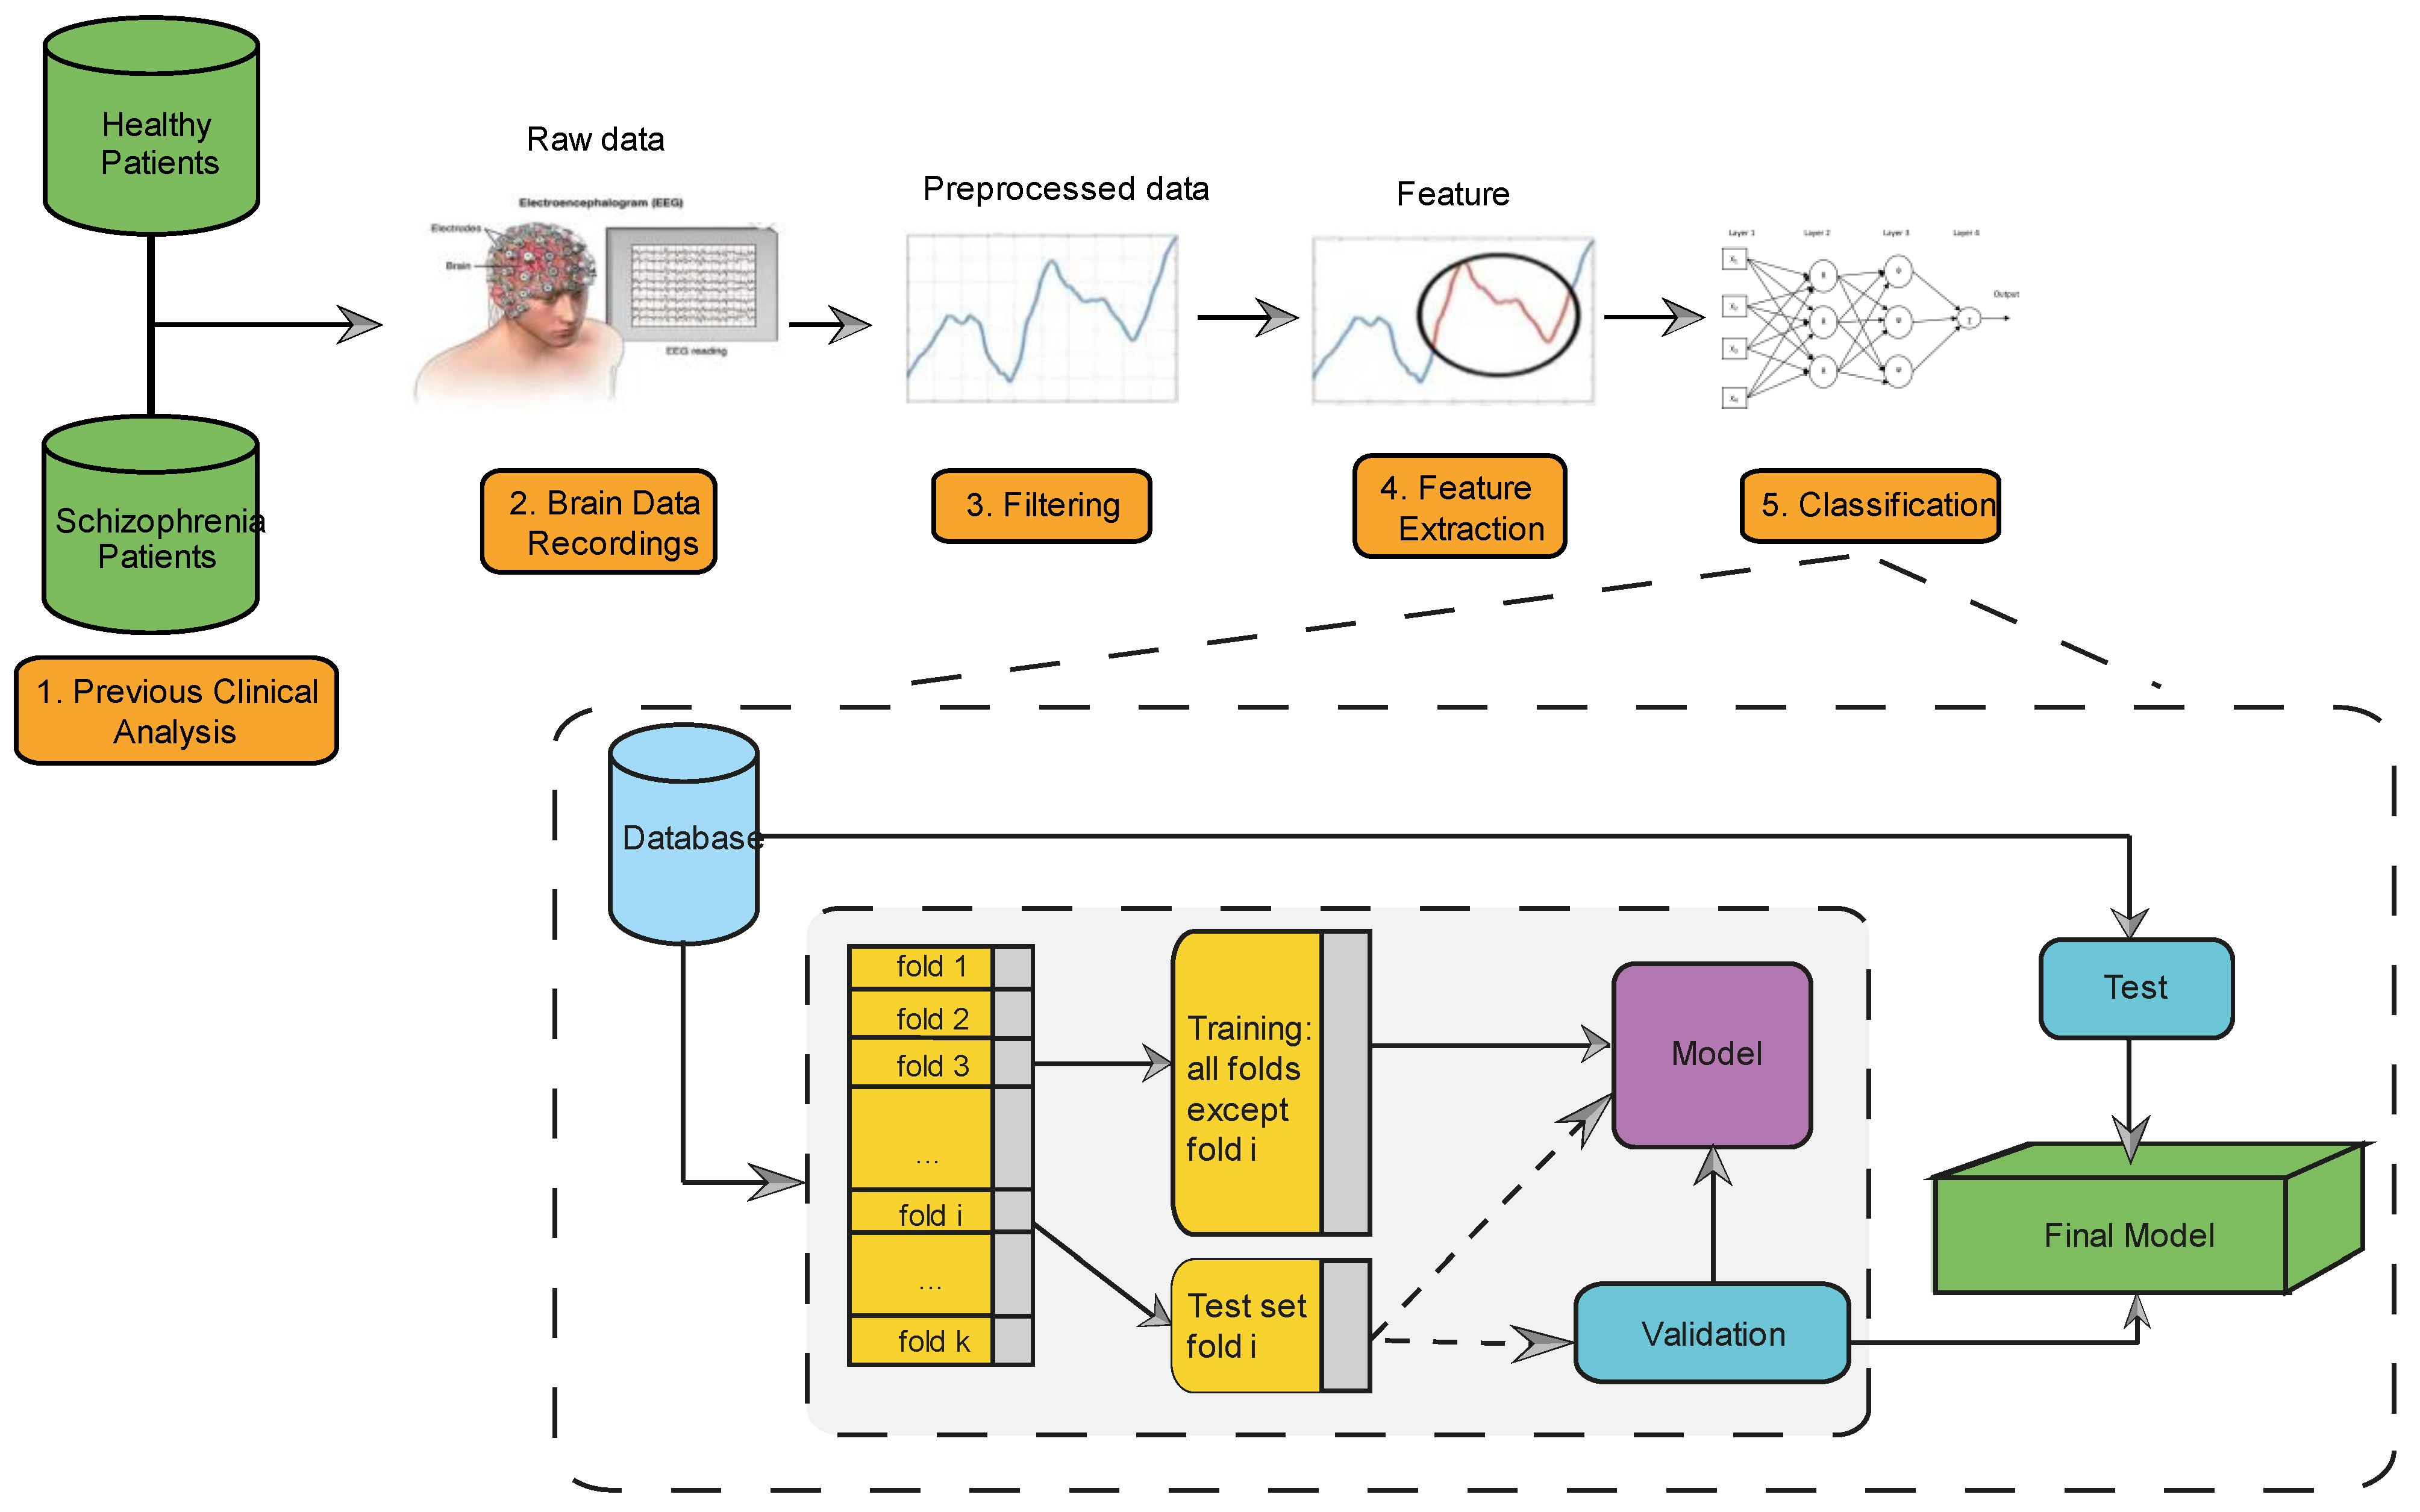
3. Method
3.1. Feature Extraction
- Detrended Fluctuation Analysis (DFA) provides information about the temporal correlations in EEG recordings [46].
- Approximate Entropy (ApEn), for measuring the complexity of the system. The ApEn value is indicated by a positive number, which represents the complexity of the EEG signal [47].
- Hurst exponent, which is used to analyze the behavior of a system over time and determine the existence of fractal series [48].
- Higuchi analyzes the fractal dimension of EEG signals and measures their self-similarity and complexity [49].
- Lyapunov Exponent (LE), which characterizes the rate of separation of close trajectories of a system [50].
- EEG band power, obtained by applying Butterworth filters and calculating the power spectrum of each frequency band (delta (0.5–4 Hz), theta (4–8 Hz), alpha (8–13 Hz) and beta (13–30 Hz)), using the Welch method [51].
3.2. Performance Evaluation
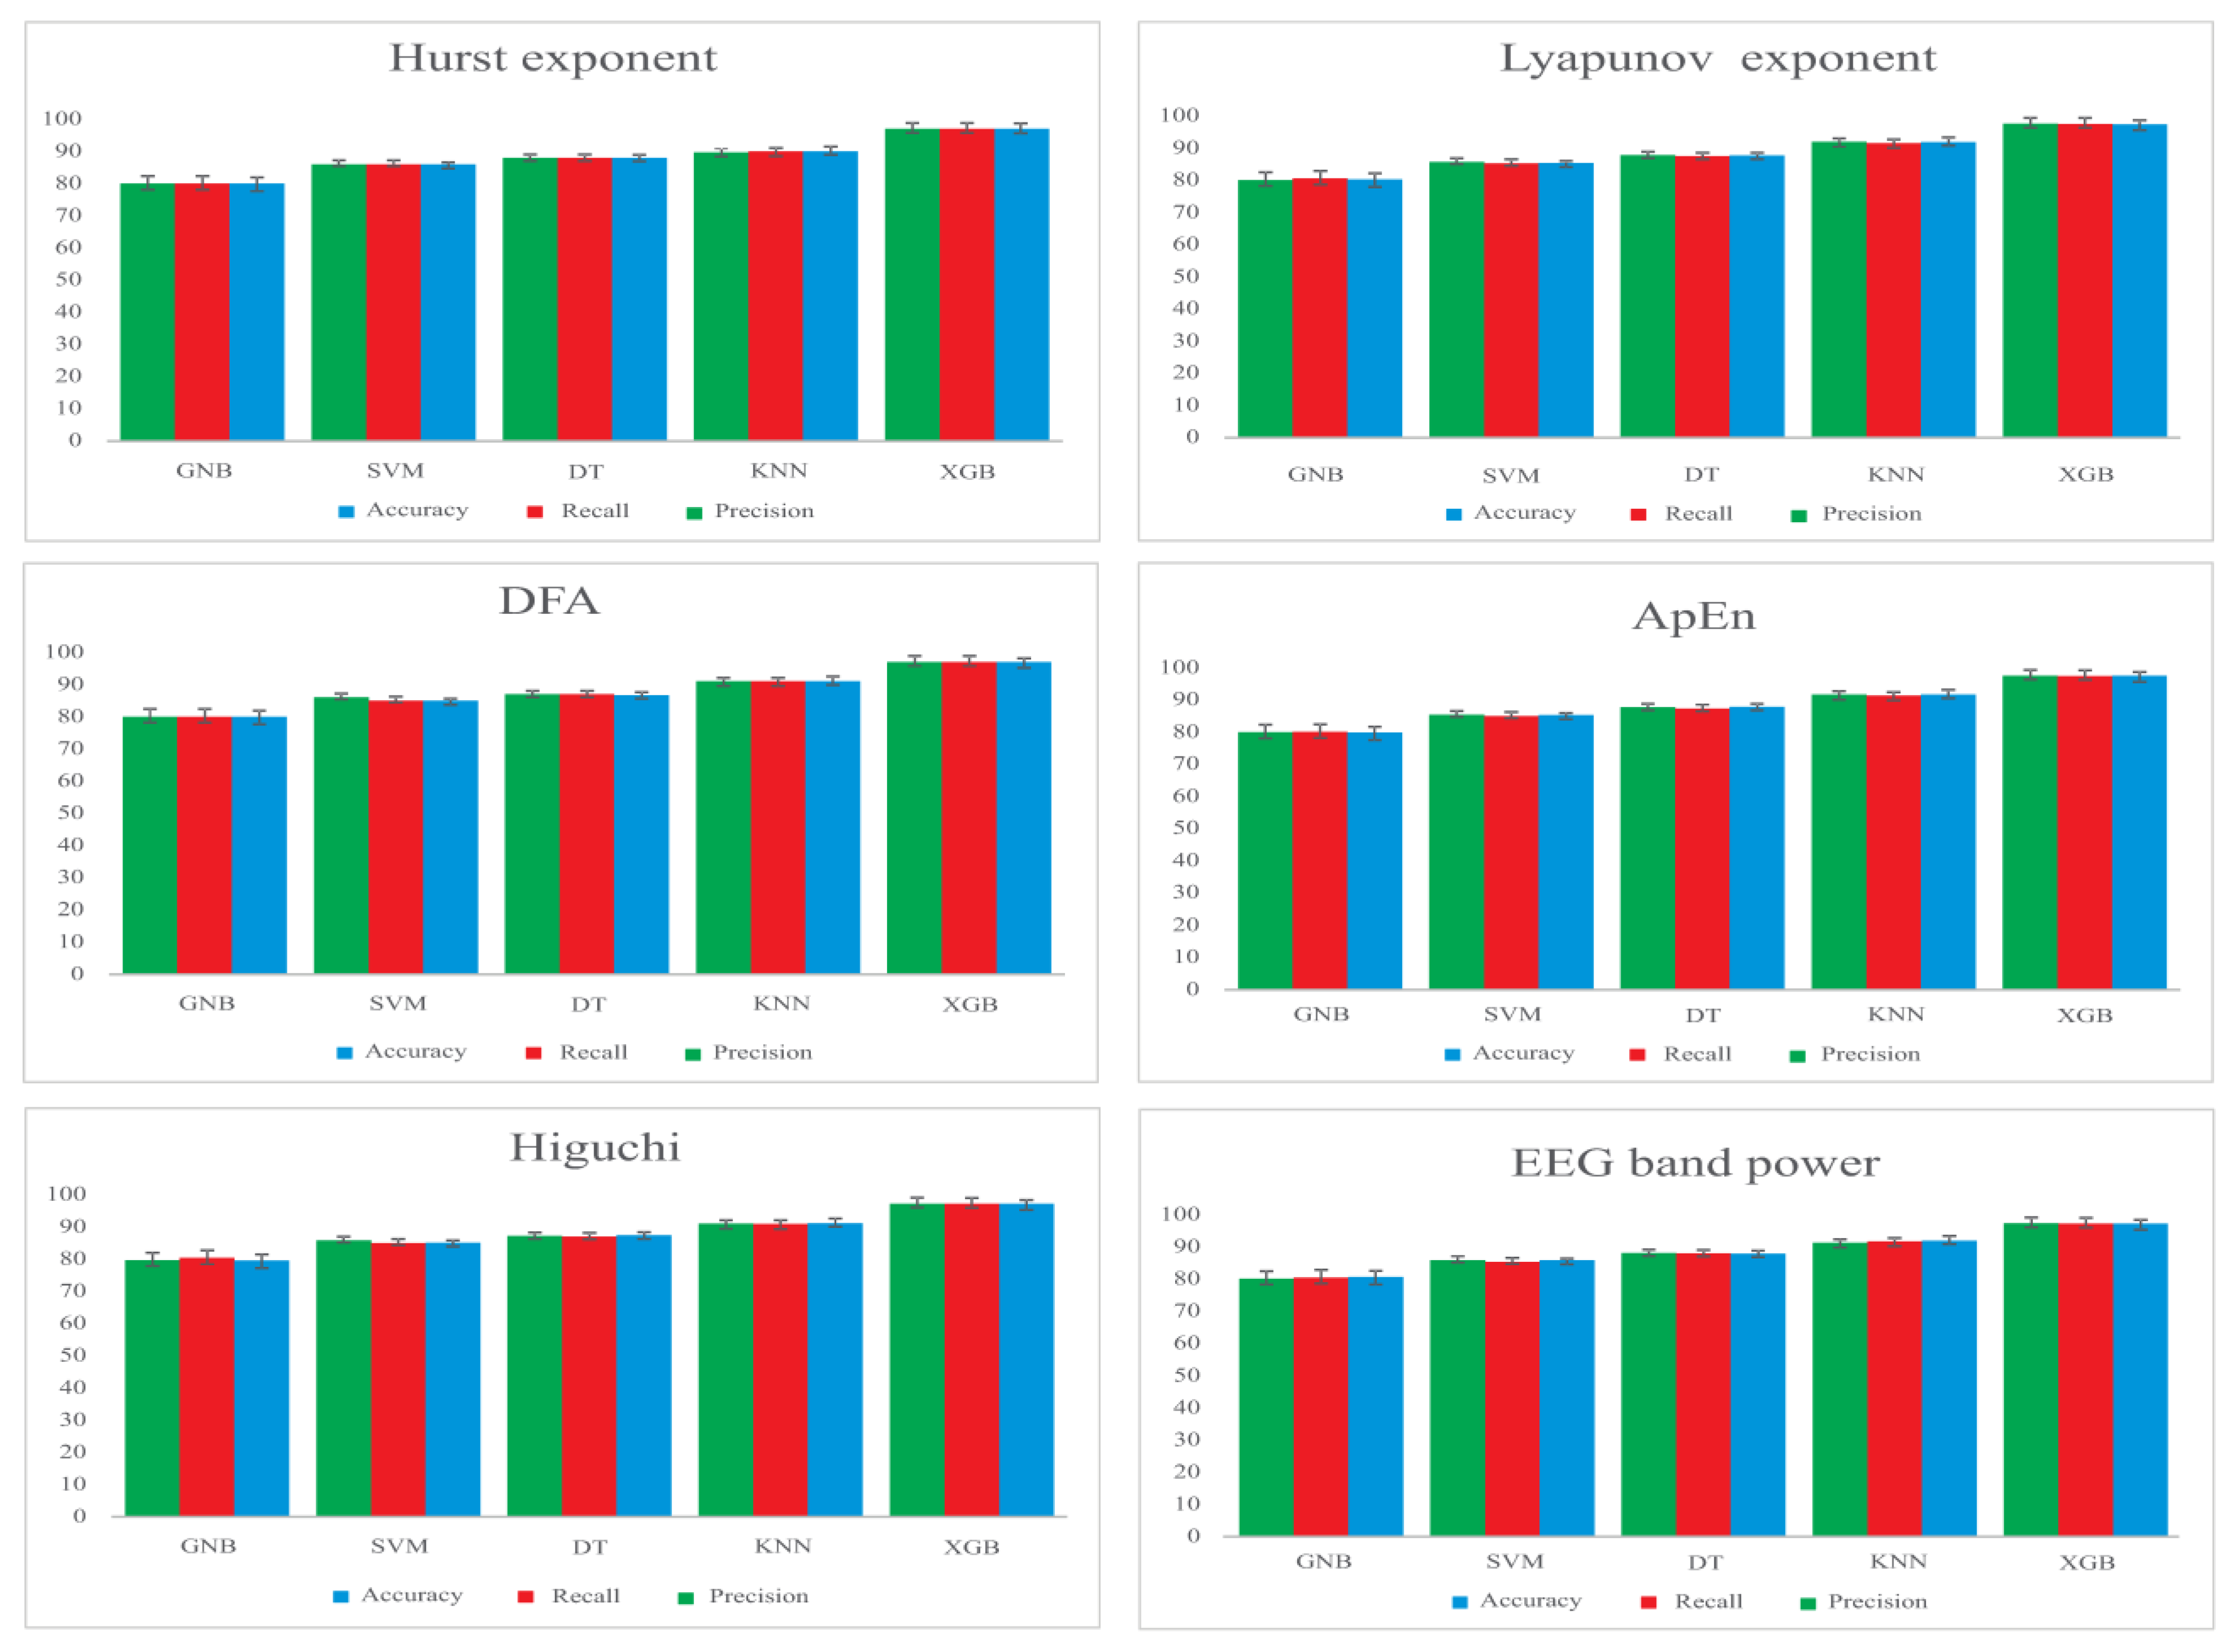
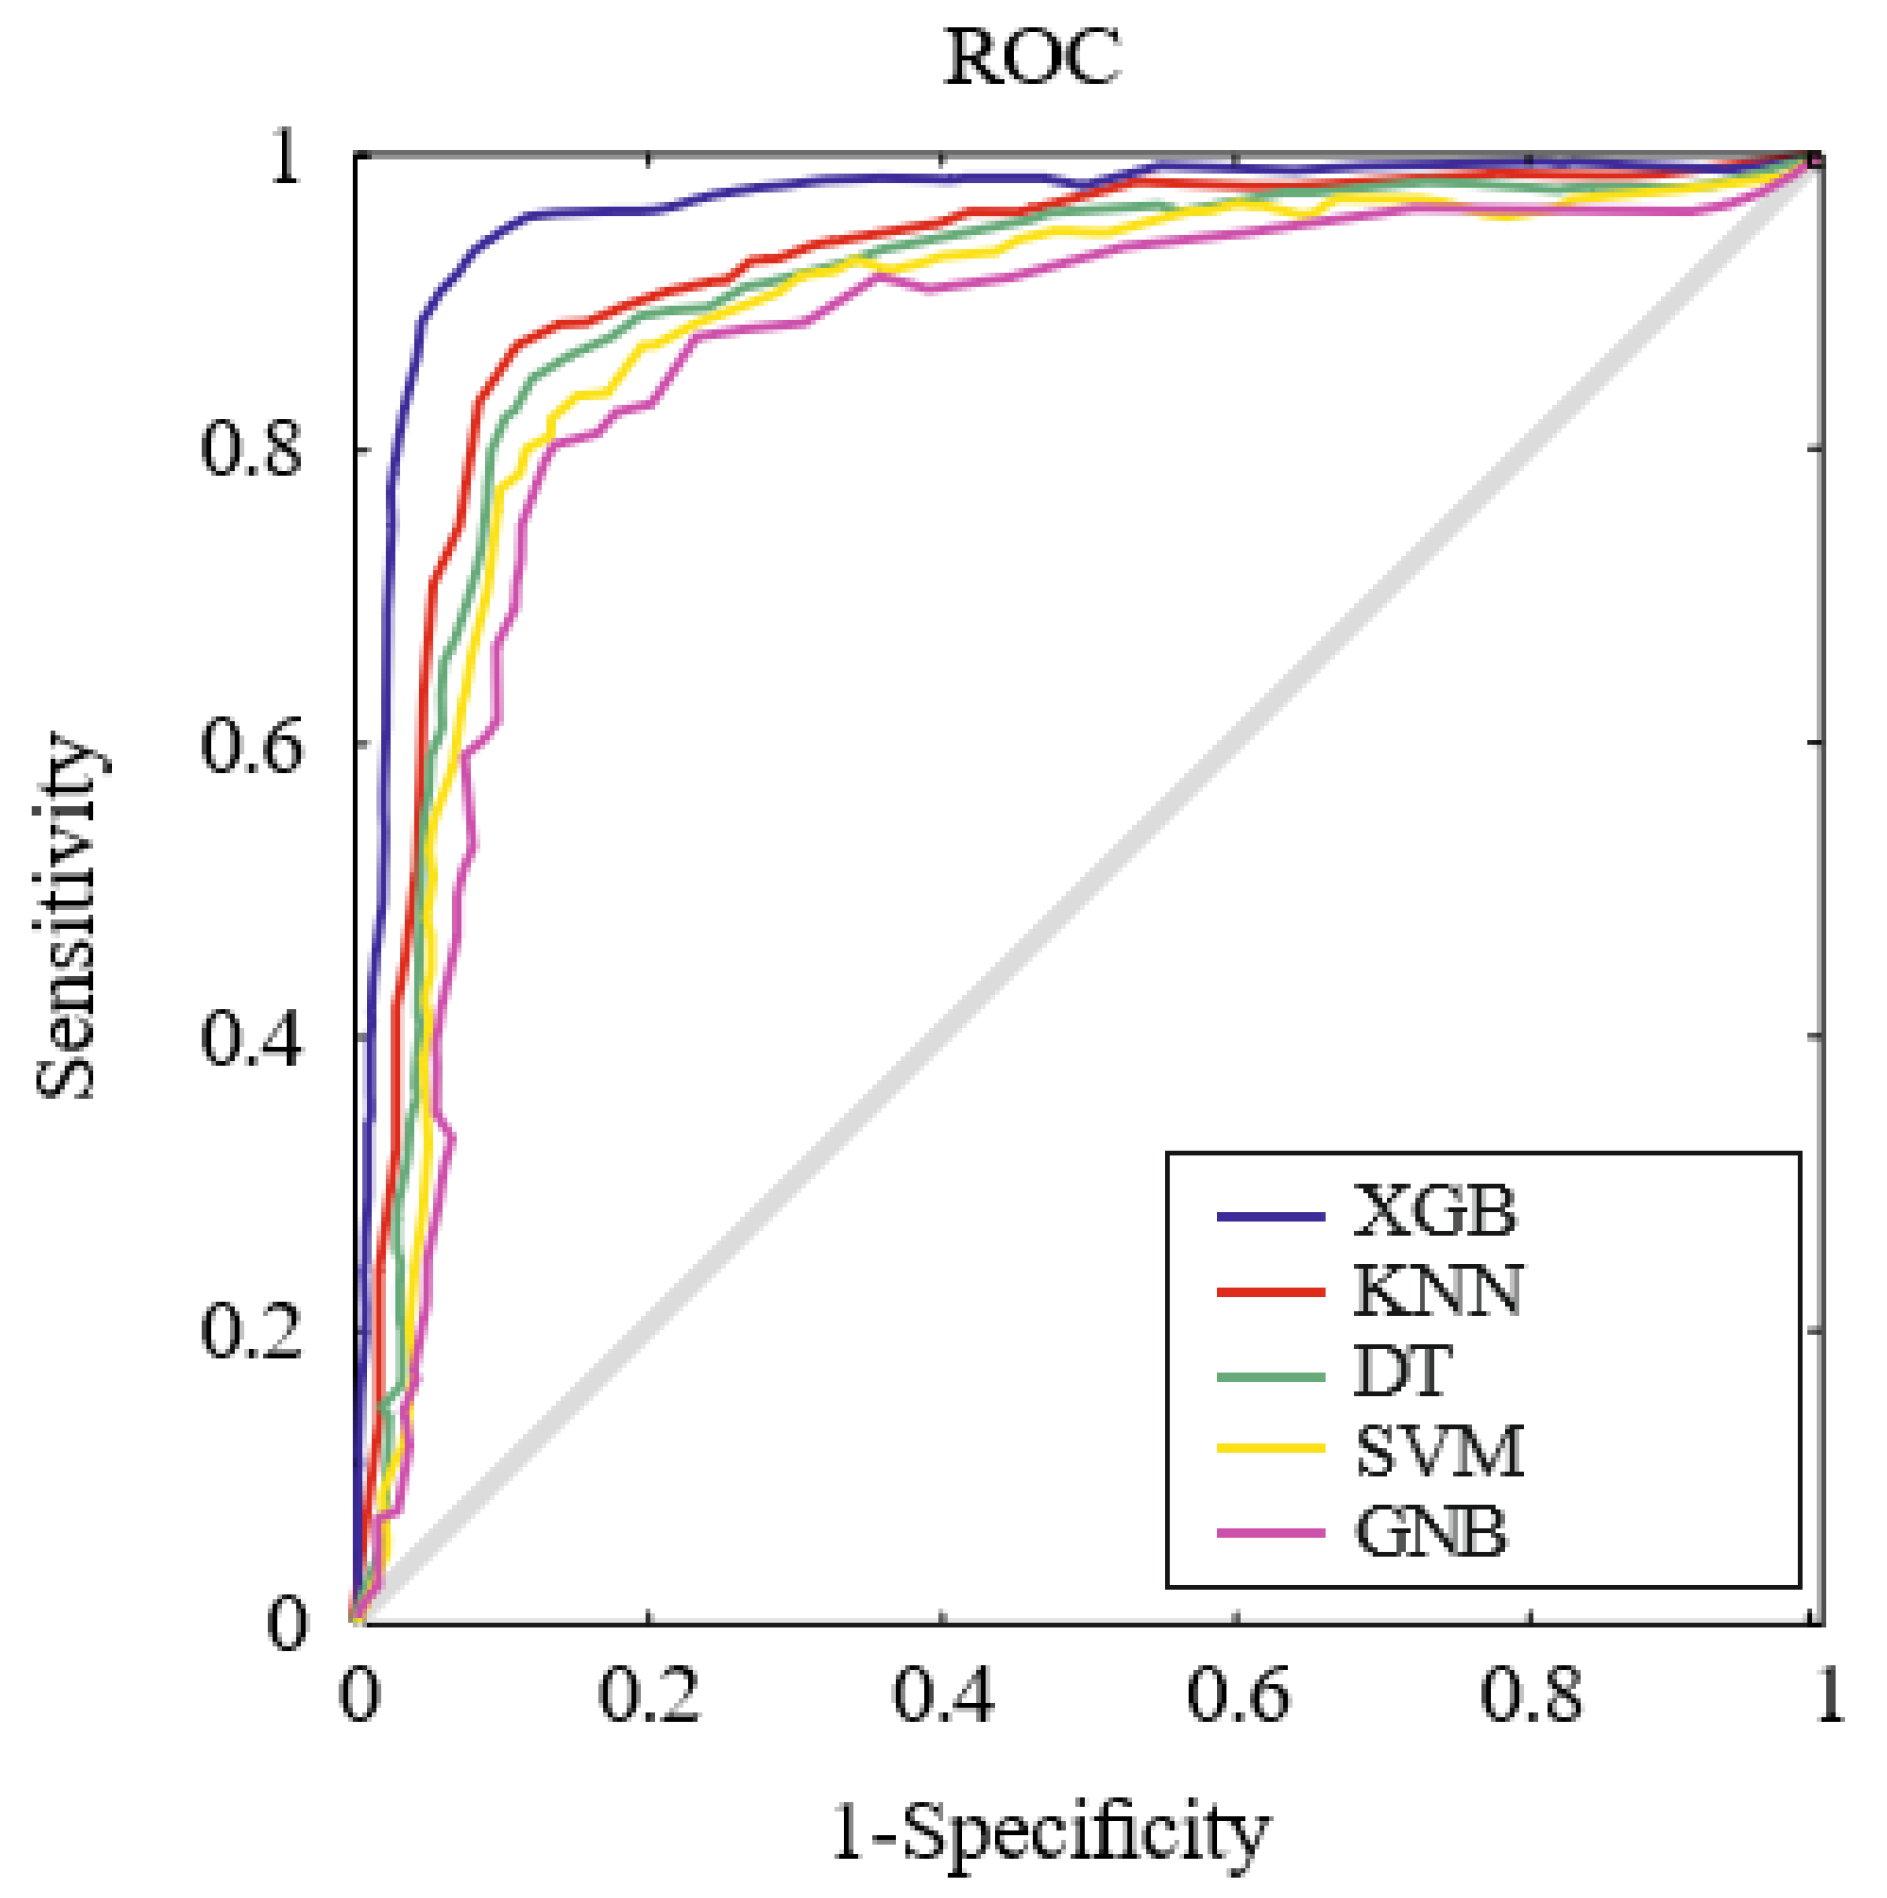
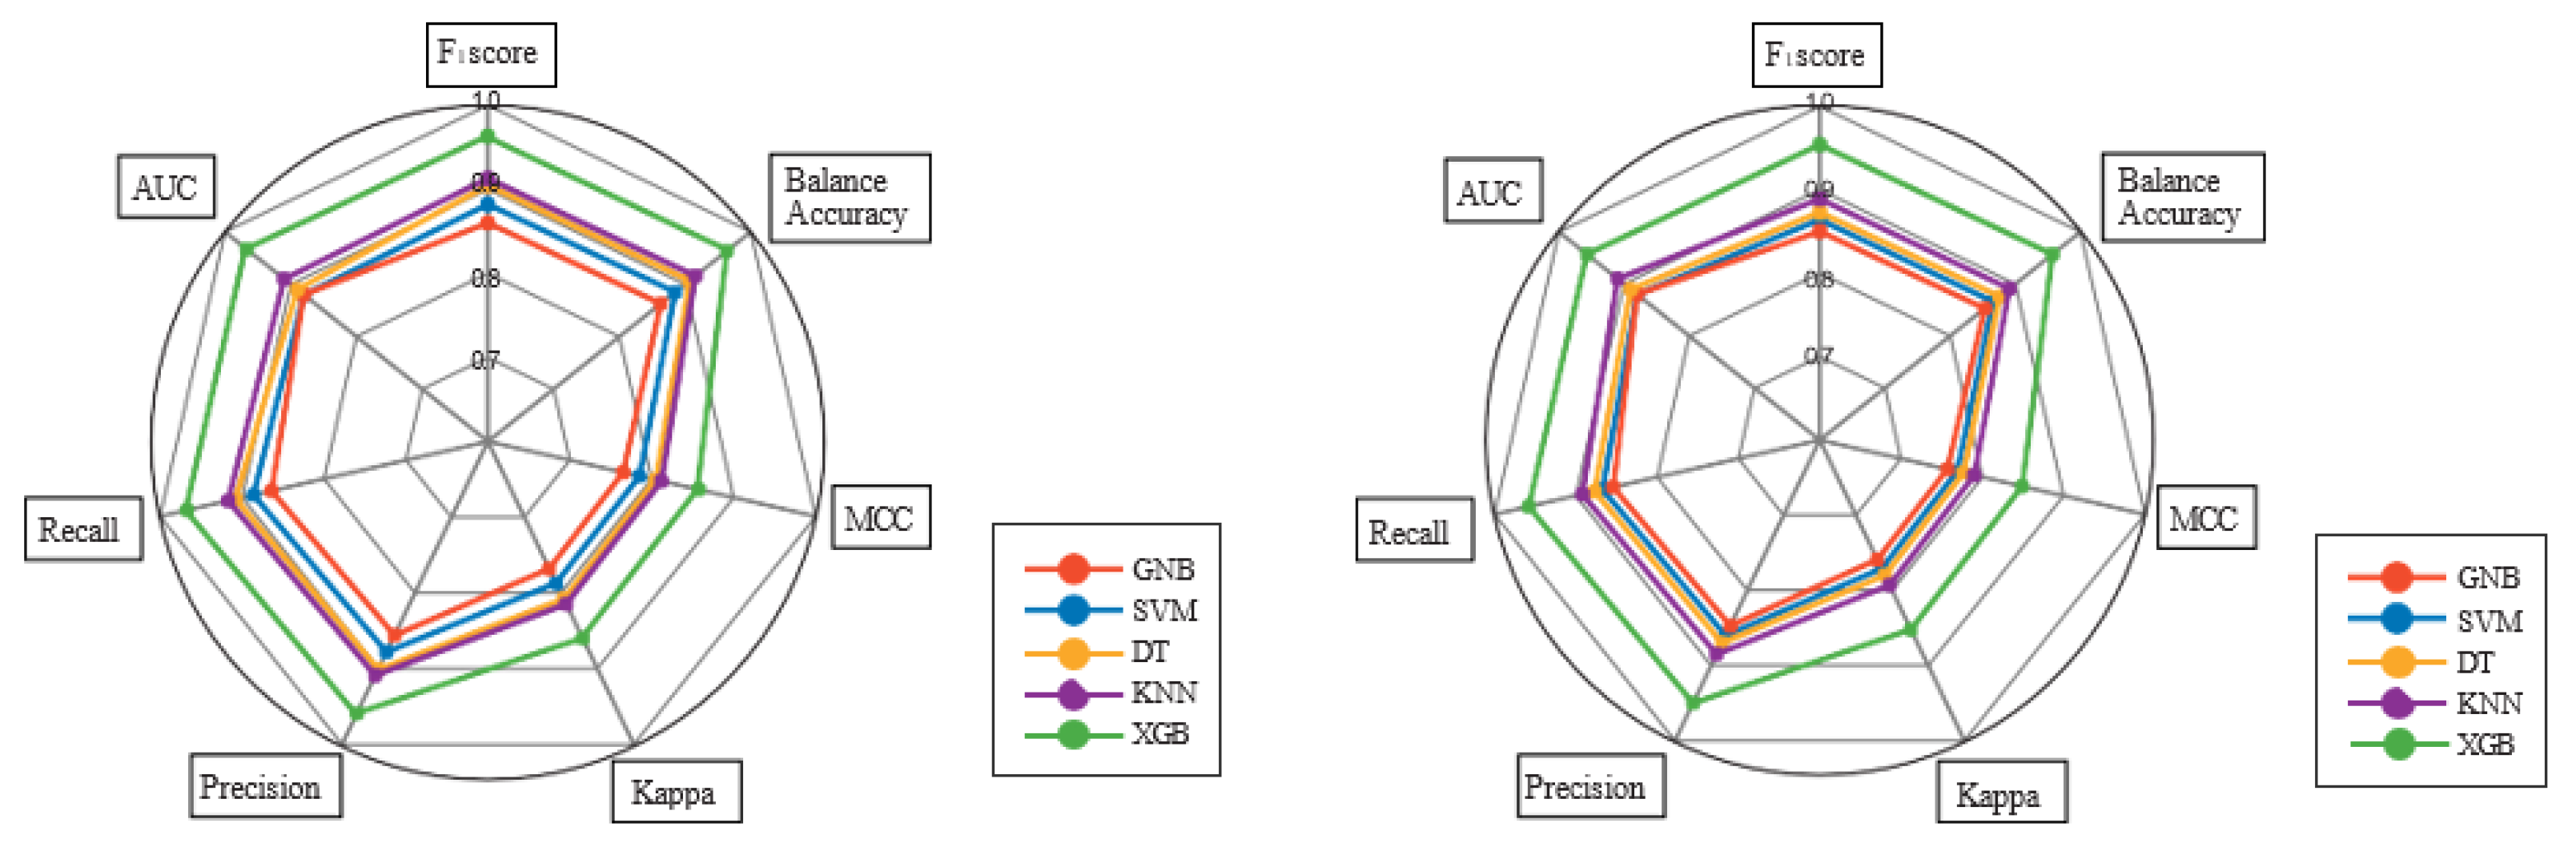
4. Results
5. Discussion
6. Conclusions
Author Contributions
Funding
Institutional Review Board Statement
Informed Consent Statement
Data Availability Statement
Acknowledgments
Conflicts of Interest
References
- Angst, J. The emerging epidemiology of hypomania and bipolar II disorder. J. Affect. Disord. 1998, 50, 143–151. [Google Scholar] [CrossRef]
- Velligan, D.I.; Rao, S. The Epidemiology and Global Burden of Schizophrenia. J. Clin. Psychiatry 2023, 84, 45094. [Google Scholar] [CrossRef] [PubMed]
- Goldner, E.M.; Hsu, L.; Waraich, P.; Somers, J.M. Prevalence and incidence studies of schizophrenic disorders: A systematic review of the literature. Can. J. Psychiatry 2002, 47, 833–843. [Google Scholar] [CrossRef]
- Keck, P.E.; Kessler, R.C.; Ross, R. Clinical and economic effects of unrecognized or inadequately treated bipolar disorder. J. Psychiatr. Pract. 2008, 14 (Suppl. S2), 31–38. [Google Scholar] [CrossRef] [PubMed]
- Hales, R.E. The American Psychiatric Publishing Textbook of Psychiatry, 7th ed.; American Psychiatric Pub: Arlington, VA, USA, 2019. [Google Scholar]
- Sörnmo, L.; Laguna, P. Bioelectrical Signal Processing in Cardiac and Neurological Applications; Elsevier Academic Press: Amsterdam, The Netherlands, 2005. [Google Scholar]
- Ramón, A.; Zaragozá, M.; Torres, A.M.; Cascón, J.; Blasco, P.; Milara, J.; Mateo, J. Application of Machine Learning in Hospitalized Patients with Severe COVID-19 Treated with Tocilizumab. J. Clin. Med. 2022, 11, 4729. [Google Scholar] [CrossRef]
- Peng, J.; Zou, K.; Zhou, M.; Teng, Y.; Zhu, X.; Zhang, F.; Xu, J. An Explainable Artificial Intelligence Framework for the Deterioration Risk Prediction of Hepatitis Patients. J. Med. Syst. 2021, 45, 61. [Google Scholar] [CrossRef]
- Nascimento, N.M.M.; Marinho, L.B.; Peixoto, S.A.; do Vale Madeiro, J.P.; de Albuquerque, V.H.C.; Rebouças Filho, P.P. Heart arrhythmia classification based on statistical moments and structural co-occurrence. Circuits Syst. Signal Process. 2020, 39, 631–650. [Google Scholar] [CrossRef]
- Neto, C.; Senra, F.; Leite, J.; Rei, N.; Rodrigues, R.; Ferreira, D.; Machado, J. Different Scenarios for the Prediction of Hospital Readmission of Diabetic Patients. J. Med. Syst. 2021, 45, 11. [Google Scholar] [CrossRef] [PubMed]
- Figueiredo, J.; Santos, C.P.; Moreno, J.C. Automatic recognition of gait patterns in human motor disorders using machine learning: A review. Med. Eng. Phys. 2018, 53, 1–12. [Google Scholar] [CrossRef]
- Frid, A.; Shor, M.; Shifrin, A.; Yarnitsky, D.; Granovsky, Y. A biomarker for discriminating between migraine with and without aura: Machine learning on functional connectivity on resting-state EEGs. Ann. Biomed. Eng. 2020, 48, 403–412. [Google Scholar] [CrossRef]
- Martinho, D.; Freitas, A.; Sá-Sousa, A.; Vieira, A.; Meira, J.; Martins, C.; Marreiros, G. A Hybrid Model to Classify Patients with Chronic Obstructive Respiratory Diseases. J. Med. Syst. 2021, 45, 31. [Google Scholar] [CrossRef]
- Wang, F.; Wang, H.; Zhou, X.; Fu, R. A Driving Fatigue Feature Detection Method Based on Multifractal Theory. IEEE Sens. J. 2022, 22, 19046–19059. [Google Scholar] [CrossRef]
- Zhu, H.; Xue, M.; Wang, Y.; Yuan, G.; Li, X. Fast Visual Tracking with Siamese Oriented Region Proposal Network. IEEE Signal Process. Lett. 2022, 29, 1437–1441. [Google Scholar] [CrossRef]
- Wang, H.; Wang, K.; Xue, Q.; Peng, M.; Yin, L.; Gu, X.; Leng, H.; Lu, J.; Liu, H.; Wang, D.; et al. Transcranial alternating current stimulation for treating depression: A randomized controlled trial. Brain 2022, 145, 83–91. [Google Scholar] [CrossRef] [PubMed]
- Lv, Z.; Yu, Z.; Xie, S.; Alamri, A. Deep Learning-based Smart Predictive Evaluation for Interactive Multimedia-enabled Smart Healthcare. ACM Trans. Multimed. Comput. Commun. Appl. 2022, 18, 1–20. [Google Scholar] [CrossRef]
- Azevedo, A. Data mining and knowledge discovery in databases. In Advanced Methodologies and Technologies in Network Architecture, Mobile Computing, and Data Analytics; IGI Global: Hershey, PA, USA, 2019. [Google Scholar]
- Kumar, T.S.; Kumutha, D. Comparative Analysis of the Fuzzy C-Means and Neuro-Fuzzy Systems for Detecting Retinal Disease. Circuits Syst. Signal Process. 2020, 39, 698–720. [Google Scholar] [CrossRef]
- De las Casas, H.; Bianco, S.; Richter, H. Targeted muscle effort distribution with exercise robots: Trajectory and resistance effects. Med. Eng. Phys. 2021, 94, 70–79. [Google Scholar] [CrossRef] [PubMed]
- Rane, L.; Ding, Z.; McGregor, A.H.; Bull, A.M. Deep learning for musculoskeletal force prediction. Ann. Biomed. Eng. 2019, 47, 778–789. [Google Scholar] [CrossRef] [PubMed]
- Ghosh, R.; Chanda, S.; Chakraborty, D. Qualitative predictions of bone growth over optimally designed macro-textured implant surfaces obtained using NN-GA based machine learning framework. Med. Eng. Phys. 2021, 95, 64–75. [Google Scholar] [CrossRef]
- Olthof, A.; van Ooijen, P.; Cornelissen, L. Deep Learning-Based Natural Language Processing in Radiology: The Impact of Report Complexity, Disease Prevalence, Dataset Size, and Algorithm Type on Model Performance. J. Med. Syst. 2021, 45, 91. [Google Scholar] [CrossRef]
- Han, J.; Pei, J.; Kamber, M. Data Mining: Concepts and Techniques, 3rd ed.; Morgan Kaufmann: Burlington, MA, USA, 2016. [Google Scholar]
- Kafai, M.; Eshghi, K. CROification: Accurate kernel classification with the efficiency of sparse linear SVM. IEEE Trans. Pattern Anal. Mach. Intell. 2017, 41, 34–48. [Google Scholar] [CrossRef] [PubMed]
- Li, S.S.; Chu, C.C.; Chow, D.H. EMG-based lumbosacral joint compression force prediction using a support vector machine. Med. Eng. Phys. 2019, 74, 115–120. [Google Scholar] [CrossRef]
- Shim, M.; Hwang, H.J.; Kim, D.W.; Lee, S.H.; Im, C.H. Machine-learning-based diagnosis of schizophrenia using combined sensor-level and source-level EEG features. Schizophr. Res. 2016, 176, 314–319. [Google Scholar] [CrossRef]
- Chen, P.H.; Lien, C.W.; Wu, W.C.; Lee, L.S.; Shaw, J.S. Gait-Based Machine Learning for Classifying Patients with Different Types of Mild Cognitive Impairment. J. Med. Syst. 2020, 44, 107. [Google Scholar] [CrossRef] [PubMed]
- Zhang, S.; Li, X.; Zong, M.; Zhu, X.; Wang, R. Efficient kNN classification with different numbers of nearest neighbors. IEEE Trans. Neural Netw. Learn. Syst. 2017, 29, 1774–1785. [Google Scholar] [CrossRef]
- Murugan, A.; Nair, S.A.H.; Kumar, K.S. Detection of skin cancer using SVM, random forest and kNN classifiers. J. Med. Syst. 2019, 43, 269. [Google Scholar] [CrossRef] [PubMed]
- de Mendonça Mesquita, E.; Rodrigues, F.B.; Rodrigues, A.P.; Lemes, T.S.; Andrade, A.O.; Vieira, M.F. Discrimination capability of linear and nonlinear gait features in group classification. Med. Eng. Phys. 2021, 93, 59–71. [Google Scholar] [CrossRef]
- Sharmila, A.; Geethanjali, P. Detection of Epileptic Seizure from Electroencephalogram Signals Based on Feature Ranking and Best Feature Subset Using Mutual Information Estimation. J. Med. Imaging Health Inform. 2016, 6, 1850–1864. [Google Scholar] [CrossRef]
- Das, B.K.; Dutta, H.S. GFNB: Gini index–based Fuzzy Naive Bayes and blast cell segmentation for leukemia detection using multi-cell blood smear images. Med. Biol. Eng. Comput. 2020, 58, 2789–2803. [Google Scholar] [CrossRef] [PubMed]
- Sabeti, M.; Katebi, S.; Boostani, R. Entropy and complexity measures for EEG signal classification of schizophrenic and control participants. Artif. Intell. Med. 2009, 47, 263–274. [Google Scholar] [CrossRef]
- Saravanakumar, S.; Thangaraj, P. A computer aided diagnosis system for identifying Alzheimer’s from MRI Scan using Improved Adaboost. J. Med. Syst. 2019, 43, 76. [Google Scholar] [CrossRef] [PubMed]
- Rivera-Lopez, R.; Canul-Reich, J. Construction of near-optimal axis-parallel decision trees using a differential-evolution-based approach. IEEE Access 2018, 6, 5548–5563. [Google Scholar] [CrossRef]
- Chen, T.; Guestrin, C. Xgboost: A scalable tree boosting system. In Proceedings of the 22nd ACM SIGKDD International Conference on Knowledge Discovery and Data Mining, San Francisco, CA, USA, 13–17 August 2016; pp. 785–794. [Google Scholar]
- Chang, W.; Liu, Y.; Wu, X.; Xiao, Y.; Zhou, S.; Cao, W. A New Hybrid XGBSVM Model: Application for Hypertensive Heart Disease. IEEE Access 2019, 7, 175248–175258. [Google Scholar] [CrossRef]
- Chen, W.; Fu, K.; Zuo, J.; Zheng, X.; Huang, T.; Ren, W. Radar emitter classification for large data set based on weighted-xgboost. IET Radar Sonar Navig. 2017, 11, 1203–1207. [Google Scholar] [CrossRef]
- Mateo, J.; Torres, A.; Soria, C.; Santos, J. A method for removing noise from continuous brain signal recordings. Comput. Electr. Eng. 2013, 39, 1561–1570. [Google Scholar] [CrossRef]
- Perrin, F.; Pernier, J.; Bertrand, O.; Echallier, J. Spherical splines for scalp potential and current density mapping. Electroencephalogr. Clin. Neurophysiol. 1989, 72, 184–187. [Google Scholar] [CrossRef] [PubMed]
- Chen, W.; Lei, X.; Chakrabortty, R.; Pal, S.C.; Sahana, M.; Janizadeh, S. Evaluation of different boosting ensemble machine learning models and novel deep learning and boosting framework for head-cut gully erosion susceptibility. J. Environ. Manag. 2021, 284, 112015. [Google Scholar] [CrossRef] [PubMed]
- Cherif, I.L.; Kortebi, A. On using eXtreme gradient boosting (XGBoost) machine learning algorithm for home network traffic classification. In Proceedings of the 2019 Wireless Days (WD), Manchester, UK, 24–26 April 2019; pp. 1–6. [Google Scholar]
- Yu, S.; Li, X.; Zhang, X.; Wang, H. The OCS-SVM: An objective-cost-sensitive SVM with sample-based misclassification cost invariance. IEEE Access 2019, 7, 118931–118942. [Google Scholar] [CrossRef]
- Balaji, E.; Brindha, D.; Elumalai, V.K.; Umesh, K. Data-driven gait analysis for diagnosis and severity rating of Parkinson’s disease. Med. Eng. Phys. 2021, 91, 54–64. [Google Scholar]
- Lee, J.S.; Yang, B.H.; Lee, J.H.; Choi, J.H.; Choi, I.G.; Kim, S.B. Detrended fluctuation analysis of resting EEG in depressed outpatients and healthy controls. Clin. Neurophysiol. 2007, 118, 2489–2496. [Google Scholar] [CrossRef] [PubMed]
- Ocak, H. Automatic detection of epileptic seizures in EEG using discrete wavelet transform and approximate entropy. Expert Syst. Appl. 2009, 36, 2027–2036. [Google Scholar] [CrossRef]
- Kannathal, N.; Acharya, U.R.; Lim, C.M.; Sadasivan, P. Characterization of EEG—A comparative study. Comput. Methods Programs Biomed. 2005, 80, 17–23. [Google Scholar] [CrossRef]
- Harne, B.P. Higuchi fractal dimension analysis of EEG signal before and after OM chanting to observe overall effect on brain. Int. J. Electr. Comput. Eng. 2014, 4, 585. [Google Scholar] [CrossRef]
- Röschke, J.; Fell, J.; Beckmann, P. The calculation of the first positive Lyapunov exponent in sleep EEG data. Electroencephalogr. Clin. Neurophysiol. 1993, 86, 348–352. [Google Scholar] [CrossRef] [PubMed]
- Mahato, S.; Paul, S. Classification of depression patients and normal subjects based on electroencephalogram (EEG) signal using alpha power and theta asymmetry. J. Med. Syst. 2020, 44, 28. [Google Scholar] [CrossRef] [PubMed]
- Zhou, X.; Obuchowski, N.A.; McClish, D.K. Statistical Methods in Diagnostic Medicine, 2nd ed.; John Wiley and Sons: Hoboken, NJ, USA, 2011. [Google Scholar]
- Ahmad, M.; Ding, Y.; Qadri, S.F.; Yang, J. Convolutional-neural-network-based feature extraction for liver segmentation from CT images. In Proceedings of the Eleventh International Conference on Digital Image Processing (ICDIP 2019), Guangzhou, China, 10–13 May 2019; Volume 11179, pp. 829–835. [Google Scholar]
- Qadri, S.F.; Shen, L.; Ahmad, M.; Qadri, S.; Zareen, S.S.; Akbar, M.A. SVseg: Stacked Sparse Autoencoder-Based Patch Classification Modeling for Vertebrae Segmentation. Mathematics 2022, 10, 796. [Google Scholar] [CrossRef]
- Penn, D.L.; Roberts, D.L.; Combs, D.; Sterne, A. Best practices: The development of the social cognition and interaction training program for schizophrenia spectrum disorders. Psychiatr. Serv. 2007, 58, 449–451. [Google Scholar] [CrossRef] [PubMed]
- Ma, B.; Meng, F.; Yan, G.; Yan, H.; Chai, B.; Song, F. Diagnostic classification of cancers using extreme gradient boosting algorithm and multi-omics data. Comput. Biol. Med. 2020, 121, 103761. [Google Scholar] [CrossRef] [PubMed]
- Torlay, L.; Perrone Bertolotti, M.; Thomas, E.; Baciu, M. Machine learning XGBoost analysis of language networks to classify patients with epilepsy. Brain Inform. 2017, 4, 159–169. [Google Scholar] [CrossRef]
- Ogunleye, A.A.; Qing-Guo, W. XGBoost model for chronic kidney disease diagnosis. IEEE/ACM Trans. Comput. Biol. Bioinform. 2019, 17, 2131–2140. [Google Scholar] [CrossRef]
- Shi, H.; Wang, H.; Huang, Y.; Zhao, L.; Qin, C.; Liu, C. A hierarchical method based on weighted extreme gradient boosting in ECG heartbeat classification. Comput. Methods Programs Biomed. 2019, 171, 1–10. [Google Scholar] [CrossRef]
- Zhong, J.; Sun, Y.; Peng, W.; Xie, M.; Yang, J.; Tang, X. XGBFEMF: An XGBoost-based framework for essential protein prediction. IEEE Trans. Nanobiosci. 2018, 17, 243–250. [Google Scholar] [CrossRef] [PubMed]
- Zhao, J.; Jin, Y.; Lin, X.; Wang, X. A novel submitochondrial localization predictor based on gradient boosting algorithm and dataset balancing treatment. Int. J. Perform. Eng. 2020, 16, 1038–1045. [Google Scholar]
- Baradits, M.; Bitter, I.; Czobor, P. Multivariate patterns of EEG microstate parameters and their role in the discrimination of patients with schizophrenia from healthy controls. Psychiatry Res. 2020, 288, 112938. [Google Scholar] [CrossRef] [PubMed]
- Johannesen, J.K.; Bi, J.; Jiang, R.; Kenney, J.G.; Chen, C.M.A. Machine learning identification of EEG features predicting working memory performance in schizophrenia and healthy adults. Neuropsychiatr. Electrophysiol. 2016, 2, 3. [Google Scholar] [CrossRef]
- Piryatinska, A.; Darkhovsky, B.; Kaplan, A. Binary classification of multichannel EEG records based on the e complexity of continuous vector functions. Comput. Methods Programs Biomed. 2017, 152, 131–139. [Google Scholar] [CrossRef] [PubMed]
- Racz, F.S.; Stylianou, O.; Mukli, P.; Eke, A. Multifractal and entropy-based analysis of delta band neural activity reveals altered functional connectivity dynamics in schizophrenia. Front. Syst. Neurosci. 2020, 14, 49. [Google Scholar] [CrossRef] [PubMed]
- Shoeibi, A.; Sadeghi, D.; Moridian, P.; Ghassemi, N.; Heras, J.; Alizadehsani, R.; Khadem, A.; Kong, Y.; Nahavandi, S.; Zhang, Y.D.; et al. Automatic Diagnosis of Schizophrenia in EEG Signals Using CNN-LSTM Models. Front. Neuroinform. 2021, 15, 77977. [Google Scholar] [CrossRef]
- Sabeti, M.; Boostani, R.; Katebi, S.; Price, G. Selection of relevant features for EEG signal classification of schizophrenic patients. Biomed. Signal Process. Control 2007, 2, 122–134. [Google Scholar] [CrossRef]
- Siuly, S.; Khare, S.K.; Bajaj, V.; Wang, H.; Zhang, Y. A computerized method for automatic detection of schizophrenia using EEG signals. IEEE Trans. Neural Syst. Rehabil. Eng. 2020, 28, 2390–2400. [Google Scholar] [CrossRef]


| SC N = 312 | SC-SUD + N = 128 | SC-SUD-N = 184 | HC N = 320 | |
|---|---|---|---|---|
| Gender Female | 97 (31.1%) | 39 (30.4%) | 58 (31.5%) | 144 (45.0%) |
| N (%) | ||||
| Mean (SD) | Mean (SD) | |||
| Age (years) | 36.6 (9.7) | 35.6 (9,5) | 38.4 (9.1) | 36.2 (12.4) |
| Age of onset | 23.8 (6.0) | 23.2 (5.1) | 24.2 (5.2) | - |
| (years) | ||||
| Duration of ill- | 12.40 (9.3) | 11.56 (9.2) | 15.2 (8.6) | - |
| ness (years) | ||||
| Antipsychotic | Atypical: 282 (90.4%) | Atypical: 116 (90.6%) | Atypical: 167 (90.7%) | - |
| Typical: 30 | Typical: 12 | Typical: 17 | ||
| (9.6%) | (9.4%) | (9.3%) | ||
| Educational | 12.5 (3.9) | 12.1 (3.5) | 12.8 (4.1) | 12.9 (3.8) |
| level [years] | ||||
| PANSS-T | 54.3 (15.8) | 54.9 (16.3) | 54.2 (16.1) | - |
| PANSS-P | 11.7 (4.3) | 12.4 (6.3) | 10.8 (5.1) | - |
| PANSS-N | 16.8 (7.1) | 17.3 (7.6) | 16.5 (8.1) | - |
| PANSS-PG | 19.3 (3.6) | 20.2 (3.7) | 19.8 (3.5) | - |
| Methods | Recall | Accuracy | F1 Score | Precision |
|---|---|---|---|---|
| SVM | 86.57 ± 0.79 | 86.86 ± 0.74 | 86.67 ± 0.76 | 85.69 ± 0.75 |
| DT | 87.48 ± 0.76 | 87.76 ± 0.82 | 87.23 ± 0.79 | 86.59 ± 0.81 |
| GNB | 85.61 ± 0.83 | 85.64 ± 0.74 | 85.25 ± 0.73 | 85.02 ± 0.69 |
| KNN | 89.63 ± 0.52 | 89.54 ± 0.61 | 89.07 ± 0.42 | 88.75 ± 0.39 |
| XGB | 94.51 ± 0.26 | 94.25 ± 0.28 | 94.92 ± 0.30 | 94.62 ± 0.27 |
| Methods | DYI | AUC | Kappa | MCC |
|---|---|---|---|---|
| SVM | 86.47 ± 0.71 | 0.86 ± 0.02 | 76.54 ± 0.67 | 75.74 ± 0.68 |
| DT | 87.53 ± 0.68 | 0.87 ± 0.02 | 76.92 ± 0.73 | 77.62 ± 0.78 |
| GNB | 85.28 ± 0.74 | 0.85 ± 0.02 | 75.62 ± 0.74 | 74.71 ± 0.83 |
| KNN | 89.71 ± 0.58 | 0.89 ± 0.02 | 79.83 ± 0.59 | 79.23 ± 0.56 |
| XGB | 94.26 ± 0.23 | 0.94 ± 0.02 | 91.53 ± 0.27 | 91.12 ± 0.24 |
| Author | Feature Extraction | Classifier | ACC (%) |
|---|---|---|---|
| Sabeti et al. [67] | Autoregression, band power | LDA | 88.23 |
| Johannesen et al. [63] | Rhythms separated using filtering | SVM | 87.00 |
| Baradits et al. [62] | Multivariate pattern analysis | SVM | 82.07 |
| Piryatinska et al. [64] | e complexity vector | RF | 83.60 |
| Siuly, et al. [68] | EMD, five statistical features | EBT | 89.59 |
| Racz, et al. [65] | Graph-based features | RF | 89.29 |
| Shim et al. [27] | Combined sensor and source level EEG features | SVM | 88.24 |
| Sabeti et al. [34] | Entropy, complexity | Adaboost | 91.00 |
| Proposed | Higuchi, Band power, DFA, Hurst | XGB | 94.25 |
Disclaimer/Publisher’s Note: The statements, opinions and data contained in all publications are solely those of the individual author(s) and contributor(s) and not of MDPI and/or the editor(s). MDPI and/or the editor(s) disclaim responsibility for any injury to people or property resulting from any ideas, methods, instructions or products referred to in the content. |
© 2023 by the authors. Licensee MDPI, Basel, Switzerland. This article is an open access article distributed under the terms and conditions of the Creative Commons Attribution (CC BY) license (https://creativecommons.org/licenses/by/4.0/).
Share and Cite
Soria, C.; Arroyo, Y.; Torres, A.M.; Redondo, M.Á.; Basar, C.; Mateo, J. Method for Classifying Schizophrenia Patients Based on Machine Learning. J. Clin. Med. 2023, 12, 4375. https://doi.org/10.3390/jcm12134375
Soria C, Arroyo Y, Torres AM, Redondo MÁ, Basar C, Mateo J. Method for Classifying Schizophrenia Patients Based on Machine Learning. Journal of Clinical Medicine. 2023; 12(13):4375. https://doi.org/10.3390/jcm12134375
Chicago/Turabian StyleSoria, Carmen, Yoel Arroyo, Ana María Torres, Miguel Ángel Redondo, Christoph Basar, and Jorge Mateo. 2023. "Method for Classifying Schizophrenia Patients Based on Machine Learning" Journal of Clinical Medicine 12, no. 13: 4375. https://doi.org/10.3390/jcm12134375
APA StyleSoria, C., Arroyo, Y., Torres, A. M., Redondo, M. Á., Basar, C., & Mateo, J. (2023). Method for Classifying Schizophrenia Patients Based on Machine Learning. Journal of Clinical Medicine, 12(13), 4375. https://doi.org/10.3390/jcm12134375