
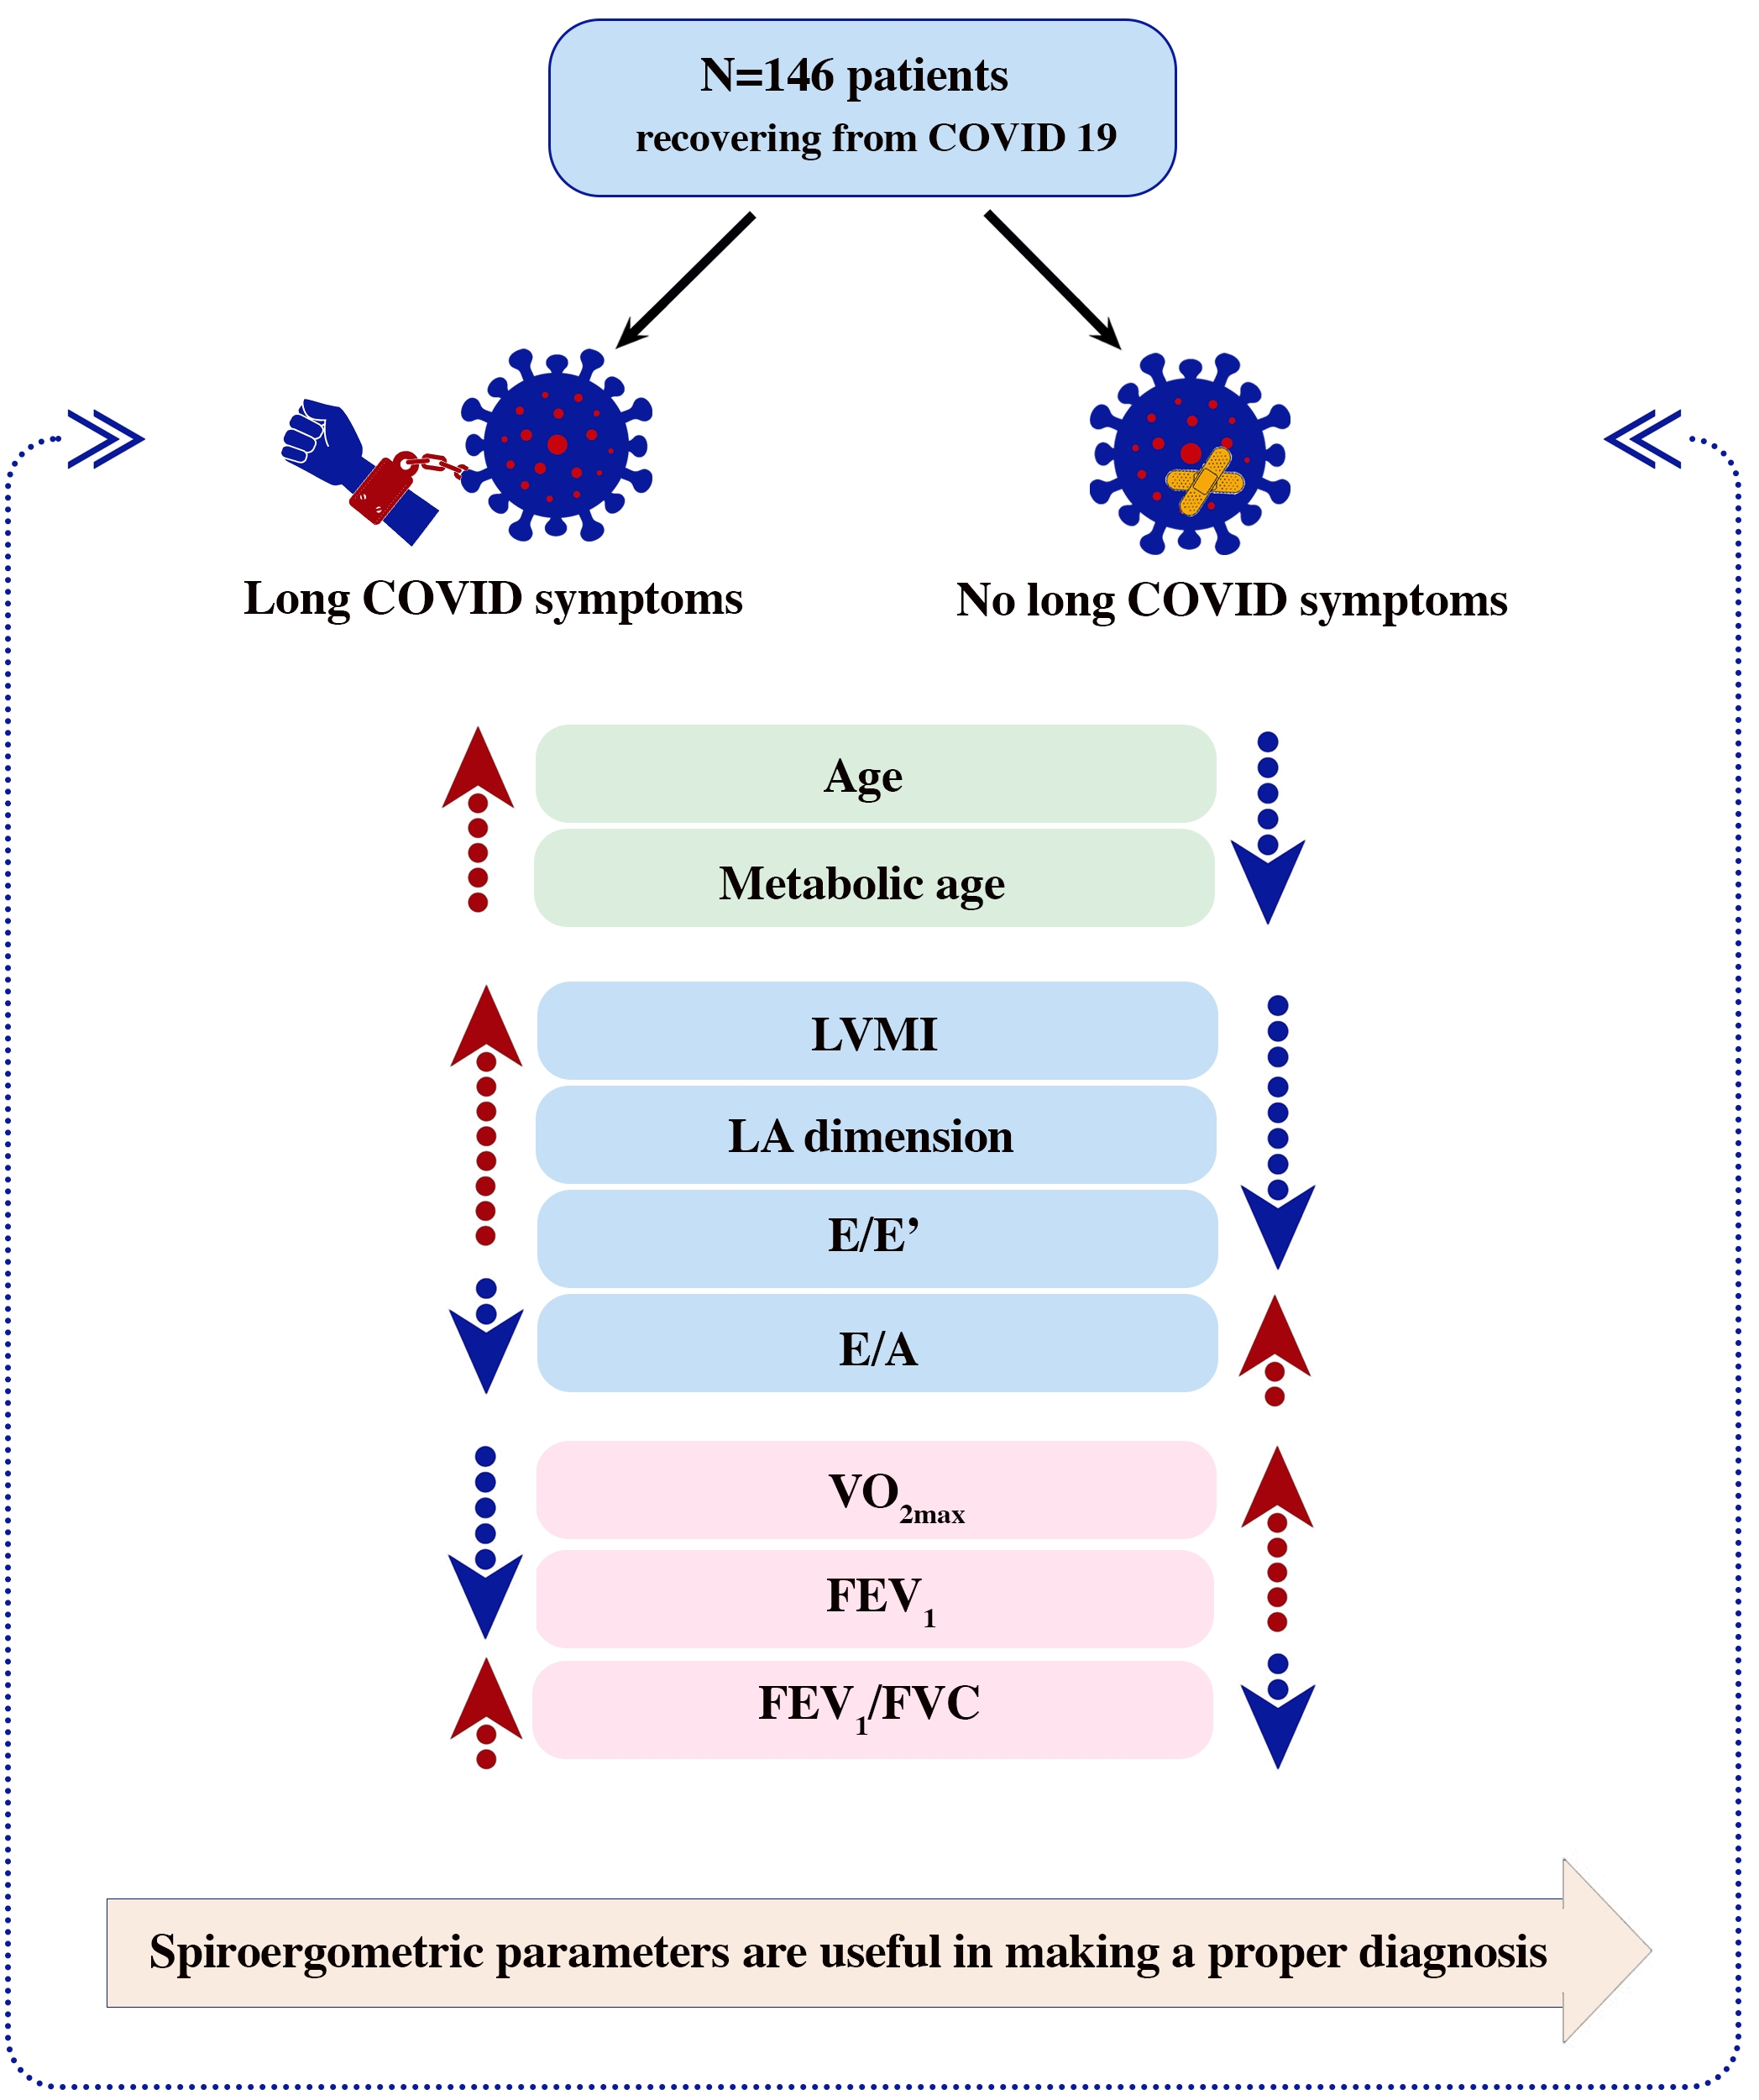
Diagnostic Usefulness of Spiroergometry and Risk Factors of Long COVID in Patients with Normal Left Ventricular Ejection Fraction

 , ,
, ,  ,
,  and
and 
Abstract
:
1. Introduction
2. Materials and Methods
2.1. Basic Characteristics
2.2. Laboratory Tests
2.3. Echocardiography
2.4. Spiroergometry
2.5. Body Mass Analysis
2.6. Statistical Analysis
3. Results
3.1. Evaluation of Basic Characteristics
3.2. Evaluation of Laboratory Tests
3.3. Evaluation of Echocardiography
3.4. Evaluation of Spiroergometry
3.5. Evaluation of Body Mass Analysis
3.6. Multivariate Analysis
4. Discussion
5. Conclusions
Author Contributions
Funding
Institutional Review Board Statement
Informed Consent Statement
Data Availability Statement
Conflicts of Interest
References
- Wu, J.T.; Leung, K.; Leung, G.M. Nowcasting and forecasting the potential domestic and international spread of the 2019-nCoV outbreak originating in Wuhan, China: A modelling study. Lancet 2020, 395, 689–697. [Google Scholar] [CrossRef] [Green Version]
- World Health Organization. Coronavirus Disease (COVID-19) Pandemic. 2020. Available online: https://www.who.int/emergencies/diseases/novel-coronavirus-2019 (accessed on 8 May 2023).
- Lovato, A.; de Filippis, C.; Marioni, G. Upper airway symptoms in coronavirus disease 2019 (COVID-19). Am. J. Otolaryngol. 2020, 41, 102474. [Google Scholar] [CrossRef] [PubMed]
- Cyranoski, D. Profile of a killer: The complex biology powering the coronavirus pandemic. Nature 2020, 581, 22–26. [Google Scholar] [CrossRef] [PubMed]
- Ge, X.-Y.; Li, J.-L.; Yang, X.-L.; Chmura, A.A.; Zhu, G.; Epstein, J.H.; Mazet, J.K.; Hu, B.; Zhang, W.; Peng, C.; et al. Isolation and characterization of a bat SARS-like coronavirus that uses the ACE2 receptor. Nature 2013, 503, 535–538. [Google Scholar] [CrossRef] [PubMed] [Green Version]
- Bielecka-Dabrowa, A.; Cichocka-Radwan, A.; Lewek, J.; Pawliczak, F.; Maciejewski, M.; Banach, M. Cardiac manifestations of COVID-19. Rev. Cardiovasc. Med. 2021, 22, 365–371. [Google Scholar] [CrossRef] [PubMed]
- Sudre, C.H.; Murray, B.; Varsavsky, T.; Graham, M.S.; Penfold, R.S.; Bowyer, R.C.; Pujol, J.C.; Klaser, K.; Antonelli, M.; Canas, L.S.; et al. Attributes and Predictors of Long COVID. Nat. Med. 2021, 27, 626–631. [Google Scholar] [CrossRef]
- Al-Aly, Z.; Xie, Y.; Bowe, B. High-dimensional characterization of post-acute sequelae of COVID-19. Nature 2021, 594, 259–264. [Google Scholar] [CrossRef]
- Xie, Y.; Xu, E.; Bowe, B.; Al-Aly, Z. Long-term cardiovascular outcomes of COVID-19. Nat. Med. 2022, 28, 583–590. [Google Scholar] [CrossRef]
- Fletcher, G.F.; Oken, K.R.; Safford, R.E. Comprehensive rehabilitation of patients with coronary artery disease. In Heart Disease, a Textbook of Cardiovascular Medicine, 6th ed.; Braunwald, E., Ed.; Saunders: Philadelphia, PA, USA, 2001; pp. 1406–1421. [Google Scholar]
- Gryglewska-Wawrzak, K.; Sakowicz, A.; Banach, M.; Maciejewski, M.; Bielecka-Dabrowa, A. Factors of Persistent Limited Exercise Tolerance in Patients after COVID-19 with Normal Left Ventricular Ejection Fraction. Biomedicines 2022, 10, 3257. [Google Scholar] [CrossRef]
- Mitchell, C.; Rahko, P.S.; Blauwet, L.A.; Canaday, B.; Finstuen, J.A.; Foster, M.C.; Horton, K.; Ogunyankin, K.O.; Palma, R.A.; Velazquez, E.J. Guidelines for Performing a Comprehensive Transthoracic Echocardiographic Examination in Adults: Recommendations from the American Society of Echocardiography. J. Am. Soc. Echocardiogr. 2018, 32, 1–64. [Google Scholar] [CrossRef]
- Kosaraju, A.; Goyal, A.; Grigorova, Y. Left Ventricular Ejection Fraction. In StatPearls; StatPearls Publishing: Treasure Island, FL, USA, 2022. [Google Scholar]
- Zhang, X.; Wei, X.; Kong, L.; Liu, M.; Tang, H. Evaluating the left ventricular global systolic function of patients with diabetes mellitus by the real-time three-plane speckle tracking imaging. Sheng Wu Yi Xue Gong Cheng Xue Za Zhi = J. Biomed. Eng. 2013, 30, 513–517. (In Chinese) [Google Scholar]
- Tousignant, C.; Kim, H.; Papa, F.; Mazer, C.D. Evaluation of TAPSE as a measure of right ventricular output. Can. J. Anaesth. 2012, 59, 376–383. [Google Scholar] [CrossRef] [Green Version]
- Pierce, R. Spirometry: An essential clinical measurement. Aust. Fam. Physician 2005, 34, 535–539. [Google Scholar]
- Haynes, J.M. Basic spirometry testing and interpretation for the primary care provider. Can. J. Respir. Ther. 2018, 54, 92–98. [Google Scholar] [CrossRef]
- Albouaini, K.; Egred, M.; Alahmar, A.; Wright, D.J. Cardiopulmonary exercise testing and its application. Postgrad. Med. J. 2007, 83, 675–682. [Google Scholar] [CrossRef] [Green Version]
- Grinstein, J.; Sawalha, Y.; Medvedofsky, D.A.; Ahmad, S.; Hofmeyer, M.; Rodrigo, M.; Kadakkal, A.; Barnett, C.; Kalantari, S.; Talati, I.; et al. VE/VCO2 slope predicts RV dysfunction and mortality after left ventricular assist device: A fresh look at cardiopulmonary stress testing for prognostication. J. Artif. Organs 2021, 24, 425–432. [Google Scholar] [CrossRef]
- Böhm, A.; Heitmann, B.L. The use of bioelectrical impedance analysis for body composition in epidemiological studies. Eur. J. Clin. Nutr. 2013, 67, S79–S85. [Google Scholar] [CrossRef]
- Jaafar, Z.A.; Kreidieh, D.; Itani, L.; Tannir, H.; El Masri, D.; El Ghoch, M. Cross-validation of prediction equations for estimating the body fat percentage in adults with obesity. Clin. Nutr. ESPEN 2021, 41, 346–350. [Google Scholar] [CrossRef]
- Tudoran, C.; Tudoran, M.; Pop, G.N.; Giurgi-Oncu, C.; Cut, T.G.; Lazureanu, V.E.; Oancea, C.; Parv, F.; Ciocarlie, T.; Bende, F. Associations between the Severity of the Post-Acute COVID-19 Syndrome and Echocardiographic Abnormalities in Previously Healthy Outpatients Following Infection with SARS-CoV-2. Biology 2021, 10, 469. [Google Scholar] [CrossRef]
- Pelà, G.; Goldoni, M.; Cavalli, C.; Perrino, F.; Tagliaferri, S.; Frizzelli, A.; Mori, P.A.; Majori, M.; Aiello, M.; Sverzellati, N.; et al. Long-Term Cardiac Sequelae in Patients Referred into a Diagnostic Post-COVID-19 Pathway: The Different Impacts on the Right and Left Ventricles. Diagnostics 2021, 11, 2059. [Google Scholar] [CrossRef]
- Messika-Zeitoun, D.; Bellamy, M.; Avierinos, J.F.; Breen, J.; Eusemann, C.; Rossi, A.; Behrenbeck, T.; Scott, C.; Tajik, J.; Enriquez-Sarano, M. Left atrial remodelling in mitral regurgitation- methodologic approach, physiological determinants, and outcome implications: A prospective quantitative Doppler-echocardiographic and electron beamcomputed tomographic study. Eur. Heart J. 2007, 28, 1773–1781. [Google Scholar] [CrossRef] [PubMed]
- Benjamin, E.J.; D’Agostino, R.B.; Belanger, A.J.; Wolf, P.A.; Levy, D. Left Atrial Size and the Risk of Stroke and Death. The Framingham heart study. Circulation 1995, 92, 835–841. [Google Scholar] [CrossRef] [PubMed]
- Fumagalli, A.; Misuraca, C.; Bianchi, A.; Borsa, N.; Limonta, S.; Maggiolini, S.; Bonardi, D.R.; Corsonello, A.; Di Rosa, M.; Soraci, L.; et al. Long-term changes in pulmonary function among patients surviving to COVID-19 pneumonia. Infection 2021, 50, 1019–1022. [Google Scholar] [CrossRef] [PubMed]
- Mancini, D.M.; Brunjes, D.L.; Lala, A.; Trivieri, M.G.; Contreras, J.P.; Natelson, B.H. Use of Cardiopulmonary Stress Testing for Patients With Unexplained Dyspnea Post-Coronavirus Disease. JACC Heart Fail. 2021, 9, 927–937. [Google Scholar] [CrossRef]
- Durstenfeld, M.S.; Sun, K.; Tahir, P.; Peluso, M.J.; Deeks, S.G.; Aras, M.A.; Grandis, D.J.; Long, C.S.; Beatty, A.; Hsue, P.Y. Use of Cardiopulmonary Exercise Testing to Evaluate Long COVID-19 Symptoms in Adults: A Systematic Review and Meta-analysis. JAMA Netw. Open 2022, 5, e2236057. [Google Scholar] [CrossRef] [PubMed]
- Kubánková, M.; Hohberger, B.; Hoffmanns, J.; Fürst, J.; Herrmann, M.; Guck, J.; Kräter, M. Physical phenotype of blood cells is altered in COVID-19. Biophys. J. 2021, 120, 2838–2847. [Google Scholar] [CrossRef]
- Bowe, B.; Xie, Y.; Xu, E.; Al-Aly, Z. Kidney Outcomes in Long COVID. J. Am. Soc. Nephrol. 2021, 32, 2851–2862. [Google Scholar] [CrossRef]
- Bode, B.; Garrett, V.; Messler, J.; McFarland, R.; Crowe, J.; Booth, R.; Klonoff, D.C. Glycemic Characteristics and Clinical Outcomes of COVID-19 Patients Hospitalized in the United States. J. Diabetes Sci. Technol. 2020, 14, 813–821. [Google Scholar] [CrossRef]
- Thygesen, K.; Alpert, J.S.; White, H.D.; Accf; Aha; Thygesen, T.F.M.C.K.; Vahanian, C.A.; Reviewers, D. Universal Definition of Myocardial Infarction. Circulation 2007, 116, 2634–2653. [Google Scholar] [CrossRef]
- Wibowo, A.; Pranata, R.; Akbar, M.R.; Purnomowati, A.; Martha, J.W. Prognostic performance of troponin in COVID-19: A diagnostic meta-analysis and meta-regression. Int. J. Infect. Dis. 2021, 105, 312–318. [Google Scholar] [CrossRef]
- Daitch, V.; Yelin, D.; Awwad, M.; Guaraldi, G.; Milić, J.; Mussini, C.; Falcone, M.; Tiseo, G.; Carrozzi, L.; Pistelli, F.; et al. Characteristics of long-COVID among older adults: A cross-sectional study. Int. J. Infect. Dis. 2022, 125, 287–293. [Google Scholar] [CrossRef]
- Pfaff, E.R.; Madlock-Brown, C.; Baratta, J.M.; Bhatia, A.; Davis, H.; Girvin, A.; Hill, E.; Kelly, E.; Kostka, K.; Loomba, J.; et al. Coding long COVID: Characterizing a new disease through an ICD-10 lens. Int. J. Infect. Dis. 2023, 21, 58. [Google Scholar] [CrossRef]
- Izzo, C.; Visco, V.; Gambardella, J.; Ferruzzi, G.J.; Rispoli, A.; Rusciano, M.R.; Toni, A.L.; Virtuoso, N.; Carrizzo, A.; Di Pietro, P.; et al. Cardiovascular Implications of microRNAs in Coronavirus Disease 2019. J. Pharmacol. Exp. Ther. 2023, 384, 102–108. [Google Scholar] [CrossRef]
- Graña, C.; Ghosn, L.; Evrenoglou, T.; Jarde, A.; Minozzi, S.; Bergman, H.; Buckley, B.S.; Probyn, K.; Villanueva, G.; Henschke, N.; et al. Efficacy and safety of COVID-19 vaccines. Cochrane Database Syst. Rev. 2022, 12, CD015477. [Google Scholar] [CrossRef]
- Mohamed, K.; Rzymski, P.; Islam, M.S.; Makuku, R.; Mushtaq, A.; Khan, A.; Ivanovska, M.; Makka, S.A.; Hashem, F.; Marquez, L.; et al. COVID-19 vaccinations: The unknowns, challenges, and hopes. J. Med. Virol. 2022, 94, 1336–1349. [Google Scholar] [CrossRef]


| Parameter | Patients with Symptoms n = 44 | Patients without Symptoms n = 102 | p |
|---|---|---|---|
| Basic characteristics | |||
| Male sex | 41% | 36% | 0.26 |
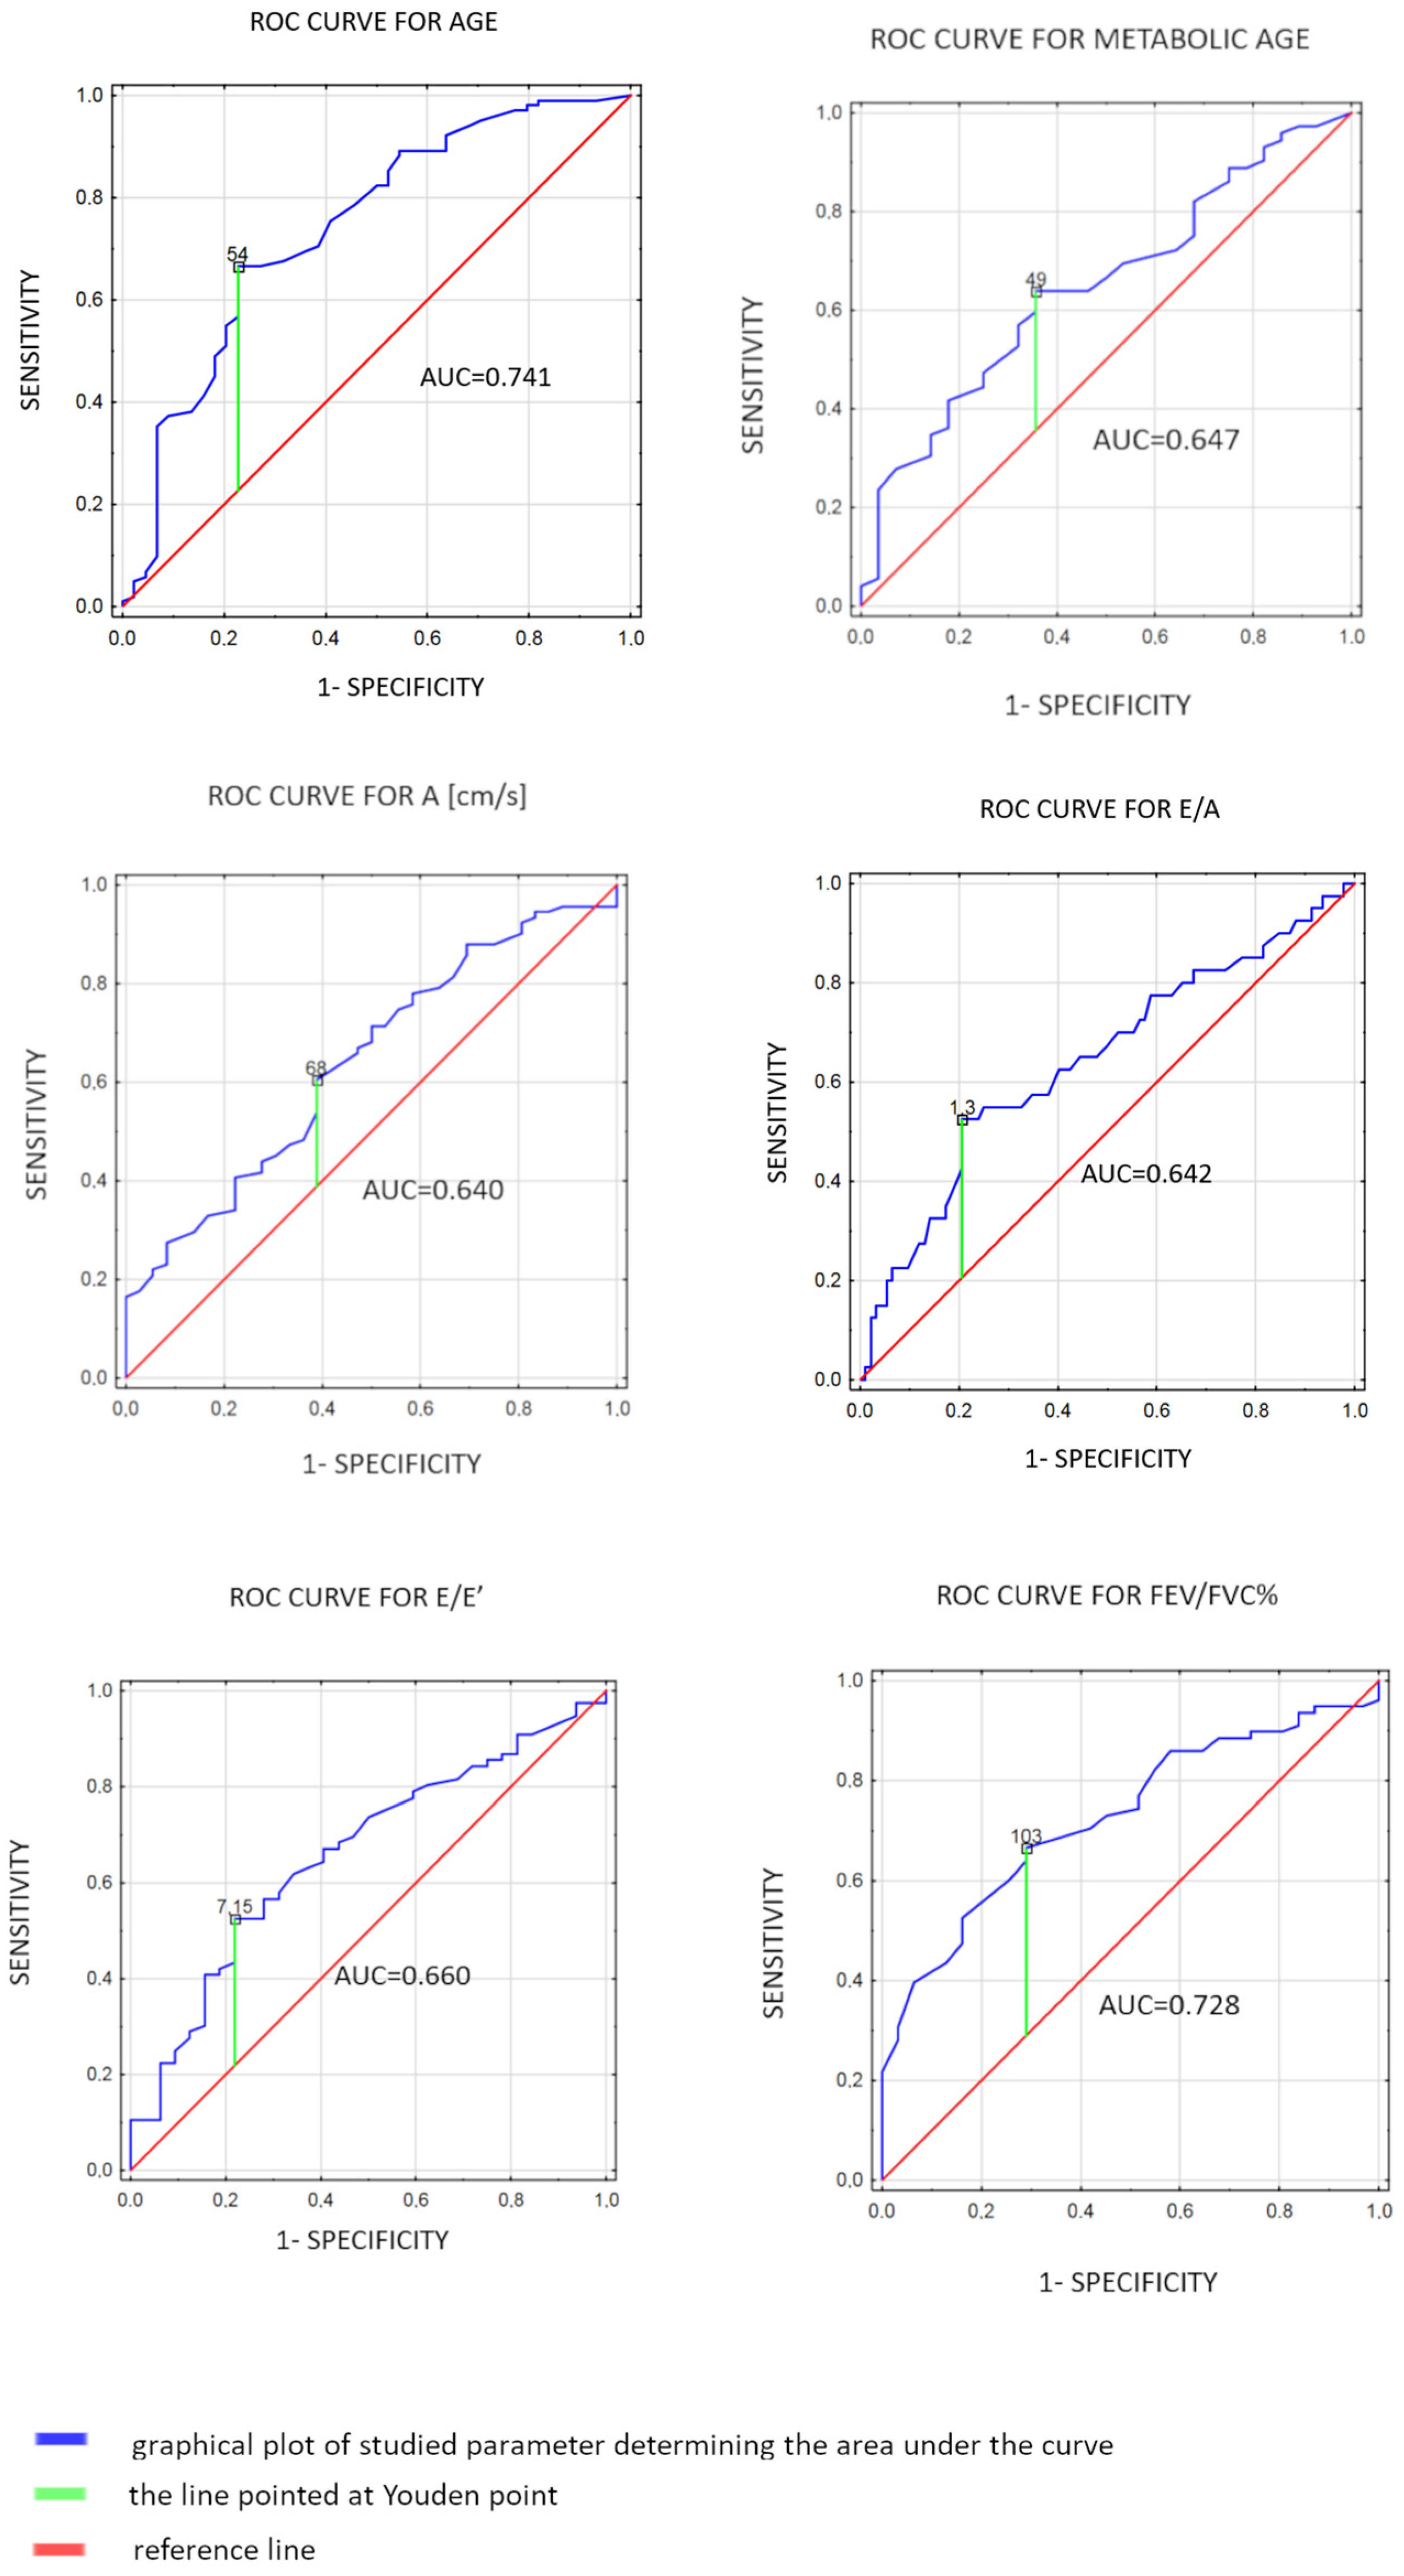
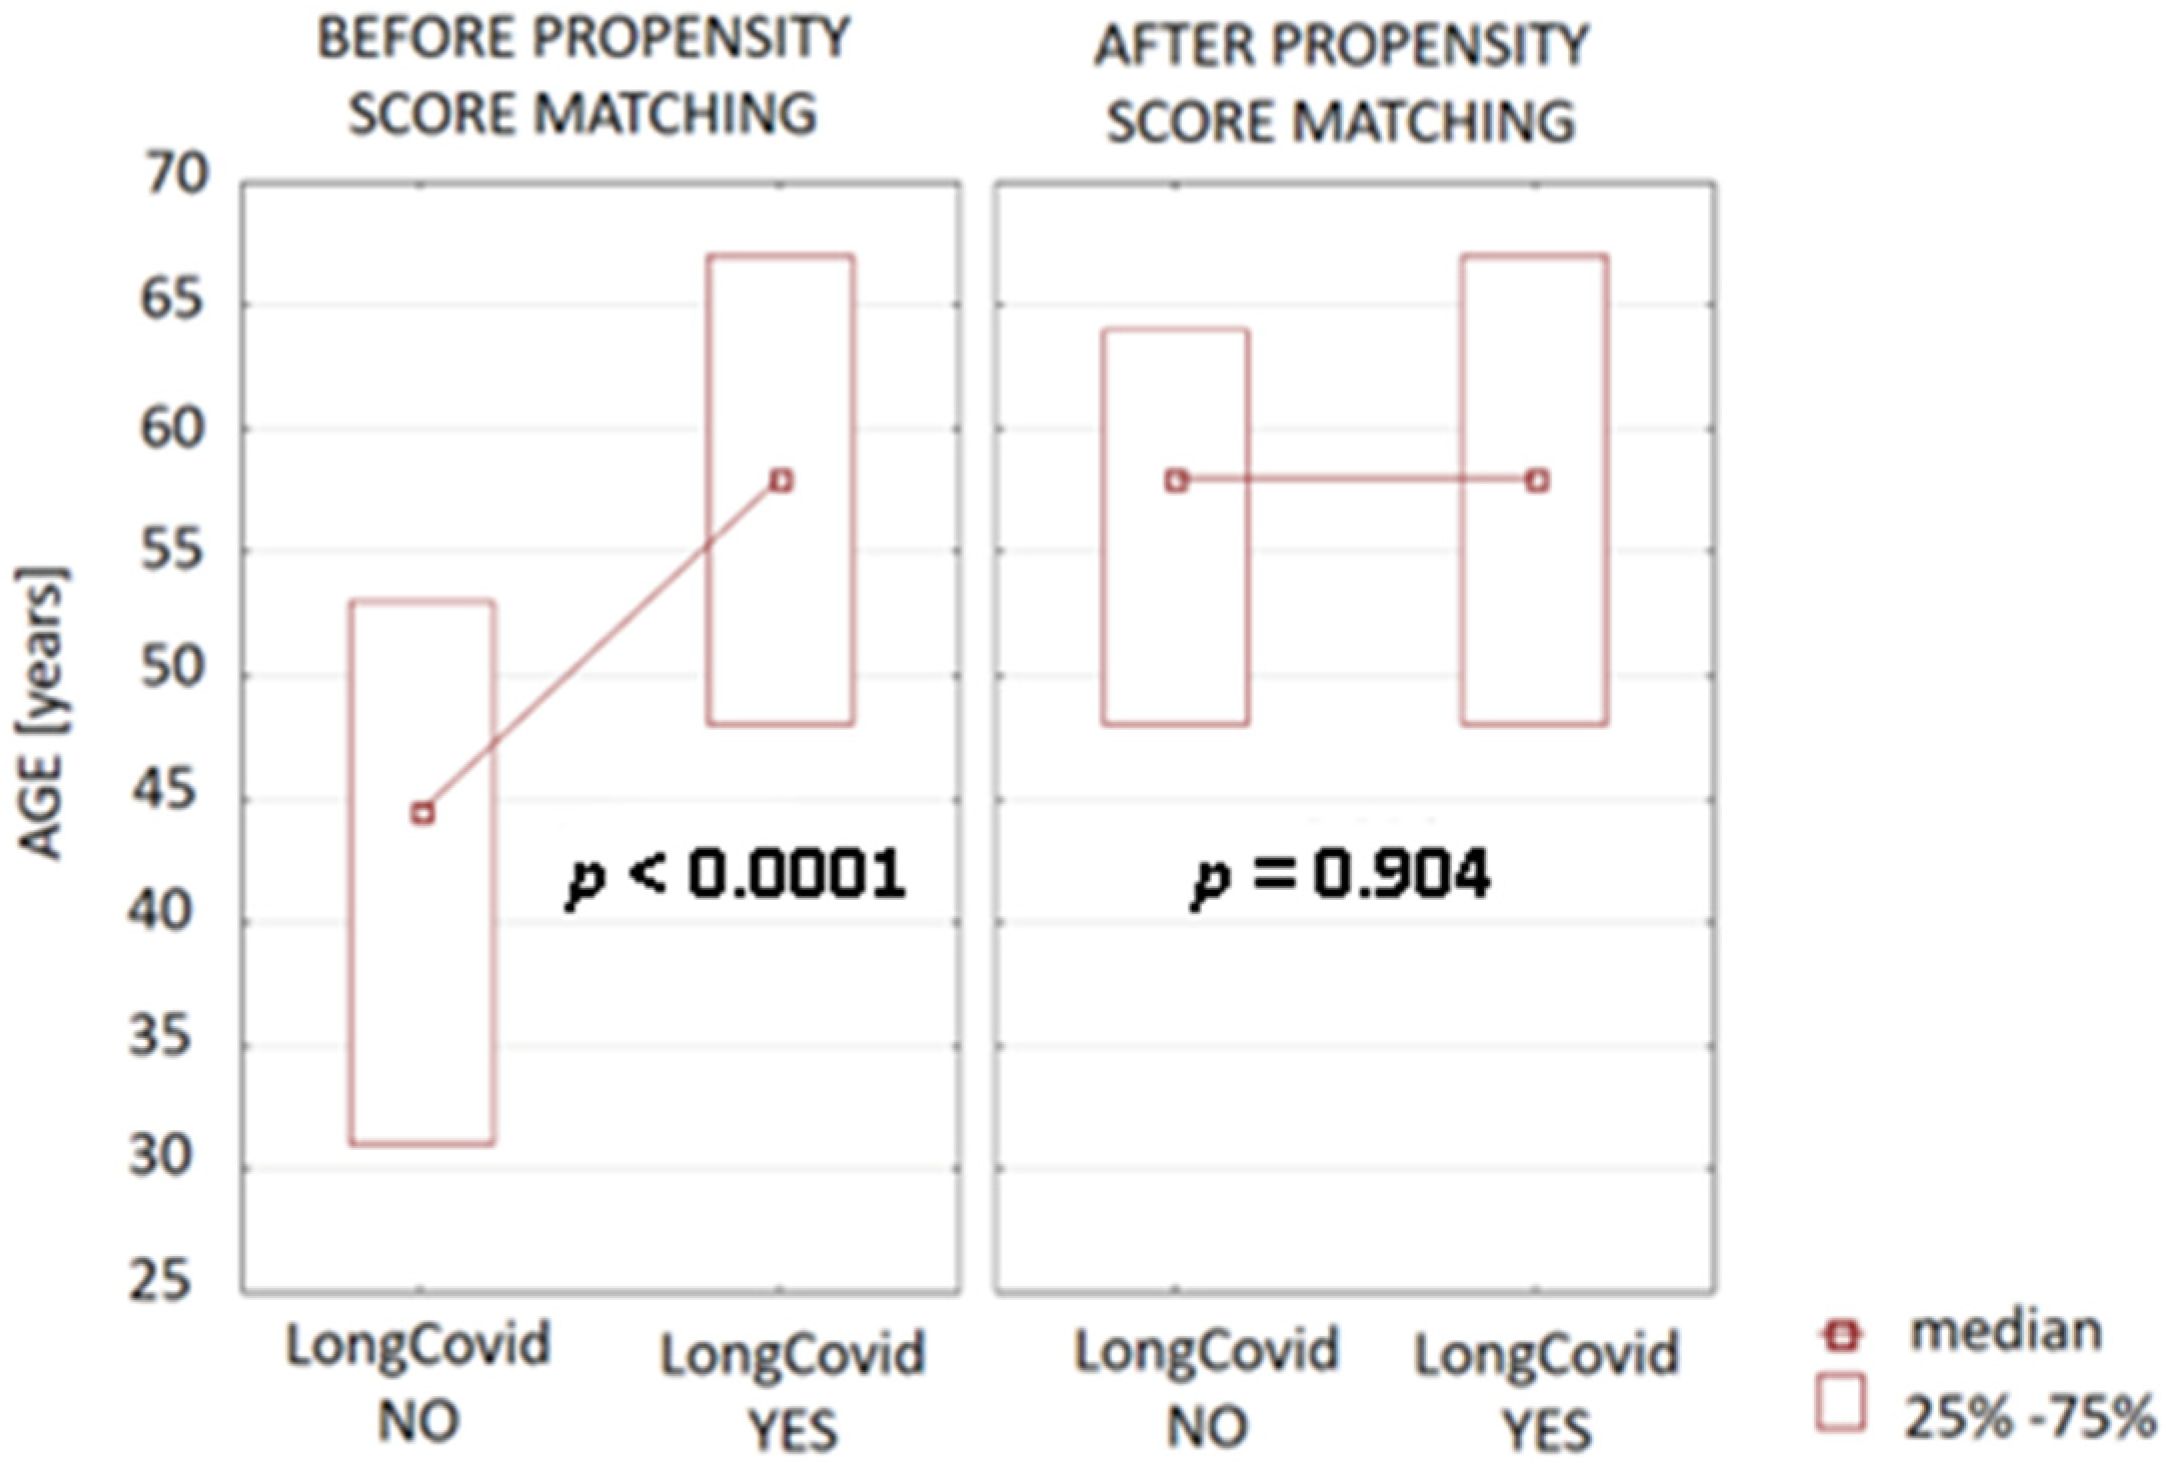
| Age | (48.00–67.00), 58.00 * | (31.00–53.00), 44.50 * | <0.0001 |
| BMI (kg/m2) | (23.90–31.12), 27.11 * | (23.85–31.16), 26.50 * | 0.62 |
| BSA (m2) | (1.73–2.01), 1.86 * | (1.78–2.11), 1.91 * | 0.35 |
| SBP (mmHg) | (124.00–140.00), 130.00 * | (125.50–147.00), 134.50 * | 0.15 |
| DBP (mmHg) | (76.00–88.00), 80.00 * | (74.00–90.00), 85.50 * | 0.26 |
| HR | (70.00–80.00), 72.00 * | (68.00–83.50), 73.50 * | 0.90 |
| HA | 54% | 46% | 0.80 |
| Dyslipidemia | 52% | 48% | 0.40 |
| DM 2 | 31% | 69% | 0.21 |
| Nicotinism | 37% | 63% | 0.78 |
| Obesity | 55% | 45% | 0.75 |
| Parameter | Patients with Symptoms n = 44 | Patients without Symptoms n = 102 | p |
|---|---|---|---|
| Laboratory tests | |||
| hs-cTnT (pg/mL) | (3.20–9.00), 6.10 * | (3.00–6.20), 3.90 * | 0.04 |
| NT-proBNP (pg/mL) | (42.00–125.00), 86.00 * | (29.00–123.00), 61.00 * | 0.051 |
| RBC (106/uL) | (4.13–4.80), 4.42 * | (4.32–5.08), 4.62 * | 0.01 |
| Hemoglobin (g/dL) | (12.60–14.50), 13.30 * | (13.00–15.30), 13.90 * | 0.07 |
| PLT (103/uL) | 218.87 (±54.59) | 223.11 (±54.56) | 0.67 |
| Creatinine (mg/dL) | (0.67–0.89), 0.79 * | (0.66–0.90), 0.77 * | 0.87 |
| GFR (mL/min/1.73 m2) | (76.10–98.80), 88.25 * | (81.80–111.30), 94.90 * | 0.03 |
| Urea (mg/dL) | 35.24 (±11.26) | 31.75 (±9.36) | 0.07 |
| Glucose (mg/dL) | (86.00–99.00), 91.50 * | (84.50–93.00), 90.00 * | 0.03 |
| ALT (U/L) | (18.00–29.00), 22.50 * | (14.50–34.00), 23.00 * | 0.93 |
| ASP (U/L) | (24.00–30.00), 26.50 * | (23.50–38.00), 27 * | 0.37 |
| CRP (mg/dL) | (0.50–0.50), 0.50 * | (0.50–0.50), 0.50 * | 0.82 |
| D-dimer (ng/mL) | (186.00–450.00), 279.00 * | (197.00–439.00), 276.00 * | 0.82 |
| TC (mg/dL) | 171.32 (±40.71) | 173.55 (±45.88) | 0.77 |
| LDL (mg/dL) | 94.54 (±34.86) | 96.80 (±29.01) | 0.71 |
| HDL (mg/dL) | (40.00–58.00), 49.50 * | (36.00–59.50), 50.50 * | 0.99 |
| TG (mg/dL) | (86.00–163.00), 111.50 * | (80.00–150.00), 101.00 * | 0.57 |
| Na (mmol/L) | (138.00–140.00), 139.00 * | (137.50–140.00), 139.00 * | 0.20 |
| K (mmol/L) | (4.20–4.60), 4.30 * | (4.10–4.55), 4.30 * | 0.74 |
| Parameter | Patients with Symptoms n = 44 | Patients without Symptoms n = 102 | p |
|---|---|---|---|
| Echocardiography | |||
| LVID d (mm) | (45.00–53.00), 48.00 * | (43.00–53.00), 46.00 * | 0.16 |
| IVS d (mm) | (9.00–11.00), 10.00 * | (9.00–11.00), 9.00 * | 0.76 |
| LVPW d (mm) | (8.00–10.00), 9.00 * | (8.00–10.00), 9.00 * | 0.75 |
| LA (mm) | (34.00–42.00), 37.00 * | (32.00–39.00), 35.00 * | 0.04 |
| LAV (mL) | (47.00–81.00), 63.00 * | (41.50–73.00), 53.50 * | 0.23 |
| LAVi (mL/m2) | (26.55–40.98), 33.30 * | (23.00–38.10), 28.65 * | 0.10 |
| RA (cm2) | (13.50–18.50), 16.10 * | (13.00–20.00), 16.15 * | 0.86 |
| RVOT d (mm) | 31.45 (±4.38) | 30.57 (±4.87) | 0.30 |
| AB (mm) | (30.00–36.00), 32 * | (30.00–37.00), 33.00 * | 0.97 |
| AA (mm) | (29.00–36.00), 32.00 * | (28.00–36.00), 31.00 * | 0.56 |
| MPA (mm) | (18.00–21.00), 19.50 * | (18.00–21.00), 19.00 * | 0.78 |
| IVC (mm) | (4.50–9.00), 6.50 * | (4.00–10.00), 6.00 * | 0.79 |
| LVMI (g/m2) | (71.00–98.00), 83.00 * | (61.00–98.00), 74.00 * | 0.04 |
| LVEF (%) | (56.00–65.00), 62.00 * | (59.00–67.00), 62.00 * | 0.37 |
| EDV (cm3) | (71.00–103.00), 89.00 * | (75.00–105.00), 89.50 * | 0.88 |
| ESV (cm3) | (25.00–42.00), 34.00 * | (25.00–44.00), 33.00 * | 0.79 |
| TAPSE (mm) | 23.31 (±3.83) | 22.83 (±3.98) | 0.50 |
| TDE S’ (cm/s) | (12.00–16.00), 14.00 * | (12.00–15.00), 13 * | 0.10 |
| GLPS (%) | 19.68 (±1.91) | 19.90 (±1.96) | 0.62 |
| E (cm/s) | (63.00–85.00), 72.00 * | (60.00–90.00), 79.00 * | 0.49 |
| A (cm/s) | (60.00–83.00), 69.00 * | (51.00–74.00), 64.00 * | 0.01 |
| E/A | (0.80–1.22), 1.05 * | (0.95–1.67), 1.31 * | 0.01 |
| E/E’ | (6.00–8.95), 7.35 * | (5.50–7.10), 6.05 * | 0.01 |
| Dec (ms) | (167.00–245.00), 205.00 * | (175.00–239.00), 194.00 * | 0.79 |
| Ats (ms) | (114.00–145.00), 133.00 * | (118.00–145.00), 133 * | 0.68 |
| Parameter | Patients with Symptoms n = 44 | Patients without Symptoms n = 102 | p |
|---|---|---|---|
| Spiroergometry | |||
| Exercise time (s) | (384.00–662.00), 512.50 * | (412.00–719.00), 559.00 * | 0.38 |
| Level of effort (Wat) | (100.00–150.00), 125.00 * | (100.00–171.00), 125.00 * | 0.59 |
| HR max | 146.63 (±20.46) | 132.87 (±33.61) | 0.006 |
| Peripheral SBP max (mmHg) | (140.00–190.00), 160.00 * | (140.00–195.00), 160.00 * | 0.38 |
| Peripheral DBP max (mmHg) | (70.00–90.00), 80.00 * | (75.00–90.00), 80 * | 0.86 |
| FEV1 (L) | (2.55–3.54), 2.90 * | (2.79–3.71), 3.25 * | 0.04 |
| FVC (L) | 3.65 (±0.89) | 4.32 (±1.02) | <0.0001 |
| FVC (%) | 106.45 (±17.83) | 107.00 (±15.27) | 0.88 |
| FEV1/FVC | (77.00–88.00), 83.00 * | (74.00–85.00), 80.00 * | 0.051 |
| FEV1/FVC (%) | (99.00–112.00), 106.50 * | (90.00–105.00), 100.00 * | 0.0002 |
| FEF 25–75 (L/s) | 2.79 (±1.27) | 3.17 (±0.98) | 0.14 |
| RER | (1.01–1.11), 1.08 * | (1.05–1.12), 1.10 * | 0.04 |
| VO2max (mL/min/kg) | (16.00–25.00), 21.00 * | (19.00–29.00), 23.00 * | 0.04 |
| VO2AT (mL/min/kg) | (11.00–17.00), 14.00 * | (13.00–20.00), 15.50 * | 0.07 |
| Peak VO2max (L) | (1.29–1.90), 1.58 * | (1.38–2.23), 1.77 * | 0.07 |
| VE/VCO2 slope | (26.10–33.90), 29.70 * | (25.40–32.00), 28.05 * | 0.26 |
| Parameter | Patients with Symptoms n = 44 | Patients without Symptoms n = 102 | p |
|---|---|---|---|
| Body mass analysis | |||
| Fat (%) | 30.00 (±6.40) | 30.21 (±7.69) | 0.89 |
| Fat (kg) | (17.40–29.10), 23.50 * | (19.50–33.95), 24.70 * | 0.44 |
| FFM (kg) | (47.40–60.40), 53.60 * | (47.50–65.50), 56.65 * | 0.29 |
| TBW (kg) | (33.85–44.65), 39.15 * | (34.30–46.40), 41.00 * | 0.49 |
| TBW (%) | 51.00 (±5.10) | 50.06 (±6.81) | 0.46 |
| ECW (kg) | (15.15–19.45), 17.20 * | (15.40–19.55), 18.15 * | 0.52 |
| ICW (kg) | (19.05–25.50), 22.00 * | (19.30–27.30), 22.45 * | 0.44 |
| ECW/TBW × 100% | 43.58 (±2.67) | 43.25 (±3.65) | 0.62 |
| Metabolic age | 53.81 (±15.24) | 45.68 (±15.48) | 0.02 |
| BMR (kcal) | (1279.00–1701.00), 1493.00 * | (1395.50–1888.50), 1561.50 * | 0.08 |
| Parameter | Patients with Symptoms n = 44 | Patients without Symptoms n = 102 | p |
|---|---|---|---|
| A (cm/s) | (60.00–83.00), 69.00 * | (58–78), 67 * | 0.04 |
| FVC (L) | (3.08–4.27), 3.53 * | (3.80–4.30), 4.26 * | 0.0001 |
| FEV1 (L) | (2.55–3.54), 2.90 * | (2.91–3.53), 3.11 * | 0.045 |
| FEV1/FVC (%) | (99.00–112.00), 106.50 * | (95.00–102.00), 96.00 * | <0.0001 |
| GFR (mL/min/1.73 m2) | (76.10–98.80), 88.25 * | (79.88–109.80), 93.20 * | 0.04 |
| Variable | OR | 95% CI for OR | p | |
|---|---|---|---|---|
| Lower Limit | Upper Limit | |||
| FEV1/FVC% > 102% | 6.27 | 2.64 | 14.86 | <0.001 |
Disclaimer/Publisher’s Note: The statements, opinions and data contained in all publications are solely those of the individual author(s) and contributor(s) and not of MDPI and/or the editor(s). MDPI and/or the editor(s) disclaim responsibility for any injury to people or property resulting from any ideas, methods, instructions or products referred to in the content. |
© 2023 by the authors. Licensee MDPI, Basel, Switzerland. This article is an open access article distributed under the terms and conditions of the Creative Commons Attribution (CC BY) license (https://creativecommons.org/licenses/by/4.0/).
Share and Cite
Gryglewska-Wawrzak, K.; Sakowicz, A.; Banach, M.; Bytyçi, I.; Bielecka-Dabrowa, A. Diagnostic Usefulness of Spiroergometry and Risk Factors of Long COVID in Patients with Normal Left Ventricular Ejection Fraction. J. Clin. Med. 2023, 12, 4160. https://doi.org/10.3390/jcm12124160
Gryglewska-Wawrzak K, Sakowicz A, Banach M, Bytyçi I, Bielecka-Dabrowa A. Diagnostic Usefulness of Spiroergometry and Risk Factors of Long COVID in Patients with Normal Left Ventricular Ejection Fraction. Journal of Clinical Medicine. 2023; 12(12):4160. https://doi.org/10.3390/jcm12124160
Chicago/Turabian StyleGryglewska-Wawrzak, Katarzyna, Agata Sakowicz, Maciej Banach, Ibadete Bytyçi, and Agata Bielecka-Dabrowa. 2023. "Diagnostic Usefulness of Spiroergometry and Risk Factors of Long COVID in Patients with Normal Left Ventricular Ejection Fraction" Journal of Clinical Medicine 12, no. 12: 4160. https://doi.org/10.3390/jcm12124160
APA StyleGryglewska-Wawrzak, K., Sakowicz, A., Banach, M., Bytyçi, I., & Bielecka-Dabrowa, A. (2023). Diagnostic Usefulness of Spiroergometry and Risk Factors of Long COVID in Patients with Normal Left Ventricular Ejection Fraction. Journal of Clinical Medicine, 12(12), 4160. https://doi.org/10.3390/jcm12124160